


Introduction
Bornite (Cu5FeS4) is a common component of copper ores and is often associated with digenite (Cu9S5), minerals of the chalcocite group (Cu2–xS; x = 0–0.25) and chalcopyrite (CuFeS2). Although digenite might be considered in the context of a solid solution with either bornite or chalcocite phases in the system Cu–Fe–S or Cu–S, the present work focuses on the bornite–digenite solid solution (Bn–Dgss). Natural digenite commonly contains small amounts of Fe (e.g. Morimoto and Gyobu, Reference Morimoto and Gyobu1971). Bornite varies in abundance from being an accessory sulfide to the dominant ore mineral and displays textures ranging from lamellar to symplectitic (e.g. Ramdohr, Reference Ramdohr1969; Hatert, Reference Hatert2005; Cook et al., Reference Cook, Ciobanu, Danyushevsky and Gilbert2011; Sharma et al., Reference Sharma, Sahoo, Mahanta, Venkatesh, Babu and John2020; Brodbeck et al., Reference Brodbeck, McClenaghan, Kamber and Redmond2022).
Prior studies emphasise that both bornite and digenite (see below) have polymorphs, and do not refer, specifically, to polytypes. Polytypism is considered a special case of polymorphism whereby two-dimensional translations within layers are preserved, while variation in lattice spacings normal to layers define distinct stacking sequences (e.g. Guiner et al., Reference Guinier, Bokij, Boll-Dornberger, Cowley, Ďurovič, Jagodzinski, Krishna, de Wolff, Zyyagin, Cox, Goodman, Hahn, Kuchitsu and Abrahams1984). Furthermore, the issue of polymorphism versus polysomatism (Hatert et al., Reference Hatert, Mills, Pasero, Miyawaki and Bosi2023) may also warrant further investigation in future studies of Cu-Fe-sulfides. Such topics are beyond the purpose of the present work.
Polymorphs of bornite (Bn) and digenite (Dg) are related to one another via crystal structural modularity with variable arrangements of cations within relatively stable sulfur frameworks. Most common are superstructures of both bornite and digenite derived by metal vacancies of various arrangement schemes leading to larger unit cells expressed as n × a, where a = ∼5.5 Å and n is an integer (e.g. Pierce and Buseck, Reference Pierce and Buseck1978). Although n ranges between 2 and 6, non-integer n values have also been speculated based upon electron diffraction (ED) patterns.
The nine common species currently defined by X-ray diffraction studies addressing crystal structures are: Bn1a (Tunell and Adams, Reference Tunell and Adams1949); Bn2a (Kanazawa et al., Reference Kanazawa, Koto and Morimoto1978); Bn2a4a (Koto and Morimoto, Reference Koto and Morimoto1975); Dg1a (Morimoto and Kullerud, Reference Morimoto and Kullerud1963; Yamamoto and Kashida, Reference Yamamoto and Kashida1991; Will et al., Reference Will, Hinze and Abdelrahman2002); rhombohedral Dg5a-R (Cu9S5; Donnay et al., Reference Donnay, Donnay and Kullerud1958); anilite (Cu7S4; Koto and Morimoto, Reference Koto and Morimoto1970); chalcocite, Cu2S (both monoclinic and hexagonal; Evans, Reference Evans1979; Will et al., Reference Will, Hinze and Abdelrahman2002); and djurleite (Cu1.94S; Evans, Reference Evans1979).
Bright field transmission electron microscopy (BF TEM) has been used to address the complexity of fine-scale intergrowths among Cu-(Fe)-sulfides. Particular emphasis has been placed on superstructuring that results from the ordering of metal vacancies and changes in the cation/sulfur ratios (e.g. Pierce and Buseck, Reference Pierce and Buseck1978; Conde et al., Reference Conde, Manolikas, Van Dyck, Delavignette, Van Landuyt and Amelinckx1978; van Dyck et al., Reference Van Dyck, Conde-Amiano and Amelinckx1980; Echigoya and Edington, Reference Echigoya and Edington1982; Pósfai and Buseck, Reference Pósfai and Buseck1994; Ding et al., Reference Ding, Veblen and Prewitt2005a, Reference Ding, Veblen and Prewitt2005b). In-situ electron beam experiments were used to investigate thermal behaviour controlling phase transformation among Cu-Fe-sulfides (Putnis and Grace, Reference Putnis and Grace1976; Putnis, Reference Putnis1977). Several other Bn2a superstructures have been constrained with the aid of ab initio models derived from Fe/Cu ordering schemes (Ding et al., Reference Ding, Veblen and Prewitt2005a). The crystal structure of Bn4a was determined from TEM imaging and crystal structure simulations (Ding et al., Reference Ding, Veblen and Prewitt2005b).
Morimoto and Kullerud (Reference Morimoto and Kullerud1966) assessed the system bornite–digenite at 350°C. The phase diagram topology features a broad consolute solvus point defined at a mol. Bn:Dg ratio of 70:30 and ∼340°C. The authors specified three intervals of phase associations from high temperature forms (325–205°C), to high temperature Dg + low temperature Bn (205–120°C) and low temperature forms of digenite and bornite (<120°C).
Following this pioneering work, several experimental studies, in combination with in situ high-resolution neutron powder diffraction (HRPD) and differential scanning calorimetry (DSC), have addressed the behaviour of bornite–digenite series in terms of exsolution, phase transitions, controls of composition on the phase transition temperatures and redefinition of phase diagram (Grguric and Putnis, Reference Grguric and Putnis1998, Reference Grguric and Putnis1999; Grguric et al., Reference Grguric, Putnis and Harrison1998, Reference Grguric, Harrison and Putnis2000). Six synthetic samples of different compositions along the bornite–digenite join were water quenched from above 600°C and interpreted from HRPD spectra to be mixtures of bornite and a low 5a digenite polymorph (Grguric and Putnis, Reference Grguric and Putnis1999). Of relevance here is the optically visible basket-weave microtexture between bornite and digenite, obtained by annealing a sample of 90 mol.% bornite (Bn90). This texture is explained as the result of coalescence of sub-microscopic domains initially formed during quenching. The following intergrowths were identified by Grguric and Putnis (Reference Grguric and Putnis1999) in room temperature products: Bn2a4a in Bn100; Bn2a4a and Dg1a in Bn90–Bn30; and Dg1a in Dg100. The paucity of natural occurrences of intermediate compositions was thus interpreted as the result of “rapid kinetics of exsolution at geologically low temperatures”.
In contrast to the quenched samples above, experiments using different annealing-cooling rates have shown the presence of four distinct assemblages for Bn90 based on HRPD: 1a solid solution (ss; unspecified phase) at 300–350°C; Bn2a + 1a ss at 190–225°C; Bn2a4a + 1a ss at 125–185°C; and Bn2a4a + Dg5a at 35–80°C (Grguric et al., Reference Grguric, Harrison and Putnis2000). In their study, the authors used DSC scans of samples with 5 mol.% intervals along the bornite–digenite (Cu5FeS4–Cu9S5) join and within a 50–300°C temperature interval. Additionally, a HRPD study of the Bn90 assisted revision of the phase diagram for bornite–digenite solid solution. Based on this, the consolute point given by Morimoto and Kullerud (Reference Morimoto and Kullerud1966) was contested by Grguric et al. (Reference Grguric, Harrison and Putnis2000) and redefined at X = Cu5FeS4 and T = 265°C.
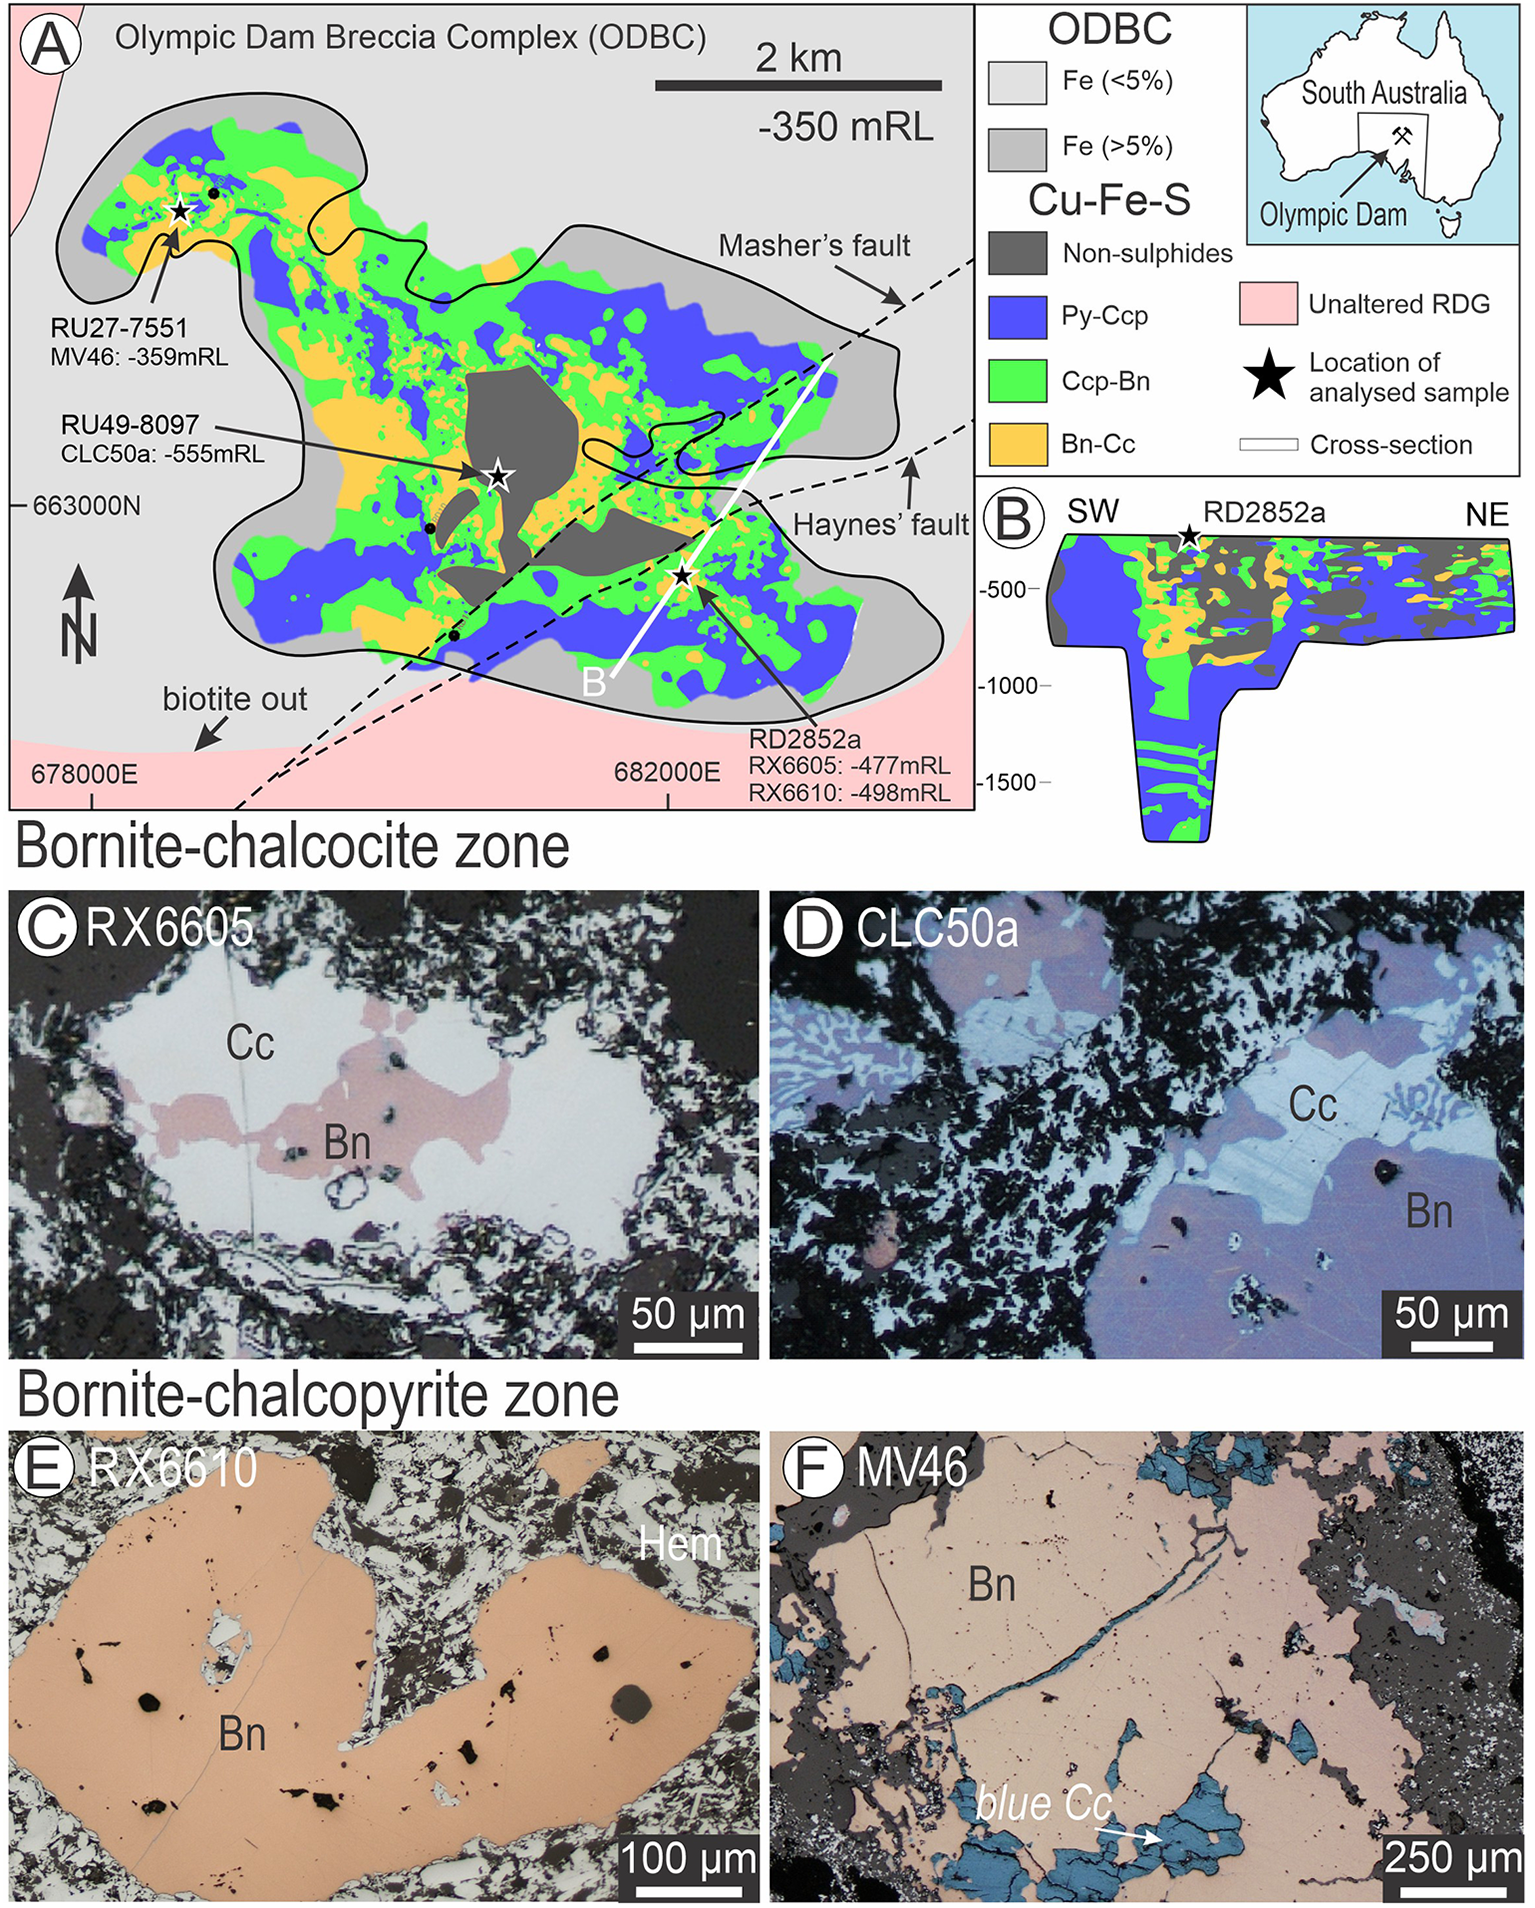
Symplectites between bornite and chalcocite are among the most intriguing ore textures. Although widespread in ores of different genetic types, they are typical of the giant iron-oxide copper gold (IOCG) deposit at Olympic Dam (Fig. 1A) and related systems of the Olympic Cu-Au Province, South Australia (e.g. Ciobanu et al., Reference Ciobanu, Cook, Utsunomiya, Pring and Green2011, Reference Ciobanu, Cook and Ehrig2017; Ehrig et al., Reference Ehrig, McPhie, Kamenetsky, Hedenquist, Harris and Camus2012; Owen et al., Reference Owen, Ciobanu, Cook, Slattery and Basak2018; King et al., Reference King, Cook, Ciobanu, Ehrig, Gilbert, Wade and Campo Rodriguez2025a). Ciobanu et al. (Reference Ciobanu, Cook and Ehrig2017) used the phase diagram of Morimoto and Kullerud (Reference Morimoto and Kullerud1966) to interpret symplectitic intergrowths between bornite and chalcocite in Olympic Dam ores. The study shows compositional differences between two distinct associations of bornite in the deposit, whereby excess (Cu+Fe)/S relative to stoichiometric Cu5FeS4 and deficit Cu/Fe ratios define bornite–chalcocite and bornite–chalcopyrite associations, respectively.
(A) Map of the Olympic Dam deposit (location in the inset to the right) showing zoning of Cu-Fe-sulfides: pyrite–chalcopyrite (Py-Ccp), chalcopyrite–bornite (Ccp-Bn) and bornite–chalcocite (Bn-Cc) within the Olympic Dam Breccia Complex (after Ehrig et al., Reference Ehrig, McPhie, Kamenetsky, Hedenquist, Harris and Camus2012). (B) Crosssection (marked by line in A), showing the vertical sulfide zonation in the deepest part of the deposit. (C–F) Reflected light images of the four samples showing aspects of the Cu-(Fe)-sulfides within hematite (Hem) breccias from ore zones as labelled. Note: bornite forming symplectites of variable size/morphology with chalcocite in C and D. Apparently homogeneous bornite is typical of grains from the Bn-Ccp zone (E, F).

To identify discrete bornite and chalcocite polymorphs in Olympic Dam ore, Ciobanu et al. (Reference Ciobanu, Cook and Ehrig2017) used BF TEM imaging on thinned foils prepared using dual focused ion beam (FIB) scanning electron microscopy (SEM). They concluded that the assemblages formed via exsolution from high-temperature solid solutions in the system Cu–Fe–S, inferring that primary hypogene ore precipitation is preserved in the deposit, thus accounting for the observed vertical zonation pattern (Ehrig et al., Reference Ehrig, McPhie, Kamenetsky, Hedenquist, Harris and Camus2012; Fig. 1B). Zonation is preserved even though replacement relationships among Cu-(Fe)-sulfides are also widespread, as documented by electron back-scatter diffraction study (King et al., Reference King, Cook, Ciobanu, Ehrig, Campo Rodriguez, Gilbert and Basak2025b).
Intriguingly, a ‘basket-weave network’ was described from high-resolution TEM imaging of bornite that showed apparent micron-scale homogeneity (Ciobanu et al., Reference Ciobanu, Cook and Ehrig2017). The authors questioned whether this was an artefact produced during FIB milling or rather a genuine intergrowth between bornite and djurleite (the presence of the latter being suggested by electron diffractions).
High-angle annular dark field (HAADF) scanning TEM imaging is a relatively new technique capable of unlocking deep sub-ångstrom atomic resolution for phase characterisation when using contemporary aberration-corrected improved instruments (Van Tendeloo et al., Reference Van Tendeloo, Bals, Van, Verbeeck and Van Dyck2012 and references therein). The HAADF STEM technique is especially well suited to structures comprising heavy atoms and has the advantage over BF TEM imaging in visualising individual building modules from mineral series defined by crystal structural modularity, as shown for Pb-Bi sulfosalts (Ciobanu et al., Reference Ciobanu, Cook, Maunders, Wade and Ehrig2016). Although the basket-weave texture was also depicted by HAADF STEM imaging of bornite containing dense clausthalite (PbSe) inclusions (Owen et al., Reference Owen, Ciobanu, Cook, Slattery and Basak2018), the phase associations in such textures was not addressed.
This study employs HAADF STEM imaging and EDS analysis, combined with STEM simulations to better constrain the speciation and structures of phases forming the basket-weave textures in bornite, representative of the two associations in the Olympic Dam deposit. Refinement of phase relations in the system Cu–Fe–S and comparison between experiment and natural ores, as well as improved understanding of polymorph structures among Cu-(Fe)-sulfides, are valuable for at least two reasons. Firstly, a deeper appreciation of polymorph structures is relevant for understanding the mechanisms by which valuable minor metals are incorporated (King et al., Reference King, Cook, Ciobanu, Ehrig, Gilbert, Wade and Campo Rodriguez2025a, Reference King, Cook, Ciobanu, Ehrig, Campo Rodriguez, Gilbert and Basak2025b). Secondly, this knowledge is a key prerequisite for attempts to use density functional theory (DFT) and molecular dynamics to shed light on the atomic-scale distributions of critical and precious metals within copper ores.
Samples and analytical methods
Nanoscale characterisation was undertaken on four polished sections containing bornite–chalcocite (RX6605 and CLC50a) and bornite–chalcopyrite (RX6610 and MV46) assemblages. These were prepared from samples of drillcore containing mineralisation from across the Olympic Dam Breccia Complex, extending from the SE lobe of the deposit, through the ‘barren’ core to the NW lobe (Fig. 1A,B). These samples are representative of two of the three sulfide mineral zones at Olympic Dam: (1) shallower, bornite–chalcocite (Bn-Cc); and (2) deeper, bornite–chalcopyrite (Bn-Ccp). The samples originate from three drillholes at different depths and are representative of the μm-scale intergrowths previously reported from Cu-Fe-ore at Olympic Dam (Fig. 1C–E).
Bornite-bearing assemblages were characterised at the micron-scale using reflected light microscopy and back-scatter electron (BSE) imaging on a Hitachi SU1510 SEM instrument to select suitable areas for nanoscale study. Scanning transmission electron microscope (STEM) sample preparation was performed using a FEI-Helios nanoLab Dual Focused Ion Beam and SEM (FIB-SEM) to produce seven (<100 nm) foils in procedures outlined by Ciobanu et al. (Reference Ciobanu, Cook, Utsunomiya, Pring and Green2011). A gallium source was used for slicing and thinning.
Each foil was analysed employing HAADF STEM imaging and energy-dispersive X-ray spectrometry (EDS)-STEM mapping using an ultrahigh-resolution, probe-corrected FEI Titan Themis S/TEM operated at 200 kV and equipped with a double-tilt holder. This instrument has an X-FEG Schottky source and Super-X EDS geometry. The Super-X EDS detector provides geometrically symmetric EDS detection with an effective solid angle of 0.8 sr. Probe correction delivered sub-ångstrom spatial resolution, and an inner collection angle >50 mrad was used for HAADF imaging with a Fischione detector. A small spot size, either 7 or 9, was used for high-resolution imaging.
Velox software was utilised for image acquisition, including a drift-corrected frame integration package (DCFI), and EDS data acquisition and processing. Various filters (Radial Wiener, Gaussian blur, High pass and Average) were used to eliminate noise. Quantification of the collected EDS spectra was performed using Thermo-Scientific Velox software (v3.15), which utilises standard Cliff-Lorimer quantification and includes absorption correction optimised for both the Super-X detector geometry and the effect of sample holder shadowing for the double-tilt Super-X holder used. Quantification was performed using the Brown-Powell empirical ionisation cross-section model and uncertainty values reported incorporate an estimated 20% error in the k-factors.
All instruments are housed at Adelaide Microscopy, The University of Adelaide, Australia.
Indexing of diffraction patterns was conducted with WinWulff (JCrystalSoft) and publicly available data from the American Mineralogist Crystal Structure Database (http://rruff.geo.arizona.edu/AMS/amcsd.php). Crystal structure models were generated in CrystalMaker. Annular dark field (ADF) image simulations were performed using STEM for the xHREMTM (v5.3.2) software. Simulations for the empirical crystal models were obtained without thermal diffuse scattering (TDS) parameters (using the Mott formula with Doyle-Turner X-Ray scattering factor). Electron diffraction simulations were generated using the multislice method and dynamical structure factor calculation.
Results and modelling
The Bn-Cc samples (RX6605 and CLC50a) consist of characteristic bornite with a purple colour in reflected light that occurs with symplectites of chalcocite (Fig. 1C, D). The size and morphology of such symplectites vary widely within any given sample or location.
The Bn-Ccp samples (RX6610 – SE lobe and MV46 – NW lobe) consist of brown bornite (Fig. 1E, F), which comprises dense, sub-μm-scale lamellae of chalcopyrite. Although sample MV46 lacks such lamellae, it is considered part of the Bn-Ccp zone based on its position in the drillhole.
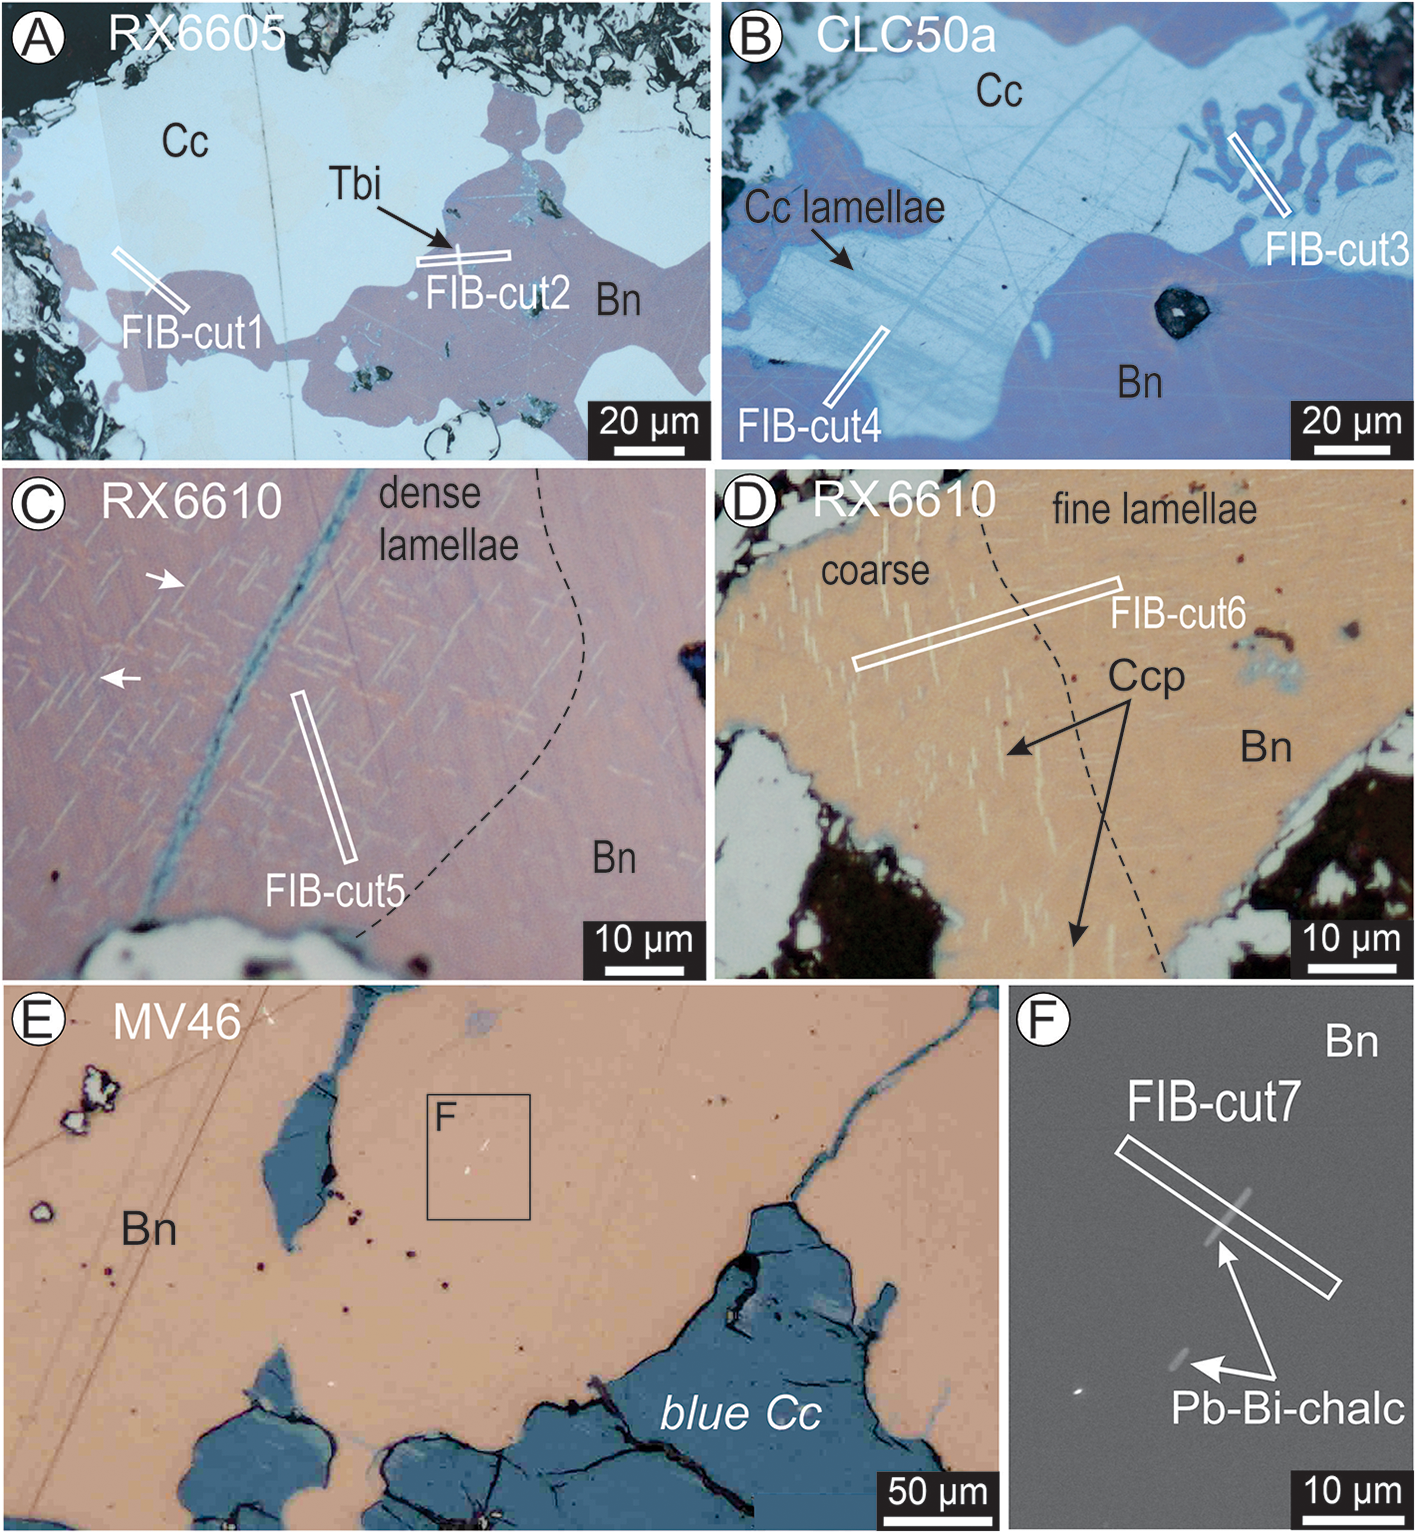
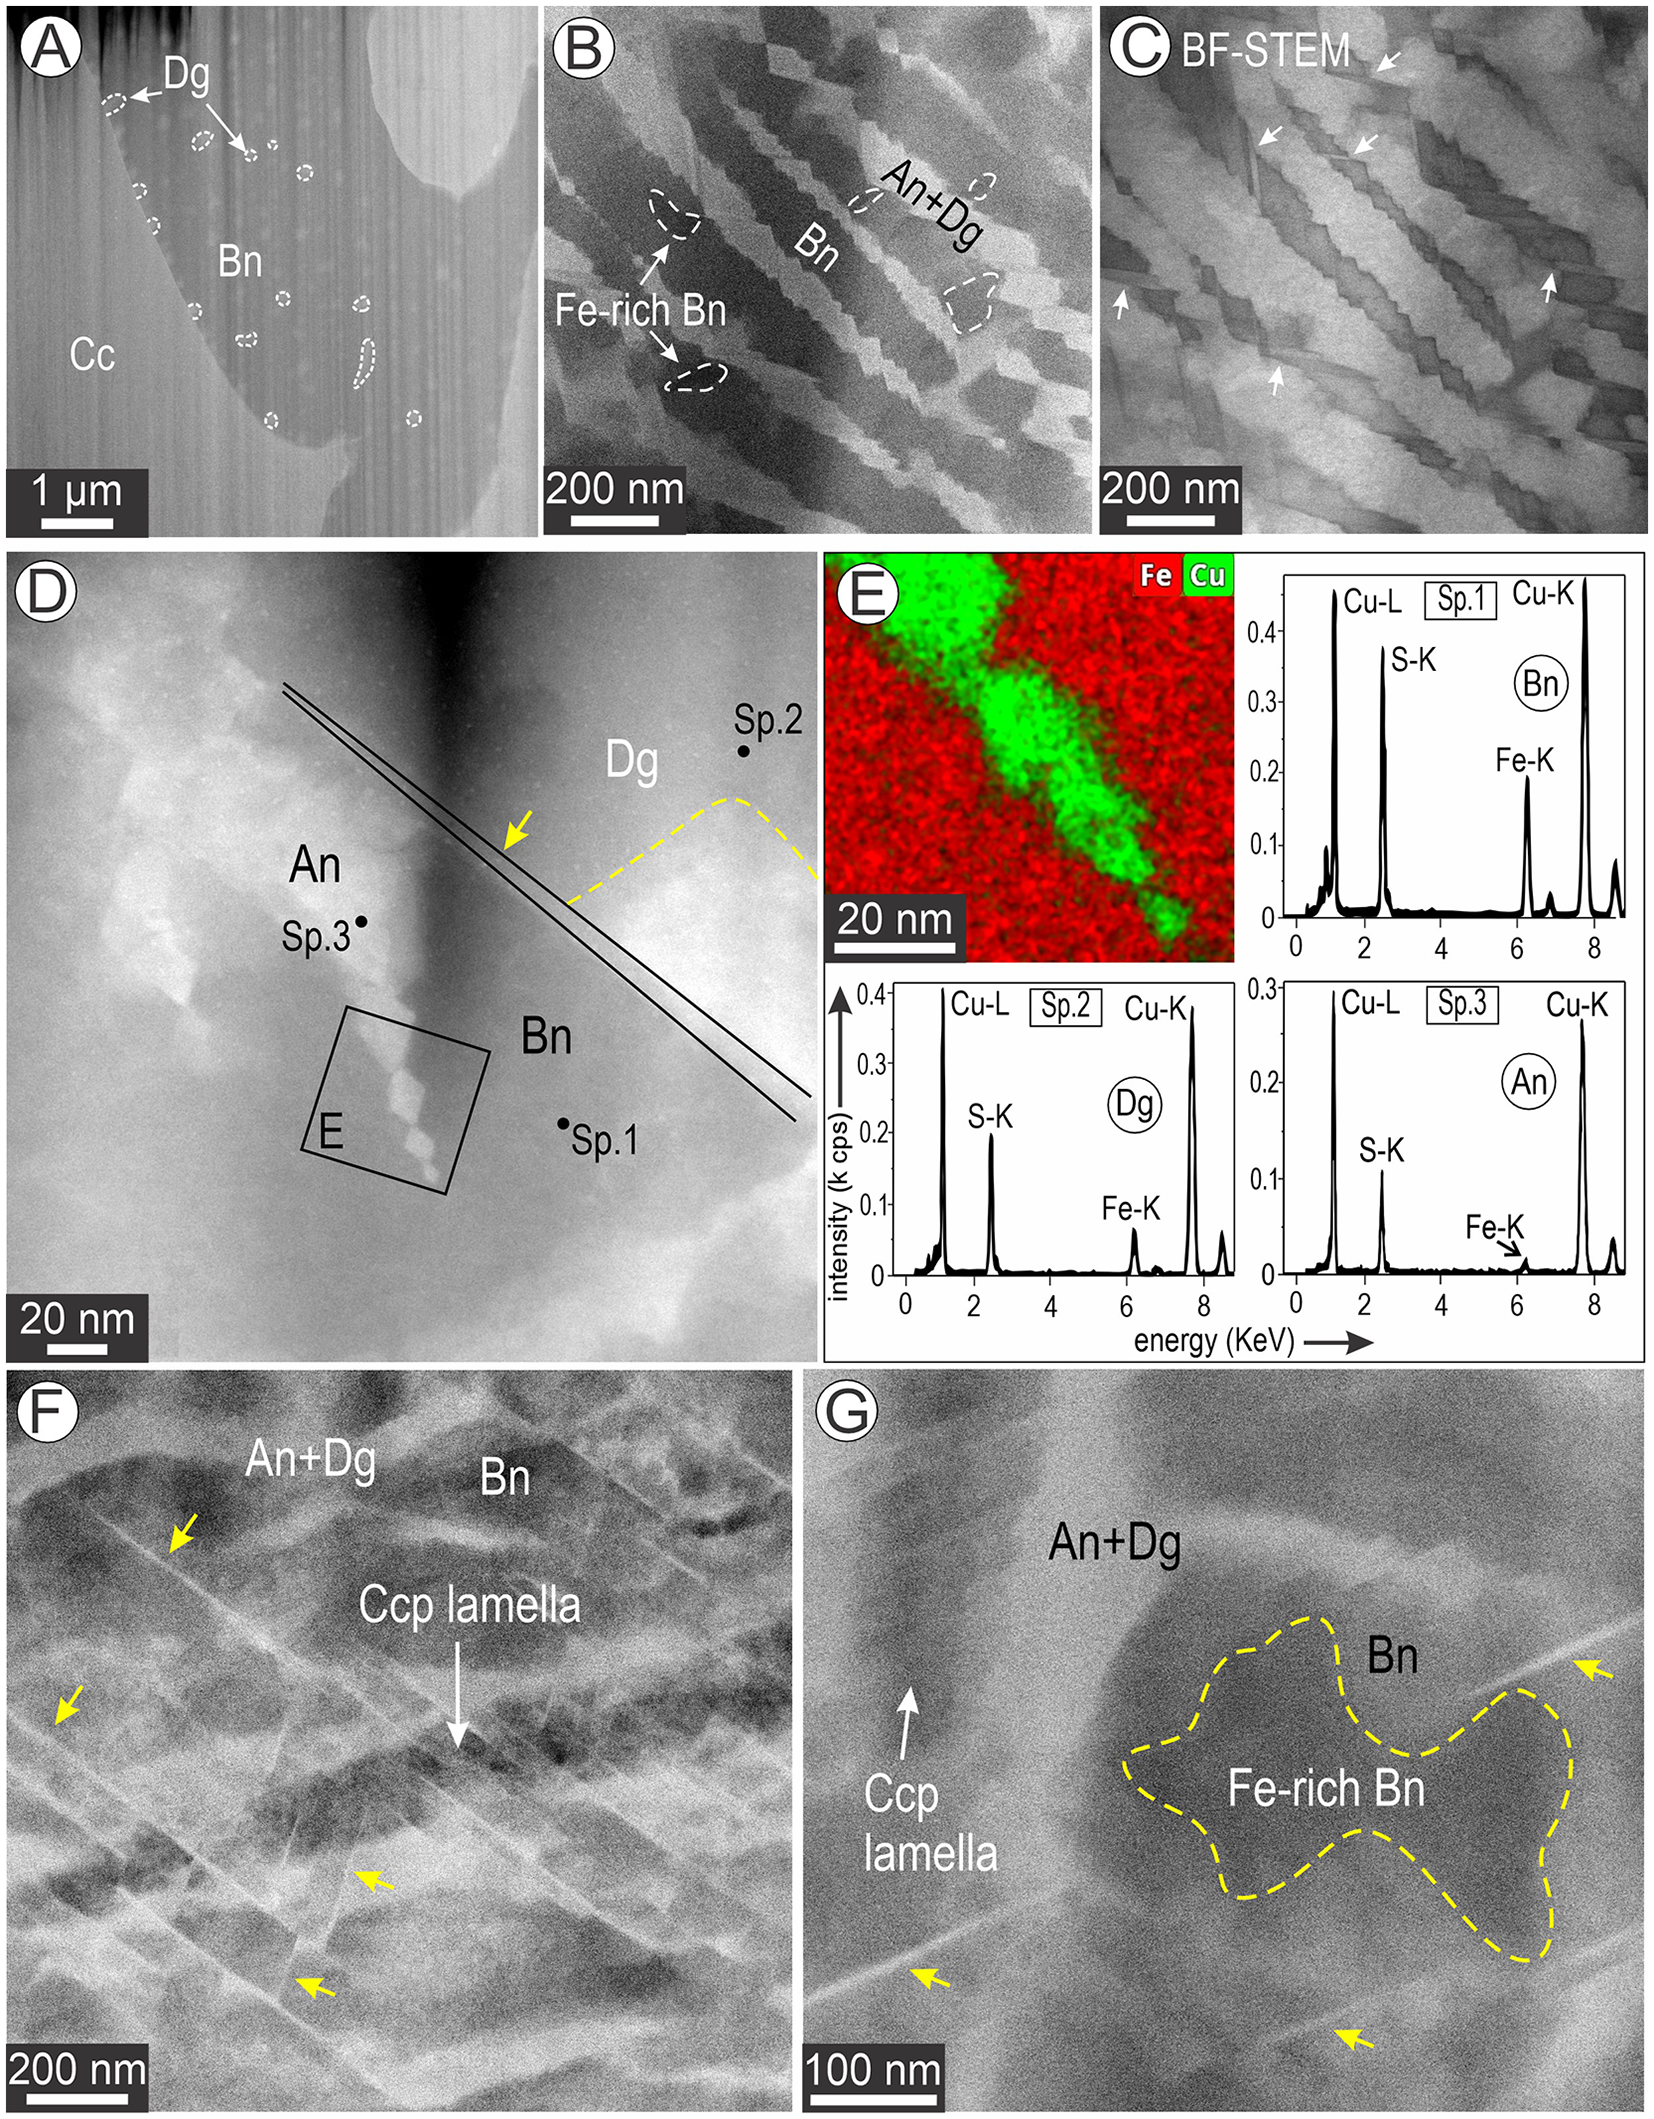
Relationships between Cu-Fe-sulfides and the location of FIB cuts from which STEM foils were prepared are illustrated in Fig. 2. In both types of bornite, inclusions of Bi-(Pb)-tellurides, each only a few μm wide, are found either within bornite or at bornite–chalcocite boundaries. Four foils were obtained from Bn-Cc symplectites that range in size from fine (a few μm) to coarse (hundreds of μm) (Fig. 2A, B). Chalcocite from such symplectites either displays a homogeneous grey-bluish colour or lamellar intergrowths with blue colouration (Fig. 2A, B). The two foils representing coarse Bn-Cc symplectites in the deeper sample (RX6605) were obtained across Bi-(Pb)-telluride Pb-Bi-chalcogenide lamellae enclosed within the symplectite (Fig. 2A). Two other foils representing the shallower Bn-Cc sample (CLC50a) were extracted from: (1) the finest symplectites; and (2) across the contact between bornite and lamellae of chalcocite (Fig. 2B).
Reflected light (A–E) and BSE (F) images showing petrographic aspects of areas sampled for nanoscale study. White rectangles represent the locations of FIB cuts from which slices were lifted and prepared as thin foils. (A, B) FIB cuts placed across Bn–Cc boundaries and within the bornite alone (FIB-cut2) targeted fine and coarse symplectites as well as (sulfo)telluride inclusions positioned at mutual contacts. (C–F) FIB cuts in apparently homogeneous bornite targeted fine lamellar networks in C and D or telluride inclusions in E. Detail of tellurides in F. The lamellar networks were identified as chalcopyrite (Ccp) only in the coarser lamellae domain from D (FIB-cut6), even though all these grains were collected from the Bn-Ccp ore zone. This shows the patchy distribution of the sulfide associations at the micron-scale throughout the ore zones defined based on assays. Fractures and secondary Cu-sulfides (blue chalcocite?) are present in bornite from C and E. Abbreviations: Pb-Bi-chalc – Bi-sulfotelluride from the aleksite series; Tbi – tellurobismuthite.

Bornite from the deeper Bn-Ccp zone (RX6610), just ∼21 m vertically below the Bn-Cc sample in the same drillhole (RD2852a), shows patches of colouration and lamellar intergrowths representative of both zone types (purple bornite with sub-μm-scale lamellar networks as well as brown bornite with chalcopyrite lamellae; Fig. 2C,D). In both cases, bornite displays domain heterogeneity with respect to size and density of included lamellae. The foil representing Bn-Ccp was extracted from across the contact between μm- to sub-μm-sized chalcopyrite lamellae within bornite (Fig. 2D).
The shallower sample from the Bn-Ccp zone (MV46) does not show μm-scale chalcopyrite inclusions but rather Bi-(Pb)-chalcogenide lamellae (Fig. 2E). The studied foil was obtained from across one of the coarser of these grains (1‒2 μm wide) (Fig. 2F). We note the presence of patchy areas with dark blue Cu-sulfides (Fig. 2E), which are distinct from the chalcocite forming the symplectites with bornite (Fig. 2A, B).
Nanoscale characterisation
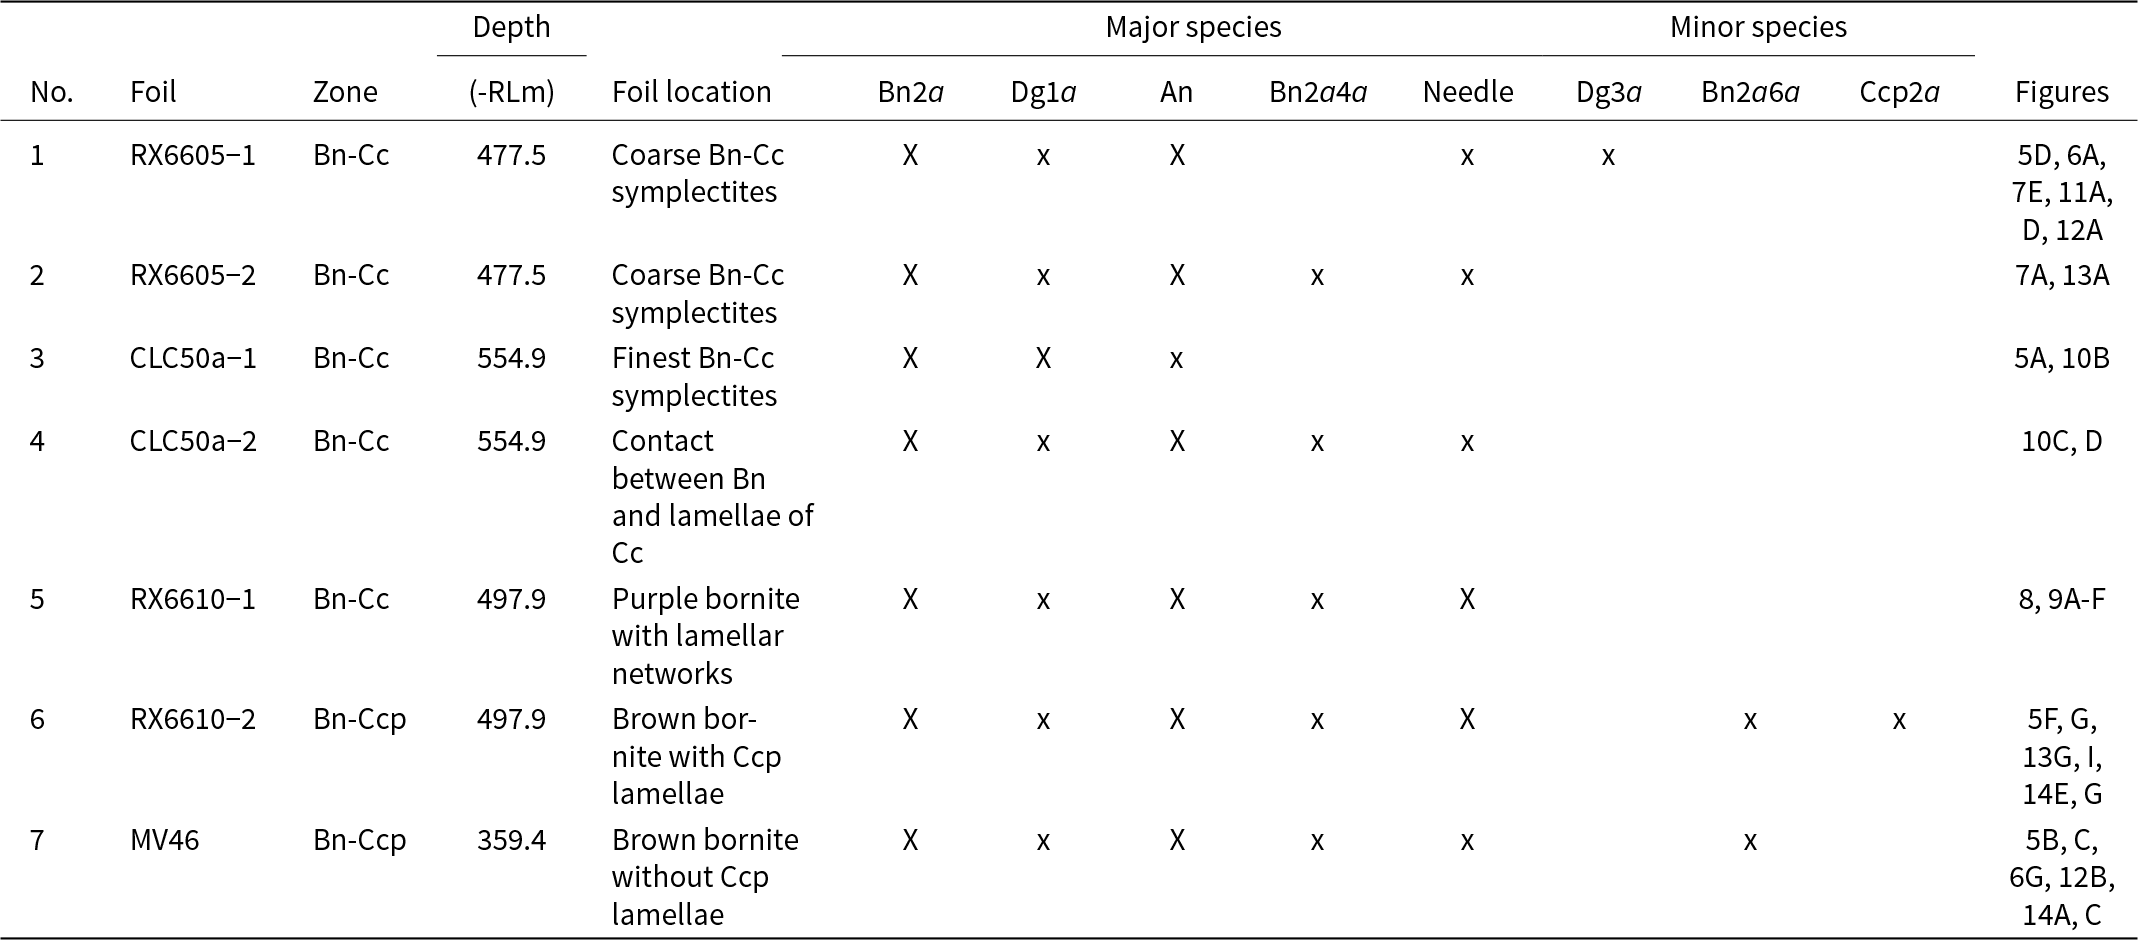
The seven foils are shown in Fig. S1 (Supplementary Material) and Table 1. A substructure made up of a fine two-phase mixture (each component some tens to a few hundreds of nm in size), recognisable by HAADF contrast as the aforementioned ‘basket-weave’ texture, is observed at the nanoscale throughout the bornite in all samples, including the foils from the Bn-Ccp zone. Only a few chalcopyrite lamellae are exposed within one of these foils (#6; Fig. S1). The basket-weave texture is rarely observed at the micron-scale (Fig. 2C). Curvilinear boundaries between bornite and chalcocite are observed in samples representing both the coarser and finer symplectites.
Details of STEM foils produced for nanoscale characterisation

Notes: The relative occurrence of the main species is indicated by: X (most abundant) and x (less abundant). Abbreviations: An ‒ anilite, Bn ‒ bornite, Cc ‒ chalcocite, Ccp ‒ chalcopyrite, Dg ‒ digenite.
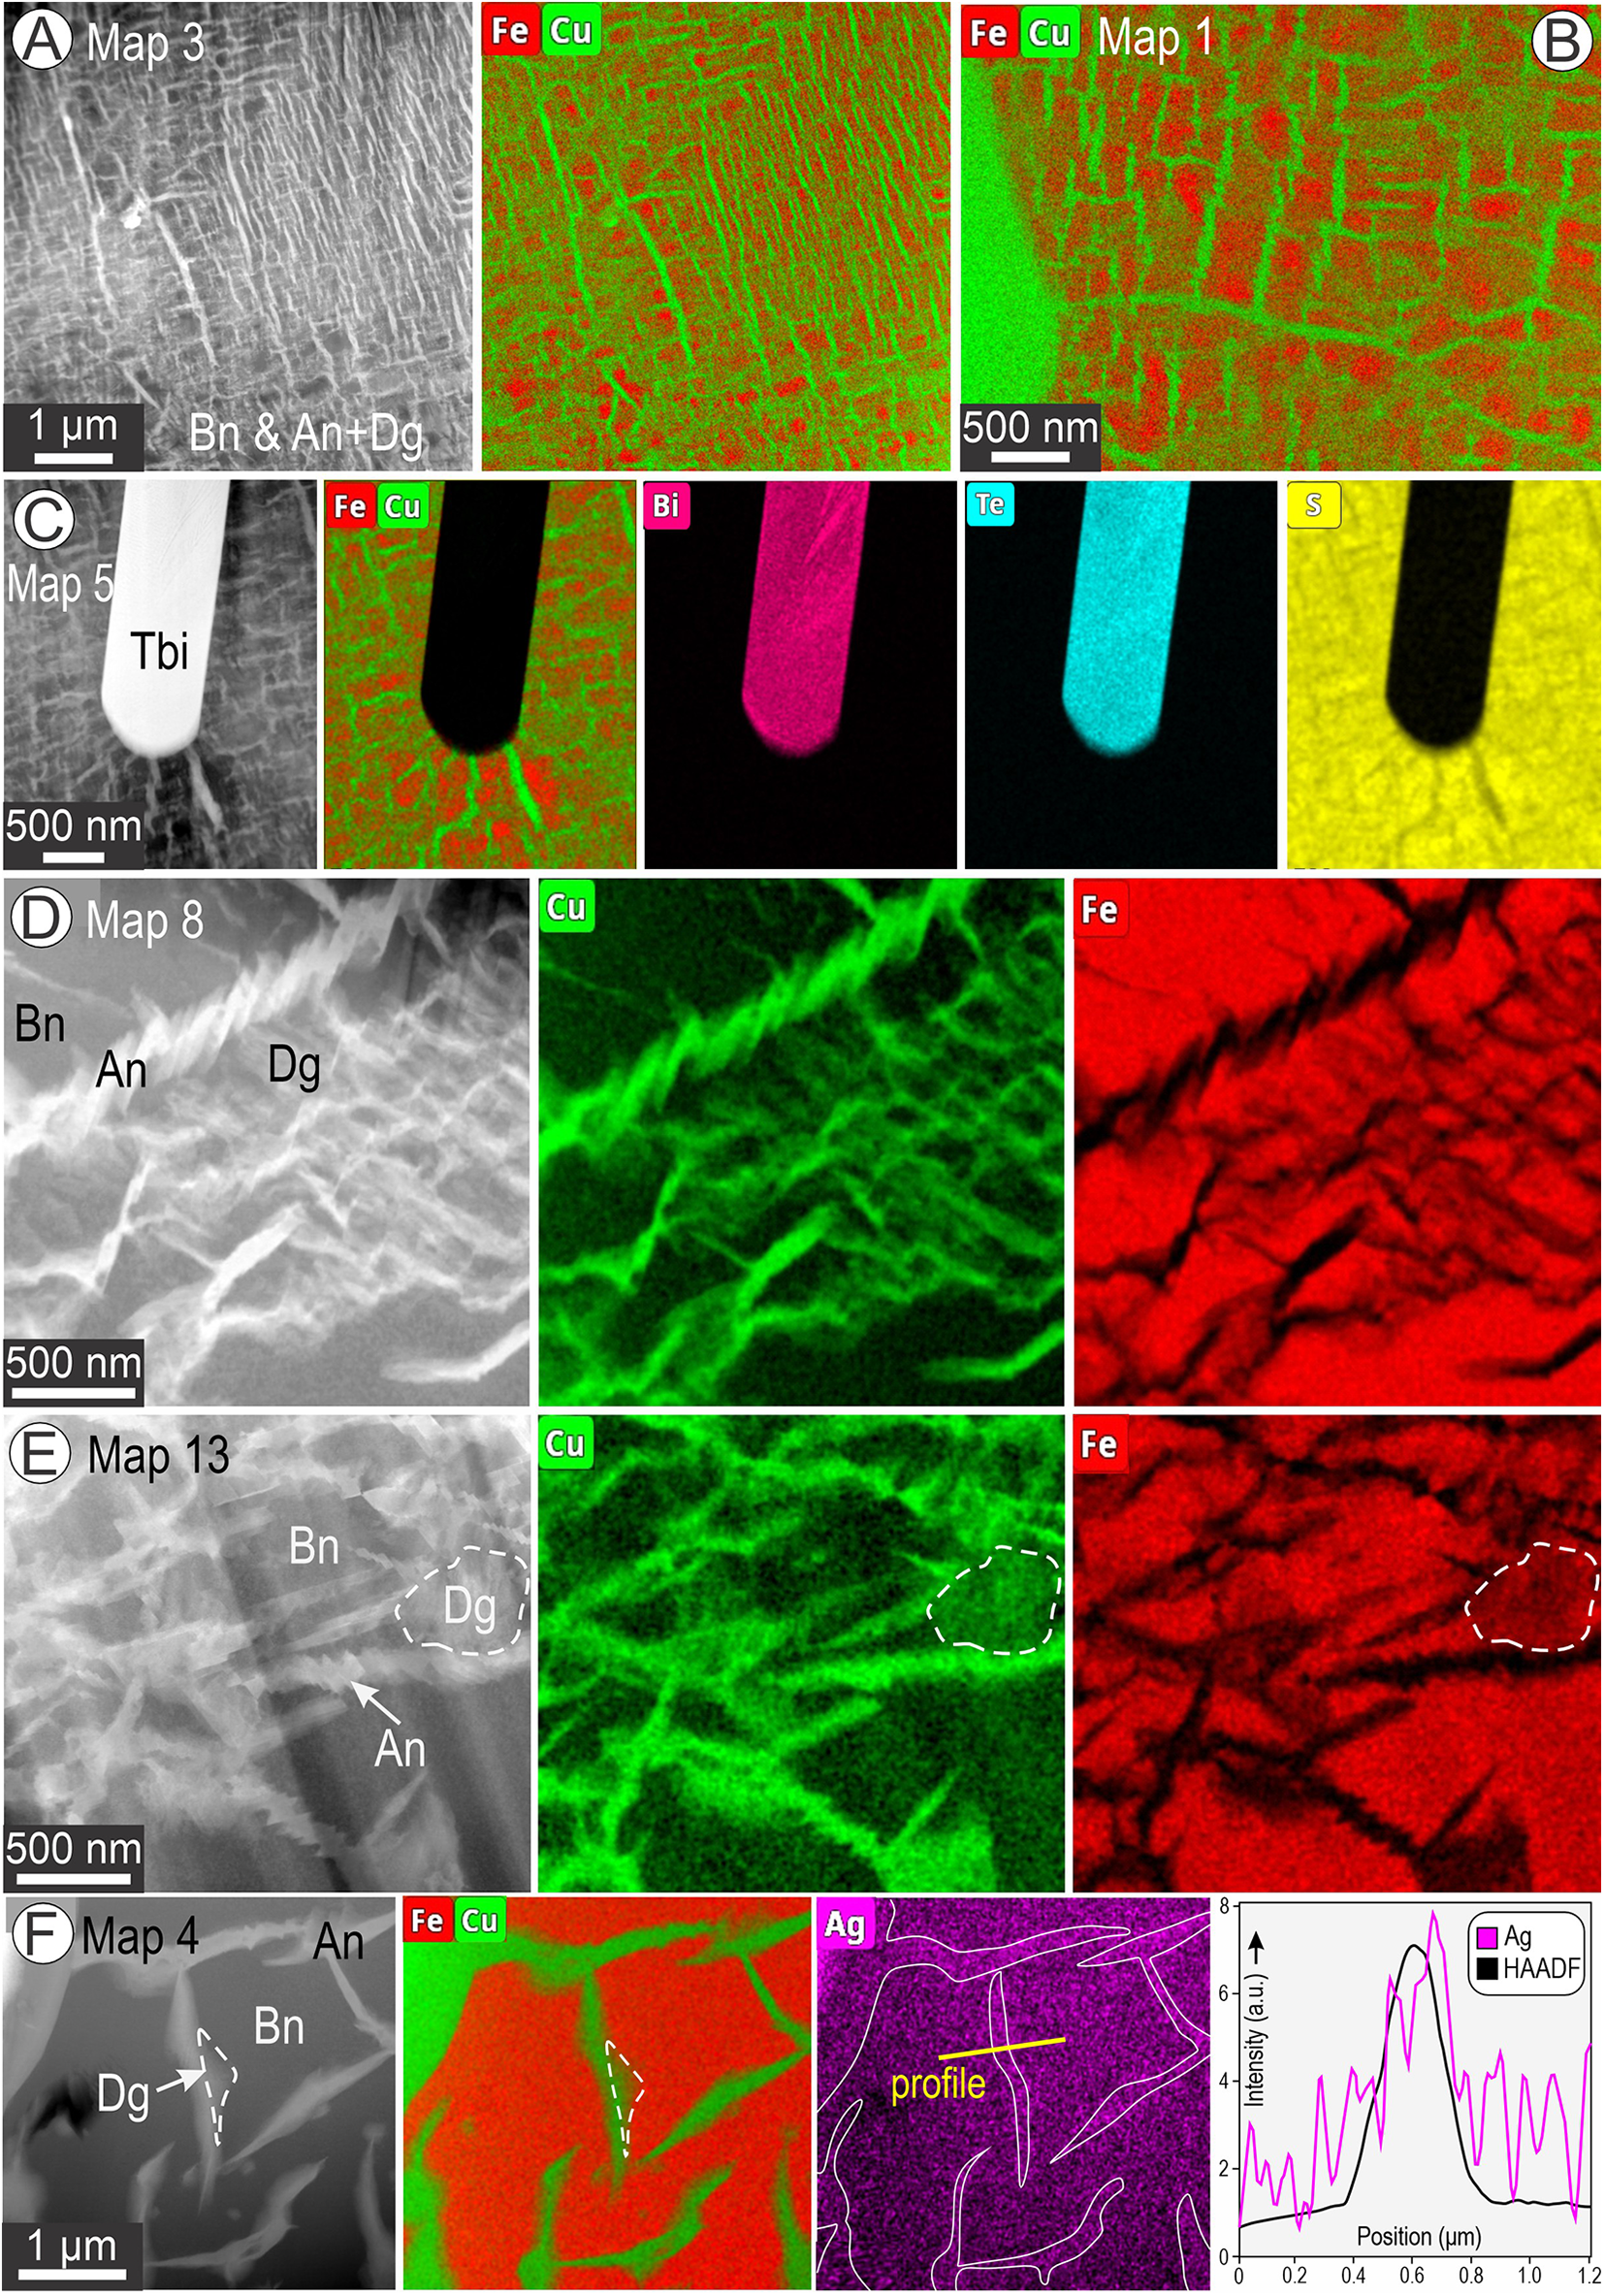
The basket-weave textures comprise two main components, bornite and anilite, with dark and bright contrast on HAADF STEM images, respectively. EDS STEM element-distribution maps of the basket-weave textures at various scales are shown in Figs 3 and 4. Compositions obtained from the maps for all species are listed in Supplementary Table S1 and plotted in Fig. S2.
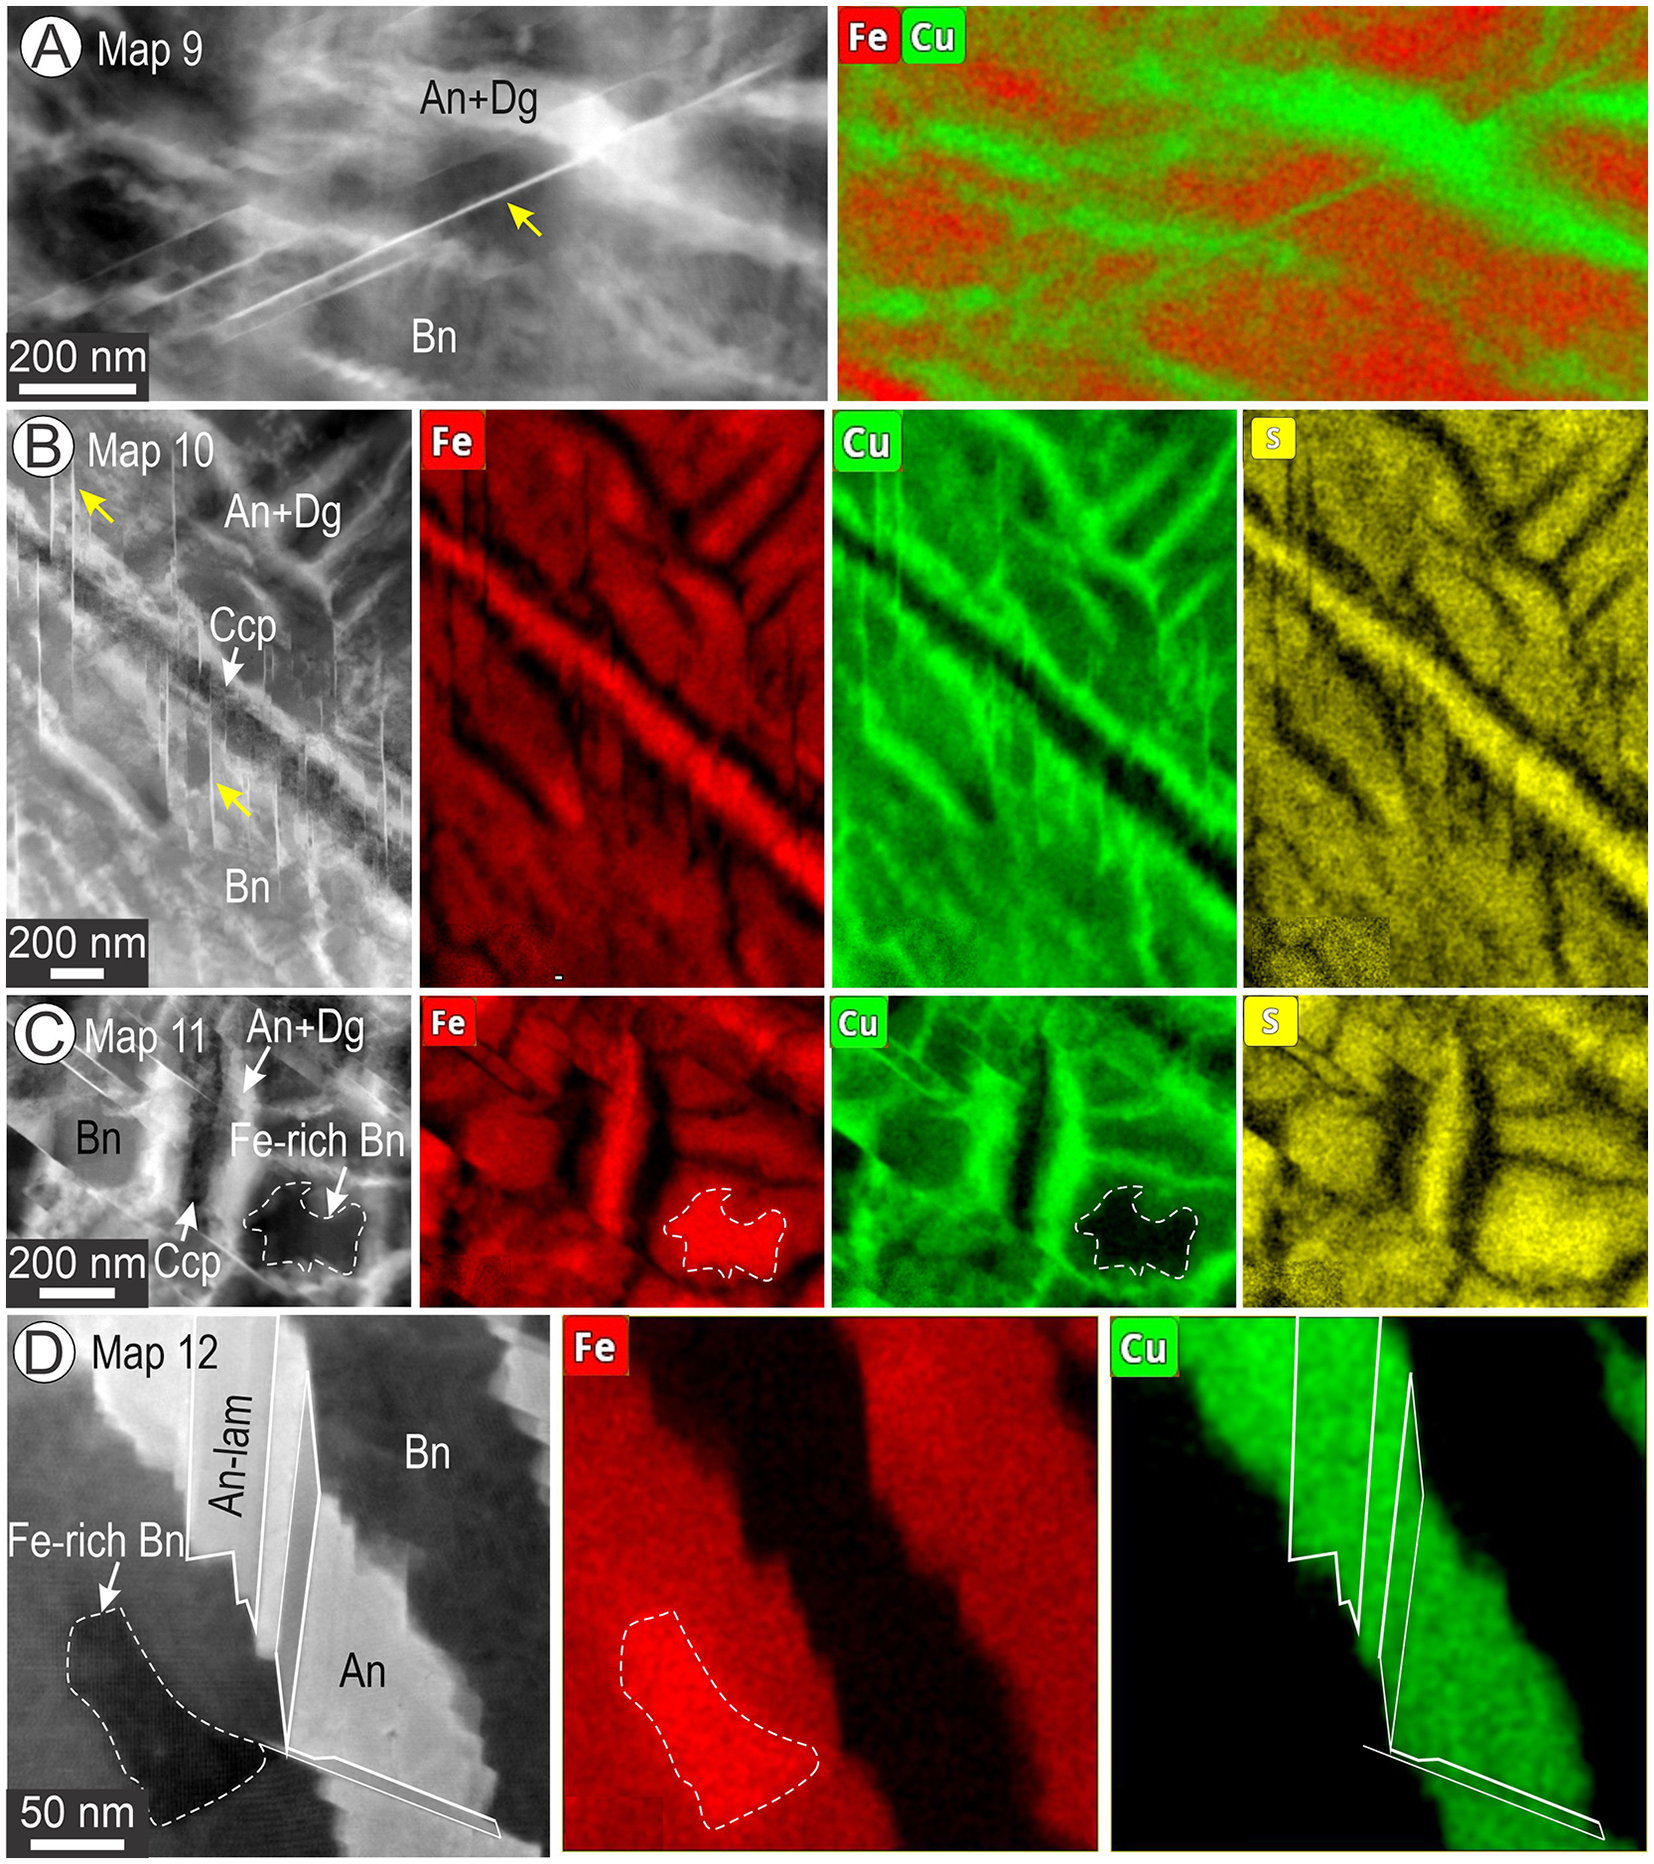
HAADF STEM images and corresponding EDS STEM maps of basket-weave textures. Numbers correspond to maps labelled in Fig. S1. (A, B) Dense networks of Cu-rich lamellae (anilite (An) + digenite (Dg) in bornite (Bn; Fe-rich host phase). (C) Tellurobismuthite (Tbi) inclusions surrounded by a radial network of Cu-rich lamellae. (D–F) Details of basket-weave textures showing variable Cu-compositions attributable to presence of both anilite and digenite. Note short lamellar arrays of anilite in (D). Profile across a single lamella of anilite/digenite shows enrichment in Ag in (F).

Higher-resolution EDS STEM maps (than Fig. 3) showing further details of basket-weave textures. (A, B) Copper-bearing needles (arrowed) crosscutting bornite (Bn) and anilite (An) + digenite (Dg) boundaries as well as a chalcopyrite lamellae (Ccp) in (B). The needles are attributed to the rhombohedral twin-structure of digenite 5a (Dg5a-R) of Donnay et al. (Reference Donnay, Donnay and Kullerud1958). (C–D) Fe-rich domains in bornite next to a chalcopyrite lamella in (C) and a set of anilite lamellae of different orientations in (D).

We note that inclusions of Bi-(Pb)-chalcogenides are present in both the chalcocite and bornite or at their mutual contacts. These include tellurobismuthite (Bi2Te3) and aleksite (Pb2Bi4Te4S4), phases from the tetradymite (Cook et al., Reference Cook, Ciobanu, Wagner and Stanley2007a) and aleksite series (Cook et al., Reference Cook, Ciobanu, Stanley, Paar and Sundblad2007b), respectively. Compositional data, imaging of layer stacking, and corresponding fast Fourier transform (FFT) patterns on [ $11\bar 20$] zone axis relevant for their identification (Ciobanu et al., Reference Ciobanu, Pring, Cook, Self, Jefferson, Dima and Melnikov2009; Yao et al., Reference Yao, Ciobanu, Cook and Ehrig2023, Reference Yao, Ciobanu, Cook, Ehrig, Dima and Steinle-Neumann2024) are given in Table S1 and Fig. S3.
At lower magnification, the densest basket-weave textures show intricate lamellar intergrowths between the two phases (Fig. 3A,B). We note a radial arrangement of the anilite at the edge of the tellurobismuthite lamella in this case (Fig. 3C).
In detail, the EDS STEM element-distribution maps show that the highest concentration of Cu corresponds to sets of short lamellae of anilite on the HAADF STEM image forming parallel arrays within a ‘mesh’ of intermediate Cu composition, i.e. between anilite (highest Cu content) and bornite (lowest Cu content) (Fig. 3D). Areas with intermediate Cu and Fe content are identified as digenite using high-resolution imaging (see below). More complex, network-like morphologies of the anilite arrays show comparable relationships with Cu and Fe distribution on EDS STEM maps (Fig. 3E). Interestingly, minor concentrations of Ag are noted within anilite lamellae that display a separation from bornite (Fig. 3F).
Figure 4 shows higher-resolution EDS STEM element-distribution maps of areas with still greater complexity. These comprise ultrathin, needle-like lamellae of a structurally distinct Cu-sulfide species, tentatively identified as the rhombohedral twin-structure of digenite 5a (Dg5a-R; Donnay et al., Reference Donnay, Donnay and Kullerud1958) that crosscut the basket-weave anilite/digenite-bornite intergrowths (Fig. 4A) and chalcopyrite lamellae, when present (Fig. 4B). The EDS STEM maps show that the needles are compositionally indistinguishable from anilite in the basket-weave texture.
Secondly, the mapped distribution of Fe shows domains of enrichment relative to bornite. Such domains were found either adjacent to chalcopyrite (Fig. 4C) or anilite lamella (Fig. 4D). This lamellar substructure in anilite shows no compositional variation in terms of Cu concentration (Fig. 4D).
Compositional data obtained from the EDS STEM maps are listed in Supplementary Table S1 and plotted on a series of Cu vs. Fe diagrams in Fig. S2. Compositional data obtained from larger areas of bornite–anilite/digenite with basket-weave textures show either an excess or deficit of Cu relative to stoichiometric bornite, depending on whether the sample derives from the Bn-Cc or Bn-Ccp zones. This agrees with micron-scale EPMA data showing the same trends in bornite (Ciobanu et al., Reference Ciobanu, Cook and Ehrig2017). Otherwise, bornite is relatively stoichiometric across all foils, except for the Fe-rich domains from the maps in Fig. 4C,D. In the latter case, an average composition of ∼Cu4Fe1.8S4.2 was obtained. Such stoichiometry is close to the Cu4Fe2S4 formula considered for 2a bornite models by Ding et al. (Reference Ding, Veblen and Prewitt2005a).
A compositional group, with average formula ∼Cu9.12Fe0.89S5, was obtained from the areas of intermediate Cu content assessed as digenite from HR-STEM imaging (see below). Anilite has an average composition of ∼Cu7.76Fe0.22S4.02. This is slightly richer in Cu than the compositional range attributed to anilite by Koto and Morimoto (Reference Koto and Morimoto1970), i.e. 7.00–7.36 Cu atoms per formula unit (apfu). We also note the presence of minor Fe in anilite, which was absent from the data presented by Koto and Morimoto (Reference Koto and Morimoto1970). Nonetheless, there is a clear decrease in Fe, by roughly an order of magnitude, from digenite to anilite, and each of the species discussed above separate well on the Cu–Fe plots in Fig. S2.
The average compositions of chalcopyrite and tellurobismuthite are close to stoichiometric (Table S1).
Morphological variation among the basket-weave textures, comprising mainly bornite and anilite/digenite, is shown in Fig. 5. The only exception texturally is the bornite with small blebs of digenite (Fig. 5A) that was obtained from the fine bornite–chalcocite symplectites in sample CLC50a (foil # 3; FIB cut 3 in Fig. 2B). The digenite blebs could not, however, be imaged at high resolution (because of foil thickness), and their identification as digenite is based solely on compositional data (Table S1). The chalcocite species outside the bornite (Figs 1A,B, S1A–D) is represented by the monoclinic Cu2S polymorph and djurleite, thus structurally distinct from anilite and will be discussed elsewhere. Variation in morphology includes areas with parallel, dense sets of anilite lamellae in bornite (Fig. 5B,C). In most cases, digenite is present close to anilite–bornite contacts, and sometimes these phases are separated from one another by the Dg5a-R needles (Fig. 5D). The terminations of anilite arrays are often marked by small, lozenge-shaped grains with well-defined composition (EDS STEM maps; inset Fig. 5D). Spectra for the bornite, digenite and anilite are shown in Fig. 5E. The most complex basket-weave textures were observed in samples from the Bn-Ccp zone, in which the density of Dg5a-R needles is highest and can form parallel sets of two orientations (Fig. 5E). Unlike the example shown in Fig. 5C, such needles can crosscut and displace both chalcopyrite and bornite + anilite/digenite textures (Fig. 5E). Notably, these needles do not crosscut the Fe-rich bornite even though they do crosscut all other phases (Fig. 5F).
Low-magnification images (HAADF STEM and BF in C), except map + spectra in (E) showing textural variation between the main components in the basket-weave textures. (A) Blebby inclusions of digenite (Dg) in bornite (Bn) forming finer symplectites with chalcocite from sample CLC50a (FIB cut3/foil 3 in Figs 2B and S1). (B, C) Parallel sets of anilite (+digenite) lamellae adjacent to the Fe-rich bornite domains. Note the different orientations of such lamellae well depicted on the BF STEM image in (C). (Typical lozenge-shaped anilite (An) within bornite and digenite. Note the very low HAADF contrast between bornite and digenite separated by a needle of Dg5a-R (arrowed). (E) Fe-Cu overlay map of anilite from (D) and spectra (Sp.) of the three phases as labelled. Note the decreasing Fe content from bornite to digenite and anilite. (F) Network of Dg5a-R needles (arrowed) crosscutting the phases forming the basket-weave texture and an embedded chalcopyrite lamella (Ccp). (G) Lobate-shaped Fe-rich domain in bornite close to a chalcopyrite lamella. Note the adjacent Dg5a-R needle (arrowed) does not cut this domain.

High-resolution imaging
The images obtained in HAADF STEM mode show patterns in which the dots are directly attributable to individual atoms within the crystal structures. The signal intensity is proportional to the atomic number (Z) of an element, i.e. I ≈ Z2, and the number of atoms down the column on each respective site. Interpretation of images therefore requires well-constrained models of each analysed phase on relevant crystallographic orientations.
Bornite and digenite models
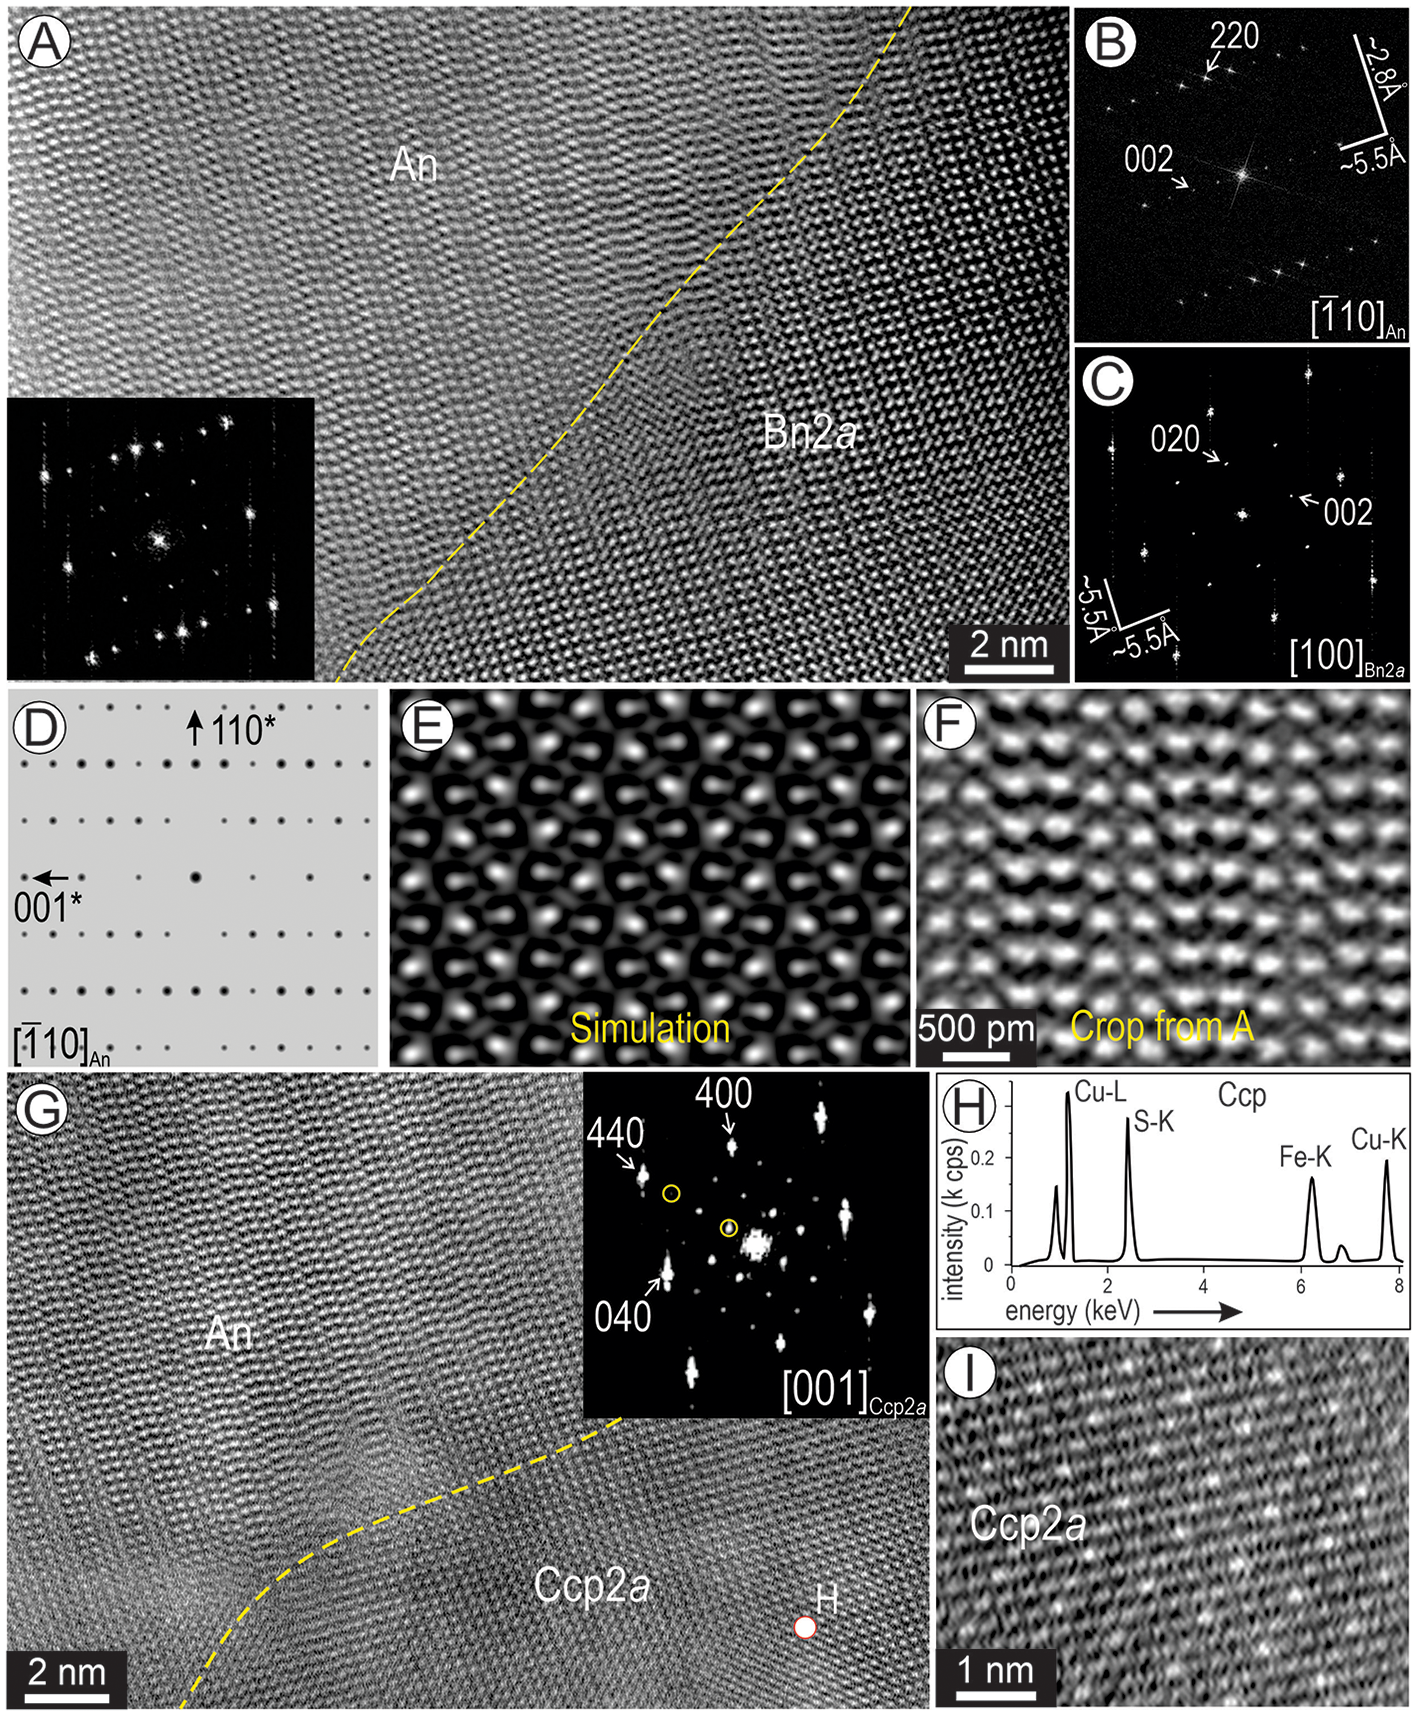
There exist several cubic crystal structure models for both bornite (Tunnel and Adams, Reference Tunell and Adams1949; Kanazawa et al., Reference Kanazawa, Koto and Morimoto1978; Ding et al., Reference Ding, Veblen and Prewitt2005a, Reference Ding, Veblen and Prewitt2005b) and digenite (Morimoto and Kullerud, Reference Morimoto and Kullerud1963; Yamamoto and Kashida, Reference Yamamoto and Kashida1991; Will et al., Reference Will, Hinze and Abdelrahman2002). Although these models share electron diffraction patterns, they can have different appearances on HAADF STEM images. The [110] zone axis is the optimal orientation for TEM identification of superstructuring in Cu-(Fe)-sulfides with cubic symmetry.
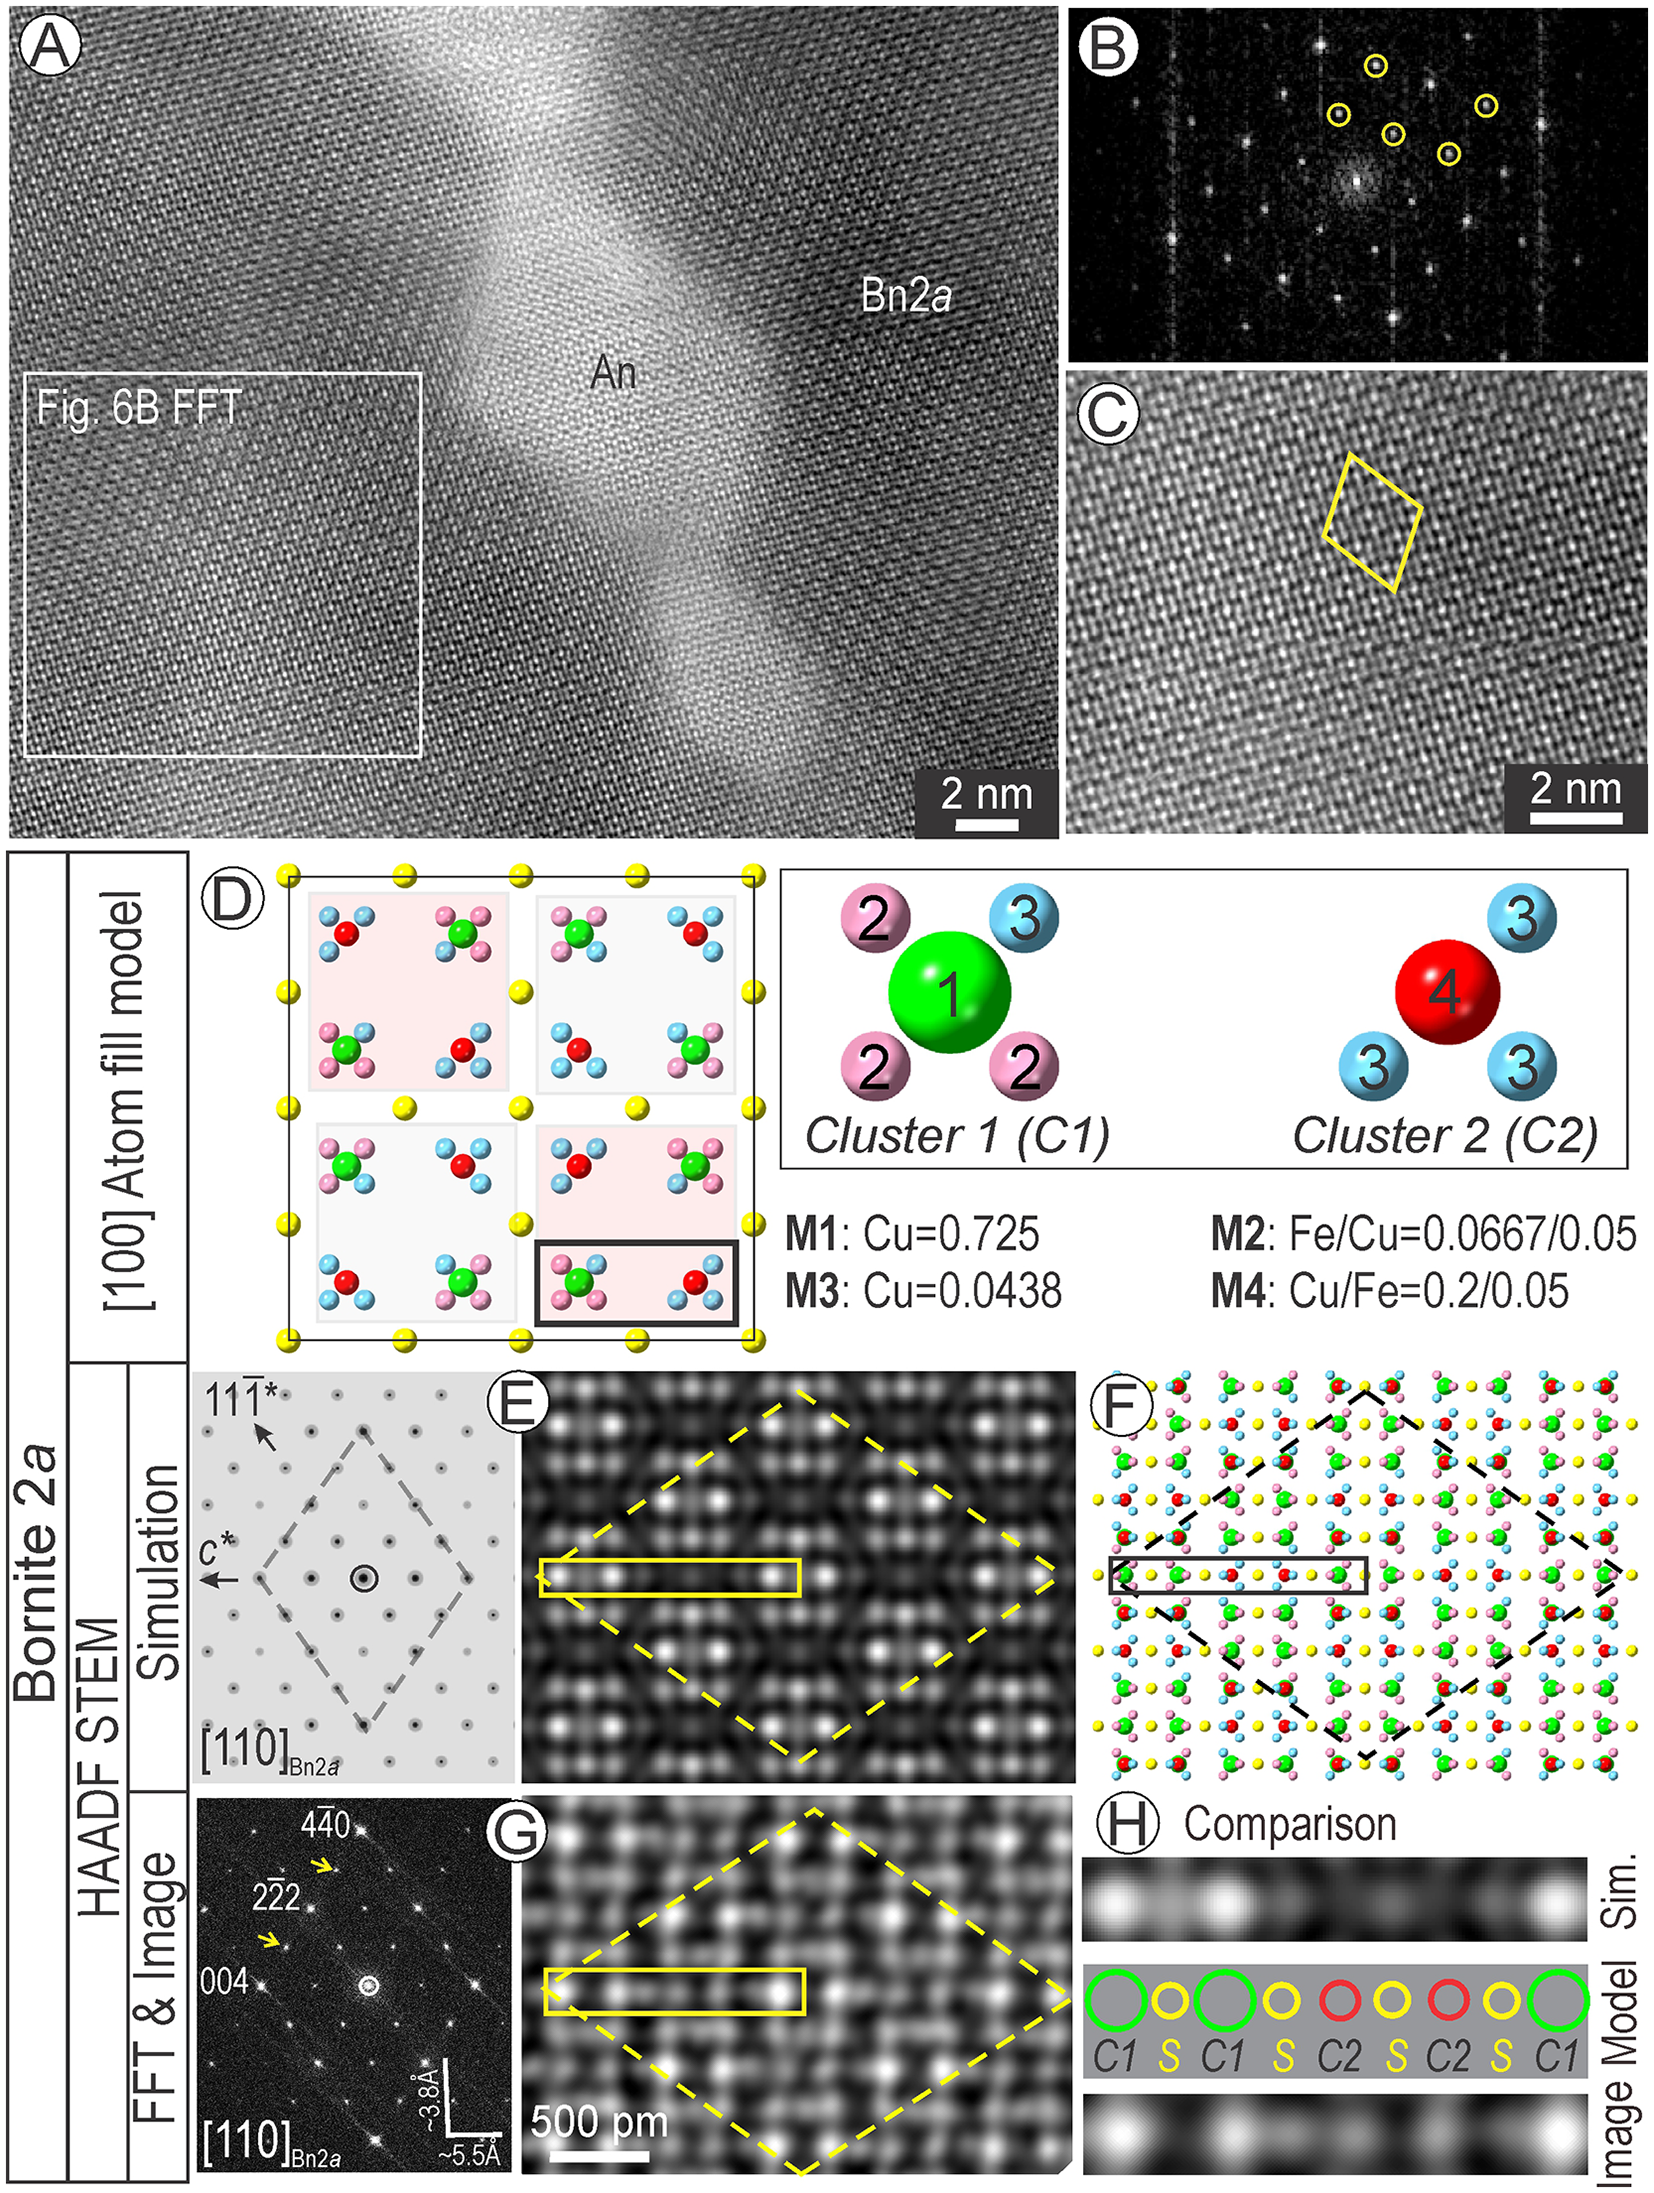
The bornite imaged throughout all foils corresponds to a 2-fold variety as depicted by satellite reflections on FFT patterns (Fig. 6A, B). In detail, the image displays a checkerboard arrangement of pairs of bright dots (Fig. 6C). The stoichiometric composition obtained for bornite studied here rules out the Bn2a models of Ding et al. (Reference Ding, Veblen and Prewitt2005a) as these all consider a different stoichiometry (Cu2FeS2). The Bn2a model of Kanazawa et al. (Reference Kanazawa, Koto and Morimoto1978) does not match either the observed HAADF STEM images (Fig. 6C), or simulations on the [110] zone axis (Supplementary Fig. S4). This model is built of 32 clusters of 7-atoms (4 Cu and 3 Fe) where each cluster has an overall occupancy of 1.5, placed internally into a S lattice. The orientations of atoms in the Cu-Fe clusters throughout the 2 × 2 × 2 supercell are, however different from one another.
Analytical data (A–C), models and simulation for bornite 2a (Bn2a) superstructure (D-H). (A) High-resolution HAADF STEM image of Bn2a host to a lozenge-shaped anilite (An). (B) Fast-Fourier transform (FFT) pattern obtained from area marked by rectangle in (A) showing the 2-fold satellite reflections (circled) along 111* directions on [110]bornite. (C) Crop from (A) showing the rhombus motif (yellow) defining the Bn2a superstructure. (D) Atom-filled model showing the cluster arrangements for metals (M) of occupancies as labelled. (E, F) Electron diffraction (ED) and STEM simulation (E) and atom fill structure (F) for the empirical Bn2a model. (G) FFT pattern and image matching the proposed model. (H) Comparison of simulation, model and image showing atom distributions along the half-cell outlined by the rectangles in (E-G). Dashed line shows the rhombus motif for the superstructure on [110] zone axis. Note that the simulation shows decreasing brightness/size of dots for C1, S and C2 (very faint) in agreement with their calculated intensity as 650, 256 and 202 arbitrary units, respectively. In contrast, the image shows the intensity/size of C2 and S to be approximately equal, but two of the four sulfur atoms are not displayed.

Using the same Fm3m space group as Kanazawa et al. (Reference Kanazawa, Koto and Morimoto1978) but with atomic coordinates as in digenite (Yamamoto and Kashida, Reference Yamamoto and Kashida1991), we created several 2a × 2a × 2a superstructure models in which the asymmetric unit cell comprises two groups of Cu+Fe atoms with different overall occupancy placed within interstices of the S lattice. We tested these models by STEM simulation.
The model that showed the best fit with analytical data is shown as a projection on [100] (Fig. 6D). This cube face shows two groups of atom clusters, either comprised of 4- or 3-atoms distributed around a central atom of higher occupancy. Using the crystallographic information file (.cif) produced using CrystalMaker®, we simulated both the electron diffraction and STEM image on the [110] zone axis (Fig. 6E).
The simulated image has a good match with the crystal structure model in terms of atomic weight of the clusters throughout the basic motif (Fig. 6E, F). The fit between the simulations (Fig. 6E) and data (Fig. 6G) is supported by the checkerboard arrangement of the two pairs of bright dots with ¼ c repeat, although, on the image, dots have a ‘wavy’ appearance. In detail, comparison between the simulation, model and image along the string of nine dots representing half the long diagonal of the rhombus motif re-emphasises this mismatch in terms of intensity/size of dots representing the two clusters and S atoms (Fig. 6H). Such discrepancies between the model/simulations and images could be addressed by further work involving density functional theory (DFT) calculation for the structure and TDS factors.
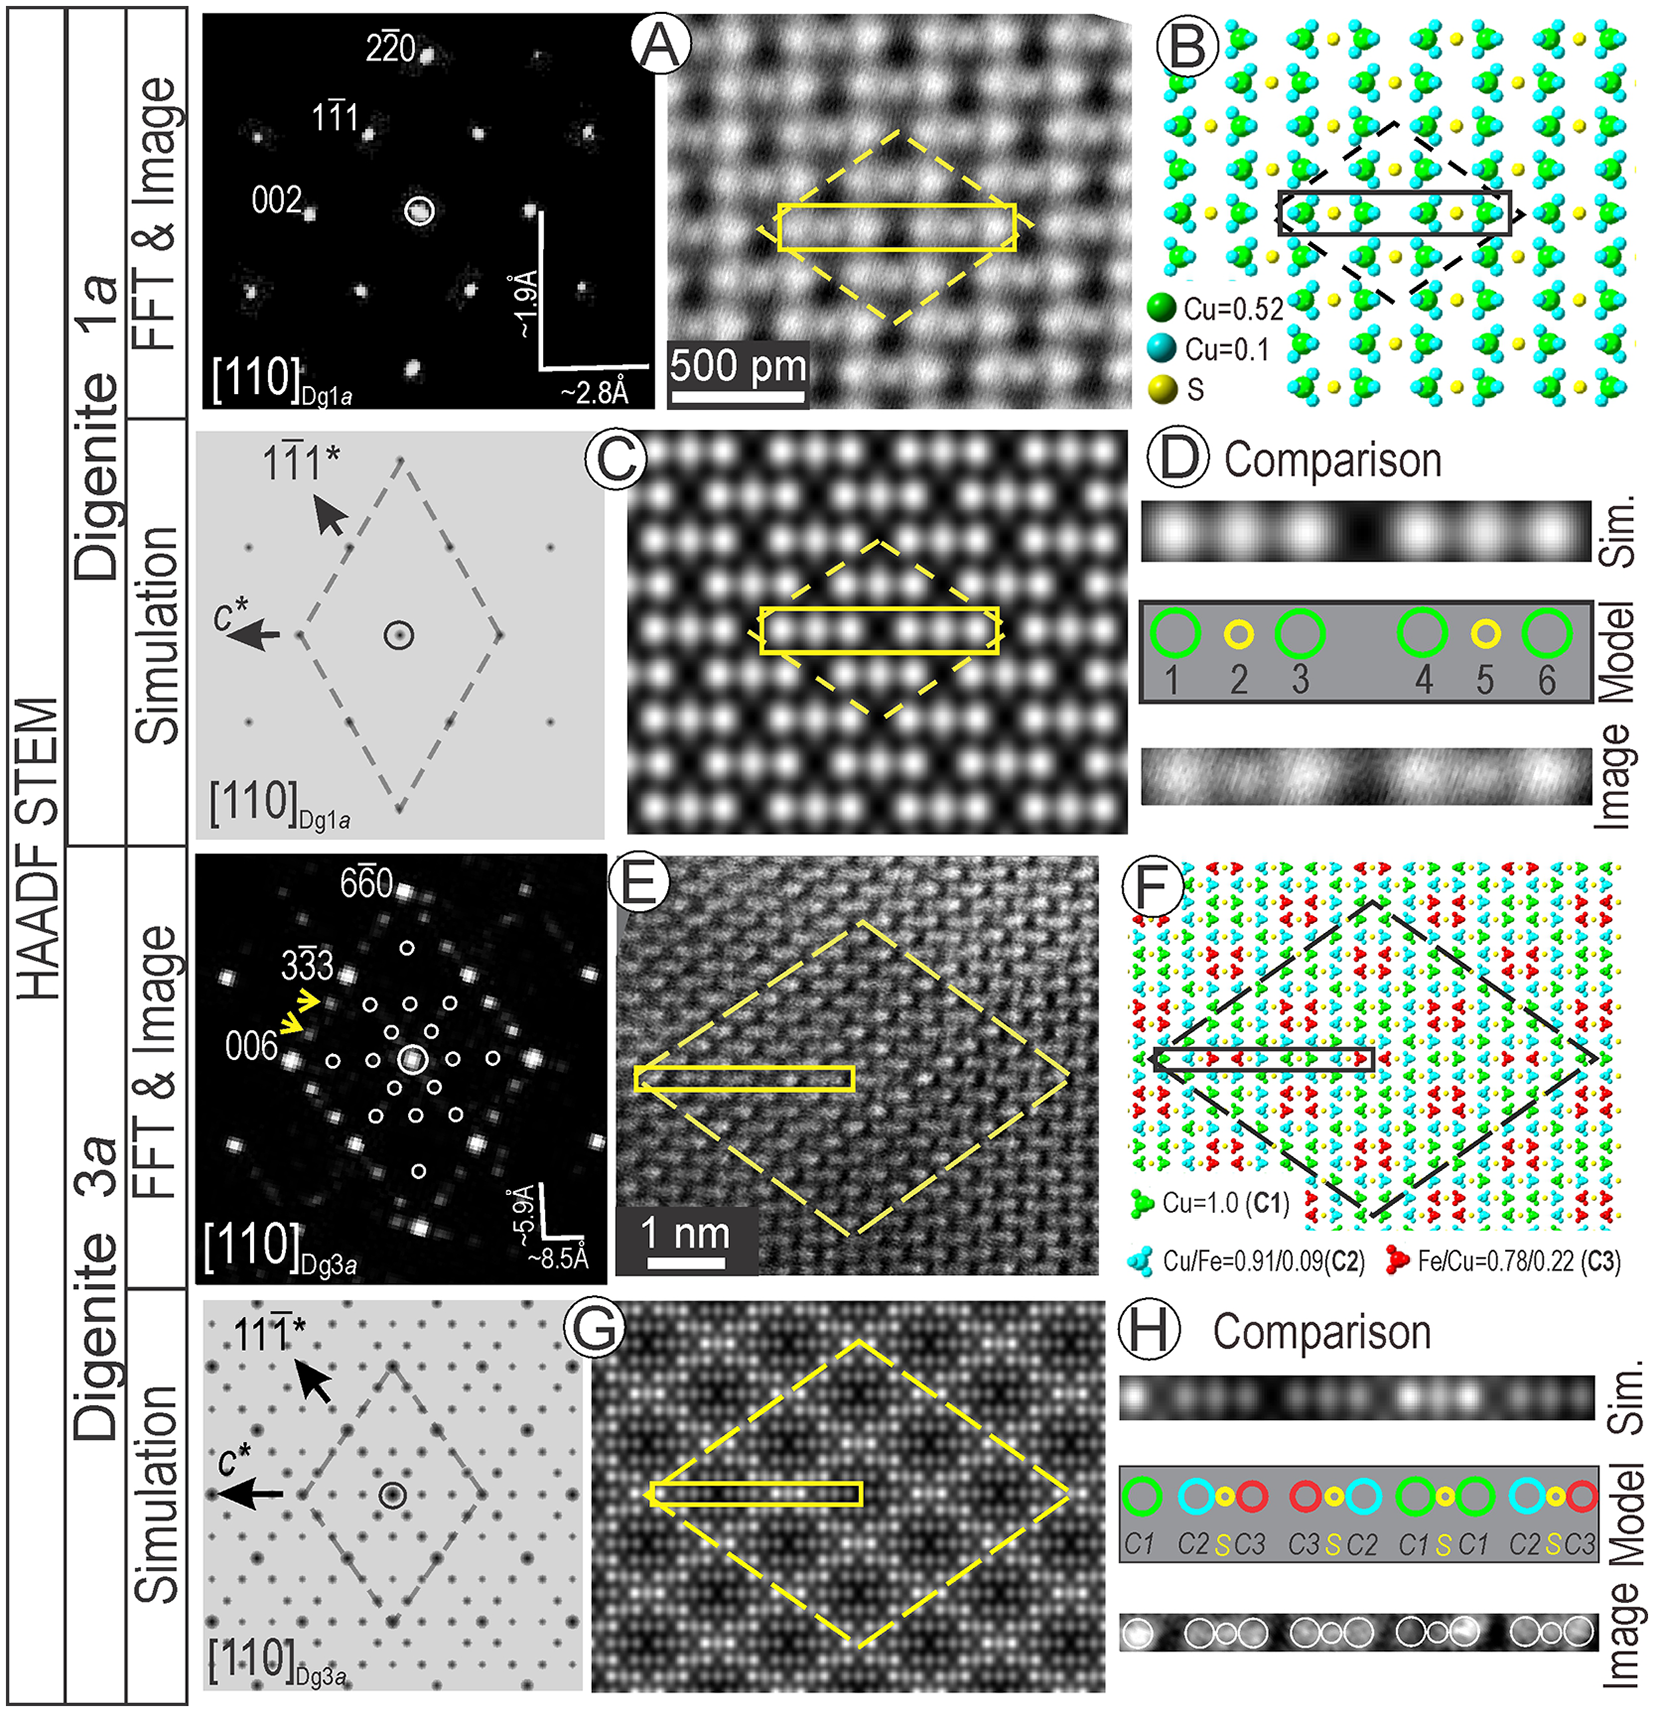
Imaging of areas with digenite composition on [110] zone axis (FFT with no satellite reflections) shows a different pattern than that of Bn2a (Fig. 7A). This image is recognisable from the atom-fill model (Fig. 7B) and displays an excellent match with the STEM simulation (Fig. 7C) using the structure of Yamamoto and Kashida (Reference Yamamoto and Kashida1991) with a composition of Cu9.2S5, even if natural digenite contains variable amounts of Fe (Pierce and Buseck, Reference Pierce and Buseck1978). This structure, one of several published models, fits best with the STEM images. We also note the good match of the dot distribution along strings from the rhombus diagonal (image and STEM simulation) attributable to clustered Cu atoms and S columns (atom-fill model Fig. 7D).
Analytical data, models and simulations for digenite 1a (Dg1a) (A–D) and Dg3a superstructure (E–H). FFT pattern, image (A) and atom fill model (B) using the Yamamoto and Kashida (Reference Yamamoto and Kashida1991) structure for Dg1a. (C) ED and STEM simulations for Dg1a. (D) Comparison of image, simulation and model showing atom distributions along the direction outlined by the rectangles in (A–C). (E, F) FFT pattern, image (E) and atom-fill model for empirical Dg3a in (F). (G) ED and STEM simulations for Dg3a. (H) Comparison of image, simulation and model showing atom distributions along the half-cell outlined by the rectangles in (E–G). The dashed line shows the rhombus motif for the (super)structure on [110] zone axis.

A digenite 3a superstructure was identified from FFT patterns and images on [110] zone axis (Fig. 7E). In this case, the three-fold satellite reflections correspond to rhombic-block partitioning on the image. Using the Fm3m digenite structure of Yamamoto and Kashida (Reference Yamamoto and Kashida1991), we built a three-fold superstructure in CrystalMaker®, incorporating Fe to match the chemical data obtained (Fig. 7F). The structure was assessed by simulations of electron diffraction and STEM images (Fig. 7G). The fit for the superstructure is reinforced by comparison between the image, simulation and model along the string of 13 ‘dots’ from the ½ length of the long diagonal of the rhombus motif (Fig. 7H). These dots represent the Cu, Cu/Fe atom clusters and S in the atom model.
Although the two new models (Bn2a and Dg3a) are empirical (.cif files are provided in the supplementary material file) and require further assessment by other methods, e.g. ab initio calculations using DFT, they fit well with HAADF STEM observations.
Another bornite species identified in this study is bornite 2a4a2a (in short Bn2a4a), also referred to as ‘low-bornite’ (Koto and Morimoto, Reference Koto and Morimoto1975). Bn2a4a is isochemical with bornite but is the only bornite superstructure with orthorhombic symmetry (space group Pbca) (Koto and Morimoto, Reference Koto and Morimoto1975). The observations could be modelled using the existing crystal structure.
The other phase of importance here is anilite (Cu7S4) which has been considered a low-temperature form of digenite with orthorhombic symmetry (Morimoto et al., Reference Morimoto, Koto and Shimazaki1969; Koto and Morimoto, Reference Koto and Morimoto1970). This is a superstructure of digenite, whereby a = b = a Dg and c = 2a Dg, and shows a compositional range between Cu7S4 and Cu7.36S4 (Morimoto et al., Reference Morimoto, Koto and Shimazaki1969). HAADF STEM images and FFTs are matched with simulations below.
Two-phase associations
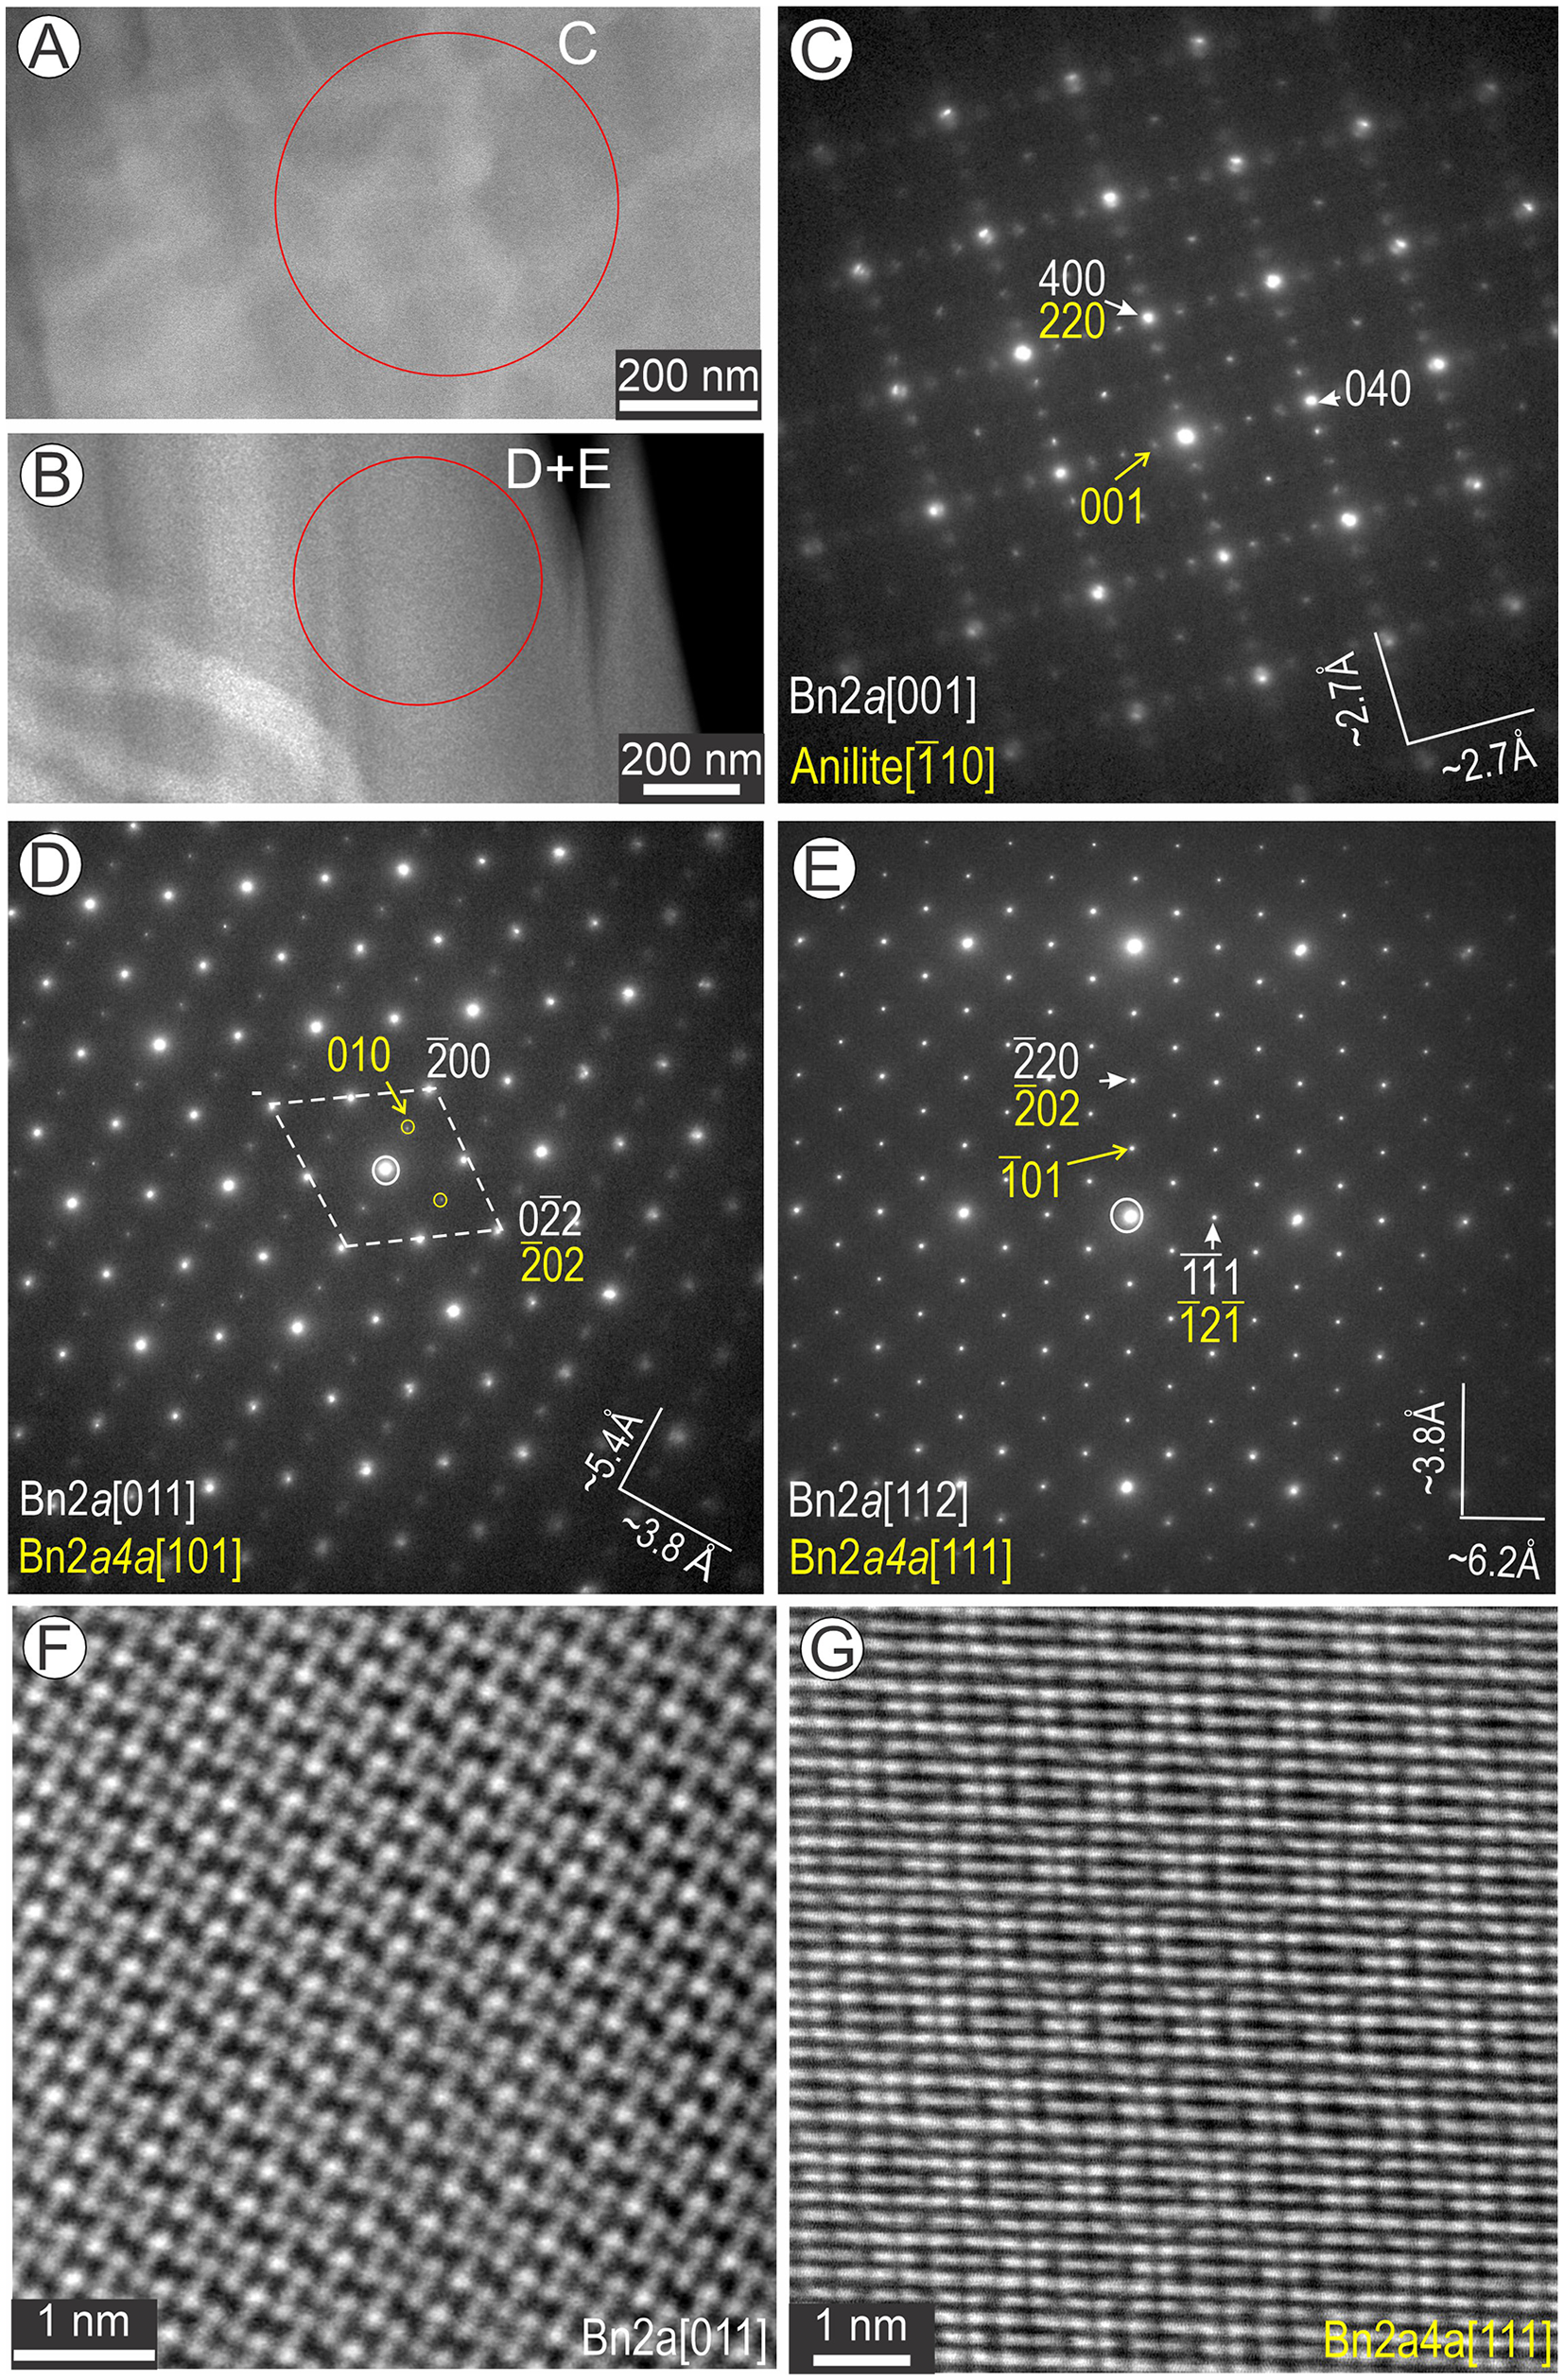
Areas comprising approximately equal amounts of bornite and anilite/digenite with basket-weave texture, as well as those showing only an apparent single phase (bornite), were assessed by selected area electron diffraction (SAED) to evaluate their homogeneity over several hundred nm (Fig. 8). Irrespective of whether the image shows two- or single-phase domains (Fig. 8A, B), the SAED patterns show measurements corresponding to Bn2a on two major zone axes, [001] and [011], but with additional satellite reflections (Fig. 8C,E). In the case of [001]Bn2a obtained from area shown in Fig. 8A, the satellite reflections (Fig. 8C) can be attributed to intergrowths between bornite and anilite [ $\bar 1$10] (see below). This is not the case for SAED patterns (Fig. 8D, E) obtained at different tilts from the apparently homogeneous area of bornite in Fig. 8B. On the SAEDs representing Bn2a on [011] and Bn2a on [112] zone axes, we can index the satellite reflections as bornite 2a4a on [101] and on [111] zone axis, respectively (Fig. 8D,E). The corresponding images show patterns illustrative of Bn2a (Fig. 8F) and Bn2a4a (Fig. 8G). To further understand how such images could be explained, we identified areas in which domains of the two bornite superstructures are separated from one another (Fig. 9).
Low-magnification images (A, B), selected area electron diffractions (SAED) patterns (C–E) and high-resolution HAADF STEM images of bornite (Bn) (F, G) representing two-phase basket-weave textures. Circles on (A) and (B) show the area from which the SAEDs were obtained. (C-E) SAEDs showing intergrowths between two phases on zone axes as labelled. (F, G) Images corresponding to SAEDs representing the Bn2a+Bn2a4a obtained from (B) show a single phase as labelled (either Bn2a or Bn2a4a) depending on the specimen tilt.

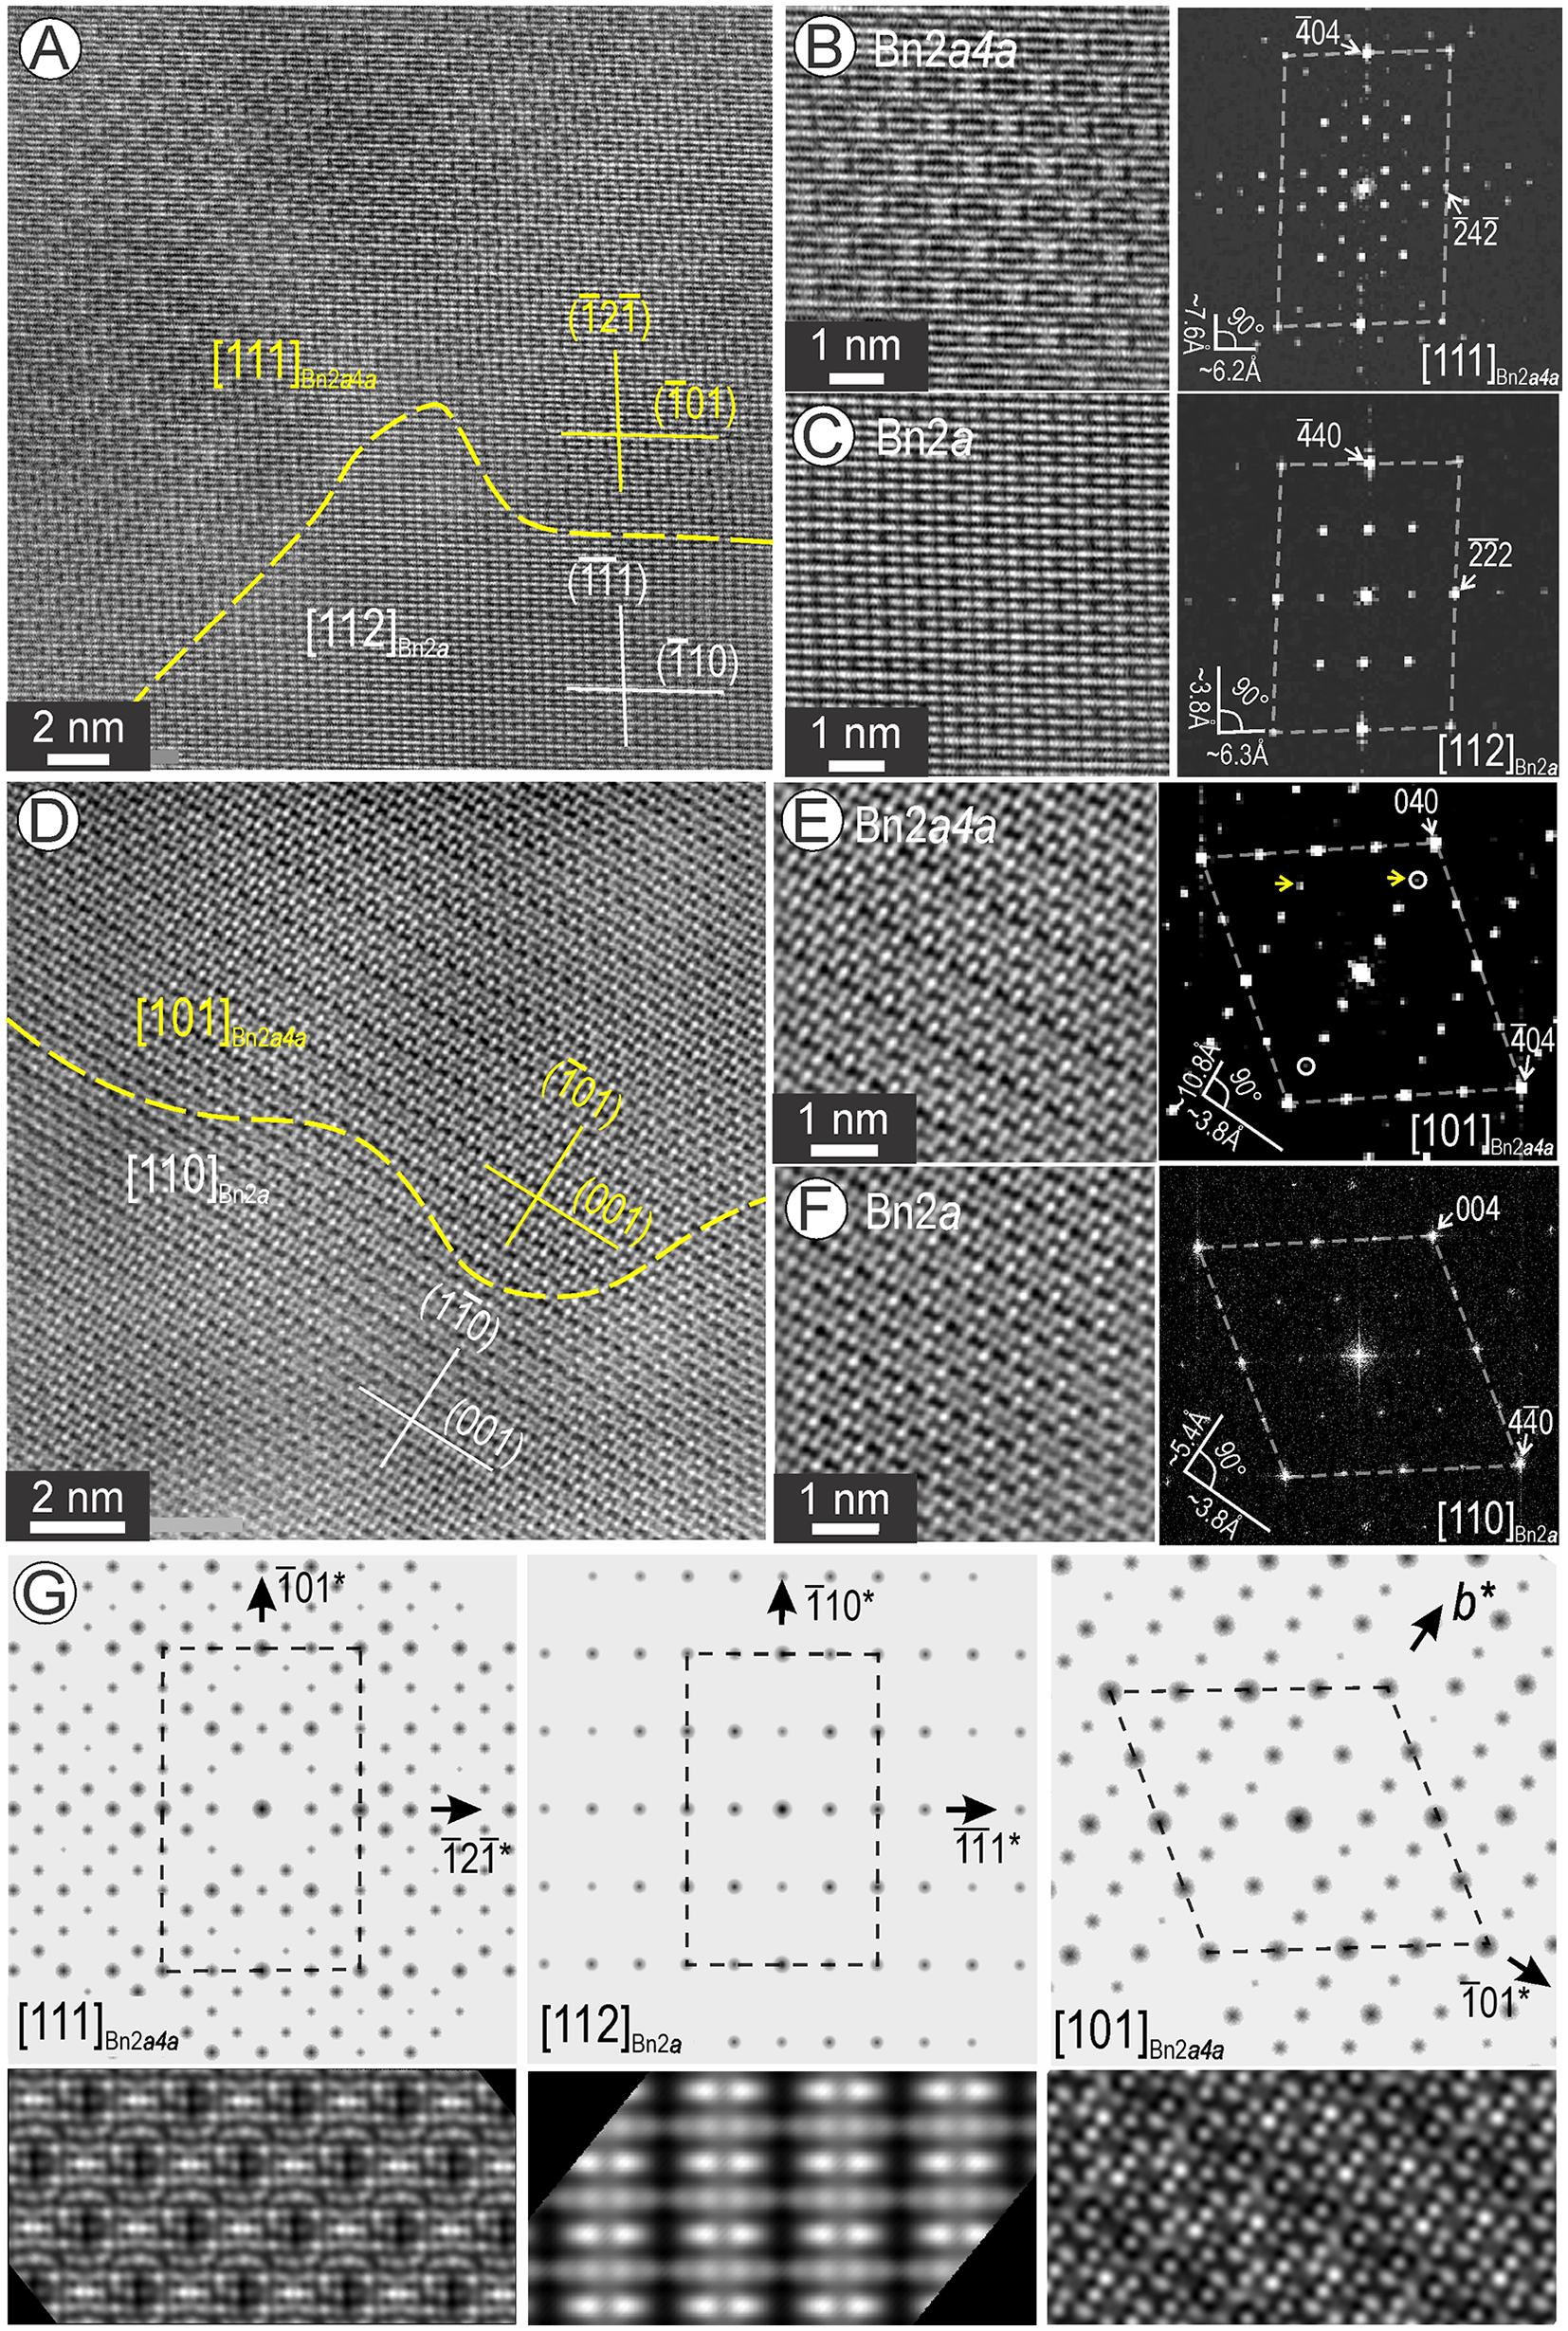
Two-phase association between bornite 2a (Bn2a) and Bn2a4a tilted on two-zone axes as labelled. (A–C) Large image, crops and FFT patterns of [111] Bn2a4a (B) and [112] Bn2a (C) showing the subtle differences in the structural motifs typical of the two phases. (D–F) Large image, crops and FFT patterns of [101] Bn2a4a (B) and [110] Bn2a (C) showing the subtle differences in the structural motifs typical of the two phases. The dashed line shows the contact between the two phases. Plane directions are indicated for each phase showing epitaxial relationships. (G) ED patterns and STEM simulations for the two phases on zone axes as labelled. The [110] Bn2a is shown in Fig. 6E.

Nanodomains of Bn2a and Bn2a4a were found as coherent intergrowths with one another on [101] and [111] zone axes. Although the images showing [111]Bn2a4a and [112]Bn2a are distinct for each phase (Fig. 9A), high-resolution images show curvilinear contacts with structural continuity along the planes ( $\textstyle\bar1\bar1$1) and ( $\bar 12\bar 1$) in Bn2a and Bn2a4a, respectively. In detail, the two bornite species share motifs and FFT patterns (Fig. 9B,C) that could explain their appearance when overlapped as shown in Fig. 8E, G.
When tilted, the same area also shows coherent intergrowths with curvilinear boundaries identified between [110]Bn2a and [101]Bn2a4a, with structural continuity along ( $1\bar 10$) and ( $\overline101$) planes, respectively (Fig. 9D). The two bornite superstructures show similar atomic arrangements, although with double periodicity along the ( $\bar 101$) plane in Bn2a4a, but differ in the number of satellites on the FFT patterns (Fig. 9E, F). Such image similarities could explain their appearance when overlapped with one another (Fig. 8D, F). Figure 9G shows electron diffraction and STEM image simulations for the new zone axes in the two types of bornite.
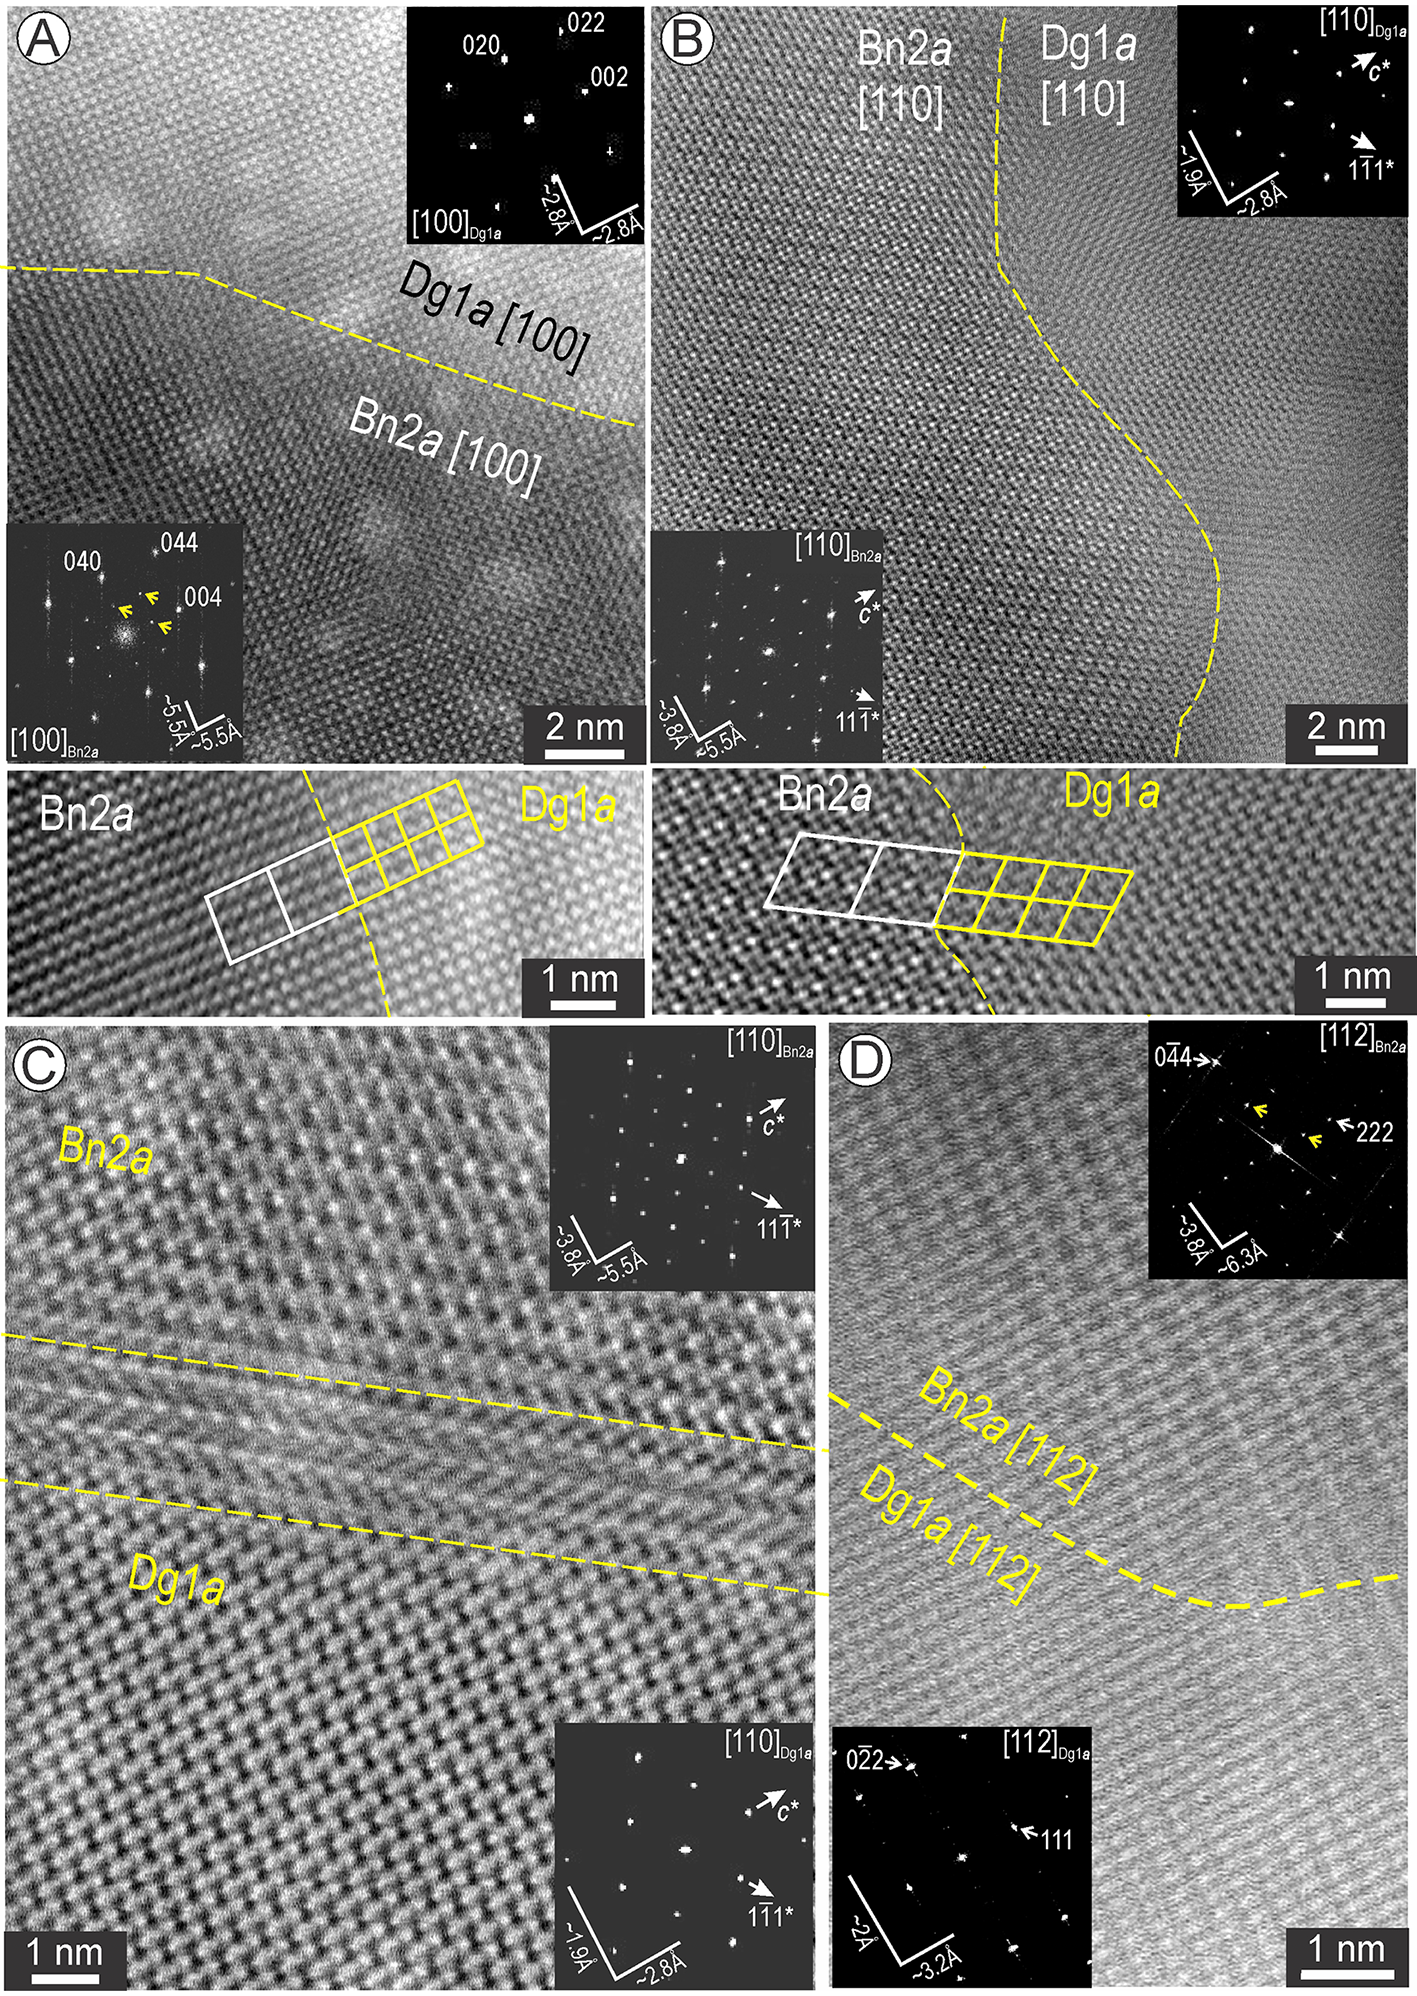
Another type of two-phase association is represented by Bn2a and digenite (Fig. 10). Coherent contacts between these two phases (assessed by EDS spectra) were documented on two main zone axes, [100] and [110], both relevant for superstructure identification as depicted by FFT patterns and images (Fig. 10A,B). The correspondence between the main motifs is shown as overlays on cropped images obtained across these contacts. We note the good match between images on [110] zone axis for both phases with the models shown in Figs 6E and 7C. Some contacts between Bn2a and Dg1a are marked by nm-wide defects (Fig. 10C). In contrast to the above, on the [112] zone axis, the two phases display a marked difference on the images but are still coherently intergrown with one another (Fig. 10D).
Two-phase association between digenite 1a (Dg1a) and bornite 2a (Bn2a) on three zone axes as labelled. (A, B) Images and corresponding FFT patterns (inset) for Bn2a and Dg1a on [100] in (A) and [110] in (B). The motifs corresponding to each phase are outlined on image crops beneath each. (C) Defect (dashed line) between Bn2a and Dg1a on [110] orientation; FFT patterns as insets. (D) Image and FFT patterns as insets for Bn2a and Dg1a on [112] zone axis.

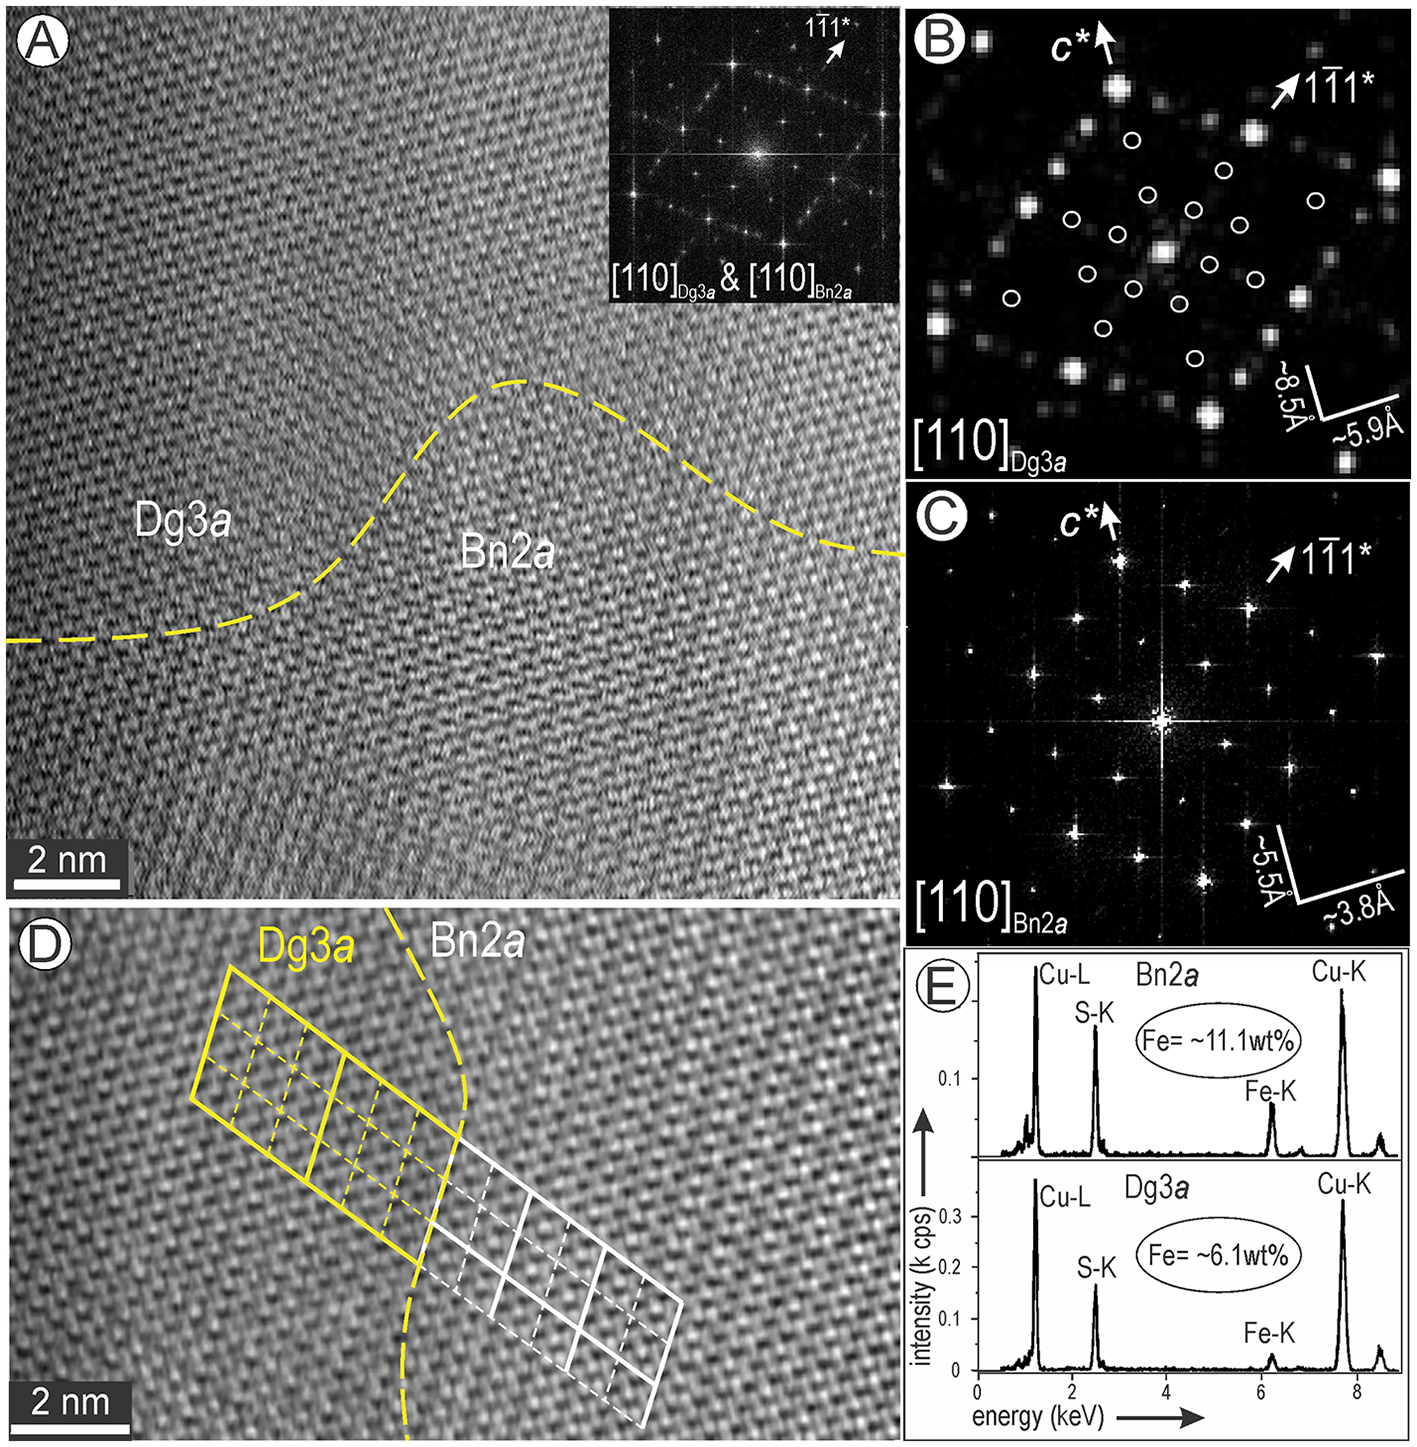
Nanoscale domains of a Dg3a superstructure were found at the direct contact to Bn2a imaged on [110] zone axis (Fig. 11A). The FFT pattern over the area shows additional satellite reflections along 111* directions which are the result of combining three-fold digenite with two-fold bornite (Fig. 11A–C). The superstructure partitioning is shown on a crop obtained across the mutual contact (Fig. 11D). EDS spectra for each phase show the significant decrease in Fe from bornite to digenite (from 11.1 to 6.1 wt.% Fe; Fig. 11E).
Two-phase association between bornite 2a (Bn2a) and digenite 3a (Dg3a) tilted on [110] zone axis. (A) Image and corresponding FFT pattern as inset showing the superposition of satellite reflections on <111>* directions. (B, C) FFT patterns obtained from each domains depicting the 3- and 2-fold satellite reflections corresponding to Dg3a and Bn2a. (D) Crop from (A) with outlines of the superstructures for each domain. (E) Spectra obtained from the two domains indicating the decrease in Fe content as labelled.

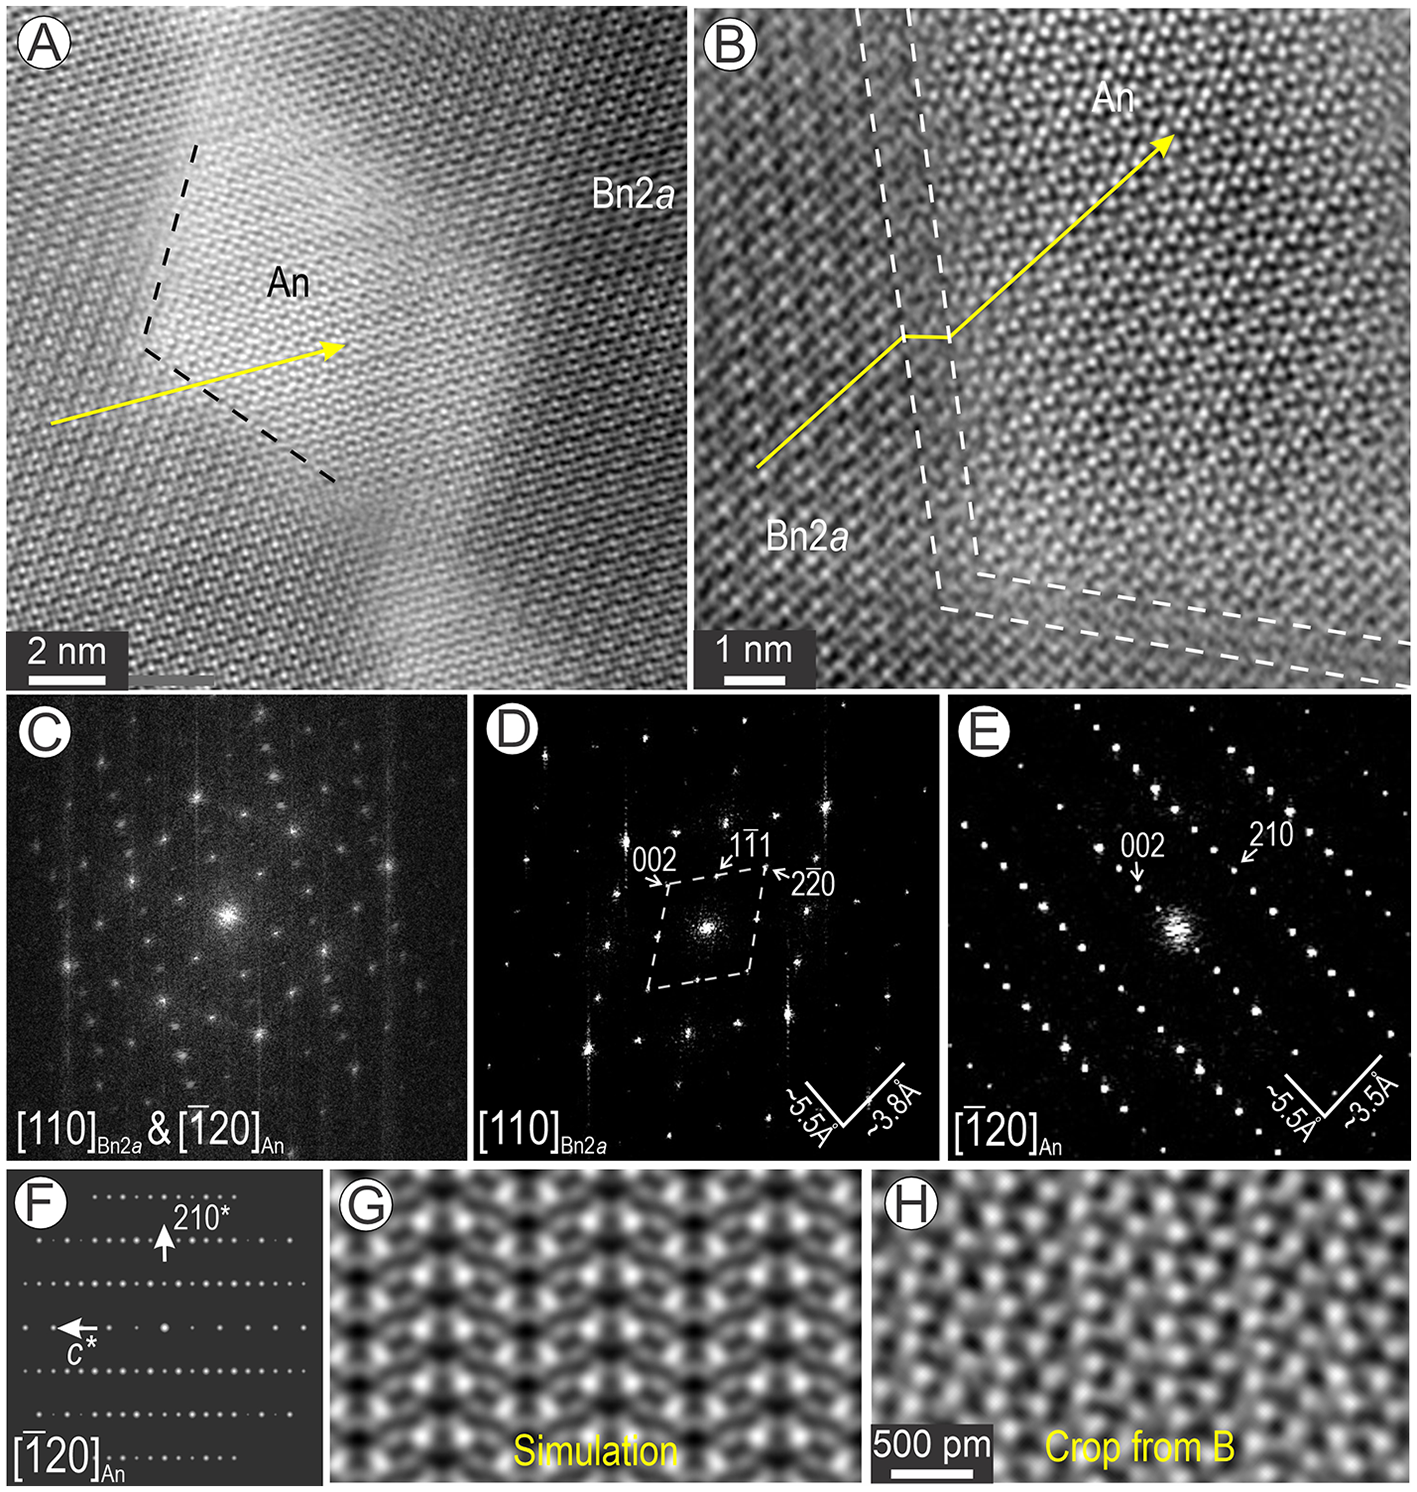
Anilite with composition Cu7.76Fe0.22S4.02 is the most prominent component forming coherent intergrowths with Bn2a in the basket-weave textures (Fig. 12). This phase occurs as lozenge-shaped domains within [110]Bn2a (Fig. 12A). Defects are also observed between the two phases (Fig. 12B). Fast-Fourier transform patterns for such intergrowths show the match between 002*anilite ≈ 002*Bn2a ≈ 5.5 Å (Fig. 12C-E). However, the <hkl Bn2a> * with h, k, l=2n lattice vectors in Bn2a show extra satellites at ½ distances (Fig. 12C).
Intergrowths between [ $\bar 120$] anilite (An) and [110] bornite 2a (Bn2a). (A, B) High-resolution images showing the coherence between planes (arrowed) of the two structures albeit with a stepwise defect in (B). (C) FFT pattern representing the image in (A) showing the overlap between the two structures. (D, E) FFT patterns obtained from each phase imaged in (B). (F, G) Simulation of anilite on [ $\bar 120$] zone axis. (H) Crop of image in (B) showing the match with simulation in (G).

The FFT pattern in Fig. 12E can be indexed as anilite on the [ $\bar 120$] zone axis (Fig. 12F). There is a relatively good fit between the STEM simulation of anilite and the HAADF STEM image (Fig. 12G, H). Additionally, there is a compositional difference of ∼0.4 apfu Cu and 0.22 apfu Fe between the phase identified here as anilite relative to the ideal composition as defined by Koto and Morimoto (Reference Koto and Morimoto1970).
Likewise, the epitaxial relationships between the two main phases within the basket-weave textures were observed on a second orientation, [100]Bn2a and [ $\bar 110$]An (Fig. 13A–C). The FFT patterns show the match between the two phases whereby, <hk0Bn2a> * with h, k = 2n lattice vectors in Bn2a show extra satellites at ½ distances (inset in Fig. 13A–C). The simulated electron diffraction and image show a good fit with the FFT pattern (Fig. 13B,D). The STEM simulations and image also show a relatively good match (Fig. 13E, F). [ $\bar 110$]An is also found in epitaxial contact with [001]Ccp (Fig. 13G). Chalcopyrite from the same area (spectrum in Fig. 13H) shows domains of 2a superstructuring (Fig. 13I).
(A-C) Two-phase association between [ $\bar 110$] anilite (An) and [100] bornite 2a (Bn2a) with corresponding FFT patterns in (B, C). (D–F) ED pattern, STEM simulation and image (crop from (A) showing An on [ $\bar 110$] zone axis. (G) Image of [ $\bar 110$] An and [001] chalcopyrite (Ccp). FFT pattern in the inset shows Ccp with satellite reflections (circled) indicative of a two-fold superstructure. (H) Spectrum of chalcopyrite obtained from spot in (G). Crop of image in (G) showing the 2-fold Ccp superstructure as brighter dots.

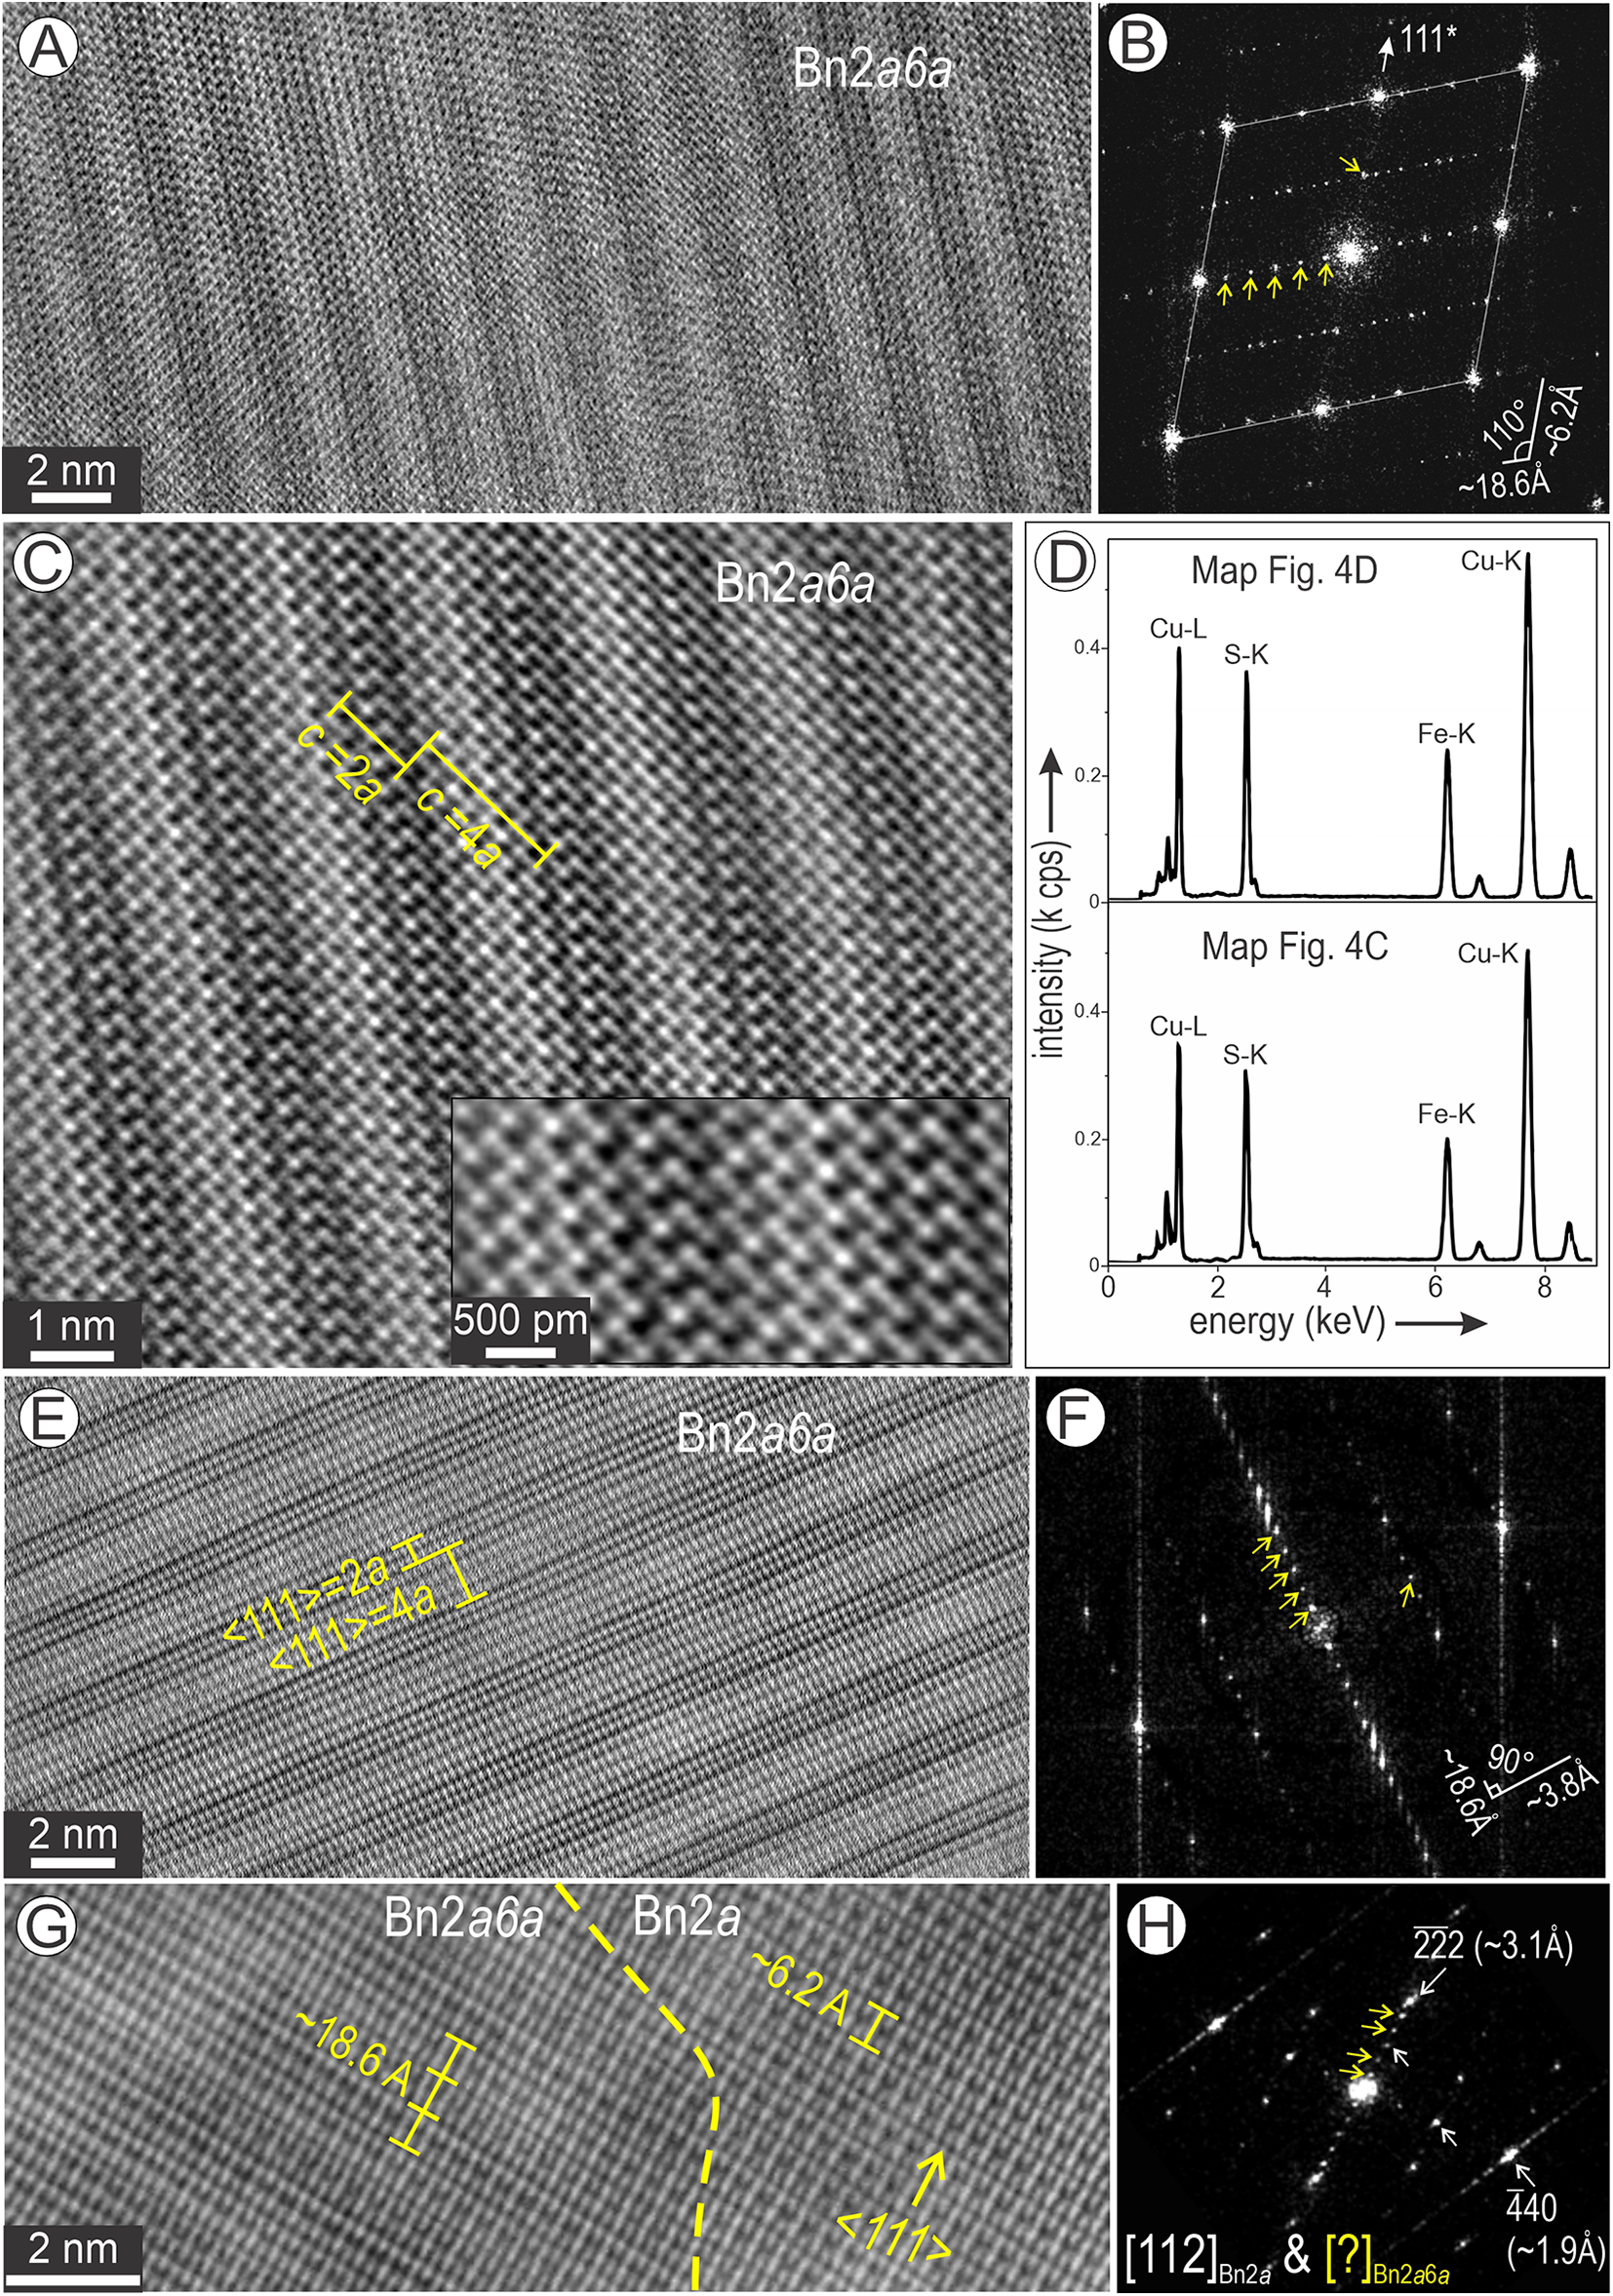
Bornite areas richer in Fe (Fig. 4C, D) show nanodomains with rhythmic banding of brighter and darker strips (Fig. 14). The first area (Fig. 14A) displays patterns resembling either Bnna or Dgna on [110] zone axes (Figs 7, 8). The FFT pattern shows 6a and 2a modulations along 111* directions (Fig. 14B). Assuming such structures, the widths measured on the long diagonal at ∼2 nm and 1 nm, respectively, could correspond to intergrowths between Dg4a and Bn2a superstructures (Fig. 14C). However, the Fe-rich composition of such domains, ∼Cu4Fe2S4 (spectra in Fig. 14D), cannot be matched when considering Cu-rich digenite. It is likely that the banded textures correspond to a superstructure of bornite, e.g. 2a6a2a, and the observed HAADF contrast on the image is attributable to antiphase boundary relationships.
Bornite (Bn) from Fe-rich domains displaying rhythmically banded strips interpreted as Bn2a6a superstructure. (A–C) High-resolution images and FFT pattern in (B) showing the 2- and 6-fold satellite reflections (arrowed) along 111* bornite directions. Dark and bright intervals correspond to c lengths in 2a and 4a bornite as labelled. Inset in (C) is a crop showing closer detail of the bright and dark strips. (D) Spectra of Fe-rich bornite obtained from maps as labelled. (E) Different orientation of the same Bn2a6a superstructure shown as a high-resolution image with bright and dark strips. (F) Corresponding FFT pattern displaying the same 2- and 6-fold satellite reflections (arrowed) along two directions in bornite. (G) Contact between [112] Bn2a and the inferred Bn2a6a with the same orientation as in (E). (H) FFT patterns showing additional satellite reflections (arrowed) along 111* due to the intergrowth with Bn2a6a.

The second area also displays rhythmic strips of different HAADF contrast with a periodicity of ∼6.2 Å and ∼12.3 Å for the dark and bright bands, respectively (Fig. 14E). The corresponding FFT pattern shows rectangular lattice vectors with 6- and 2-fold modulations relative to bright reflections at 3.1 Å and 1.9 Å (Fig. 14F). The distance 6 × 3.1 = 18.6 Å, is about the width of a bright + dark strip on the image (Fig. 14E). The image in Fig. 14E is obtained close to the contact with Bn2a tilted on [112] zone axis (Fig. 14G). The two phases display epitaxy, whereby three lengths of <111> Bn2a are equal to one pair of bright and dark strips. The coherence between the two species is also illustrated by the FFT pattern (Fig. 14H) representing the intergrowths in Fig. 14G.
Altogether, the two orientations show this bornite superstructure has 2-fold spacing on <001> and <110> lattice vectors and 6-fold on <111>, consistent with interpretation as a Bn2a6a2a superstructure. It could also be that such a superstructure is formed from pre-existing Bn2a4a, or by re-arrangement of Bn2a6a2a. Support for this interpretation can be seen in the image of Bn2a4a on [101] (Fig. 9E), which is comparable to the bright strips shown in Fig. 14C.
Discussion
Why HAADF STEM?
There are around a dozen published TEM studies of Cu-(Fe)-sulfides using conventional BF imaging (e.g. Putnis and Grace, Reference Putnis and Grace1976; Putnis, Reference Putnis1977; Pierce and Buseck, Reference Pierce and Buseck1978; Pósfai and Buseck, Reference Pósfai and Buseck1994; Ding et al., Reference Ding, Veblen and Prewitt2005a, Reference Ding, Veblen and Prewitt2005b; Ciobanu et al., Reference Ciobanu, Cook and Ehrig2017; Owen et al., Reference Owen, Ciobanu, Cook, Slattery and Basak2018). While such studies are insightful for showing intergrowths between different species or the derivation of superstructures from a parent structure, the images are heavily dependent upon thickness and focus. Moreover, the models produced for interpreting the images are not directly correlated with specific atomic positions (e.g. Pósfai and Buseck, Reference Pósfai, Buseck and Merlino1997). In contrast, HAADF STEM imaging reproduces the atomic positions which can be interpreted in tandem with crystal-structure models and simulations (e.g. Qin et al., Reference Qin, Yang, Jin, Yang, Zhang and Yang2024 and references therein).
The difference between HRTEM and HAADF STEM studies was also highlighted for pyrrhotites (Fe1–xS, where 0.125 > x > 0.080), in which vacancy ordering can induce crystal structure modifications. Pyrrhotites are a large group of sulfides in which slight changes in composition from stoichiometric FeS are accommodated by Fe vacancies and their ordering, resulting in different NC superstructures, with N (lattice parameter) being a multiple of NiAs-type subcell (e.g. Pósfai et al., Reference Pósfai, Sharp and Kontny2000 and references therein). In the case of 4C pyrrhotite, ordering of Fe vacancies was resolved with atomic spatial resolution using HAADF STEM imaging (Xu et al., Reference Xu, Shen and Konishi2015). The direct imaging was further quantified/constrained by complementary STEM simulations (Jin et al., Reference Jin, Koulialias, Schnedler, Gehring, Pósfai, Ebert, Charilaou, Schäublin, Jia, Löffler and Dunin-Borkowski2021). These results show that the earlier anti-phase boundary models derived from HRTEM studies (e.g. Harries et al., Reference Harries, Pollok and Langenhorst2011) are more complex in nature.
In this study, we show that HAADF STEM imaging, especially if combined with EDS STEM analysis and element-distribution mapping, is an optimal choice for depicting crystal structures or superstructures in the bornite–digenite series. The cubic polymorphs of bornite and digenite are identifiable from their FFT or SAED patterns, but recognising the atomic arrangements within these structures is paramount for understanding phase associations among Cu-Fe-sulfides and the evolution of the assemblages they compose. We show how, despite several models being available, only some of them fit the STEM images, e.g. the choice for Dg1a. The results support the existence of the Bn2a4a superstructure originally proposed by Koto and Morimoto (Reference Koto and Morimoto1975), even though this had been subsequently dismissed by Ding et al. (Reference Ding, Veblen and Prewitt2005b).
Ciobanu et al. (Reference Ciobanu, Cook and Ehrig2017) recognised the nanoscale basket-weave texture in the same type of material from Olympic Dam, but their interpretation, based solely on SAEDs of djurleite in the basket-weave rather than anilite/digenite, as determined in the present study, was incorrect. Even if the identification of anilite requires more specific modelling, this species is clearly none of the monoclinic members or polymorphs of the chalcocite group.
Cooling history – the bornite–digenite system
The present study shows that ‘bornite’, with apparent homogeneity at the micron-scale, consists of two main components which are distinct from one another both compositionally and structurally. However, while the simplest bornite superstructure (2a) represents one of these, the second consists of a digenite species, if we consider anilite to be the low-T orthorhombic polymorph of digenite (Morimoto and Koto, Reference Morimoto and Koto1970). Whereas cubic digenite is represented by two polymorphs, 1a- and 3a Dg, bornite has two orthorhombic polymorphs, 2a4a- and tentatively, 2a6a Bn, and only one cubic polymorph (2a). Epitaxial relationships between all these phases (Figs 9–14) suggest they are formed by phase transition during cooling from the Bn–Dg solid solution.
The plot in Fig. S5 shows calculated basket-weave chemistry in terms of a Bn–Dg solid solution along a join between the mean measured compositions of the two end-members as given in Table S1. The data cluster within the range of ∼87–70 mol.% Bn. The basket-weave compositions that show Fe in excess relative to the Bn–Dg tie-line are obtained from a domain containing chalcopyrite lamellae (Bn-Cp foil#6; map 9 on Fig. 4B) and from the Fe-rich bornite area in foil #7 (map 11 on Fig. 4D). Three of the six compositions representing Bn-Cc zone domains show an Fe deficit relative to the Bn–Dg tie-line. Such a result can be correlated with the abundance of anilite, which contains less Fe than the assumed digenite end-member.
The two published phase diagrams for the Bn–Dg solid solution (Morimoto and Kullerud, Reference Morimoto and Kullerud1966; Grguric et al., Reference Grguric, Harrison and Putnis2000), although differing from one another in terms of topology and upper solvus temperature stability limit, both acknowledge three domains comprising polymorphs undergoing phase transition from high- to intermediate- and low-temperature forms. Broadly, the two diagrams define the higher-T interval by cubic Bn2a + Dg1a/1a ss, followed by cubic Dg (or 1a ss) + orthorhombic bornite (Bn2a4a), and high-order cubic Dg superstructures (5aDg, 6aDg) + Bn2a4a in the lowest-T interval.
The new data show differences from the aforementioned diagrams, the most remarkable of which is the absence of any higher-order cubic polymorphs of digenite. We show the persistent co-existence of two cubic polymorphs, 2aBn and 1aDg (Fig. 10), throughout all analysed material. Assuming this association is attributable to the earliest formed phases and considering the 87–70 mol.% Bn composition interval for the basket-weave textures, we obtain upper temperature ranges of ∼280–330°C and 225–175°C using the Bn–Dg diagrams of Morimoto and Kullerud (Reference Morimoto and Kullerud1966) and Grguric et al. (Reference Grguric, Harrison and Putnis2000), respectively. When bornite 2a undergoes phase transformation to a lower temperature polymorph, Bn2a4a co-existing with Bn2a (Fig. 9), high-temperature digenite 1a remains stable.
The formation of anilite as a low-temperature polymorph of digenite (Figs 12, 13), below 120°C or 80°C, depending on which diagram we use, is part of the phase association in the low-T part of the diagram. At this stage, other low-temperature polymorphs could form. Indeed, we have imaged digenite 3a and the high-range superstructure of bornite tentatively considered as a 2a6a2a superstructure (Fig. 14).
The above interpretation, inferring that lower-T phases form as polymorphs of higher-T phases, is concordant with observed epitaxial relationships between all parent and derived structures.
Bornite 2a remains stable whereas Dg1a is present in minor amounts, having been replaced extensively by anilite. The excess Cu resulting from this transformation forms the basis for the occurrence of the latest chalcocite phase, tentatively identified as Dg5a-R (Donnay et al., Reference Donnay, Donnay and Kullerud1958), that form as thin needles, often at boundaries between domains of bornite and anilite/digenite (Fig. 5B,C). Some of these needles, however, crosscut pre-existing assemblages (Figs 4A,B, 5F) and, in some cases, also offset their boundaries implying subsolidus movement or displacement during cooling.
Phase stability and transformations during cooling – the digenite debate
Initial separation between bornite and digenite within densely packed basket-weave textures could be the reason for preservation of Bn2a in greater proportions than Dg1a, which is largely replaced by anilite, assuming different kinetic rates of phase transformation. Natural digenite commonly contains small amounts of Fe and a metastable digenite-type solid solution of the 5.5a type can occur with digenite (Morimoto and Gyobu, Reference Morimoto and Gyobu1971). The same authors carried out experiments on synthetic materials showing that the field of the homogeneous single phase with the 5a-type structure (digenite sensu stricto) extends from 0.4 to 1.6 atom.% Fe and from 36.15 to 36.55 atom.% S at room temperature and this is centred on the composition Cu6.9Fe0.1S4.
Whereas natural digenite containing Fe is only stable in the Cu–Fe–S system, digenite-type solid solution, this has a different stability field from the digenite-type solid solution (Cu1.75S–Cu1.8S) in the system Cu–S, which is metastable relative to anilite at room temperature (Morimoto and Koto, Reference Morimoto and Koto1970).
Two models of digenite transformation were proposed and debated in the literature from the 1960s and 1970s. The first model was based on X-ray diffraction studies suggesting the role of twinning in digenite (transformation from cubic to rhombohedral symmetry; Donnay et al., Reference Donnay, Donnay and Kullerud1958) and the presence of Fe in controlling formation of either (1) intermediate superstructures (6a, 5a, 5.2a, 5.7a), or (2) anilite (Morimoto et al., Reference Morimoto, Koto and Shimazaki1969; Koto and Morimoto, Reference Koto and Morimoto1970; Morimoto and Gyobu, Reference Morimoto and Gyobu1971). The second model was based on TEM studies that dismissed the role of twinning (Putnis, Reference Putnis1977; Conde et al., Reference Conde, Manolikas, Van Dyck, Delavignette, Van Landuyt and Amelinckx1978). Conde et al. (Reference Conde, Manolikas, Van Dyck, Delavignette, Van Landuyt and Amelinckx1978) documented the existence of 2a 0, 3a 0, 4a 0, 5a 0 and 6a 0, where a 0 is the (111) spacing in the cubic close-packed sulfur sublattice of synthetic digenite. These authors have also shown that periodic mixtures of 5a and 6a superstructures lead to non-rational spacings on SAEDs. Such a state of disorder accounts for systematic extinctions in the diffraction patterns previously associated with twinning (Morimoto et al., Reference Morimoto, Koto and Shimazaki1969; Morimoto and Koto, Reference Morimoto and Koto1970). Putnis (Reference Putnis1977) studied electron diffraction of natural digenite using heating-cooling experiments under the electron beam and demonstrated the formation of a 6a digenite prior to any anilite superstructure, an irreversible transformation.
The data presented here show that there are substantial differences between the products of experimental studies and those occurring in natural assemblages, a key result that will be further discussed below. The presence of Bn2a in contact with all other species described here (Bn2a4a, Bn2a6a, Dg1a, Dg3a and anilite; Figs 9–14) implies that phase transformations are controlled locally over nanoscale domains. These transformations are, in turn, determined by chemical (e.g. preferential distribution of trace elements such as the observed Ag in anilite/digenite; Fig. 3F) and physical heterogeneity (e.g. radial arrangement of anilite beside telluride inclusions; Fig. 3C). We can also assume that the much slower cooling rates in natural systems relative to experiments would arrest some reactions e.g. the greater stability of the Bn2a parent relative to digenite 1a.
Higher-order bornite superstructures
A second type of nanoscale heterogeneity is represented by the occurrence of Fe-rich bornite displaying a conspicuous higher-order superstructure (2a6a2a). While questions remain about what triggers the different proportions between the two initially separated phases, bornite and digenite, it is feasible to assume they reflect distinct primary bulk Cu/Fe ratios and are thus readily applicable in most natural ores. If we assume the accuracy of this hypothesis, then the presence of Fe-rich bornite fields next to the highest density of anilite in the absence of Dg5a-R needles (Fig. 5B) could be interpreted as forming from the excess Fe produced during a transition from digenite to anilite.
Recrystallisation of anilite as lamellar sets (Fig. 4D) is also tied to high-density phase separation. Such lamellae are atypical for the basket-weave texture, which is more typically characterised by lozenge-shaped, single-grain morphology (Fig. 6A). The lamellar anilite may relate to late stages of bornite evolution, and indeed, the high-range Bn2a6a superstructure in the adjacent area (Fig. 14) may also indicate its formation as a low-T polymorph. A similar late formation of the Fe-rich bornite can be inferred from the second occurrence of such domains adjacent to chalcopyrite lamellae (Fig. 5G). In this case, the Fe-rich bornite area post-dates formation of Dg5a-R needles.
Summary and implications
The key findings of this study are:
(1) The basket-weave texture in natural bornite with non-stoichiometric Cu/Fe ratios is real and not an artifact produced by sample preparation. Despite morphological and compositional variations, this texture comprises two main phases, Bn2a and anilite. Digenite 1a is preserved throughout, albeit as a minor phase.
(2) Two intermediate phases are documented as Dg3a and Bn2a4a. An additional phase, Bn2a6a, is tentatively suggested to occur in some Fe-rich nanodomains within Bn2a. The latest phase, resembling the twin-digenite structure of Dg5a-R is not considered part of the basket-weave assemblage as it can crosscut phase boundaries of the main species.
(3) Empirical models for Bn2a and Dg3a are generated to match the HAADF STEM images and were assessed by STEM simulations. These will, however, require further assessment by ab initio DFT crystal-structure calculations.
(4) Epitaxial relationships between all phases indicate the basket-weave texture records phase transitions via polymorphic transformation of parent Bn2a and Dg1a during cooling. If we consider anilite as a structural derivative of Dg1a, the observed phase assemblages can be linked to cooling of bornite–digenite solid solutions with compositions in the range 87–70 mol.% along a Cu6.18Fe1.26S5–Cu9.12Fe0.89S5 tieline defined from measured compositions.
(5) In the cooling scenario discussed in (4), there are three associations formed from high to low temperature: Bn2a + Dg1a; Bn2a4a + Dg3a; and Bn2a4a/Bn2a6a + anilite. Preservation of inferred high-T phases implies slower cooling rates in natural environments than those reported in experimental studies, explaining the differences in specific polymorph associations.
(6) The crystallisation of Pb-Bi-(sulfo)tellurides prior to formation of basket-weave textures could have resulted from exsolution of various chalcophile elements and chalcogens dissolved in Bn–Dg solid solutions. Retention of lattice-bound Ag in Cu-rich phases suggests a correlation between crystal structures and minor-element behaviour during cooling. We can speculate that Bn–Dg solid solutions would also scavenge Au from fluids, considering the high chalcophile affinity of this element.
Although well beyond the scope of the present study and requiring empirical confirmation, the aberrant behaviour of some Cu-(Fe)-sulfides in flotation circuits may plausibly be traced to subtle variations in structure and, by implication, to surface properties, in turn carrying major consequences for optimisation of operational parameters.
The study shows the suitability and relevance of HAADF STEM techniques in assessing Cu-Fe-sulfide polymorphs as, for example, none of the existing Bn2a models in the literature could be matched by imaging and simulations. Minor- and/or trace-element incorporation within superstructures, a process promoted during phase transitions among Cu-Fe-sulfides, is a subject of significant relevance for the enrichment of critical elements and precious metals in copper ores. We postulate that basket-weave textures and their nanoscale heterogeneity is the rule rather than exception in copper ores. The study also shows how digenite and its polymorphs form during hypogene ore processes rather than being tied to supergene alteration.
Supplementary material
The supplementary material for this article can
be found at https://doi.org/10.1180/mgm.2025.10104.
Acknowledgements
The authors acknowledge Microscopy Australia for instrument access. Animesh Basak is thanked for technical support during FIB analysis. The authors appreciate the constructive comments from three anonymous reviewers and helpful insights from Associate Editor, Owen Missen.
Financial statement
This research was funded by an Australian Research Council Linkage grant (LP200100156) to N.J.C. and K.E.
Competing interests
The authors declare none.


 Open access