


1. Introduction
Over the years, economists and policymakers have been searching for a variable, or combination of variables, to measure the stance of monetary policy. Monetarist authors of the 1960s and 1970s emphasized money supply measures as policy indicators, arguing that money leads output and prices and is positively related to changes in output in the short run and to changes in the price level in the long run. In fact, Friedman (Reference Friedman1970) advocated for a constant money growth rule, based on his argument that because monetary policy affects the economy with long and variable lags, attempts to use cyclical variation in the money supply for stabilization purposes would likely lead to increased instability.
However, using monetary aggregates as indicators of policy has been controversial. It has been argued that changes in monetary aggregates can result from factors other than changes in monetary policy, factors such as changes in money demand or bank behavior due to economic conditions over the business cycle. Another problem with using monetary aggregates as policy indicators is the documented instability of the relationship between the official simple-sum monetary aggregates that central banks produce and macroeconomic target variables, such as inflation and nominal income. Because of such problems, monetary aggregates began to play a minor role in monetary policy.
The current mainstream approach to monetary policy is based on the New Keynesian model and the use of interest rate rules, such as the ones put forward by Taylor (Reference Taylor1993, Reference Taylor1999), based on a short-term interest rate, such as the federal funds rate in the United States, as the monetary policy instrument. This model has also been extended to allow for interest rate corridors and nonconventional monetary policies (such as forward guidance, credit easing, and quantitative easing) and has become the main framework for the implementation of monetary policy in advanced and many emerging market economies. However, as Belongia and Ireland (Reference Belongia and Ireland2021, pp. 362) recently put it, “focusing entirely on interest rates and excluding measures of money, the strict New Keynesian model provides an overly narrow view of channels through which monetary policy affects the economy.”
In this regard, over the years, a large number of authors question the view that the stance of monetary policy can be described only with reference to its effects on interest rates and without taking into consideration movements in the money supply. See, for example, Barnett (Reference Barnett1978, Reference Barnett1980, Reference Barnett1987), Schunk (Reference Schunk2001), Barnett and Chauvet (Reference Barnett and Chauvet2011), Serletis and Rahman (Reference Serletis and Rahman2013), Serletis and Gogas (Reference Serletis and Gogas2014), Hendrickson (Reference Hendrickson2014), Belongia and Ireland (Reference Belongia and Ireland2014, Reference Belongia and Ireland2015, Reference Belongia and Ireland2016, Reference Belongia and Ireland2018), Ellington (Reference Ellington2018), Keating et al. (Reference Keating, Kelly, Smith and Valcarcel2019), Xu and Serletis (Reference Xu and Serletis2022), Ireland (Reference Ireland2025), Bordo and Duca (Reference Bordo and Duca2025), and Bordo et al. (Reference Bordo, Duca and Jones2025), among others. They argue that replacing simple-sum monetary aggregates with Barnett’s (Reference Barnett1980) Divisia monetary aggregates, solves many measurement problems and establishes significant economic relations between money and key macro variables. This is what is known as the Barnett Critique, with the term first coined in the literature by Chrystal and MacDonald (Reference Chrystal and MacDonald1994).
More recently, consistent with the Barnett Critique, Barnett et al. (Reference Barnett, Chauvet, Leiva-Leon and Su2024) and Barnett and Su (Reference Barnett and Su2016, Reference Barnett and Su2018, Reference Barnett and Su2019) derive Divisia monetary aggregates that jointly aggregate the deferred-payment transaction services provided by credit cards and the services provided by monetary assets. The new aggregates are known as the credit card-augmented Divisia and credit card-augmented Divisia inside monetary aggregates. Liu et al. (Reference Liu, Dery and Serletis2020) find that both the narrow and broad credit card-augmented Divisia aggregates are superior to the original Divisia aggregates, and that broad Divisia aggregates provide better measures of the flow of monetary services generated in the economy, consistent with Barnett (Reference Barnett2016), Jadidzadeh and Serletis (Reference Jadidzadeh and Serletis2019), and Dery and Serletis (Reference Dery and Serletis2021). Also, Barnett and Park (Reference Barnett and Park2022) find that credit-augmented Divisia monetary aggregates are the better indicators for forecasting inflation and output, Barnett and Park (Reference Barnett and Park2024) find that considering credit-related variables and shocks helps to interpret recent economic phenomena, with the credit-augmented Divisia aggregates being especially informative, and Barnett and Park (Reference Barnett and Park2025) find that in a New Keynesian framework the credit-augmented Divisia monetary aggregate tracks the theoretical (true) monetary aggregate, while the simple-sum monetary aggregate does not.
This paper, in the spirit of Serletis and Gogas (Reference Serletis and Gogas2014), Belongia and Ireland (Reference Belongia and Ireland2019), Barnett et al. (Reference Barnett, Ghosh and Adil2022), Chen and Valcarcel (Reference Chen and Valcarcel2025), and Bordo and Duca (Reference Bordo and Duca2025), examines the policy role of money by investigating the stability of money demand in the United States, using three different classic money demand specifications—the log–log money demand specification inspired by Meltzer (Reference Meltzer1963), the semi-log money demand specification adapted from Cagan (Reference Cagan1956), and the Selden (Reference Selden1956) and Latané (Reference Latane1960) specification. We elaborate on the “Barnett critique,” by providing a comprehensive comparison among the simple-sum monetary aggregates, the original Divisia monetary aggregates, the credit card-augmented Divisia monetary aggregates, and the credit card-augmented Divisia inside monetary aggregates. Our sample period includes the global financial crisis and the Covid-19 crisis, in the aftermath of which money experienced tremendous growth, thus offering a new perspective to revisit the role of money in policy decisions.
We use the Pesaran et al. (Reference Pesaran, Shin and Smith2001) cointegration testing approach, called AutoRegressive Distributed Lag (ARDL) bounds test, to test for cointegration between the monetary aggregates and their respective user costs. We interpret cointegration between the monetary aggregates and their user costs as implying long-run stability in the money demand relationship. That is, although the money demand variables may be individually nonstationary, cointegration implies a stable long-run equilibrium relationship between them. We employ the Center for Financial Stability (CFS) properly constructed user costs for the original (non-credit-card-augmented) Divisia monetary aggregates, the credit card-augmented Divisia monetary aggregates, and the credit card-augmented Divisia inside monetary aggregates. We also construct proper user costs for the simple-sum monetary aggregates using the correct dual to the simple sum index which is the unweighted Leontief index. Moreover, we address relevant economic disruptions over the sample period—the financial deregulation in the early 1980s, the global financial crisis of 2007-2009, and the Covid-19 pandemic—by incorporating dummy variables as fixed regressors.
With a long quarterly sample extending from 1967:q1 through 2025:q1, for which the original (non-credit-card-augmented) Divisia monetary aggregates are available, we find evidence of cointegration only between the Sum M4 monetary aggregate and its user cost. With a more recent sample since the mid-2006, which includes the global financial crisis and the Covid-19 pandemic and for which the credit-augmented Divisia aggregates are also available, we find strong evidence of stable money demand with all of the original Divisia aggregates and the credit-augmented Divisia aggregates under all three money demand specifications (but not with all of the credit-augmented Divisia inside aggregates). We also find evidence of cointegration with the Sum M3 and Sum M4 aggregates under all three money demand specifications, but not with the Fed’s Sum M2 aggregate; we find persistent instability with the Fed’s Sum M2 aggregate under all three money demand specifications. We add importantly to the literature, showing that broad monetary aggregates, irrespective of how they are measured, are essential for monetary policy and business cycle analysis.
The paper is organized as follows. Section 2 presents classic money demand specifications such as the log–log, semi-log, and Selden-Latané money demand forms. Section 3 provides a discussion of the different monetary aggregates used in our empirical investigation. In Section 4 we discuss the Pesaran et al. (Reference Pesaran, Shin and Smith2001) bounds tests for long-run level relationships and in Section 5 we present the data. In Section 6 we present empirical results for the existence of stable money demand functions providing a comparison across the different money demand specifications, the different types of monetary aggregates, and at different levels of monetary aggregation. In Section 7 we investigate the recent behavior of money demand and the final section concludes the paper and discusses the implications for monetary theory and policy and business cycle theory.
2. Classic money demand functions
We follow Belongia and Ireland (Reference Belongia and Ireland2019) who use an extension of the Lucas (Reference Lucas2000) variant of the money-in-the-utility function models of Sidrauski (Reference Sidrauski1967) and Brock (Reference Brock1974). The framework implicitly defines a money demand function of the form
 \begin{equation} \frac {M_{t}}{P_{t}c_{t}}=h(i_{t}-i_{t}^{a}) \end{equation}
where $M_{t}$
is the monetary aggregate,
$M_{t}$
is the monetary aggregate, $P_{t}c_{t}$
(where
$P_{t}c_{t}$
(where $P_{t}$
is the price level and
$P_{t}$
is the price level and $c_{t}$
real consumption) is personal consumption expenditure, and
$c_{t}$
real consumption) is personal consumption expenditure, and $(i_{t}-i_{t}^{a})$
is the user cost of
$(i_{t}-i_{t}^{a})$
is the user cost of $M_{t}$
(with
$M_{t}$
(with $i_{t}$
being the market interest rate and
$i_{t}$
being the market interest rate and $i_{t}^{a}$
the interest rate paid on the monetary aggregate,
$i_{t}^{a}$
the interest rate paid on the monetary aggregate, $M_{t}$
). In equation (1), the demand for the monetary aggregate,
$M_{t}$
). In equation (1), the demand for the monetary aggregate, $M_{t}$
, is a function of its user cost with unitary scale elasticity.
$M_{t}$
, is a function of its user cost with unitary scale elasticity.
Belongia and Ireland (Reference Belongia and Ireland2019) show that the money demand function (1) can take several classic formulations. For example, it can take the log–log form proposed by Meltzer (Reference Meltzer1963)
 \begin{equation} \ln \left ( \frac {M_{t}}{P_{t}c_{t}}\right ) =\beta _{0}-\beta _{1}\ln (i_{t}-i_{t}^{a}) \end{equation}
where $\beta _{1}\gt 0$
. Belongia and Ireland (Reference Belongia and Ireland2019) also show that the money demand function can take the semi-log form proposed by Cagan (Reference Cagan1956)
$\beta _{1}\gt 0$
. Belongia and Ireland (Reference Belongia and Ireland2019) also show that the money demand function can take the semi-log form proposed by Cagan (Reference Cagan1956)
 \begin{equation} \ln \left ( \frac {M_{t}}{P_{t}c_{t}}\right ) =\gamma _{0}-\gamma _{1}(i_{t}-i_{t}^{a})\text{.} \end{equation}
Another classic money demand specification is the one proposed by Selden (Reference Selden1956) and Latané (Reference Latane1960)
 \begin{equation} \frac {P_{t}c_{t}}{M_{t}}=\delta _{0}+\delta _{1}(i_{t}-i_{t}^{a}) \end{equation}
where $P_{t}c_{t}/M_{t}$
is the velocity of
$P_{t}c_{t}/M_{t}$
is the velocity of $M_{t}$
and
$M_{t}$
and $\delta _{1}\gt 0$
captures the effect of the user cost on velocity.
$\delta _{1}\gt 0$
captures the effect of the user cost on velocity.
According to Belongia and Ireland (Reference Belongia and Ireland2019) we can interpret the theoretical money demand specifications (2)–(4) as the potential long-run cointegration relationship between the measure of the demand for money and its user cost. However, these classic money demand functions are ad hoc, as they require very special functional forms for the underlying money utility function of the representative economic agent.
Over the years, most of the formal investigations of the demand for money have been carried out using the simple-sum monetary aggregates and the (original) Divisia monetary aggregates developed by Barnett (Reference Barnett1978, Reference Barnett1980). In the following section, we briefly review the different monetary aggregates available today and used in the empirical section of this paper.
3. The different types of money
3.1 Simple-sum monetary aggregates
The first issue in estimating money demand specifications like (2)–(4) concerns the choice of the monetary aggregate $M$
. The monetary aggregates currently in use by most central banks are simple-sum indices in which all financial assets are assigned a constant and equal (unitary) weight. This index is
$M$
. The monetary aggregates currently in use by most central banks are simple-sum indices in which all financial assets are assigned a constant and equal (unitary) weight. This index is $M_{t}$
in
$M_{t}$
in
 \begin{equation} M_{t}=\sum _{i=1}^{I}x_{it} \end{equation}
where $x_{it}$
is one of the
$x_{it}$
is one of the $I$
components of the aggregate
$I$
components of the aggregate $M_{t}$
. Simple-sum monetary aggregation implies that all component assets contribute equally to the money total. It made sense years ago, when assets had the same zero yield, but it is indefensible today, as it completely ignores the complex products and structures of modern economies.
$M_{t}$
. Simple-sum monetary aggregation implies that all component assets contribute equally to the money total. It made sense years ago, when assets had the same zero yield, but it is indefensible today, as it completely ignores the complex products and structures of modern economies.
3.2 The original Divisia monetary aggregates
Barnett (Reference Barnett1978, Reference Barnett1980) argued that the simple-sum monetary aggregates are inconsistent with economic aggregation theory, because they assume that the monetary assets are dollar for dollar perfect substitutes with the same user cost. He developed the Divisia monetary aggregates which do not assume perfect substitution between component assets (and hence permit different user costs of the component assets).
The original Divisia monetary aggregates developed by Barnett (Reference Barnett1978, Reference Barnett1980) do not include the services provided by credit cards. They aggregate over monetary assets treating them as durable goods. In this regard, Barnett (Reference Barnett1978) derived the formula for the real user cost of a monetary asset as
 \begin{equation} \pi _{it}^{a}=\frac {R_{t}-r_{it}^{a}}{1+{R_{t}}} \end{equation}
where $R_{t}$
is the rate of return on the benchmark asset and
$R_{t}$
is the rate of return on the benchmark asset and $r_{it}^{a}$
is the own rate of return on monetary asset
$r_{it}^{a}$
is the own rate of return on monetary asset $i$
(during period
$i$
(during period $t$
).
$t$
).
The Divisia monetary aggregate (in discrete time) computes the growth rate of the aggregate as the share-weighted average of its component growth rates
 \begin{equation} d\ln M_{t}=\sum _{i=1}^{I}s_{it}d\ln m_{it}^{a} \end{equation}
where $m_{it}^{a}$
denotes the real balances of monetary asset
$m_{it}^{a}$
denotes the real balances of monetary asset $i$
and
$i$
and
 \begin{equation*} s_{it}=\pi _{it}^{a}m_{it}^{a}/\sum _{i=1}^{I}\pi _{it}^{a}m_{it}^{a} \end{equation*}
is the expenditure share on monetary asset $i$
.
$i$
.
3.3 The credit card-augmented Divisia aggregates
The original Divisia monetary aggregates developed by Barnett (Reference Barnett1978, Reference Barnett1980) do not include the services provided by credit cards. Barnett et al. (Reference Barnett, Chauvet, Leiva-Leon and Su2024), using economic aggregation and index number theory, derived the credit card-augmented Divisia monetary aggregates which also include the transaction services of credit cards. In this regard, the cashless transaction, one of the most remarkable financial innovations in the modern financial system, intrigues the discussion of credit as an important driving force of economic fluctuations. We observe an increasing preference for credit cards which reduces the demand for cash significantly. Moreover, online shopping platforms are boosting the demand for cashless transactions, and the Covid-19 pandemic has made the preference for cashless transactions even stronger which is continuing even in the post-pandemic period.
According to Diary of Consumer Payment Choice 2023, the share of cash as a payment instrument among all payment modes decreased from 31% in 2016 to 18% in 2022. In contrast, the share of credit cards increased from 18% in 2016 to 31% in 2022 in the United States. The diary also reveals that 98% of consumers owned a debit, credit, or prepaid card which is even higher than the share of consumers reporting having a bank account in 2022. Besides, 79.3% of consumers adopted credit cards in 2022 according to the diary. Thus, credit cards are becoming more common in regular transactions and thereby, the contribution of credit cards to monetary services is becoming more relevant than at any time in the past which ratifies the investigation of the role of credit cards in money demand through the credit-augmented Divisia monetary aggregates.
Under the assumption of risk neutrality, Barnett et al. (Reference Barnett, Chauvet, Leiva-Leon and Su2024) derive the user cost of credit card transaction services, $\pi _{lt}^{c}$
, as
$\pi _{lt}^{c}$
, as
 \begin{equation} \pi _{lt}^{c}=\frac {e_{lt}-R_{t}}{1+R_{t}} \end{equation}
where $e_{lt}$
is the expected interest on the credit card transaction
$e_{lt}$
is the expected interest on the credit card transaction $l$
and
$l$
and $R_{t}$
is as before the rate of return on the benchmark asset. The credit card-augmented Divisia monetary aggregate is then given by
$R_{t}$
is as before the rate of return on the benchmark asset. The credit card-augmented Divisia monetary aggregate is then given by
 \begin{equation} d\ln M_{t}=\sum _{i=1}^{I}s_{it}d\ln m_{it}^{a}+\sum _{l=1}^{L}s_{lt}d\ln m_{lt}^{c} \end{equation}
where
 \begin{equation*} s_{it}=\pi _{it}^{a}m_{it}^{a}/\left(\sum _{i=1}^{I}\pi _{it}^{a}m_{it}^{a}+\sum _{l=1}^{L}\pi _{lt}^{c}m_{lt}^{c}\right) \end{equation*}
is the user-cost-evaluated expenditure share of monetary asset $i$
,
$i$
, $ i=1,\ldots ,I$
, and
$ i=1,\ldots ,I$
, and
 \begin{equation*} s_{lt}=\pi _{lt}^{c}m_{lt}^{c}/\left(\sum _{i=1}^{I}\pi _{it}^{a}m_{it}^{a}+\sum _{l=1}^{L}\pi _{lt}^{c}m_{lt}^{c}\right) \end{equation*}
is the user-cost-evaluated expenditure share of credit card transaction $l$
,
$l$
, $l=1,\ldots ,L$
.
$l=1,\ldots ,L$
.
3.4 The credit card-augmented Divisia inside aggregates
The original Divisia monetary aggregates and the credit card-augmented Divisia aggregates emphasize the demand side of liquidity services. However, conditions from the supply side of liquidity services are at least equally important. In this regard, the monetary services produced by financial firms are known as inside money and are highly relevant to the transmission mechanism of monetary policy. In fact, quantitative easing during the global financial crisis and the coronavirus pandemic, with the goal of affecting the supply of liquid assets, impacted inside money directly.
To account for the monetary services produced by deposit-based financial firms, Barnett (Reference Barnett1987) introduced Divisia supply monetary aggregates which are based upon supply-side aggregation theory, in the context of a conventional neoclassical model of financial intermediary monetary assets supply. These aggregates highlight the existence of noninterest-bearing required reserves for banks. This is important, because a regulatory wedge is created for the user of the monetary services produced by banks. Thus, the user cost of a monetary asset needs to subtract the implicit tax as follows
 \begin{equation} \pi _{it}^{a}=\frac {(1-k_{i})R_{t}-r_{it}}{1+R_{t}} \end{equation}
where $k_{i}$
is the required reserve ratio on monetary asset
$k_{i}$
is the required reserve ratio on monetary asset $i$
.
$i$
.
Barnett and Su (Reference Barnett and Su2018) construct the credit card-augmented Divisia inside monetary aggregates as in equation (9) with quantities demanded, $m_{it}^{a}$
, replaced by quantities supplied and with paid user costs,
$m_{it}^{a}$
, replaced by quantities supplied and with paid user costs, $\pi _{it}^{a}$
, replaced by received user costs calculated as in equation (10). It is to be noted that in constructing the credit-augmented Divisia inside aggregates, the required reserve ratios,
$\pi _{it}^{a}$
, replaced by received user costs calculated as in equation (10). It is to be noted that in constructing the credit-augmented Divisia inside aggregates, the required reserve ratios, $k_{i}$
, for all component assets
$k_{i}$
, for all component assets $i$
are set equal to zero starting in March 2020, when the Federal Reserve eliminated reserve requirements for all classes of bank deposits. Moreover, the credit-augmented Divisia inside aggregates exclude currency and the credit-augmented Divisia inside M4 aggregate excludes Treasury bills as well.
$i$
are set equal to zero starting in March 2020, when the Federal Reserve eliminated reserve requirements for all classes of bank deposits. Moreover, the credit-augmented Divisia inside aggregates exclude currency and the credit-augmented Divisia inside M4 aggregate excludes Treasury bills as well.
In what follows, we posit our empirical work on the simple-sum monetary aggregates, the original Divisia monetary aggregates, and the most recently developed credit card-augmented Divisia monetary aggregates and credit card-augmented Divisia inside monetary aggregates.
4. The bounds testing approach to cointegration
We apply the Pesaran et al. (Reference Pesaran, Shin and Smith2001) procedure in our investigation of a long run relationship between the money-consumption ratio (denoted by $ m_{t}$
),
$ m_{t}$
), $M_{t}/P_{t}c_{t}$
, or the consumption velocity of money (denoted by
$M_{t}/P_{t}c_{t}$
, or the consumption velocity of money (denoted by $v_{t}$
),
$v_{t}$
), $P_{t}c_{t}/M_{t}$
, as a measure of the real demand for money and the level of the user cost. This approach has a number of advantages over the Engle and Granger (Reference Engle and Granger1987) and Johansen (Reference Johansen1988) methods for testing cointegration. It offers flexibility in variable integration orders and can be applied regardless of whether the underlying regressors are integrated of order zero [or I(0) in the terminology of Engle and Granger (Reference Engle and Granger1987)], I(1), or a mix of both; the Engle-Granger and Johansen approaches require all variables to be I(1). It allows for lag structure optimization based on standard lag length selection criteria such as the Akaike Information Criterion (AIC). Moreover, the ARDL bounds procedure performs well in small samples whereas the Johansen approach requires large samples to produce reliable estimates and test statistics.
$P_{t}c_{t}/M_{t}$
, as a measure of the real demand for money and the level of the user cost. This approach has a number of advantages over the Engle and Granger (Reference Engle and Granger1987) and Johansen (Reference Johansen1988) methods for testing cointegration. It offers flexibility in variable integration orders and can be applied regardless of whether the underlying regressors are integrated of order zero [or I(0) in the terminology of Engle and Granger (Reference Engle and Granger1987)], I(1), or a mix of both; the Engle-Granger and Johansen approaches require all variables to be I(1). It allows for lag structure optimization based on standard lag length selection criteria such as the Akaike Information Criterion (AIC). Moreover, the ARDL bounds procedure performs well in small samples whereas the Johansen approach requires large samples to produce reliable estimates and test statistics.
Although the Pesaran et al. (Reference Pesaran, Shin and Smith2001) cointegration testing approach has many advantages, it also has some important limitations—see, for example, Sam et al. (Reference Sam, McNown and Goh2019) and Bertelli et al. (Reference Bertelli, Vacca and Zoia2022). One of the limitations is that the test becomes invalid if any of the variables is integrated of order 2 [or I(2) in the terminology of Engle and Granger (Reference Engle and Granger1987)]. In our case, however, as supported by unit root and stationarity tests, none of the variables is I(2). Another limitation is that the test is sensitive to model specification. In particular, omitted variables and incorrect choice of lag length can lead to misleading results. We address this issue by careful lag length selection using the AIC criterion and by incorporating dummy variables as fixed regressors to address relevant economic disruptions over the sample period (as discussed in the next section).
We follow Pesaran et al. (Reference Pesaran, Shin and Smith2001) and consider the following vector error correction model
 \begin{equation} \Delta {{\boldsymbol{{Z}}}} _{\boldsymbol{{t}}}=\boldsymbol{\rho }+\boldsymbol{\psi } {{\boldsymbol{{Z}}}} _{\boldsymbol{{t}}-\textbf{1}}+\sum _{i=1}^{p}\boldsymbol{\eta}_{\boldsymbol{{i}}}\Delta {{\boldsymbol{{Z}}}} _{\boldsymbol{{i}}}+\boldsymbol{\varepsilon}_{\boldsymbol{{t}}} \end{equation}
where ${\boldsymbol{{Z}}}$ $_{\boldsymbol{{t}}}=[y_{t}$ $x_{t}]^{^{\prime }}$
with
$x_{t}]^{^{\prime }}$
with $y_{t}$
representing a logged scaled monetary aggregate,
$y_{t}$
representing a logged scaled monetary aggregate, $\ln (M_{t}/P_{t}c_{t})$
, or its logged consumption velocity,
$\ln (M_{t}/P_{t}c_{t})$
, or its logged consumption velocity, $\ln (P_{t}c_{t}/M_{t})$
, and
$\ln (P_{t}c_{t}/M_{t})$
, and $x_{t}$
indicating its user cost, according to the money demand specifications (2)–(4). In equation (11),
$x_{t}$
indicating its user cost, according to the money demand specifications (2)–(4). In equation (11), $\boldsymbol{\rho } =[\rho _{y}$ $\rho _{x}]^{^{\prime }}$
is a vector of constant terms and the disturbance terms is
$\rho _{x}]^{^{\prime }}$
is a vector of constant terms and the disturbance terms is $\boldsymbol{\varepsilon}_{\boldsymbol{{t}}}=[\varepsilon _{y}$ $ \varepsilon _{x}]^{^{\prime }}\sim N(\boldsymbol{0}$
,
$ \varepsilon _{x}]^{^{\prime }}\sim N(\boldsymbol{0}$
, $\boldsymbol{\ \Omega } )$
assuming a positive definite
$\boldsymbol{\ \Omega } )$
assuming a positive definite $\boldsymbol{\Omega }$
defined as
$\boldsymbol{\Omega }$
defined as
 \begin{equation*} \begin{bmatrix} \omega _{yy} & \omega _{yx} \\ \omega _{yx} & \omega _{xx} \end{bmatrix} \end{equation*}
and
 \begin{equation*} \boldsymbol{\eta }_{\boldsymbol{{i}}}= \begin{bmatrix} \eta _{yy,i} & \eta _{yx,i} \\ \eta _{xy,i} & \eta _{xx,i} \end{bmatrix} =\sum _{l=i+1}^{p}\mathbf{\Theta }_{l}\text{.} \end{equation*}
From equation (11), the long-run multiplier matrix $\boldsymbol{\eta }$
can be partitioned with
$\boldsymbol{\eta }$
can be partitioned with ${\boldsymbol{{Z}}}$ $_{\boldsymbol{{t}}}$
as below
$_{\boldsymbol{{t}}}$
as below
 \begin{equation*} \boldsymbol{\psi }= \begin{bmatrix} \psi _{yy} & \psi _{yx} \\ \psi _{xy} & \psi _{xx} \end{bmatrix} =-{ {{\boldsymbol{{I}}}} }-\sum _{i=1}^{p}\mathbf{\Theta }_{i} \end{equation*}
where $\boldsymbol{\Theta}_{\boldsymbol{{i}}}$
is the matrix of the VAR parameters and
$\boldsymbol{\Theta}_{\boldsymbol{{i}}}$
is the matrix of the VAR parameters and ${\boldsymbol{{I}}}$
indicates a
${\boldsymbol{{I}}}$
indicates a $2\times 2$
identity matrix. Assuming
$2\times 2$
identity matrix. Assuming $\psi _{xy}=0$
with unrestricted diagonal elements of
$\psi _{xy}=0$
with unrestricted diagonal elements of $\boldsymbol{\psi }$
, the conditional error correction model takes the following form
$\boldsymbol{\psi }$
, the conditional error correction model takes the following form
 \begin{equation} \Delta y_{t}=\alpha +\Lambda y_{t-1}+\theta x_{t-1}+\omega \Delta x_{t}+\sum _{i=1}^{p-1}\Psi _{yi}\Delta y_{t-i}+\sum _{i=1}^{q-1}\Psi _{xi}\Delta x_{t-i}+\nu _{t}\text{.} \end{equation}
In equation (12), $\alpha =\rho _{y}-\omega \rho _{x}$
,
$\alpha =\rho _{y}-\omega \rho _{x}$
, $\Lambda =\psi _{yy}$
,
$\Lambda =\psi _{yy}$
, $\theta =\psi _{yx}-\omega \psi _{xx}$
,
$\theta =\psi _{yx}-\omega \psi _{xx}$
, $\delta _{xi}=\eta _{yx,i}-\omega \eta _{xx,i}$
, and
$\delta _{xi}=\eta _{yx,i}-\omega \eta _{xx,i}$
, and $\delta _{yi}=\eta _{yy,i}-\omega \eta _{xy,i}$
. For
$\delta _{yi}=\eta _{yy,i}-\omega \eta _{xy,i}$
. For $k$
regressors,
$k$
regressors, $p(q+1)^{k}$
number of regressions are run to determine the optimal lag length based on minimization of the AIC. We also adjust the lag length to check the serial correlation if necessary.
$p(q+1)^{k}$
number of regressions are run to determine the optimal lag length based on minimization of the AIC. We also adjust the lag length to check the serial correlation if necessary.
Graphical examination of the data allows us to select one of the five cases of the data generating process (DGP) suggested by Pesaran et al. (Reference Pesaran, Shin and Smith2001); the graphical analysis of the data indicates if the related specification requires a constant and trend. In particular, the five DGPs suggested by Pesaran et al. (Reference Pesaran, Shin and Smith2001), Cases 1–5, indicate a DGP with no constant and no trend, a DGP with a restricted constant and no trend, a DGP with unrestricted constant and no trend, a DGP with restricted linear trend and unrestricted constant, and a DGP with unrestricted constant and unrestricted linear trend, respectively. For consistency purposes we choose the most flexible DGP, which is Case 5. We also add dummy variables to address relevant economic disruptions over the sample period—the financial deregulation in the early 1980s, the global financial crisis of 2007–2009, and the Covid-19 pandemic—thus identifying the specification of the deterministic regressors in the long-run relationship.
Ordinary least squares (OLS) is the typical estimation method of ARDL models. Following the estimation of the ARDL model, we diagnose the residuals for serial correlation and heteroskedasticity using Breusch–Godfrey serial correlation LM test and the Breusch–Pagan–Godfrey test, respectively. For the serial correlation issue, we adjust the number of lags for both dependent and independent variables while for the heteroskedasticity issue, we apply the Heteroskedasticity and Autocorrelation Consistent (HAC) covariance matrix adjustment. When the regression becomes free of the two issues, especially of serial correlation which confirms unbiased estimates, we carry out the two bounds tests starting with the $F$
-bounds test to examine the null hypothesis of a “no levels relationship,” i.e.
$F$
-bounds test to examine the null hypothesis of a “no levels relationship,” i.e. $\Lambda =\theta =0$
in equation (12) against the alternative hypothesis of
$\Lambda =\theta =0$
in equation (12) against the alternative hypothesis of $\Lambda \neq 0$
and
$\Lambda \neq 0$
and $\theta \neq 0$
. With an
$\theta \neq 0$
. With an $F$
-statistic value below the I(0) critical value bound, we fail to reject the null hypothesis. When the statistic value is above the I(1) critical value bound, it allows us to reject the null. However, if the
$F$
-statistic value below the I(0) critical value bound, we fail to reject the null hypothesis. When the statistic value is above the I(1) critical value bound, it allows us to reject the null. However, if the $F$
-statistic value lies between the I(0) and I(1) critical values, our decision on the existence of a cointegrating relationship becomes inconclusive.
$F$
-statistic value lies between the I(0) and I(1) critical values, our decision on the existence of a cointegrating relationship becomes inconclusive.
In the case of rejecting the null hypothesis based on the $F$
-bounds test, we continue our investigation to examine the nature of the cointegrating relationship. This further investigation is possible with no restrictions on the constant or trend in the cointegrating relationship—i.e., Case 5 in Pesaran et al. (Reference Pesaran, Shin and Smith2001). Here, we apply the
$F$
-bounds test, we continue our investigation to examine the nature of the cointegrating relationship. This further investigation is possible with no restrictions on the constant or trend in the cointegrating relationship—i.e., Case 5 in Pesaran et al. (Reference Pesaran, Shin and Smith2001). Here, we apply the $t$
-bounds test with the null hypothesis of a “no sensical levels relationship” where the
$t$
-bounds test with the null hypothesis of a “no sensical levels relationship” where the $t$
-statistic has a non-standard distribution. We use Pesaran et al. (Reference Pesaran, Shin and Smith2001) suggested appropriate critical values to reach a decision on the cointegrating relationship. The decision process is similar to the
$t$
-statistic has a non-standard distribution. We use Pesaran et al. (Reference Pesaran, Shin and Smith2001) suggested appropriate critical values to reach a decision on the cointegrating relationship. The decision process is similar to the $F$
-bounds test—i.e., when the absolute value of the
$F$
-bounds test—i.e., when the absolute value of the $t$
-statistic falls below the corresponding I(0) critical value, we fail to reject the null hypothesis and conclude with a nonsensical cointegrating relationship. On the contrary, when the absolute value of the
$t$
-statistic falls below the corresponding I(0) critical value, we fail to reject the null hypothesis and conclude with a nonsensical cointegrating relationship. On the contrary, when the absolute value of the $t$
-statistic lies above the corresponding I(1) critical value, we take the cointegrating relationship as a standard one. An absolute value of the
$t$
-statistic lies above the corresponding I(1) critical value, we take the cointegrating relationship as a standard one. An absolute value of the $t$
-statistic between the I(0) and I(1) critical values leads to an ambiguous conclusion regarding the type of the cointegrating relationship. However, for the sake of comprehensive interpretation of results, finding a cointegrating relationship in our study means a sensical cointegrating relationship. Otherwise, the relationship is either non-cointegrating or inconclusive.
$t$
-statistic between the I(0) and I(1) critical values leads to an ambiguous conclusion regarding the type of the cointegrating relationship. However, for the sake of comprehensive interpretation of results, finding a cointegrating relationship in our study means a sensical cointegrating relationship. Otherwise, the relationship is either non-cointegrating or inconclusive.
5. The data
We use quarterly data for the United States and provide a comparison across the simple-sum monetary aggregates, the original Divisia monetary aggregates, and the credit-augmented Divisia and credit-augmented Divisia inside monetary aggregates. Table 1 provides a summary of the data used. The sample period for the simple-sum and the original Divisia monetary aggregates is 1967:q1 to 2025:q1 and for the credit-augmented Divisia and the credit-augmented Divisia inside monetary aggregates is 2006:q3 to 2025:q1. Both sample periods include the global financial crisis and the Covid-19 crisis, in the aftermath of which money experienced tremendous growth when the policy rate was driven down to the zero lower bound. In fact, the monetary dynamics during the global financial crisis and the Covid-19 crisis offer a new perspective to revisit the role of money in policy decisions as the policy rate alone falls short of explaining different inflation outcomes with a roughly equal-sized quantitative easing by the Federal Reserve during the global financial crisis and the Covid-19 crisis.
Data sample and sources

FRED = Federal Reserve Economic Data, CFS = Center for Financial Stability.
*The simple-sum M3 and M4 aggregates are based on the authors’ calculations using CFS components.
**Based on authors’ calculations using the unweighted Leontief index. PCE is required to construct scaled monetary aggregates.
The CFS is the source of all the Divisia monetary aggregates and their corresponding user costs. On the other hand, the Federal Reserve Economic Database (FRED), maintained by the Federal Reserve Bank of St. Louis, is the source of the Sum M1 and Sum M2 monetary aggregates. As the Sum M3 and Sum M4 monetary aggregates are not readily available, we calculate these two aggregates using the CFS components data and the definitions given in Table 2 [taken from Isakin and Serletis (Reference Isakin and Serletis2025)]. It is also to be noted that our series reflect the measurement changes of May 2020, when saving deposits and MMDAs became parts of M1. Finally, we use the Personal Consumption Expenditure (PCE), also collected from FRED, as the scaling variable, $P_{t}c_{t}$
, consistent with Ireland (Reference Ireland2025) who argues that consumption-based measures of transactions and inflation are preferable due to distortions in the measurement of the GDP deflator.
$P_{t}c_{t}$
, consistent with Ireland (Reference Ireland2025) who argues that consumption-based measures of transactions and inflation are preferable due to distortions in the measurement of the GDP deflator.
Monetary assets/components and aggregates

Notes: Asset $x_1$
(Cash assets) includes currency, traveler’s checks, and demand deposits. Asset
$x_1$
(Cash assets) includes currency, traveler’s checks, and demand deposits. Asset $x_2$
(Other liquid deposits) includes OCDs, saving deposits, and MMDAs at commercial banks and thrift institutions. Asset
$x_2$
(Other liquid deposits) includes OCDs, saving deposits, and MMDAs at commercial banks and thrift institutions. Asset $x_4$
(Small time deposits) includes small-denomination and small time deposits at commercial banks and thrift institutions.
$x_4$
(Small time deposits) includes small-denomination and small time deposits at commercial banks and thrift institutions.
In estimating money demand relationships with the simple-sum aggregates, many papers in the literature have used the T-bill rate as a variable in the money demand function. However, the T-bill rate is an interest rate, not a user cost (the user cost is foregone interest, not interest earned). An alternative, still in the flawed simple-sum tradition, is to construct an own rate series for each of the simple-sum monetary aggregates as a value-weighted average of the interest rates paid by the component assets; a series like this for Sum M2 was compiled by the Federal Reserve until 2019 (see https://fred.stlouisfed.org/series/M2OWN). To avoid the bias favouring Divisia monetary aggregates for which we use the properly constructed CFS user cost measures, we also construct proper user cost measures for the simple sum aggregates. In this regard, as Barnett (Reference Barnett1980) argues, the correct dual to the simple sum is the unweighted Leontief index, and that is the minimum user cost price, which would be the user cost price for the component having the highest own interest rate of return. In Appendix Figures A1, A2, A3 and A4, we show the user cost series for each monetary aggregate and at each level of monetary aggregation (normalized to take the value of 100 in 2006:q3).
Finally, as mentioned earlier, we use dummy variables as fixed regressors to address relevant economic disruptions: the 1980s financial deregulation, the global financial crisis (GFC), and the Covid-19 pandemic. To capture the impact of financial deregulation, we use a dummy variable taking the value of 1 in the period 1980:q2 to 1982:q4 and zero otherwise. The dummy starts with the enactment of the Depository Institutions Deregulation and Monetary Control Act (March 31, 1980:q2) and ends with the Garn–St. Germain Act (October 15, 1982:q4), capturing the core legislative wave of deregulation. For the GFC dummy, we assign a value of 1 for the period 2007:q3 to 2009:q2 and zero otherwise. The starting point, 2007:q3, corresponds to the onset of financial turbulence in the U.S. financial markets and the end point, 2009:q2, is supported by various sources, including the Federal Reserve’s historical account of the Great Recession period. Similarly, the Covid-19 dummy takes a unit value in the period 2020:q1 to 2021:q2 and zero otherwise. The starting point, 2020:q1, corresponds to the first U.S. case of Covid-19 reported in Washington in January 2020 and the WHO’s declaration of the pandemic in March 2020. The end point, 2021:q2, reflects the beginning of the U.S. economic recovery following significant progress in vaccinations during the first half of 2021, as documented in the Federal Reserve’s July 2021 Monetary Policy Report.
We process our data to obtain the model variables as described in the money demand specifications (2)–(4). Scaling each monetary aggregate with PCE provides us with PCE-scaled monetary aggregates. Then we do a log transformation of each PCE-scaled monetary aggregate to obtain the logged PCE-scaled monetary aggregate, $\ln \left ( M_{t}/P_{t}c_{t}\right )$
, a primary variable for our econometric exercise according to specifications (2) and (3). We calculate the consumption velocity of each monetary aggregate,
$\ln \left ( M_{t}/P_{t}c_{t}\right )$
, a primary variable for our econometric exercise according to specifications (2) and (3). We calculate the consumption velocity of each monetary aggregate, $P_{t}c_{t}/M_{t}$
, by scaling the PCE by the respective monetary aggregate. We also perform a log transformation of the user costs when we estimate the money demand specification (2). In Figures 1, 3, 5, and 7 we plot the logged levels of the simple-sum monetary aggregates, the original Divisia aggregates, the credit-augmented Divisia aggregates, and the credit-augmented Divisia inside aggregates at each level of monetary aggregation, M1, M2, M3, and M4, with the sum and the original Divisia aggregates normalized to take the value of 100 in 2006:q3, consistent with the CFS normalization of the credit-augmented Divisia aggregates. Similarly, the annualized growth rates of the monetary aggregates at the M1, M2, M3, and M4 levels of aggregation are shown in Figures 2, 4, 6, and 8, respectively. In Figures 1–8, as already noted, the sample period for the simple-sum and the original Divisia monetary aggregate is 1967:q1 to 2025:q1 and that for the credit-augmented Divisia aggregates is 2006:q3 to 2025:q1.
$P_{t}c_{t}/M_{t}$
, by scaling the PCE by the respective monetary aggregate. We also perform a log transformation of the user costs when we estimate the money demand specification (2). In Figures 1, 3, 5, and 7 we plot the logged levels of the simple-sum monetary aggregates, the original Divisia aggregates, the credit-augmented Divisia aggregates, and the credit-augmented Divisia inside aggregates at each level of monetary aggregation, M1, M2, M3, and M4, with the sum and the original Divisia aggregates normalized to take the value of 100 in 2006:q3, consistent with the CFS normalization of the credit-augmented Divisia aggregates. Similarly, the annualized growth rates of the monetary aggregates at the M1, M2, M3, and M4 levels of aggregation are shown in Figures 2, 4, 6, and 8, respectively. In Figures 1–8, as already noted, the sample period for the simple-sum and the original Divisia monetary aggregate is 1967:q1 to 2025:q1 and that for the credit-augmented Divisia aggregates is 2006:q3 to 2025:q1.
Logged monetary aggregates at the M1 level of aggregation.
Note: The vertical line indicates the quarter (2006:q3) at which the aggregates were normalized to 100 (before taking the logs).

Year-over-year growth rates of the monetary aggregates at the M1 level of aggregation.

Logged monetary aggregates at the M2 level of aggregation.
Note: The vertical line indicates the quarter (2006:q3) at which the aggregates were normalized to 100 (before taking the logs).

Year-over-year growth rates of the monetary aggregates at the M2 level of aggregation.

Logged monetary aggregates at the M3 level of aggregation.
Note: The vertical line indicates the quarter (2006:q3) at which the aggregates were normalized to 100 (before taking the logs).

Year-over-year growth rates of the monetary aggregates at the M3 level of aggregation.

Logged monetary aggregates at the M4 level of aggregation.
Note: The vertical line indicates the quarter (2006:q3) at which the aggregates were normalized to 100 (before taking the logs).

Year-over-year growth rates of the monetary aggregates at the M4 level of aggregation.

As can be seen in Figure 1, the simple-sum M1 and the original Divisia M1 aggregates move coherently until 1982 following which there are observable misalignments in their paths. The Sum M1 aggregate remained above the original Divisia aggregate over the whole sample period except for a brief period between 2006 and 2010. However, in growth terms, the Sum M1 aggregate over-shadowed the original Divisia M1 aggregate in the 1980s, during the global financial crisis of 2007-2008, and the Covid-19 pandemic. Figures 3 and 4 plot the monetary aggregates and their growth rates, respectively, at the M2 level of monetary aggregation. They show a different picture compared with the aggregates at the M1 level (in Figures 1 and 2). The Sum M2 and the original Divisia M2 aggregates move almost simultaneously for the period from 1985 onwards and there is also simultaneous movement in their growth rates that starts in 1996 as shown in Figure 4. At the M3 and M4 levels of aggregation, the original Divisia aggregates overweigh the corresponding sum aggregates before the mid 2000s, but after that the sum aggregates overweigh the Divisia ones. In growth terms, the Sum M3 and Sum M4 aggregates seem to outweigh the growth of the corresponding Divisia measures in periods other than during the financial deregulation in the 1980s and the period following the global financial crisis. However, during the Covid-19 pandemic, the growth rates of the Sum M3 and Sum M4 aggregates are significantly different than those of the corresponding Divisia aggregates.
Logged PCE-scaled monetary aggregates at the M1 level of aggregation.
Note: The vertical line indicates the quarter (2006:q3) at which the aggregates were normalized to 100 (before taking the logs).

Year-over-year growth rates of the PCE-scaled monetary aggregates at the M1 level of aggregation.

Consumption velocity of monetary aggregates at the M1 level of aggregation.
Note: The vertical line indicates the quarter (2006:q3) at which the aggregates were normalized to 100.

Logged PCE-scaled monetary aggregates at the M2 level of aggregation.
Note: The vertical line indicates the quarter (2006:q3) at which the aggregates were normalized to 100 (before taking the logs).

Year-over-year growth rates of the PCE-scaled monetary aggregates at the M2 level of aggregation.

Consumption velocity of monetary aggregates at the M2 level of aggregation.
Note: The vertical line indicates the quarter (2006:q3) at which the aggregates were normalized to 100.

In Figures 1, 3, 5, and 7 (and to a larger degree in Figures 2, 4, 6, and 8) we also observe differences in growth across the different monetary aggregates in the period after the global financial crisis and the post-Covid-19 recovery although the Fed’s quantitative easing was roughly equal in both cases. These differences could be explained in the framework set by Ryan and Whelan (Reference Ryan and Whelan2023) and Reynard (Reference Reynard2023) who argue that banks’ willingness and capacity to engage in retail lending shifted because of the rise in bank loan losses during 2008-2010 and the impending higher capital and liquidity requirements under the Dodd-Frank Act which reduced the money multiplier. Despite an increase in reserves driven by quantitative easing, the adverse effects on the money multiplier led to the falling money growth during 2007–2010 at all four levels of aggregation, especially for M3 where we observe negative money growth until 2011 that coincides with the effective beginning of loan-loss recovery. The differences in the degree of money growth and the corresponding inflation outcomes between the global financial crisis and the Covid-19 recoveries also warrant scrutiny of the role of monetary aggregates as policy indicators.
Logged PCE-scaled monetary aggregates at the M3 level of aggregation.
Note: The vertical line indicates the quarter (2006:q3) at which the aggregates were normalized to 100 (before taking the logs).

Year-over-year growth rates of the PCE-scaled monetary aggregates at the M3 level of aggregation.

Consumption velocity of monetary aggregates at the M3 level of aggregation.
Note: The vertical line indicates the quarter (2006:q3) at which the aggregates were normalized to 100.

Logged PCE-scaled monetary aggregates at the M4 level of aggregation.
Note: The vertical line indicates the quarter (2006:q3) at which the aggregates were normalized to 100 (before taking the logs).

Year-over-year growth rates of the PCE-scaled monetary aggregates at the M4 level of aggregation.

Consumption velocity of monetary aggregates at the M4 level of aggregation.
Note: The vertical line indicates the quarter (2006:q3) at which the aggregates were normalized to 100.

In Figures 9–20, we also present the time paths of the logged PCE-scaled monetary aggregates, $\ln (M_{t}/P_{t}c_{t})$
, and their growth rates as well as their consumption velocities,
$\ln (M_{t}/P_{t}c_{t})$
, and their growth rates as well as their consumption velocities, $P_{t}c_{t}/M_{t}$
. It is to be noted that
$P_{t}c_{t}/M_{t}$
. It is to be noted that $\ln (M_{t}/P_{t}c_{t})$
and
$\ln (M_{t}/P_{t}c_{t})$
and $P_{t}c_{t}/M_{t}$
are the variables used in our empirical analysis according to the money demand specifications (2)–(4). As can be seen, there is significant instability in the simple-sum and original Divisia monetary aggregates at all levels of monetary aggregation during the 1980s. Moreover, all monetary aggregates depict instability around 2008 and after 2019 compared to the adjacent periods. We also observe that the logged PCE-scaled monetary aggregates and the corresponding velocity measures, across all monetary definitions and levels of aggregation, are not centered around zero, indicating the potential need to include a constant term in their respective models to improve fit. Moreover, although the simple-sum and original Divisia aggregates display irregular trend patterns over time, these trends are non-negligible and therefore warrant incorporation into the model specification. In contrast, the credit-augmented Divisia aggregates exhibit a comparatively more systematic and discernible trend in their dynamics. Taken together, these observations suggest that including a trend component in the empirical models is likely to improve their overall fit.
$P_{t}c_{t}/M_{t}$
are the variables used in our empirical analysis according to the money demand specifications (2)–(4). As can be seen, there is significant instability in the simple-sum and original Divisia monetary aggregates at all levels of monetary aggregation during the 1980s. Moreover, all monetary aggregates depict instability around 2008 and after 2019 compared to the adjacent periods. We also observe that the logged PCE-scaled monetary aggregates and the corresponding velocity measures, across all monetary definitions and levels of aggregation, are not centered around zero, indicating the potential need to include a constant term in their respective models to improve fit. Moreover, although the simple-sum and original Divisia aggregates display irregular trend patterns over time, these trends are non-negligible and therefore warrant incorporation into the model specification. In contrast, the credit-augmented Divisia aggregates exhibit a comparatively more systematic and discernible trend in their dynamics. Taken together, these observations suggest that including a trend component in the empirical models is likely to improve their overall fit.
6. Empirical evidence
6.1 Simple-sum aggregates
We start our econometric investigation by estimating the money demand specifications (2)–(4) using the simple-sum M1, M2, M3, and M4 monetary aggregates over the full sample period from 1967:q1 to 2025:q1. Table 3 reports the unit root properties of the logged simple-sum monetary aggregates scaled by PCE, their consumption velocity, and their user costs at level as well as the logged user costs. In particular, we report the test statistics for the [Dickey and Fuller (Reference Dickey and Fuller1981)] Augmented Dickey-Fuller (ADF) test and the Dickey-Fuller GLS (DF-GLS) test [see Elliot et al. (Reference Elliot, Rothenberg and Stock1996)], assuming both a constant and trend, to assess the null hypothesis of a unit root against the alternative of a trend stationary process. The optimal lag length is determined based on the AIC. Moreover, given that unit root tests have low power against relevant trend stationary alternatives, we also execute the Kwiatkowski et al. (Reference Kwiatkowski, Phillips, Schmidt and Shin1992) KPSS test to test the null hypothesis of stationarity around a constant and trend against the alternative of a unit root. As can be seen, according to the ADF, DF-GLS, and KPSS tests, the monetary variables are integrated of order 1 [or I(1) in the terminology of Engle and Granger (Reference Engle and Granger1987)] while the corresponding user costs are I(0).
Unit root and stationarity tests for the simple-sum monetary aggregates

Notes: Sample period, quarterly observations, 1967:q1 to 2025:q1. PCE = Personal consumption expenditure. The 5% critical values for the ADF, DF-GLS, and KPSS tests are −3.429, −2.924, and 0.146, respectively. Decision of I(1) indicates unit root in level found by at least two of the tests.
Model selection with the simple-sum monetary aggregates

Notes: Sample period, quarterly observations, 1967:q1 to 2025:q1. The selected model (i.e. optimized) is based on 156 evaluated models for each aggregate using the Akaike Information Criterion (AIC). $^*$
Lags are adjusted after evaluating 156 models to check serial correlation.
$^*$
Lags are adjusted after evaluating 156 models to check serial correlation.
Table 4 provides information regarding the model selected for each of the simple-sum aggregates under each specification using the AIC. In some cases, the lag structure was adjusted from the AIC-selected model to address serial correlation. In particular, we start by selecting the lag structure of the ARDL model based on minimization of the AIC. Then we test for serial correlation in the chosen model using the Breusch-Godfrey LM test with the null hypothesis of no serial correlation in the residuals up to the lag order of the model. The detection of serial correlation would indicate that the residuals are not independent across time, and this violates the key assumptions of OLS estimation, leading to inefficient and biased parameter estimates, underestimated standard errors, and incorrect test statistics. If the test detects serial correlation in the chosen model based on the AIC, then we adjust the model by gradually raising the lag order, one lag at a time, and repeat the diagnostic test at each lag structure. Including higher-order lags allows us to detect more complex serial correlation patterns making our diagnostic checks more comprehensive. We settle at the lag structure demonstrating no serial correlation by the diagnostic test, thus finding a reliable model to execute the bounds tests. We also apply a HAC covariance matrix to correct the value of test statistics computed in our estimations.
In this regard, the Sum M1 aggregate required further lag adjustments across all three specifications, the Sum M3 aggregate required adjustments in the log–log and semi-log specifications, and the Sum M4 aggregate required adjustments in the semi-log specification. In each parenthesis, the first entry denotes the number of lags for the dependent variable and the second entry denotes the number of lags for the user cost variable. Under the log–log specification, the optimal models for the PCE-scaled Sum M1, Sum M2, Sum M3, and Sum M4 aggregates are (1,1), (1,0), (2,1), and (2,1), respectively. Similar optimal models are observed under the semi-log specification. Finally, under the linear specification, the optimal models for the consumption velocity of Sum M1, Sum M2, Sum M3, and Sum M4 aggregates are (1,1), (2,0), (2,0), and (2,0), respectively.
Tests of cointegration between the simple-sum monetary aggregates and their respective user costs

Notes: Sample period, quarterly observations, 1967:q1–2025:q1. Critical values for one regressor and DGP Case 5: The 5% critical values I(0) and I(1) for the F-bounds test are 6.560 and 7.300, respectively. The 5% critical values I(0) and I(1) for the t-bounds test are –3.410 and –3.690, respectively. DGP = Data generating process, FD = Financial deregulation, GFC = Global financial crisis, COVID = Covid-19 pandemic Serial correlation and heteroskedasticity are addressed by adjusting the lag length and applying a Heteroskedasticity and Autocorrelation Consistent (HAC) covariance matrix.
Table 5 presents the results of the cointegration tests following Pesaran et al. (Reference Pesaran, Shin and Smith2001) for each of the four simple-sum aggregates and for each of the three money demand specifications. We allow an unrestricted constant and trend in the data generation process, thus choosing Case 5 for estimation purposes for each of our models. Also, three dummy variables are incorporated in each estimation as fixed regressors to address the structural shift due to relevant economic disruptions, in particular the financial deregulation in the early 1980s (FD), the global financial crisis of 2007–2008 (GFC), and the Covid-19 pandemic (COVID). The outcome of the cointegration tests is reported in the last column of the table. Most of the models do not demonstrate long-run cointegration between the simple-sum monetary aggregates and their user costs except for the broadest aggregate, Sum M4. The narrower monetary aggregates, Sum M1, Sum M2, and Sum M3, do not indicate stable money demand for any of the three demand specifications.
6.2 Original Divisia aggregates
Tables 6–8 summarize the results for the original Divisia monetary aggregates over the period from 1967:q1 to 2025:q1. The unit root tests in Table 6 show that the variables related to the monetary aggregates are integrated of order one, while the user costs are integrated of order zero, except for the logged user costs of Divisia M1, Divisia M3, and Divisia M4. Table 7 reports the models selected for each of the original Divisia aggregates under the three money demand specifications. Whenever necessary, we adjusted the lag structure from the AIC-suggested optimal model to address serial correlation. Adjustments were required for Divisia M1/PCE under the log–log and semi-log specifications, and for Divisia M2/PCE and Divisia M4/PCE across all three specifications, while no adjustment was needed for Divisia M3/PCE. Ultimately, the optimal specification for Divisia M1/PCE under the linear form is (2, 1), whereas all other aggregates across the three functional forms converged to a (1, 1) lag structure.
Unit root and stationarity tests for the original Divisia monetary aggregates

Notes: Sample period, quarterly observations, 1967:q1–2025:q1. UC = User cost, PCE = Personal consumption expenditure. The 5% critical values for the ADF, DF-GLS, and KPSS tests are −3.429, −2.924, and 0.146, respectively. Decision of I(1) indicates unit root in level found by at least two of the tests.
Model selection with the original Divisia monetary aggregates

Notes: Sample period, quarterly observations, 1967:q1–2025:q1. The selected model (i.e. optimized) is based on 156 evaluated models for each aggregate using the Akaike Information Criterion (AIC). Lags are adjusted after evaluating 156 models to check serial correlation for all specifications except for PCE/Divisia M1. $^*$
Lags are adjusted after evaluating 156 models to check serial correlation.
$^*$
Lags are adjusted after evaluating 156 models to check serial correlation.
Tests of cointegration between original Divisia monetary aggregates and respective user costs

Notes: Sample period, quarterly observations, 1967:q1–2025:q1. Critical values for one regressor and DGP Case 5: The 5% critical values I(0) and I(1) for the F-bounds test are 6.560 and 7.300, respectively. The 5% critical values I(0) and I(1) for the t-bounds test are −3.410 and −3.690, respectively. DGP = Data generating process, FD = Financial deregulation, GFC = Global financial crisis, COVID = Covid-19 pandemic. Serial correlation and heteroskedasticity are addressed by adjusting the lag length and applying a Heteroskedasticity and Autocorrelation Consistent (HAC) covariance matrix.
Table 8 presents the cointegration tests in the same fashion as Table 5 for the simple-sum aggregates. As can be seen, there is no evidence of cointegration between any of the Divisia monetary aggregates and the corresponding user cost under any of the three specifications. In terms of this comparison, with the 1967:q1 to 2025:q1 long sample, the evidence favors the simple-sum monetary aggregates, as we find evidence of cointegration only with the Sum M4 aggregate.
6.3 Credit-augmented Divisia aggregates
In this section, we investigate money demand functions using the relatively unexplored credit card-augmented Divisia monetary aggregates which represent broader money measures than the original Divisia monetary aggregates as they also include the monetary services provided by credit cards. Although data for the original Divisia monetary aggregates are available since 1967, the credit card-augmented Divisia monetary aggregates (and the credit card-augmented Divisia inside monetary aggregates) are only available since July of 2006. For this reason, in this section (and the following one) we use quarterly data from 2006:q3 to 2025:q1. The sample period includes the global financial crisis and the coronavirus pandemic.
Tables 9, 10 and 11 present the results of our econometric investigation. In Table 9, we report evidence of a unit root for all the variables, confirming the prerequisite to adopt the Pesaran et al. (Reference Pesaran, Shin and Smith2001) procedure. Table 10 reports the selected models, again based on the minimum AIC among all 156 evaluated models, confirming no serial correlation for any of the models. The optimally selected model turns out to be (1,1) for each of the credit-augmented Divisia monetary aggregates, Divisia M1A, Divisia M2A, Divisia M3A, and Divisia M4A, under all three money demand specifications.
Unit root and stationarity tests for the credit-augmented Divisia monetary aggregates

Notes: Sample period, quarterly observations, 2006:q3–2025:q1. UC = User cost, PCE = Personal consumption expenditure. The 5% critical values for the ADF, DF-GLS, and KPSS tests are −3.473, −3.120, and 0.146, respectively. Decision of I(1) indicates unit root in level found by at least one of the tests.
Model selection with the credit-augmented Divisia monetary aggregates

Notes: Sample period, quarterly observations, 2006:q3–2025:q1. The selected model (i.e. optimized) is based on 156 evaluated models for each aggregate using the Akaike Information Criterion (AIC).
Tests of cointegration between the credit-augmented Divisia monetary aggregates and respective user costs

Notes: Sample period, quarterly observations, 2006:q3 to 2025:q1. Critical values for one regressor and DGP Case 5: The 5% critical values I(0) and I(1) for the F-bounds test are 6.560 and 7.300, respectively. The 5% critical values I(0) and I(1) for the t-bounds test are −3.410 and −3.690, respectively. DGP = Data generating process, GFC = Global financial crisis, COVID = Covid-19 pandemic. Serial correlation and heteroskedasticity are addressed by adjusting the lag length and applying a Heteroskedasticity and Autocorrelation Consistent (HAC) covariance matrix.
Table 11 presents the cointegration tests. As the graphical analysis of each series demonstrates the necessity of considering both a constant and trend in all three specifications, we again assume Case 5 as the data generation process for all three money demand specifications. Each estimation also takes the global financial crisis and the Covid-19 recession into consideration for a precise specification of the models. The stark outcome of the analysis shows that a stable money demand function exists for all four credit card-augmented Divisia monetary aggregates under all three money demand specifications.
6.4 Credit-augmented Divisia inside aggregates
Finally, in Tables 12, 13 and 14 we present the results of our investigation for the credit card-augmented Divisia inside monetary aggregates, using quarterly data from 2006:q3 to 2025:q1. As already noted, these aggregates are based on the concept of inside money from the supply side of liquidity services, defined as the monetary services produced by financial firms. As can bee seen in Table 12, all variables related to the credit-augmented Divisia inside aggregates and the corresponding user costs demonstrate unit roots at level.
Unit root and stationarity tests for the credit-augmented Divisia inside monetary aggregates

Notes: Sample period, quarterly observations, 2006:q3 to 2025:q1. UC = User cost, PCE = Personal consumption expenditure. The 5% critical values for the ADF, DF-GLS, and KPSS tests are −3.473, −3.120, and 0.146 respectively. Decision of I(1) indicates unit root in level found by at least two of the tests.
Model selection with the credit-augmented Divisia inside monetary aggregates

Notes: Sample period, quarterly observations, 2006:q3–2025:q1. The selected model (i.e. optimized) is based on 156 evaluated models for each aggregate using the Akaike Information Criterion (AIC).
Tests of cointegration between the credit-augmented Divisia inside monetary aggregates and respective user costs

Notes: Sample period, quarterly observations, 2006:q3–2025:q1. Critical values for one regressor and DGP Case 5: The 5% critical values I(0) and I(1) for the F-bounds test are 6.560 and 7.300, respectively. The 5% critical values I(0) and I(1) for the t-bounds test are −3.410 and −3.690, respectively. DGP = Data generating process, GFC = Global financial crisis, COVID = Covid-19 pandemic. Serial correlation and heteroskedasticity are addressed by adjusting the lag length and applying a Heteroskedasticity and Autocorrelation Consistent (HAC) covariance matrix.
In Table 13 we report the selected models based on the minimum AIC, confirming no serial correlation across all models under all three specifications. Eventually, our analysis finds lag structures of (1,3) for Divisia M1AI under both the log–log and semi-log specifications and (1,1) for all other three credit-augmented Divisia inside aggregates, including Divisia M1AI under the linear specification.
The cointegration test results are reported in Table 14. We allow a data generation process as per Case 5 for all the models under all three specifications following the graphical plot of each of the credit-card augmented Divisia inside monetary aggregates and related variables. As with the credit-augmented Divisia aggregates, dummy variables for the global financial crisis and the Covid-19 recession are incorporated in the ARDL model. As can be seen, the Pesaran et al. (Reference Pesaran, Shin and Smith2001) cointegration tests in Table 14 support the existence of cointegration only between the Divisia M2AI aggregate and its user cost under the log–log and linear specifications and between the Divisia M1AI aggregate and its user cost under the linear specification only. These results for the credit-augmented Divisia inside aggregates which exclude currency are very different from those with the credit-augmented Divisia aggregates.
7. Recent behavior of the sum and original Divisia aggregates
Our analysis so far using the 1967:q1 to 2025:q1 long sample presents a consistent picture of money demand instability across different monetary aggregates. Specifically, we find strong evidence of cointegration only between the Sum M4 aggregate and its respective user cost under all three money demand specifications, (2)–(4). However, the narrower Sum M1, Sum M2, and Sum M3 aggregates do not exhibit cointegration with their respective user costs, indicating instability in money demand. Similarly, all of the original Divisia aggregates fail to demonstrate cointegration with their user costs under all of the demand specifications. In contrast, using the 2006:q3 to 2025:q1 shorter sample and the credit-augmented aggregates, we find that all credit card-augmented Divisia aggregates exhibit robust evidence of cointegration under all specifications, whereas the credit card-augmented Divisia inside aggregates do not exhibit cointegration with their respective user costs except for the Divisia M2AI aggregate under the log–log and linear specifications and the Divisia M1AI aggregate under the linear specification.
One limitation of this comparison is the asymmetric sample coverage. While the simple-sum aggregates and the original Divisia aggregates are estimated over a long sample period (1967:q1-2025:q1), the credit-augmented aggregates are only available from 2006:q3 onward. To address this issue and ensure a more valid comparison, we re-estimate all models with the simple-sum aggregates and the original Divisia aggregates over the post-2006 period, using data from 2006:q3 to 2025:q1. Tables 15, 16 and 17 report the results for the original Divisia aggregates and Tables 18, 19 and 20 for the simple-sum aggregates. We follow the same procedure as before, testing for the integration order of the variables, selecting lag structures free from serial correlation, and testing for cointegration using the Pesaran et al. (Reference Pesaran, Shin and Smith2001) bounds approach.
Unit root and stationarity tests for the original Divisia monetary aggregates over the 2006:q3–2025:q1 sample period

Notes: Sample period, quarterly observations, 2006:q3–2025:q1. UC = User cost, PCE = Personal consumption expenditure. The 5% critical values for the ADF, DF-GLS, and KPSS tests are −3.471, −3.116, and 0.146, respectively. Decision of I(1) indicates unit root in level found by at least two of the tests.
Model selection with the original Divisia monetary aggregates over the 2006:q3–2025:q1 sample period

Notes: Sample period, quarterly observations, 2006:q3 to 2025:q1. The selected model (i.e. optimized) is based on 156 evaluated models for each aggregate using the Akaike Information Criterion (AIC). $^*$
Lags are adjusted after evaluating 156 models to check serial correlation.
$^*$
Lags are adjusted after evaluating 156 models to check serial correlation.
Tests of cointegration between the original Divisia monetary aggregates and their respective user costs over the 2006:q3–2025:q1 sample period

Notes: Sample period, quarterly observations, 2006:q3 to 2025:q1. Critical values for one regressor and DGP Case 5: The 5% critical values I(0) and I(1) for the F-bounds test are 6.560 and 7.300, respectively. The 5% critical values I(0) and I(1) for the t-bounds test are −3.410 and −3.690, respectively. DGP = Data generating process, GFC = Global financial crisis, COVID = Covid-19 pandemic. Serial correlation and heteroskedasticity are addressed by adjusting the lag length and applying a Heteroskedasticity and Autocorrelation Consistent (HAC) covariance matrix.
When using the post-2006 sample period, we find that all four original Divisia aggregates exhibit cointegration with their respective user costs under each of the three money demand specifications (see Table 17). The simple-sum aggregates also show improved evidence of cointegration during this sample period, though the results are weaker relative to those for the Divisia aggregates. In particular, now in addition to the Sum M4 aggregate we also find evidence of cointegration between the Sum M3 aggregate and its user cost under all three money demand specifications. Notably, however, the Sum M1 and Sum M2 aggregates continue to fail the cointegration tests under all three specifications, signaling persistent instability. It is also noteworthy that Sum M2 is the broadest monetary aggregate currently produced by the Federal Reserve, since the Fed discontinued its reported Sum M3 monetary aggregate in March 2006 and never officially used an M4 aggregate; recall that here we constructed the Sum M3 and Sum M4 aggregates using historical CFS components data. Yet, despite its official prominence, the Fed’s Sum M2 aggregate consistently fails to exhibit cointegration under any money demand specification in our analysis.
Unit root and stationarity tests for the simple-sum monetary aggregates over the 2006:q3–2025:q1 sample period

Notes: Sample period, quarterly observations, 2006:q3–2025:q1. UC = User cost, PCE = Personal consumption expenditure. The 5% critical values for the ADF, DF-GLS, and KPSS tests are −3.471, −3.116, and 0.146, respectively. Decision of I(1) indicates unit root in level found by at least two of the tests.
Model selection with the simple-sum monetary aggregates over the 2006:q3–2025:q1 sample period

Notes: Sample period, quarterly observations, 2006:q3–2025:q1. The selected model (i.e. optimized) is based on 156 evaluated models for each aggregate using the Akaike Information Criterion (AIC). $^*$
Lags are adjusted after the evaluation of 156 models to check serial correlation.
$^*$
Lags are adjusted after the evaluation of 156 models to check serial correlation.
Tests of cointegration between the simple-sum monetary aggregates and their respective user costs over the 2006:q3–2025:q1 sample period

Notes: Sample period, quarterly observations, 2006:q3–2025:q1. Critical values for one regressor and DGP Case 5: The 5% critical values I(0) and I(1) for the F-bounds test are 6.560 and 7.300, respectively. The 5% critical values I(0) and I(1) for the t-bounds test are –3.410 and –3.690, respectively. DGP = Data generating process, GFC = Global financial crisis, COVID = Covid-19 pandemic. Serial correlation and heteroskedasticity are addressed by adjusting the lag length and applying a Heteroskedasticity and Autocorrelation Consistent (HAC) covariance matrix.
We conclude that over the post-2006 sample period, the original Divisia monetary aggregates and the credit card-augmented Divisia aggregates demonstrate superior money demand stability compared to their simple-sum counterparts and the credit card-augmented Divisia inside aggregates.
8. Conclusion
The unique opportunity of reappraising the monetary policy tools during the Covid-19 pandemic motivates us to investigate the scope of monetary aggregates as intermediate targets of monetary policy by looking into the stability of money demand. We test the stability of money demand in the United States in the context of three distinct functional forms—the log–log, semi-log, and linear forms—using the simple-sum monetary aggregates, Barnett’s (Reference Barnett1978, Reference Barnett1980) original Divisia monetary aggregates, and the recently introduced by Barnett et al. (Reference Barnett, Chauvet, Leiva-Leon and Su2024) credit-augmented Divisia aggregates. We argue that the new insight on the stability of money demand from our research has the potential to guide monetary policymakers to reconsider the role of monetary aggregates in their monetary policy stances.
Our research period encompasses both the 2007–2009 global financial crisis and the Covid-19 crisis, during which central bank policy rates approached the zero lower bound. In these situations, the growth of monetary aggregates provided more informative signals about the effects of monetary policy on economic activity than constrained policy rates—see, for example, Serletis (Reference Serletis2025). We use the Pesaran et al. (Reference Pesaran, Shin and Smith2001) procedure in our investigation of a long run relationship between the money-consumption ratio or the consumption velocity of money and the relevant user cost. We choose a flexible data generation process allowing an unrestricted intercept and trend in the model and use dummy variables as fixed regressors to address relevant economic disruptions over the sample period such as the global financial and Covid-19 crises.
With the long quarterly sample extending from 1967:q1 through 2025:q1, we find strong evidence of stable money demand only with the simple-sum M4 monetary aggregate. For this sample period, there is no evidence of stable money demand with any of the original Divisia aggregates under any of the three money demand specifications. With the more recent sample period since the mid-2006, for which the credit-augmented Divisia aggregates are also available, we find strong evidence of stable money demand with all of the original Divisia aggregates and with all of the credit-augmented Divisia aggregates under all three money demand specifications. Regarding the credit-augmented Divisia inside aggregates (which exclude currency), we find evidence of cointegration only with the Divisia M2AI aggregate under the log–log and linear specifications and the Divisia M1AI aggregate under the linear specification. However, we also find evidence of cointegration with the (broad) Sum M3 and Sum M4 aggregates under all three money demand specifications.
To conclude, if we focus on the long sample, from 1967:q1 to 2025:q1, the simple-sum aggregates perform better than the original Divisia aggregates. If we focus on the shorter sample, from 2006:q3 to 2025:q1 for which all monetary indicators are available, our results favor the group of the original Divisia aggregates and the credit-augmented Divisia aggregates over the simple-sum aggregates and the credit-augmented Divisia inside aggregates. However, if with this sample we focus on the broad monetary aggregates (at the M3 and M4 levels of aggregation), consistent with the evidence reported by Dery and Serletis (Reference Dery and Serletis2021) and Barnett’s (Reference Barnett2016) assertion that we should use the broadest monetary aggregates, then the simple-sum, Divisia, and credit-augmented Divisia aggregates perform equally well. We argue that broad monetary aggregates, irrespective of how they are measured, warrant greater consideration as policy-relevant indicators.
Acknowledgments
This paper builds on material from Chapter 1 of Maidul Chowdhury’s Ph.D. dissertation at the University of Calgary. We would like to thank the members of Maidul’s dissertation committee, Atsuko Tanaka and Yu (Sonja) Chen. We would also like to thank Bill Barnett, an Associate Editor of Macroeconomic Dynamics, and three anonymous referees for comments that greatly improved the paper.
A. Appendix Figures
Normalized user costs of monetary aggregates at the M1 level of aggregation.
Note: The user costs are normalized to 100 at 2006:q3.

Normalized user costs of monetary aggregates at the M2 level of aggregation.
Note: The user costs are normalized to 100 at 2006:q3.

Normalized user costs of monetary aggregates at the M3 level of aggregation.
Note: The user costs are normalized to 100 at 2006:q3.

Normalized user costs of monetary aggregates at the M4 level of aggregation.
Note: The user costs are normalized to 100 at 2006:q3.


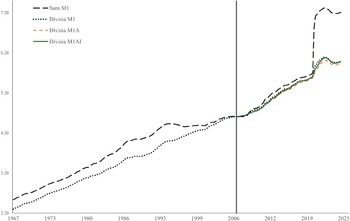
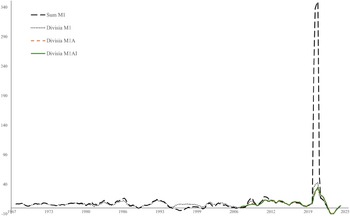
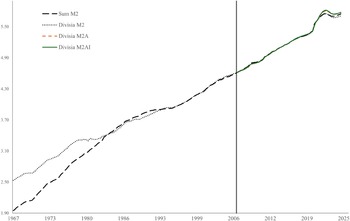
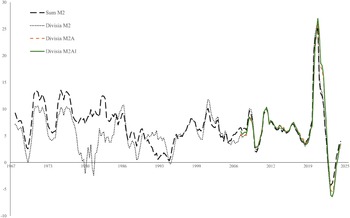
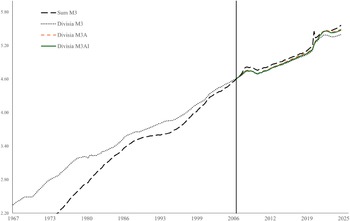
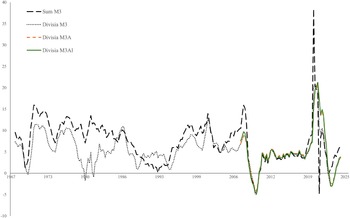
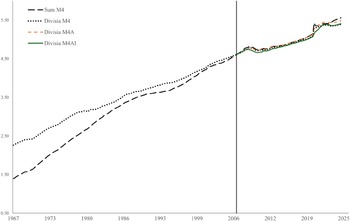
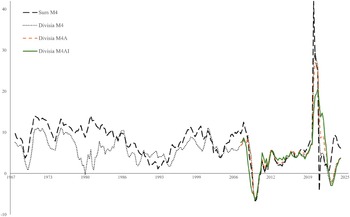
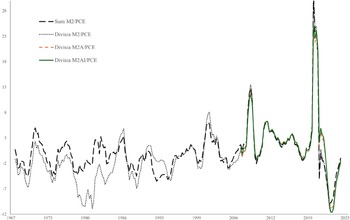
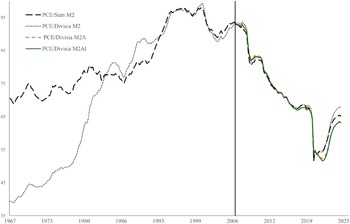
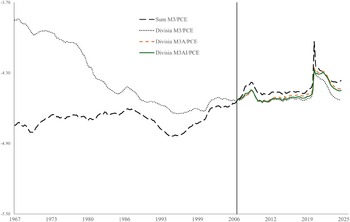
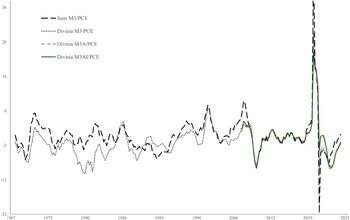
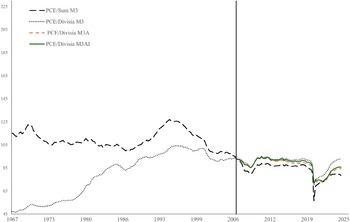
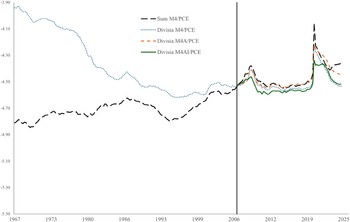
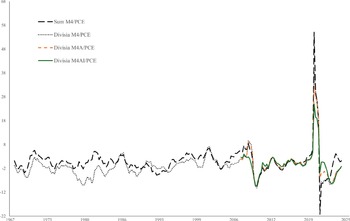
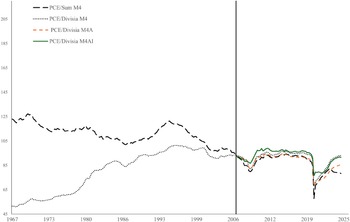


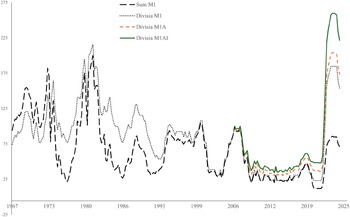
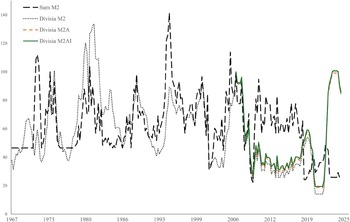
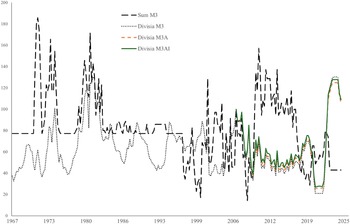
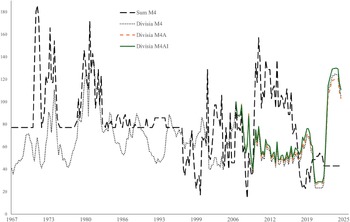

 Open access