Hostname: page-component-74d7c59bfc-rcmjj Total loading time: 0 Render date: 2026-01-24T08:02:33.366Z Has data issue: false hasContentIssue false

Methodological Quality of Studies Designed to Create Twin-Specific Neonatal Anthropometric Charts: A Systematic Review

Published online by Cambridge University Press:  20 January 2026

Sonia Deantoni
Affiliation:
Neonatal Intensive Care Unit of the University of Turin, Turin, Italy Nuffield Department of Women’s & Reproductive Health, University of Oxford, Oxford, United Kingdom
Serena Gandino
Affiliation:
Neonatal Intensive Care Unit of the University of Turin, Turin, Italy
Francesca Giuliani*
Affiliation:
Nuffield Department of Women’s & Reproductive Health, University of Oxford, Oxford, United Kingdom Neonatal Special Care Unit, Regina Margherita Children’s Hospital, Turin, Italy
Agustin Conde-Agudelo
Affiliation:
Oxford Maternal and Perinatal Health Institute, Green Templeton College, University of Oxford, Oxford, United Kingdom
Enrico Bertino
Affiliation:
Neonatal Intensive Care Unit of the University of Turin, Turin, Italy
Ilaria Stura
Affiliation:
Department of Neurosciences, University of Turin, Turin, Italy
Leila Cheikh Ismail
Affiliation:
Nuffield Department of Women’s & Reproductive Health, University of Oxford, Oxford, United Kingdom University of Sharjah, Department of Clinical Nutrition and Dietetics, College of Health Sciences, Sharjah, United Arab Emirates
Alessandra Coscia
Affiliation:
Neonatal Intensive Care Unit of the University of Turin, Turin, Italy
Giuseppe Migliaretti
Affiliation:
Department of Public Health and Paediatric Sciences, University of Turin, Turin, Italy
Josè Villar
Affiliation:
Nuffield Department of Women’s & Reproductive Health, University of Oxford, Oxford, United Kingdom Oxford Maternal and Perinatal Health Institute, Green Templeton College, University of Oxford, Oxford, United Kingdom
*
Corresponding author: Francesca Giuliani; Email: giuliani.pediatria@gmail.com

Abstract

Twin fetuses show a physiologically slower growth rate in the third trimester compared to singletons. Therefore, it has been suggested that the anthropometric evaluation of twins at birth should be performed using twin-specific charts. To be reliable, anthropometric charts need to fulfil certain methodological criteria to systematically review studies that have developed neonatal twin-specific anthropometric charts and assess their methodological quality. A comprehensive search was conducted across Cinahl, Embase, Global Index Medicus, PubMed, Scopus, Web of Science, Google Scholar, and relevant preprint repositories, followed by a predefined snowballing search. Two reviewers independently screened studies for eligibility, selecting those that have developed cross-sectional anthropometric charts for twins at birth, published since January 1990. Articles were excluded if they did not use anthropometric measurements at birth to construct charts. Two reviewers independently extracted data and performed quality assessment with a 16-item grading system. Sixty-eight studies were included, with all but one constructed reference, not standard, charts. Most studies did not meet the quality criteria: only 9% were prospectively designed, 34% reliably estimated gestational age, 19% reported standardized instruments, 28% described measurement techniques, and 26% did not stratify centiles by sex. This review reveals considerable methodological limitations in existing twin-specific neonatal anthropometric charts.

Information

Type
Article
Creative Commons
Creative Common License - CCCreative Common License - BY
This is an Open Access article, distributed under the terms of the Creative Commons Attribution licence (https://creativecommons.org/licenses/by/4.0/), which permits unrestricted re-use, distribution and reproduction, provided the original article is properly cited.
Copyright
© The Author(s), 2026. Published by Cambridge University Press on behalf of International Society for Twin Studies

Anthropometric charts, based on birth weight, length, and head circumference data, should be used in clinical practice for the assessment of neonatal size, and represent a useful tool to define neonates as small, appropriate or large for gestational age (GA), using defined thresholds (WHO Expert Committee, Reference Expert Committee1995). Whereas reference charts describe how a population actually grows under prevailing local conditions, prescriptive standards define how it should grow under optimal conditions, including balanced nutrition, lack of environmental constraints, and adequate healthcare (Bertino et al., Reference Bertino, Milani, Fabris and De Curtis2007).

Fetal growth and neonatal size at birth are affected by several pathological conditions as well as physiological variables such as parity and sex. A number of neonatal charts is available for singletons, among those a set of international standards that complete the WHO child growth standards (Villar et al., Reference Villar, Cheikh Ismail, Victora, Ohuma, Bertino, Altman, Lambert, Papageorghiou, Carvalho, Jaffer, Gravett, Purwar, Frederick, Noble, Pang, Barros, Chumlea, Bhutta and Kennedy2014).

Evidence has shown how singletons and twins’ intrauterine growth starts to diverge from 28th−30th week of gestation onwards, resulting in a significant difference in size at birth (Hiersch et al., Reference Hiersch, Barrett, Fox, Rebarber, Kingdom and Melamed2022). This difference seems to be related to a physiological modulation of growth due to twinning but may be enhanced by multiplicity-associated pathologies.

Furthermore, birth weight thresholds predicting neonatal morbidity and mortality differ between singletons and twins, being lower for the latter (Hiersch et al., Reference Hiersch, Barrett, Fox, Rebarber, Kingdom and Melamed2022), and most twins that are classified as small for gestational age (SGA) on singletons charts do not show an increased risk for neonatal mortality or morbidities (Briffa et al., Reference Briffa, Di Fabrizio, Kalafat, Giorgione, Bhate, Huddy, Richards, Shetty and Khalil2022; Giorgione et al., Reference Giorgione, Briffa, Di Fabrizio, Bhate and Khalil2021).

Therefore, authors have postulated that when evaluating twins’ birth size, the use of twin-specific charts should be preferred; this approach has the potential to avoid over-diagnosis of SGA and its consequences, including unnecessary medical interventions, misuse of resources, and increased parental anxiety (Hiersch et al., Reference Hiersch, Barrett, Fox, Rebarber, Kingdom and Melamed2022). This would allow healthcare providers to assess whether growth has been affected by any morbidity beyond the modulation induced by the twinning itself. This distinction is especially important in preterm twins, and especially for the widely represented group of the late preterm infants, where accurate growth assessment is critical for guiding nutritional management and monitoring for morbidity.

Numerous twin-specific charts are available, built on different populations and using various methodologies: the evaluation of the methodological quality of these studies is important to assess their applicability in clinical practice. To the best of our knowledge, such rigorous evaluation has not been performed with a systematic approach. Therefore, we performed a systematic review aiming to assess the methodological quality of studies creating twin-specific neonatal anthropometric charts.

Materials and Methods

This systematic review was registered with Prospero (CRD42022356027) and reported according to the MOOSE guidelines for systematic reviews and meta-analyses of observational studies (Stroup et al., Reference Stroup, Berlin, Morton, Olkin, Williamson, Rennie, Moher, Becker, Sipe and Thacker2000).

Eligibility Criteria

We included studies that aimed at developing cross-sectional anthropometric charts for twins at birth, published from January 1990 to April 2024. The 1990 threshold was suggested in a previously published systematic review (Giuliani et al., Reference Giuliani, Ohuma, Spada, Bertino, Al Dhaheri, Altman, Conde-Agudelo, Kennedy, Villar and Cheikh Ismail2015) since most of the advanced statistical approaches to develop charts (e.g., the LMS method) were proposed in the early 1990s (Cole & Green, Reference Cole and Green1992). No language restriction was applied.

Studies were excluded if they (1) were case series or report, editorials, commentaries, and reviews or letters without original data; (2) did not use anthropometric measurements at birth to develop charts (e.g., studies based on fetal obstetric estimates); or (3) did not develop curves specific for twins.

Search Strategy

We applied a hybrid search strategy, by combining structured database searches with predefined snowballing searches, in order to identify the highest number of relevant studies (Wohlin et al., Reference Wohlin, Kalinowski, Romero Felizardo and Mendes2022).

The systematic search was performed in December 2023 on the following electronic databases: Cinahl, Embase, Global Index Medicus, PubMed, Scopus, Web of Science. The search was run again on PubMed in April 2024. Grey literature was searched on Google Scholar, bioRxiv, medRxiv, Nature Proceedings, PeerJPrePrints, Researchsquare, and greylit.org in April 2024. The search strategy consisted of search words on the key concepts of ‘twin’, ‘newborn’, ‘birthweight’, and ‘chart’. The search strategy used for PubMed, then adapted for the other databases, is available in Appendix A.

The five most cited relevant studies identified through the systematic search (Alexander et al., Reference Alexander, Kogan, Martin and Papiernik1998; Arbuckle at al., Reference Arbuckle, Wilkins and Sherman1993; Dai et al., Reference Dai, Deng, Li, Yi, Li, Mu, Li, Yao and Wang2017; Dollberg et al., Reference Dollberg, Haklai, Mimouni, Gorfein and Gordon2005; Sankilampi et al., Reference Sankilampi, Hannila, Saari, Gissler and Dunkel2013) were screened on PubMed for the list of similar and cited by papers (in April 2024). Moreover, the reference lists of all included studies were screened to find additional articles.

Selection Process

The search results from different databases were merged using the EndNote software, and duplicates automatically removed by the software. Each record was independently screened by two authors (SD, SG) to determine inclusion on the basis of eligibility and exclusion criteria, firstly by title and abstract, hence by full-text screening. Conflicts during the screening process were solved by discussion or by involvement of a third reviewer (FG).

Data Collection

We developed two standardized data extraction forms to collect information on study characteristics and study methodology (Appendix B).

The descriptive data extraction form collected data on study details (e.g., country where the study was conducted, years of enrolment), population details (e.g., sample size, inclusion and exclusion criteria, participant baseline characteristics), output details (e.g., anthropometric variables included in the charts, chart presentation). The qualitative data extraction form collected data on study design, statistical methods, and reporting of the results. Two reviewers (SD, SG) independently extracted the data from the included studies. The extracted data were cross-checked, and, if any difference was identified, a third reviewer was involved (FG). A team member specialized in statistics (IS) reviewed the items related to study statistical methods.

Study Quality Assessment

The methodological quality of the included studies was evaluated by the 16-items grading system used in our previous evaluation of neonatal anthropometric charts for singletons (Giuliani et al., Reference Giuliani, Ohuma, Spada, Bertino, Al Dhaheri, Altman, Conde-Agudelo, Kennedy, Villar and Cheikh Ismail2015) plus two additional items related to twins (determination of chorionicity and determination of birth weight discordance). Data extracted in the qualitative data form were used to define 18 quality items, grouped into three domains: study design, statistical methods, and reporting of results. Each item was scored as low risk of bias (score = one) or high risk of bias (score = zero) (Appendix C).

The qualitative assessment was performed independently by two reviewers (SD, SG). Conflicts were resolved by consultation with the third reviewer (FG).

Data Synthesis

Scores for the three individual domains, and the overall quality score were computed. The median, interquartile range (IQR) and range were calculated as the summary measure of the distribution of scores of the included studies.

Results

We identified 5625 records from database searches, and 12,040 records from grey literature search and snowballing search. After deletion of duplicates, 17,090 records were screened by title and abstract, and 191 records were found to be relevant for full-text screening. Ultimately, 68 studies met the eligibility criteria and were included in the final analysis (Figure 1).

Figure 1. PRISMA flowchart for the systematic review.

The main characteristics of included studies are presented in Table 1. Twenty (29%) studies were published between 1990 and 2000, 18 (26%) between 2001 and 2010, and 30 (44%) after 2010. Thirty (44%) studies were conducted in the European Region, 21 (30%) in the Western Pacific Region, 13 (19%) in the Region of the Americas, one in the African region, one in the Eastern Mediterranean Region, and one in the South-East Asian Region. One study was a multicenter study conducted in two different WHO regions (Western Pacific Region and Region of the Americas).

Table 1. Descriptive characteristics of selected studies

Note: BW, birth weight; BL, birth length; GA, gestational age; HC, head circumference; MUAC, middle upper arm circumference; CC, chest circumference; W*L, weight for length.

Fifty-one studies (75%) were published in English, five (7%) in Spanish, three (4%) in German, two each (9%) in Chinese, Russian and Italian, and one each in (4%) in Hungarian, French, and Korean.

Study Design

There was great variability in sample size (from 80 to 1,346,477 participants; median 8454), and minimum GA considered in the charts (between 20−23 weeks in 43% of studies, between 24−27 weeks in 38% of studies, and 28 or more weeks in 19% of the studies).

Regarding anthropometric variables, 50 studies (75%) reported birth weight only; one study reported birth weight and body length; one study reported birth weight and head circumference; two studies reported body length only. All three main anthropometric variables, that is, birth weight, body length and head circumference, were reported in 14 studies (21%).

Authors aimed to construct a reference chart in 44% of studies and a standard chart in 21% of studies. In the remaining studies (35%), it was unclear whether the aim was to create a reference or a standard chart.

Most studies (84%) aimed to create charts for twins born in a specific geographical area. However, the percentage of twin neonates included in the charts out of the total number of twins born in that geographical area at the given time was not specified.

In 53% of the studies, data were extracted from birth registries, in 35% from hospital records, in 9% from research forms, in 3% from other sources, and in 1% the data source was unclear. Among the hospital-based studies, 18 were single-centre and 11 were multicenter (range 2 to 95 centres).

Only six studies (9%) were preplanned (i.e., before the recruitment of neonates).

Great variability in exclusion criteria was observed among included studies: 48 (71%) excluded stillbirths and babies with congenital malformations, 11 (16%) adopted additional exclusion criteria (e.g., maternal chronic diseases, smoking, significant birth-weight discordance, and other factors that could impair fetal growth), 2 excluded monoamniotic twins (de Paepe et al., Reference De Paepe, Shapiro, Young and Luks2015; Odibo et al., Reference Odibo, Cahill, Goetzinger, Harper, Tuuli and Macones2013), 1 excluded nonspontaneous pregnancies (Sankilampi et al., Reference Sankilampi, Hannila, Saari, Gissler and Dunkel2013), and 1 included only twins conceived by in-vitro fertilization (Dickey et al., Reference Dickey, Pridjian, Xiong and Klempel2017). Nine studies (13%) did not report exclusion criteria.

Chorionicity was evaluated in 12 studies (18%), but only in 8 studies were charts developed by chorionic placentation.

In 19 studies (28%), the method for GA evaluation was not described. Only 22 studies (34%) reported a reliable method for GA estimation: 21 used both last menstrual period and first trimester ultrasound and one, which included only infants conceived by in-vitro fertilization, added 14 days to the number of completed weeks since oocyte fertilization (Dickey et al., Reference Dickey, Pridjian, Xiong and Klempel2017).

There were considerable methodological issues in anthropometric evaluation: measurement instruments were reported and reliable in only 13 studies (19%), measurement techniques were described and reliable in 19 studies (28%), and training of the operators was reported in 4 studies (6%).

Statistical Methods

Statistical models were inappropriate or not adequately described in 31 studies (46%). Forty-nine percent of the studies developed growth curves estimated by regression models (linear, multivariate, quadratic, generalized linear models [GLM] or least mean square [LMS]). Only two studies (3%) used advanced ad hoc methods such as Bayesian models that allow more precise estimates of growth curves through appropriate smoothing techniques. Outliers were adequately evaluated and excluded in 20 (29%) studies. Eighteen studies (26%) did not consider gender as a covariate and did not produce gender-specific charts. Only 11 studies (16%) reported a control of goodness of fit. In 10 of them, the goodness of fit was embedded in the estimating method, while in the remaining one a worm plot for ‘visual inspection’ was reported. Smoothing techniques were reported in 31 (46%) studies. In many cases, the smoothing was embedded in the estimating model (cubic spine, LMS method, Bayesian method, and GAMLSS [generalized additive model for location, scale and shape]), while in seven studies post-hoc techniques were used (weighted mean or automatic graphical smoothing by the used statistical software).

The precision of the estimates, defined by standard errors or confidence limits of extreme centiles, were reported in 43 (63%) studies: three presented standard errors; 12 did not report standard errors but used LMS or GAMLSS methods, in which calculation of standard errors is embedded; and 28 neither reported standard errors or used LMS or GAMLSS methods, but provided a precision of estimates by confidence intervals, smoothing techniques or regression methods.

Reporting of Results

The study population characteristics were reported in 30 (44%) studies. The 10th, 50th and 90th centiles and z-scores were reported or computable in 56 (82%) and 34 (50%) studies, respectively. In 33 (48%) studies, only mean and standard deviation or centiles tables were presented.

Risk of Bias

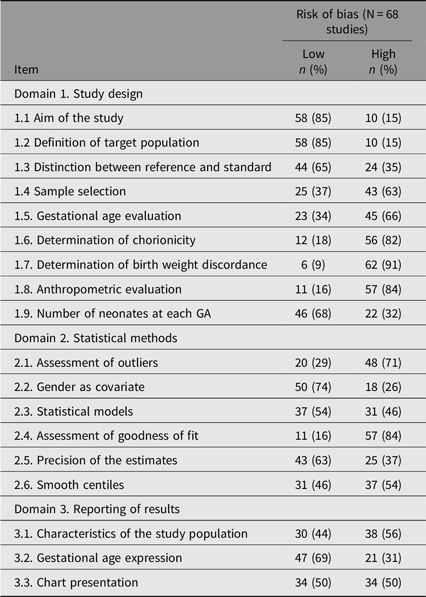
The risk of bias of the included studies is presented in Table 2. For the 68 included studies, the median, mean, interquartile range, and range of quality scores for each of the three domains are summarised in Figure 2. The median overall quality score was 44% (IQR 33−61%, range 11−83%).

Table 2. Risk of bias for each of the 18 items assessed in the three domains

Figure 2. Whisker plot showing the range of quality scores across individual domains and the overall quality score. Each box represents the interquartile range (IQR), with the line indicating the median. Whiskers extend to the minimum and maximum observed values. Notably, in Domain 3, the median and third quartile values overlap, indicating a clustering of high scores within the upper range.

Twenty-six studies (38%) had an overall quality score above 50%, but only 10 (15%) reached a quality score above 50% in each of the three domains.

Discussion

To the best of our knowledge, this is the first systematic review to critically appraise studies which developed twin-specific neonatal anthropometric charts. This study has shown that there is substantial heterogeneity and limitations in the methodological quality of studies aimed at creating twin-specific neonatal anthropometric charts.

We identified 68 twin-specific neonatal charts, the majority of which were affected by major methodological flaws that limit their reliability in clinical practice. The most common deficiencies were related to the determination of birth-weight discordance, anthropometric evaluation, determination of chorionicity, and assessment of goodness of fit, which were adequately addressed in only ≤18% of included studies.

To define whether an anthropometric chart is a reference or standard is of foremost importance in its building and implementation. When the population used to build the charts includes neonates with risk factors for impaired fetal growth, the chart is a reference that describes ‘how growth actually is’ in such population. Differences between references may arise from the different prevalence of environmental, nutritional, socioeconomic, and health conditions that can affect fetal growth. Exclusion of all neonates exposed to any known risk factor for intrauterine growth restriction is the basis for a prescriptive standard that describes ‘how growth should be’ (Bertino et al., Reference Bertino, Milani, Fabris and De Curtis2007; Grummer-Strawn et al., Reference Grummer-Strawn, Garza and Johnson2002). When these exclusion criteria are met, it has been demonstrated that fetal growth is similar across different regions (Garza & de Onis, Reference Garza and de Onis2004; Uauy et al., Reference Uauy, Casanello, Krause, Kusanovic and Corvalan2013). Hence, a unique international standard could be applied to all populations and represent the best tool for the anthropometric evaluation of newborns worldwide. From our search, it emerged that the exclusion criteria of almost all included studies are those of a reference, hence not applicable at an international level. The only study that fulfilled the criteria of a standard, that is, the exclusion of neonates exposed to known risk factors for impaired fetal growth (Bertino et al., Reference Bertino, Milani, Fabris and De Curtis2007), is the study by Bossi et al. (Reference Bossi, Cortinovis, Milani, Gallo, Kusterman and Morotti1994). This is a good quality study, which applied exhaustive exclusion criteria, and a rigorous protocol for anthropometrical evaluation. However, those charts, built on neonates born more than 40 years ago, have some limitations, especially concerning reliability of GA, which was estimated by last menstrual period only.

An area-based study aims to include all neonates born in a specific geographical area during a given period (Villar et al., Reference Villar, Altman, Purwar, Noble, Knight, Ruyan, Cheikh Ismail, Barros, Lambert, Papageorghiou, Carvalho, Jaffer, Bertino, Gravett, Bhutta and Kennedy2013). Within these geographical and temporal frames, the target population on which the chart is built must be defined by clear inclusion criteria (Bertino et al., Reference Bertino, Milani, Fabris and De Curtis2007; Milani et al., Reference Milani, Bossi, Bertino, di Battista, Coscia, Aicardi, Fabris and Benso2005) and should include a high percentage (e.g., above 80%; Villar et al., Reference Villar, Altman, Purwar, Noble, Knight, Ruyan, Cheikh Ismail, Barros, Lambert, Papageorghiou, Carvalho, Jaffer, Bertino, Gravett, Bhutta and Kennedy2013) of the target population. Studies included in our review are mainly area-based. However, the percentage of infants selected from the target population on which those charts are built was not reported. Moreover, several studies did not state clear inclusion and exclusion criteria.

A prospective preplanned study design is a requirement for a reliable anthropometric chart (Bertino et al., Reference Bertino, Milani, Fabris and De Curtis2007). In our review, we disclosed a very low percentage (9%) of preplanned studies. Instead, more than half of the included studies retrospectively extracted data from birth registries: this affects their reliability; in particular, regarding GA evaluation and anthropometric measurements.

Reliable GA estimation, based on both last menstrual period and first trimester ultrasound, is of foremost importance to build anthropometric charts (Kilpatrick et al., Reference Kilpatrick, Papile and Macones2017; Villar et al., Reference Villar, Altman, Purwar, Noble, Knight, Ruyan, Cheikh Ismail, Barros, Lambert, Papageorghiou, Carvalho, Jaffer, Bertino, Gravett, Bhutta and Kennedy2013). Only 34% of the studies included in our review adopted a reliable method to assess GA.

Of great importance, anthropometric measurements should be taken with standardized instruments and techniques, by trained and standardized operators (Benso et al., Reference Benso, Nicoletti and Gilli2004; Cheikh Ismail et al., Reference Cheikh Ismail, Knight, Ohuma, Hoch and Chumlea2013). Only a minority of the studies included in our review fulfilled these criteria. A complete neonatal auxological evaluation must include weight, body length and head circumference (Benso et al., Reference Benso, Nicoletti and Gilli2004). A major limitation of the studies included in our review is that most of them evaluated birth weight only, while all three variables were reported in only 14 (21%) of them.

Regarding chorionicity, it is still debated whether monochorionic and dichorionic twins need separate anthropometric charts (Dall’Asta et al., Reference Dall’Asta, Rizzo and Ghi2023; Melamed et al., Reference Melamed, Hiersch, Kingdom and Fox2023): the difference in growth related to chorionicity seems to be too small to be clinically significant and justify chorionic-specific charts (Hiersch et al., Reference Hiersch, Barrett, Fox, Rebarber, Kingdom and Melamed2022). In our review, only eight studies (12%) developed charts by placental chorionicity.

It is widely recognized that gender affects neonatal size at birth: however, one quarter of the studies included in our review did not produce gender-specific charts.

Regarding statistical methods, it is crucial to use an adequate statistical model to construct reliable anthropometric charts. In our review, the statistical models were not adequately described or not appropriate in nearly half of the included studies.

The methods used for the assessment of goodness of fit were not reported in the majority of studies. This does not allow the reader the evaluate the adequacy of the model used to trace charts.

The precision of the estimates is a relevant measure of the reliability of a chart. The precision of centile estimates increases with number of observations. Main areas of concern are external centiles in which the number of neonates is smaller. Standard errors or confidence limits of extreme centiles, which define the precision of those estimates, were not reported in 25 studies. Moreover, the number of neonates at each GA was not reported in 22 studies.

Smoothing reduces the fluctuation of raw centiles due to sample variability (Bertino et al., Reference Bertino, Milani, Fabris and De Curtis2007). To note that almost half of the included studies adopted descriptive approaches without the application of statistical models specific for tracing smoothed growth charts.

Presentation of neonatal size only by graphical methods without including numerical values makes the chart difficult to be used in clinical practice. In nearly 20% of the studies, values of at least 10th, 50th and 90th centiles were not reported or computable.

The possibility to express an anthropometric variable as z-score allows a better comparison between different subjects and statistical analyses in research. In half of the studies, z-scores were not reported or computable.

Strengths and Limitations

The major strengths of our study include: (1) the use of the most rigorous and up-to-date methodology for performing a systematic review of observational studies, in line with the MOOSE group recommendations; (2) the extensive literature search with the use of different databases, without language restrictions, which allowed us to find and include studies that were published in English, Spanish, German, Chinese, Russian, Italian, Hungarian, French and Korean in the systematic review; (3) the inclusion of a relatively large number of studies and of participants from different populations throughout the world; and (4) the use of a quality score checklist, which allowed an objective and quantitative assessment of study methodology.

Some potential limitations of our study should be considered: (1) the risk of bias in the data abstraction process information and in the study quality assessment since reviewers were not blinded to the origin and authors of included studies; and (2) it is possible that older studies in this systematic review were assessed according to quality criteria which have only been established in recent years.

Conclusions

This systematic review has identified substantial heterogeneity of methodology used in studies designed to create twin-specific neonatal anthropometric charts. We propose that the checklist we used for assessing the study methodological quality be used in future studies in order to improve consistency in twin-specific neonatal anthropometric charts research. It has been increasingly recognized the need of specific charts for the anthropometric evaluation of twin newborns (Hiersch et al., Reference Hiersch, Barrett, Fox, Rebarber, Kingdom and Melamed2022). The high number of studies identified in our search confirms this interest and need. However, studies that have so far developed twin-specific neonatal anthropometric charts have substantial methodological heterogeneity and limitations. Moreover, those charts are mainly references, derived from specific countries or regions at specific time points, and hence do not allow comparison among different populations or their use at international level.

The development of a high-quality international standard for newborn twins is of great relevance in both clinical practice and research for an appropriate auxological evaluation of twins worldwide.

Supplementary material

To view supplementary material for this article, please visit https://doi.org/10.1017/thg.2025.10027

Acknowledgments

We thank the librarians from the University of Turin and the Bodleian Library, University of Oxford, for their expert support in the literature search and retrieval.

Financial support

No external funding was received for this study.

Competing interests

The authors have no conflict of interests to declare.

Footnotes

*

These authors equally contributed

References

Alexander, G. R., Kogan, M., Martin, J., & Papiernik, E. (1998). What are the fetal growth patterns of singletons, twins, and triplets in the United States? Clinical Obstetrics and Gynecology, 41, 114125. https://doi.org/10.1097/00003081-199803000-00017 CrossRefGoogle ScholarPubMed
Alonso Ortiz, T., Armadá Maresca, M. I., Alonso Chacón, P., & Arias Zuluaga, P. (2003). Intrauterine twins growth percentiled curves and graphs according to sex and gestational age. Pediatrika, 23, 2429.Google Scholar
Alonso Ortiz, T., Armada Maresca, M. I., Alonso Chacon, P., & Arias Zuluaga, P. (2004). Twins: Anthropometry at birth according to sex and gestational age. Curves and charts according to standard deviation. Acta Pediatrica Espanola, 62, 457465.Google Scholar
Ananth, C. V., Vintzileos, A. M., Shen-Schwarz, S., Smulian, J. C., & Lai, Y. L. (1998). Standards of birth weight in twin gestations stratified by placental chorionicity. Obstetrics and Gynecology, 91, 917924. https://doi.org/10.1016/s0029-7844(98)00052-0 Google ScholarPubMed
Arbuckle, T. E., Wilkins, R., & Sherman, G. J. (1993). Birth weight percentiles by gestational age in Canada. Obstetrics and Gynecology, 81, 3948.Google ScholarPubMed
Bacak, S. J., Li, D., Dye, T. D., & Ozcan, T. (2016). United States birth weight references for twin and triplet pregnancies and timing of delivery. Reproductive Sciences, 23, 269A. https://doi.org/10.1177/1933719116641257 Google Scholar
Beiguelman, B., Colletto, G. M. D. D., Franchi-Pinto, C., & Krieger, H. (1998). Birth weight of twins: 1. The fetal growth patterns of twins and singletons. Genetics and Molecular Biology, 21, 151154. http://doi:10.1590/S1415-47571998000100025 CrossRefGoogle Scholar
Benso, L., Nicoletti, I., & Gilli, G. (2004). Measuring techniques and instruments. In Physiological and pathological auxology. Nicomp Laboratorio Editoriale.Google Scholar
Bertino, E., Bagna, R., Licata, D., & Fabris, C. (1997). Neonatal anthropometric standards for twins. Rivista Italiana di Pediatria, 23, 98105.Google Scholar
Bertino, E., Milani, S., Fabris, C., & De Curtis, M. (2007). Neonatal anthropometric charts: what they are, what they are not. Archives of disease in childhood. Fetal and Neonatal Edition, 92, F7F10. https://doi.org/10.1136/adc.2006.096214 CrossRefGoogle ScholarPubMed
Bondarenko, K. R., Kuznetsov, P. A., Dzhokhadze, L. S., Lyan, V. V., Kriger, A. V., & Eletnova, E. S. (2020). Centile nomograms for body weight and length of multiple-birth infants. Russian Journal of Woman and Child Health, 3, 2025. https://doi.org/10.32364/2618-8430-2020-3-1-20-25 CrossRefGoogle Scholar
Bossi, A., Cortinovis, I., Milani, S., Gallo, L., Kusterman, A., & Morotti, R. (1994).Twins: Neonatal standards for weight, length and head-size. Acta Medica Auxologica (Milan), 25, 8196.Google Scholar
Bricelj, K., Blickstein, I., Bržan-Šimenc, G., Janša, V., Lučovnik, M., Verdenik, I., Trojner-Bregar, A., & Tul, N. (2017). Growth curves for twins in Slovenia. Journal of Maternal-Fetal & Neonatal Medicine, 30, 479481. https://doi.org/10.1080/14767058.2016.1175425 CrossRefGoogle ScholarPubMed
Briffa, C., Di Fabrizio, C., Kalafat, E., Giorgione, V., Bhate, R., Huddy, C., Richards, J., Shetty, S., & Khalil, A. (2022). Adverse neonatal outcome in twin pregnancy complicated by small-for-gestational age: twin vs singleton reference charts. Ultrasound in Obstetrics & Gynecology, 59, 377384. https://doi.org/10.1002/uog.23764 CrossRefGoogle ScholarPubMed
Briffa, C., Stirrup, O., Huddy, C., Richards, J., Shetty, S., Reed, K., & Khalil, A. (2021). Twin chorionicity-specific population birth-weight charts adjusted for estimated fetal weight. Ultrasound in Obstetrics & Gynecology, 58, 439449. https://doi.org/10.1002/uog.23606 CrossRefGoogle ScholarPubMed
Buckler, J. M., & Green, M. (1994). Birth weight and head circumference standards for English twins. Archives of Disease in Childhood, 71, 516521. https://doi.org/10.1136/adc.71.6.516 CrossRefGoogle ScholarPubMed
Buckler, J. M., & Green, M. (2004). A comparison of the early growth of twins and singletons. Annals of Human Biology, 3, 311332. https://doi.org/10.1080/03014460410001670120 CrossRefGoogle Scholar
Cheikh Ismail, L., Knight, H. E., Ohuma, E. O., Hoch, L., Chumlea, W. C., & International Fetal and Newborn Growth Consortium for the 21st Century. (2013). Anthropometric standardisation and quality control protocols for the construction of new, international, fetal and newborn growth standards: the INTERGROWTH-21st Project. BJOG, 120, 4855. https://doi.org/10.1111/1471-0528.12127 CrossRefGoogle ScholarPubMed
Cohen, S. B., Dulitzky, M., Lipitz, S., Mashiach, S., & Schiff, E. (1997). New birth weight nomograms for twin gestation on the basis of accurate gestational age. American Journal of Obstetrics and Gynecology, 177, 11011104. https://doi.org/10.1016/s0002-9378(97)70023-1 CrossRefGoogle ScholarPubMed
Cole, T. J., & Green, P. J. (1992). Smoothing reference centile curves: The LMS method and penalized likelihood. Statistics in Medicine, 11, 13051319. https://doi.org/10.1002/sim.4780111005 CrossRefGoogle ScholarPubMed
Dai, L., Deng, C., Li, Y., Yi, L., Li, X., Mu, Y., Li, Q., Yao, Q., & Wang, Y. (2017). Population-based birth weight reference percentiles for Chinese twins. Anthropometric standardisation and quality control protocols for the construction of new, international, fetal and newborn growth standards: The INTERGROWTH-21st Project. Annals of Medicine, 49, 470478. https://doi.org/10.1080/07853890.2017.1294258 CrossRefGoogle Scholar
Dall’Asta, A., Rizzo, G., & Ghi, T. (2023). Clinical implementation of twin-specific growth charts: Still more work to do. American Journal of Obstetrics and Gynecology, 228, 253254. https://doi.org/10.1016/j.ajog.2022.10.009 CrossRefGoogle ScholarPubMed
De Paepe, M. E., Shapiro, S., Young, L. E., & Luks, F. I. (2015). Placental weight, birth weight and fetal:placental weight ratio in dichorionic and monochorionic twin gestations in function of gestational age, cord insertion type and placental partition. Placenta, 36, 213220. https://doi.org/10.1016/j.placenta.2014.11.009 CrossRefGoogle ScholarPubMed
Dickey, R. P., Pridjian, G., Xiong, X., & Klempel, M. C. (2017). Birth weight by gestational age for 76,710 twins born in the United States as a result of in vitro fertilization: 2006 to 2010. American Journal of Perinatology, 34, 3137. https://doi.org/10.1055/s-0036-1584137 CrossRefGoogle Scholar
Dollberg, S., Haklai, Z., Mimouni, F. B., Gorfein, I., & Gordon, E. S. (2005). Birth weight standards in the live-born population in Israel. The Israel Medical Association Journal, 7, 311314.Google ScholarPubMed
Doom, E. C., Delbaere, I., Martens, G., & Temmerman, M. (2012). Birth weight for gestational age among Flemish twin population. Facts, Views and Vision in ObGyn, 4, 4249.Google ScholarPubMed
Garza, C., & de Onis, M. (2004). Rationale for developing a new international growth reference. Food and Nutrition Bulletin, 25, S5S14. https://doi.org/10.1177/15648265040251S102 CrossRefGoogle ScholarPubMed
Gielen, M., Lindsey, P. J., Derom, C., Loos, R. J., Derom, R., Nijhuis, J. G., & Vlietinck, R. (2007). Twin birth weight standards. Neonatology, 92, 164173. https://doi.org/10.1159/000102055 CrossRefGoogle ScholarPubMed
Gielen, M., Lindsey, P. J., Derom, C., Loos, R. J., Souren, N. Y., Paulussen, A. D., Zeegers, M. P., Derom, R., Vlietinck, R., & Nijhuis, J. G. (2008). Twin-specific intrauterine ‘growth’ charts based on cross-sectional birthweight data. Twin Research and Human Genetics, 11, 224235. https://doi.org/10.1375/twin.11.2.224 CrossRefGoogle ScholarPubMed
Giorgione, V., Briffa, C., Di Fabrizio, C., Bhate, R., & Khalil, A. (2021). Perinatal outcomes of small for gestational age in twin pregnancies: Twin vs. singleton charts. Journal of Clinical Medicine, 10, 643. https://doi.org/10.3390/jcm10040643 CrossRefGoogle ScholarPubMed
Giuliani, F., Ohuma, E., Spada, E., Bertino, E., Al Dhaheri, A. S., Altman, D. G., Conde-Agudelo, A., Kennedy, S. H., Villar, J., & Cheikh Ismail, L. (2015). Systematic review of the methodological quality of studies designed to create neonatal anthropometric charts. Acta Paediatrica, 104, 987996. https://doi.org/10.1111/apa.13112 CrossRefGoogle ScholarPubMed
Glinianaia, S. V., Skjaerven, R., & Magnus, P. (2000). Birthweight percentiles by gestational age in multiple births. A population-based study of Norwegian twins and triplets. Acta Obstetricia et Gynecologica Scandinavica, 79, 450458.Google ScholarPubMed
Grummer-Strawn, L. M., Garza, C., & Johnson, C. L. (2002).Childhood growth charts. Pediatrics, 109, 141142. https://doi.org/10.1542/peds.109.1.141 CrossRefGoogle ScholarPubMed
Hennequin, Y., Rorive, S., Vermeylen, D., & Pardou, A. (1999). Jumeaux: interprétation des courbes staturo-pondérales à la naissance [Twins: interpretation of height-weight curves at birth]. Revue medicale de Bruxelles, 20, 8185.Google Scholar
Hiersch, L., Barrett, J., Fox, N. S., Rebarber, A., Kingdom, J., & Melamed, N. (2022). Should twin-specific growth charts be used to assess fetal growth in twin pregnancies?. American Journal of Obstetrics and Gynecology, 227, 1028. https://doi.org/10.1016/j.ajog.2022.01.027 CrossRefGoogle ScholarPubMed
Hong, J. S., Yi, S. W., Han, Y. J., Park, Y. W., Nam, C. M., Kang, H. C., & Ohrr, H. (2007). Fetal growth and neonatal mortality in Korea. Paediatric and Perinatal Epidemiology, 21, 397410. https://doi.org/10.1111/j.1365-3016.2007.00850.x CrossRefGoogle ScholarPubMed
Horst, N., Dera-Szymanowska, A., Breborowicz, G. H., & Szymanowski, K. (2022). Outcome dependent twin growth curves based on birth weight percentiles for Polish population. Journal of Maternal-Fetal & Neonatal Medicine, 35, 25302535. https://doi.org/10.1080/14767058.2020.1786810 CrossRefGoogle ScholarPubMed
Hsieh, T. T., Chen, C. J., & Hsu, J. J. (1992). Birth weight by gestational age in twin pregnancies: Analysis of 661 pairs. Journal of the Formosan Medical Association = Taiwan yi zhi, 91, 195198.Google ScholarPubMed
Hu, I. J., Hsieh, C. J., Jeng, S. F., Wu, H. C., Chen, C. Y., Chou, H. C., Tsao, P. N., Lin, S. J., Chen, P. C., & Hsieh, W. S. (2015). Nationwide twin birth weight percentiles by gestational age in Taiwan. Pediatrics and Neonatology, 56, 294300. https://doi.org/10.1016/j.pedneo.2014.12.004 CrossRefGoogle ScholarPubMed
Huang, X. Y., Liu, H. L., Lei, M., Lian, Z. H., & Mai, H. F. (2018). [Intrauterine growth status of twin neonates with a gestational age of 27–40 weeks.] Zhongguo dang dai er ke za zhi [Chinese journal of contemporary pediatrics], 20, 267273. https://doi.org/10.7499/j.issn.1008-8830.2018.04.003 Google ScholarPubMed
Huang, X. Y., Zhu, Y. F., Liu, H. L., Wu, G. W., Liu, C. Y., Zeng, D. Y., He, J., Shi, Q. X., Chen, C. S., Zhu, B., Wang, G. X., Shi, H., & Lu, H. H. (2022). Birth weight curves of twin neonates with a gestational age of 25–40 weeks and their regional differences in 11 cities of China: an analysis of 17 256 cases. Zhongguo dang dai er ke za zhi [Chinese journal of contemporary pediatrics], 24, 899907. https://doi.org/10.7499/j.issn.1008-8830.2204026 Google ScholarPubMed
İmamoğlu, Y. E., Hayran, M., Mahir Kayıran, S., Zeybek, G., Sevük Özümüt, S., Karatekin, G., Ovalı, F., & Gürsoy, T. (2021). Birth weight reference percentiles by gestational age for Turkish twin neonates. Turkish Archives of Pediatrics, 56, 316321. https://doi.org/10.5152/TurkArchPediatr.2021.20259 CrossRefGoogle Scholar
Ishida, Y., Takemoto, Y., Kato, M., Latif, M., Ota, E., Morisaki, N., & Itakura, A. (2022). Birth weight reference for Japanese twins and risk factors for infant mortality: A population-based study. PloS One, 17, e0271440. https://doi.org/10.1371/journal.pone.0271440 CrossRefGoogle ScholarPubMed
Joseph, K. S., Fahey, J., Platt, R. W., Liston, R. M., Lee, S. K., Sauve, R., Liu, S., Allen, A. C., & Kramer, M. S. (2009). An outcome-based approach for the creation of fetal growth standards: Do singletons and twins need separate standards?. American Journal of Epidemiology, 169, 616624. https://doi.org/10.1093/aje/kwn374 CrossRefGoogle ScholarPubMed
Kalanda, B. F., Verhoeff, F. H., & Brabin, B. J. (2006). Size and morbidity in Malawian twins. European Journal of Clinical Nutrition, 60, 598604. https://doi.org/10.1038/sj.ejcn.1602356 CrossRefGoogle ScholarPubMed
Karna, P., Brooks, K., Muttineni, J., & Karmaus, W. (2005). Anthropometric measurements for neonates, 23 to 29 weeks gestation, in the 1990s. Paediatric and Perinatal Epidemiology, 19, 215226. https://doi.org/10.1111/j.1365-3016.2005.00641.x CrossRefGoogle ScholarPubMed
Kato, N. (2004). Reference birthweight range for multiple birth neonates in Japan. BMC Pregnancy and Childbirth, 4, Article 2. https://doi.org/10.1186/1471-2393-4-2 Google Scholar
Kato, N., & Uchiyama, Y. (2005). Reference birth-length range for multiple-birth neonates in Japan. American Journal of Obstetrics and Gynecology Research, 31, 4349. https://doi.org/10.1111/j.1447-0756.2005.00248.x Google ScholarPubMed
Kilpatrick, S. J., Papile, L.-A., & Macones, G. A. (2017). Guidelines for perinatal care (8th ed.). American Academy of Pediatrics.Google Scholar
Kosińska, M., Sierzputowska-Pieczara, M., Gadzinowski, J., Cygan, D., & Szpecht, D. (2018). Percentile charts of twin birthweight. Pediatrics International, 60, 948953. https://doi.org/10.1111/ped.13669 CrossRefGoogle ScholarPubMed
Lee, J. K., Jang, H. L., Kang, B. H., Lee, K. S., Choi, Y. S., Shim, K. S., Lim, J. W., Bae, C. W., & Chung, S. H. (2016). Percentile distributions of birth weight according to gestational ages in Korea (2010–2012). Journal of Korean Medical Science, 31, 939949. https://doi.org/10.3346/jkms.2016.31.6.939 CrossRefGoogle ScholarPubMed
Lee, J.-J. (2007). Birth weight for gestational age patterns by sex, plurality, and parity in Korean population. (2007). Korean Journal of Pediatrics, 50, 732739. http://doi.org/10.3345/kjp.2007.50.8.732 CrossRefGoogle Scholar
Li, Z., Umstad, M. P., Hilder, L., Xu, F., & Sullivan, E. A. (2015). Australian national birthweight percentiles by sex and gestational age for twins, 2001–2010. BMC Pediatrics, 15, 148. http://doi.org/10.1186/s12887-015-0464-y CrossRefGoogle ScholarPubMed
Liu, Y. C., & Blair, E. M. (2002). Predicted birthweight for singletons and twins. Twin Research, 5, 529537. https://doi.org/10.1375/136905202762341991 CrossRefGoogle ScholarPubMed
Liu, Q., Wen, J., Fang, L., Huang, Y., Rao, T., Shi, X., & Wu, J. (2021). Birth weight and percentiles for twins based on sex and chorionicity in the south of China. Research Square preprint. https://doi.org/10.21037/tp-24-308 Google Scholar
Luke, B., Witter, F. R., Abbey, H., Feng, T., Namnoum, A. B., Paige, D. M., & Johnson, T. R. (1991). Gestational age-specific birthweights of twins versus singletons. Acta Geneticae Medicae et Gemellologiae, 40, 6976. https://doi.org/10.1017/s0001566000006747 CrossRefGoogle ScholarPubMed
Melamed, N., Hiersch, L., Kingdom, J., & Fox, N. (2023). Twin-specific growth charts in twin pregnancies: One win at a time. American Journal of Obstetrics and Gynecology, 228, 254255. https://doi.org/10.1016/j.ajog.2022.10.010 CrossRefGoogle ScholarPubMed
Miao, H., Yao, F., Wu, Y., Zhang, X., He, R., Li, B., & Zhao, Q. (2019). Birth weight percentiles by sex and gestational age for twins born in southern China. Scientific Reports, 9, 757. https://doi.org/10.1038/s41598-018-36758-6 CrossRefGoogle ScholarPubMed
Minakami, H., Izumi, A., & Sato, I. (1999). Gestational age-specific normal birth weight for Japanese twins. Risk of early neonatal death in small-for-gestational-age and large-for-gestational-age twins. Journal of Reproductive Medicine, 44, 625629.Google ScholarPubMed
Milani, S., Bossi, A., Bertino, E., di Battista, E., Coscia, A., Aicardi, G., Fabris, C., & Benso, L. (2005). Differences in size at birth are determined by differences in growth velocity during early prenatal life. Pediatric Research, 57, 205210. https://doi.org/10.1203/01.PDR.0000148452.98518.D5 CrossRefGoogle ScholarPubMed
Odibo, A. O., Cahill, A. G., Goetzinger, K. R., Harper, L. M., Tuuli, M. G., & Macones, G. A. (2013). Customized growth charts for twin gestations to optimize identification of small-for-gestational age fetuses at risk of intrauterine fetal death. Ultrasound in Obstetrics and Gynecology, 41, 637642. https://doi.org/10.1002/uog.12404 CrossRefGoogle ScholarPubMed
Ooki, S., & Yokoyama, Y. (2003). Reference birth weight, length, chest circumference, and head circumference by gestational age in Japanese twins. Journal of Epidemiology, 13, 333341. https://doi.org/10.2188/jea.13.333 CrossRefGoogle ScholarPubMed
Parazzini, F., Cortinovis, I., Bortolus, R., Fedele, L., & Decarli, A. (1995). Weight at birth by gestational age in Italy. Human Reproduction, 10, 18621863. https://doi.org/10.1093/oxfordjournals.humrep.a136192 CrossRefGoogle ScholarPubMed
Parazzini, F., Cortinovis, I., Bortolus, R., & Zanardo, V. (1998). Distribuzione del peso nei nati tra la 23a e la 42a settimana di gestazione in Italia [Birth weight of infants born between the 23rd and 42nd gestational week in Italy]. La Pediatria medica e chirurgica [Medical and Surgical Pediatrics], 20, 9397.Google Scholar
Parveen, Z. (2001). Birth weight percentiles by gestational age: A hospital based study. Journal of Ayub Medical College, 13, 2227.Google ScholarPubMed
Plana, A., Domingo, S., Barrachina, R., Cervera, J., Perales, A., & Monleon, J. (1997). Weight nomogran at birth for twin pregnancies in a Mediterranean population. Progresos en Obstetricia y Ginecologia, 40, 1923.Google Scholar
Premkumar, P., Antonisamy, B., Mathews, J., Benjamin, S., Regi, A., Jose, R., Kuruvilla, A., & Mathai, M. (2016). Birth weight centiles by gestational age for twins born in south India. BMC Pregnancy and Childbirth, 16, 64. https://doi.org/10.1186/s12884-016-0850-y CrossRefGoogle ScholarPubMed
Roberts, C. L., & Lancaster, P. A. (1999). National birthweight percentiles by gestational age for twins born in Australia. Journal of Paediatrics and Child Health, 35, 278282. https://doi.org/10.1046/j.1440-1754.1999.00354.x CrossRefGoogle ScholarPubMed
Robertson, C. M., Svenson, L. W., & Kyle, J. M. (2002). Birth weight by gestational age for Albertan liveborn infants, 1985 through 1998. Journal of Obstetrics and Gynaecology Canada, 24, 138148. https://doi.org/10.1016/s1701-2163(16)30295-x CrossRefGoogle ScholarPubMed
Rubin, L., Haklai, Z., Dollberg, S., Zimmerman, D., & Gordon, E. S. (2022). Improved method for revising the Israel birthweight references. Journal of Perinatal Medicine, 50, 977984. https://doi.org/10.1515/jpm-2021-0401 CrossRefGoogle ScholarPubMed
Rydhström, H. (1992). A birthweight-for-gestation standard based on 4737 twins born in Sweden between 1983 and 1985. Acta obstetricia et gynecologica Scandinavica, 71, 506511. https://doi.org/10.3109/00016349209041441 CrossRefGoogle ScholarPubMed
Sankilampi, U., Hannila, M. L., Saari, A., Gissler, M., & Dunkel, L. (2013). New population-based references for birth weight, length, and head circumference in singletons and twins from 23 to 43 gestation weeks. Annals of Medicine, 45, 446454. https://doi.org/10.3109/07853890.2013.803739 CrossRefGoogle ScholarPubMed
Song, S., Zhu, Z., Mao, W., Zhu, Y., Zhang, R., Bu, X., Li, H., Han, Y., Cao, Y., Gao, Y., Qiu, Y. P., Wei, G., Zhang, P., Xie, J., Wang, M., Chen, C., & Zhu, L. (2024). Comparison of singleton and twin birth weight reference percentile curves by gestational age and sex in extremely preterm infants: A population-based study. BMJ Paediatrics Open, 8, e002502. https://doi.org/10.1136/bmjpo-2024-002502 CrossRefGoogle ScholarPubMed
Stroup, D. F., Berlin, J. A., Morton, S. C., Olkin, I., Williamson, G. D., Rennie, D., Moher, D., Becker, B. J., Sipe, T. A., & Thacker, S. B. (2000). Meta-analysis of observational studies in epidemiology: A proposal for reporting. JAMA, 283, 20082012. https://doi.org/10.1001/jama.283.15.2008 CrossRefGoogle ScholarPubMed
Teng, R. J., Jou, H. J., & Ho, M. M. (1994). Intrauterine growth of twins in Taiwan. Zhonghua Minguo Xiao Er Ke Yi Xue Hui Za Zhi, 35, 266272.Google ScholarPubMed
Ticona Rendón, M., Huanco Apaza, D., Rossi Blackwelder, G., & Gonzáles Rivera, J. (2006). Crecimiento intrauterino en un grupo seleccionado de gemelos peruanos [Intrauterine growth in a selected group of Peruvian twins]. Ginecologia y obstetricia de Mexico, 74, 144152.Google Scholar
Uauy, R., Casanello, P., Krause, B., Kusanovic, J. P., Corvalan, C., & International Fetal and Newborn Growth Consortium for the 21st Century. (2013). Conceptual basis for prescriptive growth standards from conception to early childhood: Present and future. BJOG, 120, 38. https://doi.org/10.1111/1471-0528.12057 CrossRefGoogle ScholarPubMed
Urquia, M. L., Alazraqui, M., Spinelli, H. G., & Frank, J. W. (2011). Referencias poblacionales argentinas de peso al nacer según multiplicidad del parto, sexo y edad gestacional [Reference birthweights for the Argentine population by multiplicity of birth, sex, and gestational age]. Revista panamericana de salud publica [Pan American Journal of Public Health], 29, 108119.Google Scholar
Usynina, A. A., Postoev, V. A., Odland, J.Ø., Chumakova, G. N., & Grjibovski, A. M. (2017).Gestation-specific live-born twin birth weight, length and head circumference percentiles and curves adapted for North-Western Russia. Human Ecology, 24, 5864. https://doi.org/10.33396/1728-0869-2017-6-58-64 Google Scholar
Villar, J., Altman, D. G., Purwar, M., Noble, J. A., Knight, H. E., Ruyan, P., Cheikh Ismail, L., Barros, F. C., Lambert, A., Papageorghiou, A. T., Carvalho, M., Jaffer, Y. A., Bertino, E., Gravett, M. G., Bhutta, Z. A., Kennedy, S. H., & International Fetal and Newborn Growth Consortium for the 21st Century. (2013). The objectives, design and implementation of the INTERGROWTH-21st Project. BJOG, 120, 926. https://doi.org/10.1111/1471-0528.12047 CrossRefGoogle ScholarPubMed
Villar, J., Cheikh Ismail, L., Victora, C. G., Ohuma, E. O., Bertino, E., Altman, D. G., Lambert, A., Papageorghiou, A. T., Carvalho, M., Jaffer, Y. A., Gravett, M. G., Purwar, M., Frederick, I. O., Noble, A. J., Pang, R., Barros, F. C., Chumlea, C., Bhutta, Z. A., Kennedy, S. H., & International Fetal and Newborn Growth Consortium for the 21st Century (INTERGROWTH-21st). (2014). International standards for newborn weight, length, and head circumference by gestational age and sex: The Newborn Cross-Sectional Study of the INTERGROWTH-21st Project. Lancet, 384, 857868. https://doi.org/10.1016/S0140-6736(14)60932-6 CrossRefGoogle ScholarPubMed
Voigt, M., Schneider, K. T. M., Friese, K., Hesse, V., & Wermke, K. (1999). Analysis of births in Germany, Part 3: Birth weight, length and head circumference of twins. Geburtshilfe und Frauenheilkunde, 59, 346354. https://doi.org/10.1055/s-1999-15372 CrossRefGoogle Scholar
Voigt, M., Wermke, K., Schneider, K. T. M., Jorch, G., & Friese, K. (2001).Growth percentiles of singleton and twin newborns: Analysis of births in Germany. Geburtshilfe und Frauenheilkunde, 61, 147152. doi: https://doi.org/10.1055/s-2001-11901 CrossRefGoogle Scholar
Voigt, M., Rochow, N., Schneider, K. T., Hagenah, H. P., Straube, S., Scholz, R., Hesse, V., Hentschel, R., & Olbertz, D. (2014). Neue Perzentilwerte für die Körpermaße neugeborener Zwillinge: Ergebnisse der deutschen Perinatalerhebung der Jahre 2007–2011 unter Beteiligung aller 16 Bundesländer [New percentile values for the anthropometric dimensions of twin neonates: Analysis of perinatal survey data of 2007–2011 from all 16 states of Germany]. Zeitschrift fur Geburtshilfe und Neonatologie, 218, 254260. https://doi.org/10.1055/s-0034-1385858 Google Scholar
Expert Committee, WHO (1995). Physical status: The use and interpretation of anthropometry. World Health Organization Technical Report Series, 854, 1452.Google Scholar
Wohlin, C., Kalinowski, M., Romero Felizardo, K., & Mendes, E. (2022).Successful combination of database search and snowballing for identification of primary studies in systematic literature studies. Information and Software Technology;147:106908. doi: https://doi.org/10.1016/j.infsof.2022.106908 CrossRefGoogle Scholar
Zhang, B., Cao, Z., Zhang, Y., Yao, C., Xiong, C., Zhang, Y., Wang, Y., & Zhou, A. (2016). Birthweight percentiles for twin birth neonates by gestational age in China. Scientific Reports, 6, 31290. https://doi.org/10.1038/srep31290 CrossRefGoogle ScholarPubMed
Zsirai, L., Csákány, M. G., Végh, G., & Tabak, G. A. (2019). [Distribution of birth weights between 2011 and 2015 and changes in percentile figures between 1996 and 2015. Analyis of the Tauffer database]. Orvosi hetilap, 160, 14261436. https://doi.org/10.1556/650.2019.3148 CrossRefGoogle Scholar
Figure 0

Figure 1. PRISMA flowchart for the systematic review.

Figure 1

Table 1. Descriptive characteristics of selected studies

Figure 2

Table 2. Risk of bias for each of the 18 items assessed in the three domains

Figure 3

Figure 2. Whisker plot showing the range of quality scores across individual domains and the overall quality score. Each box represents the interquartile range (IQR), with the line indicating the median. Whiskers extend to the minimum and maximum observed values. Notably, in Domain 3, the median and third quartile values overlap, indicating a clustering of high scores within the upper range.

Supplementary material: File

Deantoni et al. supplementary material

Deantoni et al. supplementary material
Download Deantoni et al. supplementary material(File)
File 36 KB