


Introduction
The last few decades have seen a strong decline in taxes on the richest members of society (Hope and Limberg Reference Hope and Limberg2022; Kiser and Karceski Reference Kiser and Karceski2017; Scheve and Stasavage Reference Scheve and Stasavage2016). Most advanced market economies have drastically cut taxes on capital (Swank Reference Swank2016), wealth (Elkjær et al. Reference Elkjær, Bokobza, Cansunar, Haslberger and Nyrup2025; Emmenegger and Lierse Reference Emmenegger and Lierse2022; OECD 2018; Scheve and Stasavage Reference Scheve and Stasavage2012), and top incomes (Alvaredo et al. Reference Alvaredo, Atkinson, Piketty and Saez2013; Förster et al. Reference Förster, Llena-Nozal and Nafilyan2014). As a consequence, it is now not uncommon for the superrich to pay lower total tax rates than people a long way below them in the income distribution (Advani et al. Reference Advani, Hughson and Summers2023; Alstadsæter et al. Reference Alstadsæter, Godar, Nicolaides and Zucman2023; Guzzardi, et al. Reference Guzzardi, Palagi, Roventini and Santoro2024; Saez and Zucman Reference Saez and Zucman2019). This phenomenon of tax regressivity at the top was famously highlighted by billionaire investor Warren Buffet, who publicly complained that he paid a far lower tax rate on his income than did his long-time secretary Debbie Bosanek (ABC News 2012).
In this article, we look at how information about tax regressivity at the top affects people’s tax policy preferences. How do people react when they find out that the superrich pay a lower total tax rate than people much poorer than them? Do they demand tax policy changes? And, if so, which changes do they ask for?
We explore these questions by carrying out a pre-registered information provision experiment with around 4,000 respondents in the United States. We randomly split the sample into two groups. The control group receives information on total tax rates for the five income quintiles (the poorest 20 per cent through to the richest 20 per cent) in the United States. The treatment group sees that same information but with the addition of the total tax rate for the richest 400 people in the United States, which is lower than the rate for all the other income groups.
We find that informing respondents about tax regressivity at the top affects their support for tax policy reforms. Unsurprisingly, treated respondents show greater support for raising taxes on the highest income earners. However, they also show lower support for taxing the middle class. Put another way, people want to both raise taxes for Warren Buffet and to reduce taxes for his secretary Debbie Bosanek. We also find some evidence that people are less willing to pay higher taxes to increase funding for public services upon finding out about the superrich’s preferential treatment by the tax system. Taken together, the results highlight an important hidden cost of tax regressivity at the top: if left unaddressed, it could risk undermining public support for the broad-based taxation that forms the backbone of governments’ fiscal capacity.
In a follow-up analysis, we explore the mechanisms. We find that the main results on tax policy preferences run through respondents’ perceptions of tax fairness. Treated respondents see the US tax system as less fair, which in turn affects their tax policy preferences. This speaks to the large body of existing literature showing that tax policy preferences are not just driven by economic self-interest but are also heavily shaped by fairness considerations (Alesina and Angeletos Reference Alesina and Angeletos2005; Alvarado Reference Alvarado2024; Cavaillé Reference Cavaillé2023; Hope et al. Reference Hope, Limberg and Weber2023; Limberg Reference Limberg2020; Scheve and Stasavage Reference Scheve and Stasavage2016, Reference Scheve and Stasavage2023; Stantcheva Reference Stantcheva2021). In particular, the finding aligns with previous research on perceptions of tax fairness that would suggest that tax regressivity at the top is likely to violate widely held norms around equal treatment, ability to pay, and compensatory fairness (Scheve and Stasavage Reference Scheve and Stasavage2016, Reference Scheve and Stasavage2023).
Our findings provide a novel contribution to the literature on the determinants of tax policy preferences (Ballard-Rosa et al. Reference Ballard-Rosa, Martin and Scheve2017; Barnes Reference Barnes2015, Reference Barnes2022; Berens and Gelepithis Reference Berens, Gelepithis, Lukas and Laura2021; Cansunar Reference Cansunar2021; Hope et al. Reference Hope, Limberg and Weber2023; Limberg Reference Limberg2020; Mathisen Reference Mathisen2024; Scheve and Stasavage Reference Scheve and Stasavage2016; Stantcheva Reference Stantcheva2021). While several of these studies have looked at preferences for progressive taxation and taxing the rich in isolation, we still do not know how the lower total tax rates paid by the superrich affect public support for general taxation. We close this research gap by showing that tax regressivity at the top reduces popular demand for broad-based taxation. Our findings also have broader implications, as they highlight that tax policies are highly interdependent. How much the superrich are taxed has important knock-on effects on support for taxes on other parts of the income distribution.
Data and Research Design
We conducted an information provision survey experiment in the United States to study the effect of tax regressivity at the top on tax policy preferences. The experiment was coded in Qualtrics and we recruited around 4,000 respondents via cross-stratified quota sampling (on age, gender, and political affiliation) through the survey platform Prolific.Footnote 1
The survey was divided into three parts. First, respondents were asked a battery of demographic questions. These covered, among others, age, gender, education, ethnicity, political trust, left–right placement, partisan affiliation, and household income.
Second, respondents were randomly assigned to the treatment or control group. The treatment consisted of a short text and a line chart. The chart presented the respondents with factual information about the total tax rate by income groups in the United States. Total tax rates were presented for the five income quintiles, showing a mildly progressive tax scale, as well as for the richest 400 people, where tax rates drop substantially. Data came from Saez and Zucman (Reference Saez and Zucman2019).Footnote 2 Respondents in the control group received a similar text and line chart, but with the difference that only the information for the five income quintiles was shown. The information that was provided to control and treatment groups is shown in Figure 1. Our approach ensured that the only difference in the information received by the two groups was the total tax rate on the superrich and everything else was held constant (for example, overall levels of taxation). Hence, it allows us to focus solely on the causal effect of tax regressivity at the top. Furthermore, an active control group also has the advantage that it rules out priming effects, makes the effect less dependent on prior beliefs about tax progressivity, and accounts for side effects of treatment provision (for example, attention) (Haaland et al. Reference Haaland, Roth and Wohlfart2023).
For both the treatment and control groups, the text we provided accompanying the line chart (see Figure 1) explained that total tax rates include all taxes (such as income tax, sales tax, corporate tax, and property and estate tax) at the federal, state, and local levels. The text also explained that higher total tax rates mean that income groups are paying a higher share of their overall income in taxation. Hence, all respondents were informed what total tax rates are and how the line chart should be interpreted. Furthermore, we conduct a manipulation check which shows that the treatment successfully altered perceptions of tax regressivity at the top (see Mechanisms section).
Information provided to the control (left panel) and treatment (right panel) groups in the experiment.

The final part of the survey focused on respondents’ beliefs and policy preferences. To investigate the impact of the treatment on tax policy preferences, we asked respondents about their opinion on income tax rates on the lowest, average, and the highest income earners. More specifically, we ask respondents: ‘What’s your opinion on [income taxes on the highest income earners with annual household income above ${\$}$
800,000]/[income taxes on average income earners with annual household income of around
${\$}$
800,000]/[income taxes on average income earners with annual household income of around ${\$}$
80,000]/[income taxes on the lowest income earners with annual household income below
${\$}$
80,000]/[income taxes on the lowest income earners with annual household income below ${\$}$
20,000]?’ To ensure respondents thought of the same income groups, we provided reference incomes that broadly correspond to annual household income of the top 1 per cent of income earners, median income earners, and an income earner in the bottom decile of the income distribution (WID 2025). Answers could range from 0 (strongly decrease) to 10 (strongly increase). We chose to focus on income taxes specifically as they are a highly visible tax in the United States that respondents will be familiar with and may already have opinions on. Income tax rates on different income groups are also policy levers that are under the direct control of the US government and could be changed in response to shifts in public opinion. In addition to asking about income tax preferences, we asked respondents about their willingness to pay higher taxes to fund public services, their fairness perceptions of the tax system, and their satisfaction with democracy. The full survey instrument including the question wordings can be found in Part A of the supplementary material.
${\$}$
20,000]?’ To ensure respondents thought of the same income groups, we provided reference incomes that broadly correspond to annual household income of the top 1 per cent of income earners, median income earners, and an income earner in the bottom decile of the income distribution (WID 2025). Answers could range from 0 (strongly decrease) to 10 (strongly increase). We chose to focus on income taxes specifically as they are a highly visible tax in the United States that respondents will be familiar with and may already have opinions on. Income tax rates on different income groups are also policy levers that are under the direct control of the US government and could be changed in response to shifts in public opinion. In addition to asking about income tax preferences, we asked respondents about their willingness to pay higher taxes to fund public services, their fairness perceptions of the tax system, and their satisfaction with democracy. The full survey instrument including the question wordings can be found in Part A of the supplementary material.
As our experiment employs a between-subjects design, our outcome variables are only measured post-treatment. We use an OLS model with a binary treatment variable to see whether the information treatment changes people’s beliefs and preferences. Our main statistical model takes the following form:
 $$ Y_i = \beta _0 + \beta _1 U_i + \varepsilon _i $$
Y i measures the respective outcome variable, β 1 is the coefficient for our information treatment U i . ε i denotes the error term. In case of missing answers for our key dependent variables, we exclude the individual from the analyses of the respective item.
Main Results
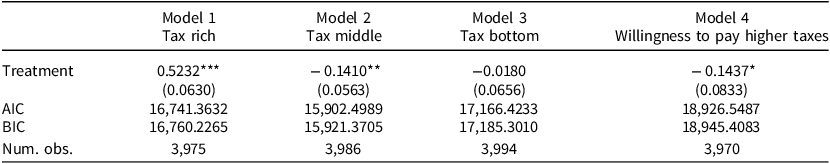
Table 1 presents the effect of tax regressivity at the top on tax policy preferences. Rather unsurprisingly, we find that the treatment increases support for taxes on top income earners (Table 1). In other words, when people learn that the superrich pay lower total tax rates than everybody else, they want to correct this by increasing income taxes on the highest earners. More importantly, we find that the treatment has a statistically significant negative effect on support for taxing median income earners with a household income of around ${\$}$
80,000. The treatment effect is statistically significant at the 5 per cent level, with an effect size of approximately 0.14. To put this effect size into context, it is roughly a quarter of the size of the (more intuitively expected) treatment effect on support for taxing the rich. The average support for increasing income taxes on median income earners is 4 on a 0–10 scale, where 0 means ‘strongly decrease’ and 10 means ‘strongly increase’. Thus, the treatment lowers support by roughly 3.5 per cent relative to the average level of support. While not enormous, the effect is sizeable – especially when compared to differences in support across other characteristics.
${\$}$
80,000. The treatment effect is statistically significant at the 5 per cent level, with an effect size of approximately 0.14. To put this effect size into context, it is roughly a quarter of the size of the (more intuitively expected) treatment effect on support for taxing the rich. The average support for increasing income taxes on median income earners is 4 on a 0–10 scale, where 0 means ‘strongly decrease’ and 10 means ‘strongly increase’. Thus, the treatment lowers support by roughly 3.5 per cent relative to the average level of support. While not enormous, the effect is sizeable – especially when compared to differences in support across other characteristics.
Treatment effect on tax policy preferences

Note: AIC = Akaike Information Criterion; BIC = Bayesian Information Criterion.
***p < 0.01; **p < 0.05; *p < 0.1.
Take income, for instance, which is often seen as a key determinant of tax policy preferences. Individuals with incomes between ${\$}$
20,001 and
${\$}$
20,001 and ${\$}$
30,000 have an average support value of 4.13, while those earning between
${\$}$
30,000 have an average support value of 4.13, while those earning between ${\$}$
80,001 and
${\$}$
80,001 and ${\$}$
100,000 – roughly the median income or higher – have an average of 3.82. This means that the treatment effect is about half the size of the support gap observed between these two income groups. When looking at the overall distribution of support for tax reforms on the middle class in the control group (see Figure C1 in the supplementary material), we can see that ‘4’ and ‘5’ are the most common responses. Hence, people are fairly neutral on tax reforms. In the treatment group, the likelihood of choosing these relatively neutral responses decreases. In contrast, the treatment mainly induces more people to report strong support for lower taxes on the middle class (answers ranging from 0–3). The likelihood of choosing an answer of 3 or lower, which indicates strong support for lowering taxes on the middle class, is around 6 percentage points higher in the treatment group.
${\$}$
100,000 – roughly the median income or higher – have an average of 3.82. This means that the treatment effect is about half the size of the support gap observed between these two income groups. When looking at the overall distribution of support for tax reforms on the middle class in the control group (see Figure C1 in the supplementary material), we can see that ‘4’ and ‘5’ are the most common responses. Hence, people are fairly neutral on tax reforms. In the treatment group, the likelihood of choosing these relatively neutral responses decreases. In contrast, the treatment mainly induces more people to report strong support for lower taxes on the middle class (answers ranging from 0–3). The likelihood of choosing an answer of 3 or lower, which indicates strong support for lowering taxes on the middle class, is around 6 percentage points higher in the treatment group.
While we find clear evidence that tax regressivity at the top lowers support for broad-based taxation of the middle class, we do not find a statistically significant effect on taxing the poorest members of society (Model 3). This finding is driven by a clear floor effect, as respondents in the control group already strongly support lowering taxes on the lowest income earners (Figure C1). When accounting for the floor effect by just looking at the likelihood of expressing the strongest support for lowering taxes on the poor (those who choose the value 0), we do find that the treatment has a strong effect, increasing this likelihood by 4 percentage points (Table D6). Furthermore, we find some evidence that tax regressivity at the top lowers people’s willingness to pay taxes to increase funding for public services (Model 4). However, this finding is only statistically significant at the 10 per cent level and not fully robust to modeling choices (Tables D1–D5). Taken together, our results highlight an important hidden cost of tax regressivity at the top: if left unaddressed, it risks undermining public support for broad-based taxation.
Mechanisms
In order to unpack what drives the treatment effect on tax policy preferences, we first need to check whether the treatment was successful in manipulating people’s beliefs about tax regressivity at the top. To do so, we ask respondents whether they agree with the statement ‘Richer Americans pay higher tax rates than poorer Americans’. Answers could range from 1 = ‘Strongly disagree’ to 5 = ‘Strongly agree’. The left-hand panel in Figure 2 shows the results by treatment group. Respondents in the treatment group were almost 1 point less likely to agree with the statement. Furthermore, the mean response changed from slight agreement in the control group to slight disagreement in the treatment group. Therefore, our treatment successfully altered perceptions of the progressivity of the US tax system.
Effect of treatment on perceptions of tax regressivity at the top and fairness of the tax system.
Note: Left panel shows average answer by treatment arm to the question: To what extent do you agree or disagree with the following statement? ‘Richer Americans pay higher tax rates than poorer Americans’. Answer categories: 1 = Strongly agree, 2 = Agree, 3 = Neither agree nor disagree, 4 = Disagree, 5 = Strongly disagree. Right panel shows average answer by treatment arm to the question: To what extent do you agree or disagree with the following statement? ‘The US tax system is fair’. Answer categories: 1 = Strongly agree, 2 = Agree, 3 = Neither agree nor disagree, 4 = Disagree, 5 = Strongly disagree. For all panels, dots show average answer by treatment/control group and error bars denote 95 per cent confidence intervals. Random noise (jitter) applied to improve the visualization of the density.

Next, we turn to the mechanisms at work. Why does tax regressivity at the top lower support for broad-based taxation? Existing work highlights the importance of fairness perceptions in shaping tax policy preferences (Alesina and Angeletos Reference Alesina and Angeletos2005; Alvarado Reference Alvarado2024; Cavaillé Reference Cavaillé2023; Hope et al. Reference Hope, Limberg and Weber2023; Limberg Reference Limberg2020; Scheve and Stasavage Reference Scheve and Stasavage2016, Reference Scheve and Stasavage2023; Stantcheva Reference Stantcheva2021). The theoretical framework of Scheve and Stasavage (Reference Scheve and Stasavage2016, Reference Scheve and Stasavage2023) sets out the three main norms that people use to judge the fairness of the tax system. The first is equal treatment, which implies that all citizens should be treated equally by the state. The second is ability to pay, which implies that the rich should be taxed more as they are better able to afford it. The third is compensatory fairness, which implies that higher taxes on the rich are justified because of other advantages they have. People who judge tax fairness based on equal treatment have a preference for proportional or flat rate taxes and people who judge tax fairness based on the other two norms prefer progressive taxes. Hence, all three norms are likely to be violated when people are informed that the superrich pay a lower total tax rate than any other income group. To test whether tax regressivity at the top violates fairness norms, we look at whether the treatment leads people to perceive the US tax system as less fair. In line with our expectations, the treatment significantly reduces fairness perceptions of the US tax system (right panel in Figure 2).
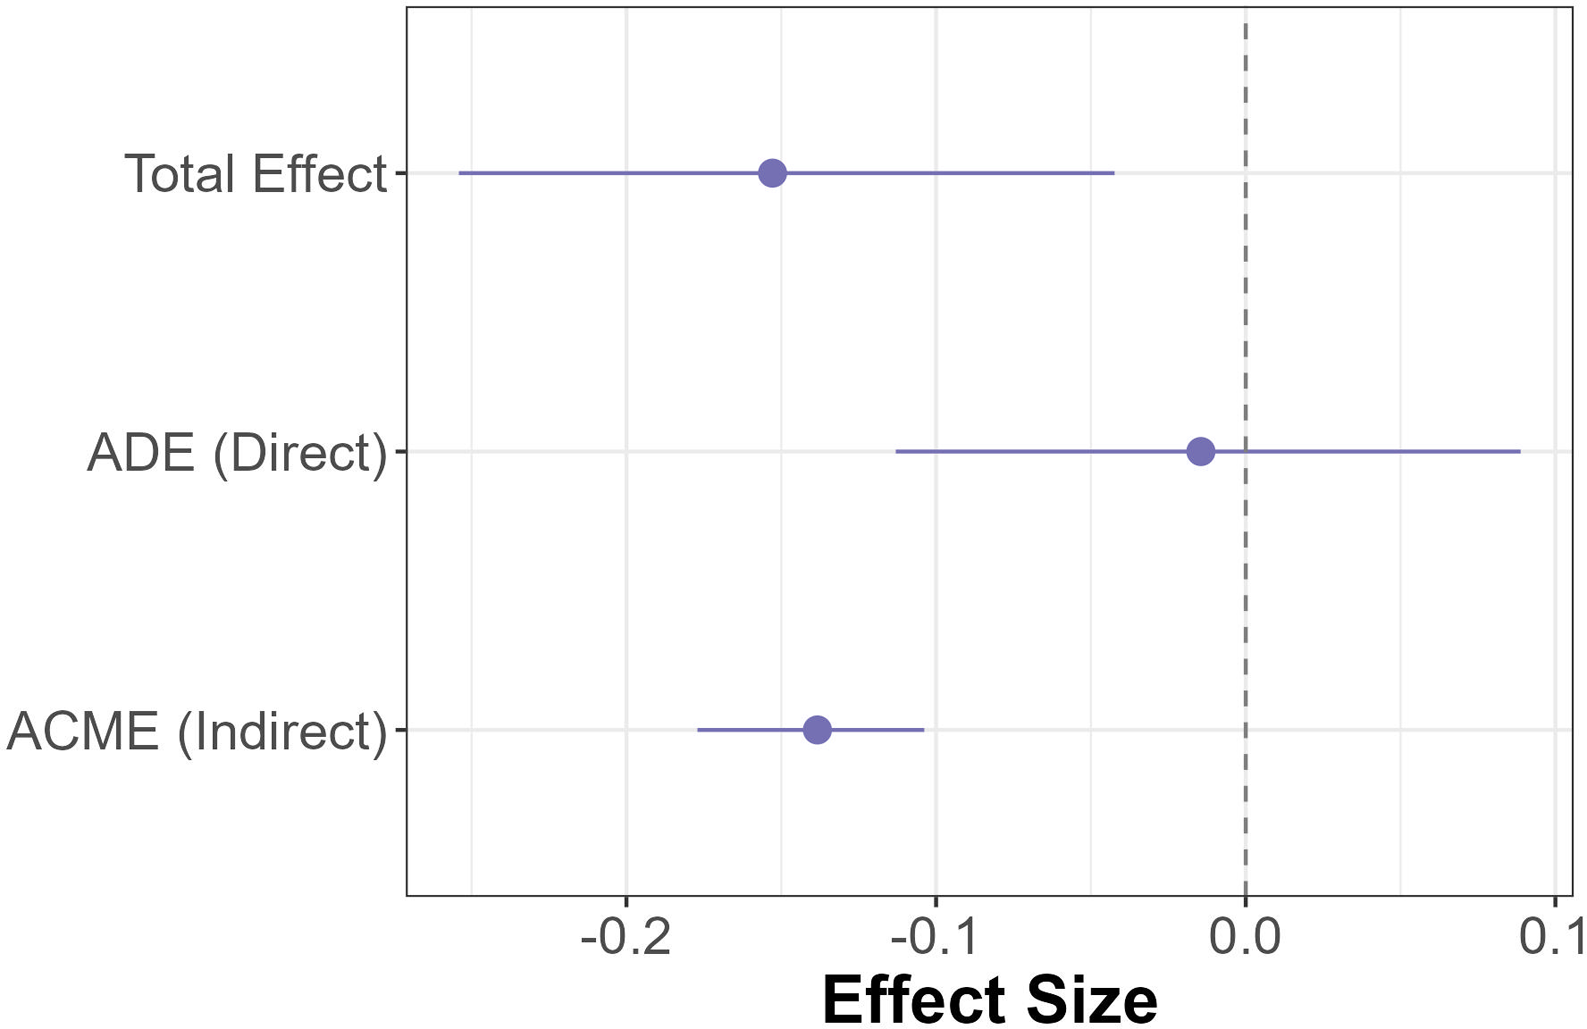
So far, we have shown that information on tax regressivity at the top increases perceptions of the tax system as unfair and reduces support for taxing the middle class. Based on the existing literature, we have argued that perceptions of the fairness of the tax system are the key mechanism that translates tax regressivity at the top into greater support for lower taxes on average income earners. To test the causal chain, we use causal mediation analysis (Imai et al. Reference Imai, Keele, Tingley and Yamamoto2011). This approach allows us to differentiate between the direct, unmediated effect of our treatment and the indirect effect via fairness perceptions on preferences for taxing the middle class. The findings show strong support for our proposed causal chain (Figure 3). The causal mediation analysis shows that 92 per cent of the total treatment effect runs via perceptions of the fairness of the tax system. In contrast, the direct, unmediated effect is close to zero and statistically insignificant. Thus, changing fairness perceptions of the tax system can explain the effect of the treatment on preferences for taxing the middle class.
Mediation analysis of treatment effect on preferences for taxing the middle class.
Note: Mediation analysis of information treatment on preferences for taxing average income earners with fairness perceptions of the US tax system as the mediator. ADE = Average Direct Effect; ACME = Average Causal Mediation Effect. Dots denote estimates and error bars denote 95 per cent confidence intervals.

Additional Analyses
We run a series of robustness checks to see if our findings hold. We run models where we control for a battery of covariates (Table D1), exclude speeders (Table D2) and laggards (Table D3),Footnote 3 and adjust p-values for multiple comparisons via the Benjamini–Hochberg procedure (Benjamini and Hochberg Reference Benjamini and Hochberg1995) to reduce the false discovery rate (Table D5). We also check whether the treatment affects the likelihood of choosing the ‘Don’t know’ option and find no significant differences between the treatment and control group (Table D4). Furthermore, we check whether randomization worked and find no substantial differences between the treatment and the control group (Table C1).
We also check for subgroup effects (Tables E1–E6). We find little variation by a range of socio-economic and political characteristics. In addition to the main results, we look at the effect of tax regressivity at the top on satisfaction with democracy and we do not find a statistically significant effect (Table C2). Thus, providing people with information on tax regressivity at the top does not seem to lead them to doubt democratic processes and institutions in the United States more generally.
Conclusion
In this article, we provide experimental evidence on how tax regressivity at the top affects people’s tax policy preferences. When people find out that the superrich pay lower total tax rates than everyone else, it not only leads to more demand to raise taxes on the rich but it also lowers support for taxing the middle class. Our findings therefore support the claim made in Thomas Piketty’s (2014, 635) Capital in the Twenty-First Century that ‘a fiscal secession of the wealthiest citizens could potentially do great damage to fiscal consent in general’. They also highlight an important hidden cost of tax regressivity at the top. If politicians fail to address it by raising taxes on the rich, they risk undermining public support for broad-based taxation.
The study makes an important new contribution to the literature on the determinants of tax policy preferences (as extensively summarized in Berens and Gelepithis (Reference Berens, Gelepithis, Lukas and Laura2021)) by highlighting the interdependency between taxes at the top and support for taxes on other parts of the income distribution. It also provides new causal evidence that supports the expectation in existing research on taxing the rich that tax regressivity at the top violates widely held norms around tax fairness (Scheve and Stasavage Reference Scheve and Stasavage2016, Reference Scheve and Stasavage2023).
Our findings also speak to recent research which shows that perceptions that income is becoming concentrated at the top of the distribution is dampening support for broad-based income taxation in developing countries (Heilbrun Reference Heilbrun2025), as well as the willingness of the non-rich in advanced democracies to contribute to government provision of collective goods (Hicks et al. Reference Hicks, Jacobs and Matthews2025). Our findings show that inequalities in the tax system that allow the superrich to pull further away from the rest also reduces support for broad-based taxation, which aligns with new experimental evidence from developing countries that tax morale decreases when people are presented with information that taxes in their country are not progressive (Hoy Reference Hoy2025).
The article points to several potentially fruitful avenues for future research. First, tax regressivity at the top is not just a US phenomenon. Research has found similar drops in total tax rates at the very top of the income distribution in other advanced democracies including France, Italy, the Netherlands, and the United Kingdom (Advani et al. Reference Advani, Hughson and Summers2023; Alstadsæter et al. Reference Alstadsæter, Godar, Nicolaides and Zucman2023; Guzzardi et al. Reference Guzzardi, Palagi, Roventini and Santoro2024). It is therefore important to ascertain the extent to which our results generalize beyond the US case. We expect the findings would be most likely to hold in other countries where a lot of redistribution takes place on the revenue side, such as the other Anglo-Saxon economies. It would be particularly important to investigate, however, whether the findings differ in the continental European and Nordic countries where redistribution takes place primarily on the spending side (Haffert Reference Haffert, Hakelberg and Seelkopf2021). Second, we provide experimental evidence on tax regressivity at the top dampening public support for broad-based taxation. This could be complemented by observational evidence exploring whether tax reforms that introduce regressivity at the top hamper governments’ efforts to raise revenues from the middle classes in subsequent years. In other words, does lower support for broad-based taxation lead to monetary costs for governments? Third, our study shows that the total tax rate on the superrich influences support for taxation on other parts of the income distribution. Future research could explore whether this type of interdependence occurs elsewhere in the tax system. For instance, do high taxes on people on low incomes lead people to want to tax the rich more? Lastly, the implications of our findings for political communication could be examined. Is politicizing regressivity at the top a double-edged sword for the left as the boost in support for taxing the rich comes at the expense of lower support for middle-class taxation?
Supplementary material
The supplementary material for this article can be found at https://doi.org/10.1017/S0007123425101269.
Data availability statement
Replication data for this article can be found in Harvard Dataverse at: https://doi.org/10.7910/DVN/7QITZS.
Acknowledgments
We would like to thank Lucy Barnes for her excellent editorial guidance on the paper, as well as the three anonymous reviewers for their helpful comments and suggestions. We are also grateful to Patrick Sullivan, Mads Andreas Elkjær, Robert Huber, Julian Erhardt, Annika Schuster, and Stefan Hee, as well as to participants at the EPSA Conference 2025 in Madrid for their valuable feedback.
Financial support
This research received no specific grant from any funding agency, or commercial or not-for-profit sectors.
Competing interests
None.
Ethical standards
Informed consent was obtained from all participants prior to proceeding to the survey. There was neither deception of the respondents nor potential for harm or trauma. No information was collected that would allow us to identify subjects personally. Ethical clearance for this project was granted via the King’s College London’s Minimal Risk Procedure (Reference number MRA-24/25-48579). All participants were compensated for their participation.


 Open access