

The British National Formulary (Royal Pharmaceutical Society of Great Britain and British Medical Association, 2003) outlines the recommended dose of haloperidol decanoate (HD) thus: ‘initially 50 mg every four weeks, if necessary increasing by 50 mg increments to 300 mg every four weeks; higher doses may be needed in some patients’. In practice, clinical doses appear to average 200-300 mg every 4 weeks with higher doses seen in a small but important minority.
Appropriate dosing of HD is made difficult by its complex pharmacokinetic properties (Reference TaylorTaylor, 1999) and by a lack of clarity over its dose-response characteristics. Essentially three dose response ‘curves’ are possible, each based on the assumption that very low doses produce little or no effect and higher (‘threshold’) doses produce increasingly large effects. At higher doses still, effects may (i) increase still further, (ii) neither increase nor decrease (plateau), or (iii) decrease (see Reference Davis, Chen and GlickDavis et al, 2003 for discussion). With oral haloperidol, there is substantial evidence that its clinical effects plateau at doses above 4-6 mg/day (Reference Hilton, Taylor and AbelHilton et al, 1996; Reference TaylorTaylor, 2000) and it has been suggested that effectiveness decreases above 12 mg/day (Reference Geddes, Freemantle and HarrisonGeddes et al, 2000). If these outcomes are accepted then it is possible that some low but recommended doses of HD will be sub-therapeutic and some higher doses unnecessarily supra-therapeutic.
A literature search and analysis was performed in an attempt to establish and describe the dose-response relationship for HD at recommended therapeutic doses.
Method
In December 2003, a literature search was conducted using the terms HALOPERIDOL DECANOATE, HALOPERIDOL DEPOT, HALDOL, HALDOL DECANOATE and HALOPERIDOL LONG ACTING PREPARATIONS. Databases searched were Medline, Embase and Psych LIT. The Cochrane Library and the Cochrane review of HD (Reference Quraishi and DavidQuraishi & David, 2000) were also scrutinised. From the papers retrieved, those describing use of specified doses of HD for at least 6 months and providing relapse outcome data were included. (These factors represented a priori inclusion criteria.) Shorter studies and those not describing relapse data were not included.
Results
Fifteen papers describing 13 individual studies were retrieved. From those, 6 studies meeting inclusion criteria were identified. Of those not included, 5 had a duration of assessment of 6 months or less (Reference Zissi, Psaras and KyketsosZissi et al, 1982; Reference Wistedt, Petsson and HellbornWistedt et al, 1984; Reference Bechelli, Iecco and AcioliBechelli et al, 1985; Reference Eberhard and HellbornEberhard & Hellborn, 1986; Reference Dencker, Gios and MartenssonDencker et al, 1994) and 2 did not provide dosage details (Reference Cookson, Kennedy and GribbonCookson et al, 1986; Reference Meyerowitz, Jaramillo and DensonMeyerowitz et al, 1989). Two studies were each published twice - Wistedt (Reference Wistedt1984) and Wistedt et al (Reference Wistedt, Petsson and Hellborn1984) described the same study, as did Koskinen et al (Reference Koskinen, Wistedt and Thelander1991) and Wistedt et al (Reference Wistedt, Koskinen and Thelander1991). The included studies are described below.
McKane and colleagues (Reference Mckane, Robinson and Wiles1987) conducted a double-blind trial of HD and fluphenazine decanoate over 60 weeks (incorporating a 12-week run-in period). Seventeen participants received HD, of whom 6 (35%) relapsed during the 52-week post run-in period. The mean dose of HD was 120 mg every 4 weeks at week 12.
Chouinard and colleagues (Reference Chouinard, Annable and Campbell1989) conducted a similar comparative double-blind trial over 8 months but with all participants receiving fluphenazine depot for 3 months before study entry. HD was given to 36 participants at intervals of 2, 3 or 4 weeks. The mean dose given per month was 385 mg. On this dose no patient relapsed to an extent requiring readmission and only 2 required additional oral medication (a single oral dose in each case).
In a double-blind comparison of HD and zuclopenthixol decanoate, Wistedt et al (Reference Wistedt, Koskinen and Thelander1991) found that a mean dose of 92 mg every 4 weeks allowed relapse in only 4 of 27 participants (11%) receiving HD for 9 months. In this study, relapse was defined as withdrawing prematurely ‘because of deterioration’. Aside from these withdrawals, 3 participants showed deterioration on clinical assessment scales.
Eklund & Forsman (Reference Eklund and Forsman1991) conducted a rare placebocontrolled, randomised double-blind assessment of HD given for 48 weeks (after a 3-month period in which all subjects received 60 mg every 4 weeks of HD). Out of 18 participants receiving HD, 2 relapsed (11%) compared with 16 out of 23 (69%) of those receiving placebo.
Altamura and colleagues (Reference Altamura, Tacchini and Maes1995) followed 48 participants given HD for up to 3 years. In the first year 11 participants (23%) relapsed. The mean dose of HD was 120.6 mg every 4 weeks. The study was an open evaluation of naturalistic clinical practice.
In the most recently published study, Kane and colleagues (Reference Kane, Davis and Schooler2002) examined the effect of fixed doses of HD on relapse (‘symptomatic exacerbation’) in a double-blind, year-long study. Relapse rate was highest for those receiving 25 mg HD every 4 weeks (15 out of 25 participants, 60%) and lowest for 200 mg HD every 4 weeks (4 out of 26, 15%). There was no statistically significant difference in relapse rates between the highest dose and medium doses (50 mg and 100 mg every 4 weeks; 25% and 23% respectively). Oddly, this study took almost 10 years to be fully published (see Reference Davis, Mckane and MarderDavis et al, 1993).
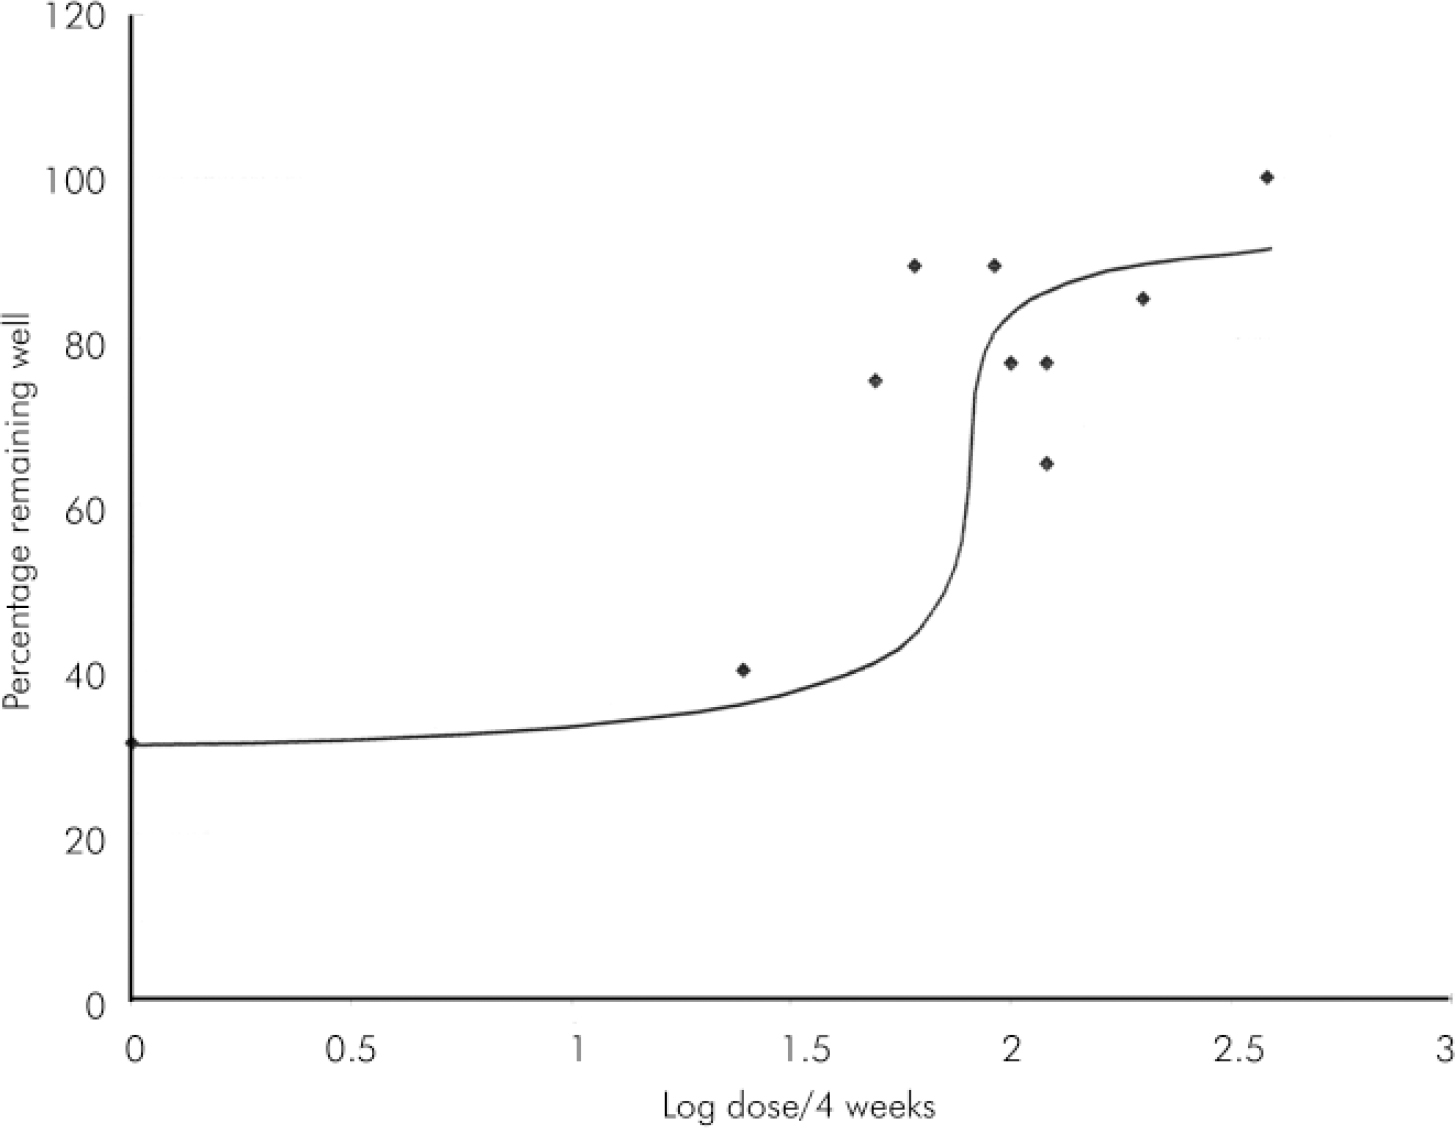
Plotting dose-response curves
The above data (see also Table 1) were plotted as mean or fixed dose HD (or, by convention, log dose) against percentage remaining well (100–relapse rate) to estimate a dose-response curve for HD (see Figs 1 and 2). These curves suggest that HD has little effect below 25 mg/4 weeks (anchor point for no HD is placebo effect from Reference Eklund and ForsmanEklund & Forsman, 1991). Effect on relapse seems to increase substantially between > 25 mg and 100 mg/4 weeks and then to level off almost to horizontal between 100 mg and 400 mg/4 weeks. Effect could be said to be maximal or near maximal at 50 mg/4 weeks.
Haloperidol decanoate studies, 9-12 months’ duration
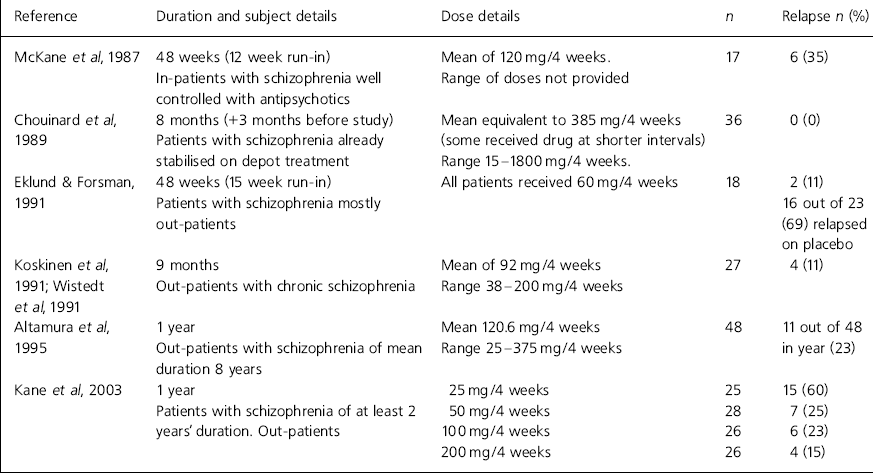
| Reference | Duration and subject details | Dose details | n | Relapse n (%) |
|---|---|---|---|---|
| Reference Mckane, Robinson and WilesMcKane et al, 1987 | 48 weeks (12 week run-in) | Mean of 120 mg/4 weeks. | 17 | 6 (35) |
| In-patients with schizophrenia well controlled with antipsychotics | Range of doses not provided | |||
| Reference Chouinard, Annable and CampbellChouinard et al, 1989 | 8 months (+3 months before study) | Mean equivalent to 385 mg/4 weeks (some received drug at shorter intervals) | 36 | 0 (0) |
| Patients with schizophrenia already stabilised on depot treatment | Range 15-1800 mg/4 weeks. | |||
| Reference Eklund and ForsmanEklund & Forsman, 1991 | 48 weeks (15 week run-in) | All patients received 60 mg/4 weeks | 18 | 2 (11) |
| Patients with schizophrenia mostly out-patients | 16 out of 23 (69) relapsed on placebo | |||
| Reference Koskinen, Wistedt and ThelanderKoskinen et al, 1991; Reference Wistedt, Koskinen and ThelanderWistedt et al, 1991 | 9 months | Mean of 92 mg/4 weeks | 27 | 4 (11) |
| Out-patients with chronic schizophrenia | Range 38-200 mg/4 weeks | |||
| Reference Altamura, Tacchini and MaesAltamura et al, 1995 | 1 year | Mean 120.6 mg/4 weeks | 48 | 11 out of 48 in year (23) |
| Out-patients with schizophrenia of mean duration 8 years | Range 25-375 mg/4 weeks | |||
| Kane et al, 2003 | 1 year | 25 mg/4 weeks | 25 | 15 (60) |
| Patients with schizophrenia of at least 2 years' duration. Out-patients | 50 mg/4 weeks | 28 | 7 (25) | |
| 100 mg/4 weeks | 26 | 6 (23) | ||
| 200 mg/4 weeks | 26 | 4 (15) |
Dose-response curve for haloperidol decanoate dose v. relapse.

Log dose-response curve for haloperidol decanoate dose (log) v. relapse.
Discussion
This analysis of medium-term trials of HD strongly suggests that beneficial effects on relapse peak at around 100 mg/4 weeks and little, if any, therapeutic advantage is provided by higher doses. If accepted, this conclusion has important consequences for clinical practice.
Of course, the exact nature of the dose-response curve beyond 100 mg/4 weeks is a vitally important question. If horizontal, then clearly higher doses can be seen as unnecessary, incurring additional expense and perhaps producing a greater burden of adverse effects through greater drug exposure (as with oral haloperidol; Reference van Putten, Marder and MintzVan Putten et al, 1990; Reference Stone, Garver and GriffithStone et al, 1995). If the curve rises above the horizontal (as it could be drawn) then many will argue that such negative effects are a suitable price to pay for a small but palpable reduction in risk of relapse. Unfortunately, available data provide few details on the effects of doses above 120 mg/4 weeks and so we cannot be certain about the exact dose-response relationship. It is noteworthy however that the very high doses of HD reported by Chouinard and colleagues (Reference Chouinard, Annable and Campbell1989) allowed no relapses in 36 patients. Without these data, the curve is clearly flat; with it, it suggests worthwhile reduction in risk of relapse with very high doses. It is also noteworthy that receptor binding studies report near saturation of dopamine receptors at very low doses (5 mg/day) of haloperidol (Reference Tauscher and KapurTauscher & Kapur, 2001). This might predict a plateau of effect.
Aside from difficulties relating to the plotting of the dose-response curve, other caveats should be noted. First, the plotting of mean HD doses as single data points is problematic since each value conceals a range of doses given to participants. These data might be better represented as horizontal lines on the graph, describing the range of doses used. It is notable, however, that fixed dose studies (Reference Eklund and ForsmanEklund & Forsman, 1991; Kane et al, 2003) provide data-points which fit with the general trend of mean dose data. Second, there is clearly a time-effect when considering rates of relapse and studies used to generate data-points ranging in total duration from 9 months (Reference Wistedt, Koskinen and ThelanderWistedt et al, 1991) to 60 weeks (Reference Mckane, Robinson and WilesMcKane et al, 1987). Data generated from studies conducted do not allow standardisation of relapse data at a particular time point. It should be understood therefore that shorter studies probably underestimate relapse by 1 year (perhaps important for Reference Chouinard, Annable and CampbellChouinard et al, 1989) and longer studies probably over estimate relapse at 1 year (for example, Reference Mckane, Robinson and WilesMcKane et al, 1987). Third, criteria used to define relapse varied somewhat from one study to another: some used the administration of additional oral antipsychotics, some admission to hospital; others leaving the study early. Such variation is likely to have an important effect on data interpretation but the fixed dose study of Kane et al (Reference Kane, Davis and Schooler2002) used the same relapse criteria for each dose and produced results broadly in line with the trend.
A major advantage of attempting to define dose-response of a depot formulation is that, it is assumed, full compliance with treatment is certain. With oral forms, assessment of dose-response is confounded by partial or non-compliance which may well be unknown to the study investigators. It might be argued that the use of depots allows more accurate assessment of dose-response relationships.
This analysis might be strengthened still further by the inclusion of unpublished pre-licence data, but these were not available. Nevertheless, this secondary analysis serves to strengthen impressions gained from single studies. The overall impression given by data analysed here, it can tentatively be concluded, is that there is little to be gained by increasing the dose of HD above 100 mg/4 weeks. Individual clinicians will need to decide whether or not the use of doses above this level can be justified when there is little or no expectation of improved efficacy and well grounded expectation of higher cost and worsened adverse effect burden.
Declaration of interest
None.


 Open access
eLetters
No eLetters have been published for this article.