

1. INTRODUCTION
Globally, 2011–15 was the warmest 5-a period on record. Global mean annual air temperatures from 2006 to 2010 and 2011 to 2015 were respectively 0.51 and 0.57°C above the 1961–90 mean (World Meteorological Organization Provisional Statement, 25 November 2015). Global air temperature increases are enhanced at high latitudes. In the Canadian Arctic, near-surface summer air temperatures from long-running (1948-present) climate stations at Resolute Bay and Eureka were highest between 2010 and 2012 (http://climate.weather.gc.ca). In situ and remote sensing measurements, combined with modeling of the mass balance of glaciers in Canada's Queen Elizabeth Islands (QEI; 74.5–83.5°N, 61–121°W), a region that contains ~14% of the global glacier area, show that the rate of mass loss from these glaciers nearly tripled between 2004–06 and 2007–09 (Gardner and others, Reference Gardner2011). Other modeling studies indicate rates of glacier mass loss from the QEI of between 46 ± 5 and 37 ± 10 Gt a−1 from 2003 to 2011 (Lenaerts and others, Reference Lenaerts2013). As a result of 21st-century warming and accelerated mass wastage, glaciers in the Canadian Arctic have become the largest regional contributor to the eustatic component of global sea level rise outside the major ice sheets (Gardner and others, Reference Gardner2013; Radić and others, Reference Radić2014).
Annual precipitation in the QEI is extremely low (<400 mm a−1) (Braithwaite, Reference Braithwaite2005) and both interannual variations and longer-term trends in annual glacier mass balance are dominated by changes in summer melt (Koerner, Reference Koerner2005). Mean summer (June–August (JJA)) land surface temperatures (LST), an index of melt season intensity and/or duration (e.g. Hall and others, Reference Hall, Williams, Casey, DiGirolamo and Wan2006), over selected high elevation regions of major ice caps in the QEI were between 0.8 and 2.2°C higher from 2005 to 2009 than in the previous 5-a period (2000–04) (Sharp and others, Reference Sharp2011). Summer-melt duration and intensity are highly correlated with QEI summer air temperatures (Sharp and others, Reference Sharp2011), so it is likely that glacier surface melt has also increased over the past decade. QEI-wide annual melt season duration was monitored during the period 2000–09 using active microwave data from the QuikSCAT satellite (Wang and others, Reference Wang, Sharp, Rivard, Marshall and Burgess2005; Wolken and others, Reference Wolken, Sharp and Wang2009; Sharp and others, Reference Sharp2011), but a complete assessment of QEI-wide summer LST patterns and their variability from satellite data has yet to be conducted. In contrast, annual and summer melt season mean LSTs of the Greenland ice sheet, which lies immediately to the east of the QEI, have been studied extensively using satellite data (e.g. Hall and others, Reference Hall2013; Shuman and others, Reference Shuman, Hall, DiGirolamo, Mefford and Schnaubelt2014, and references therein).
Extreme mass-balance years in the QEI have been associated with changes in the geometry and strength of the July circumpolar vortex (Alt, Reference Alt1987; Gardner and Sharp, Reference Gardner and Sharp2007) that alter the distribution and intensity of regions of high and low pressure across the QEI. Between 2000 and 2009, increases in both summer mean air temperature and LST over QEI glaciers and ice caps were greatest in the north and west of the region (Sharp and others, Reference Sharp2011). This spatial pattern was inferred from LST trends calculated using data from the Moderate Resolution Imaging Spectroradiometer (MODIS) sensors for single 23 km × 23 km grid cell blocks centered on the interior regions of each of the seven major ice masses in the QEI. LST data from high elevation regions were used because they are more likely to vary continuously with air temperature than are temperatures at lower elevations, where melting may be continuous for long periods in summer causing the surface temperature to become insensitive to changing air temperature. As a result, however, it is not known whether the pattern of stronger warming in the north and west of the QEI is characteristic of all elevations on the region's ice caps; nor is it known whether this pattern has been sustained to the present-day.
Remote sensing methods are needed to map spatial patterns in ice-cap LST and to monitor changes in these patterns over time at the scales of both individual ice caps and the regional ice cover. Here, we use MODIS LST observations to present the first complete picture of LST changes on QEI glaciers and ice caps over the period 2000–15. This 16-a record of mean summer LST is used to assess the spatial and temporal variability of LST, and to quantify the rates of change in the intensity and duration of summer melt across the entire QEI ice cover. Near-surface temperature records from Eureka and Resolute Bay, and upper-air temperatures (1948–2015) over each of the seven major ice masses in the QEI are used to place the LST observations into the context of the 68-a period for which in situ observations of air temperature and results from Climate Reanalysis exist.
2. DATA AND METHODS
2.1. MODIS LST
Changes in LST provide evidence of changing melt conditions over glaciers and ice caps. The probability of melt occurring at a given location in a given summer increases with both the summer mean LST and the length of the summer melt season (Hall and others, Reference Hall, Williams, Casey, DiGirolamo and Wan2006). The MODIS sensors aboard the Terra and Aqua satellites image the Earth in 36 spectral bands every 1 or 2 d, and more frequently in the Polar Regions (http://modis-land.gsfc.nasa.gov/). We use the 8-d L3 Global Land Surface Temperature and Emissivity product (MOD11A2) Version 5 to monitor the spatial and temporal evolution of mean summer LST on glaciers and ice caps in the QEI, which we take to be a proxy for the duration and/or intensity of summer melting. For consistency with a previous work in this region (e.g. Sharp and others, Reference Sharp2011) we only evaluate ‘daytime’ LST data generated with the day/night algorithm of Wan and Li (Reference Wan and Li1997). Because the temperature of pure ice and snow cannot exceed 0°C, we assume that melt occurs if the temperature of the ice/snow-covered surface reaches 0°C. We also assume that the probability that melt is occurring during a given 8 d period increases as the 8 d mean daytime clear-sky LST approaches 0°C. Specifically, these assumptions imply: (1) that as the 8 d mean LST approaches zero the number of days on which the surface temperature reached 0°C likely increases and (2) that melting is more prolonged and/or more intense in regions/periods with higher 8 d mean LSTs. Under these conditions, the summer mean LST is likely correlated with the annual glacier surface mass balance (Sharp and others, Reference Sharp2011). Annual specific glacier mass balances of White glacier, Axel Heiberg Island, Meighen Ice Cap and the northwest quadrant of Devon Ice Cap for 2000/01–2013/14 (derived from in situ measurements; cf. Sharp and others, Reference Sharp2015; http://wgms.ch) are negatively correlated with the MODIS mean summer LST (r = −0.68 to −0.85; p > 0.01).
MOD11A2 LST is computed from MODIS channels 31 (11 µm) and 32 (12 µm) using a split-window technique and all available daytime clear-sky scenes from the Terra satellite for sequential 8 d periods, and 1 km × 1 km pixels set in a sinusoidal projection (Wan and others, Reference Wan, Zhang, Zhang and Li2002). A cloud mask is used to ensure that only cloud-free observations are used in the calculation (Ackerman and others, Reference Ackerman1998). Nominal product accuracy, estimated from comparison with in situ data, is ±1°C (Wan and others, Reference Wan2008); but can be as low as ±2°C over high-latitude snow/ice surfaces (Hall and others, Reference Hall2008a; Koenig and Hall, Reference Koenig and Hall2010). The principal uncertainties in the LST product arise from the effects of cloud contamination (Box and others, Reference Box2012; Hall and others, Reference Hall2012; and references therein). Similarity in the spectral signatures of snow, ice and thin cloud makes it difficult to discriminate between these surface types (Strabala and others, Reference Strabala, Ackerman and Menzel1994; King and others, Reference King2004). The MODIS cloud mask is extremely conservative and tends to detect more cloud than is actually present over ice and snow (Hall and others, Reference Hall, Williams, Luthcke and DiGirolamo2008b). Cloudy conditions over QEI ice caps tend to be associated with lower air temperatures in June and July but with higher air temperatures in August (Gascon and others, Reference Gascon, Sharp and Bush2013a). Removal of observations from periods when clouds are detected can thus result in either an over- or under-estimation of the mean surface LST compared with the actual mean surface temperature. Furthermore, variability in cloud cover, both within individual 8 d periods and from 1 a to the next may introduce variability in the LST record that is not representative of true changes in the surface temperature (Hall and others, Reference Hall, Williams, Casey, DiGirolamo and Wan2006).
MODIS MOD11A2 values are produced when a minimum of one clear-sky day is available within a given 8 d period. Consequently, variability in the number of clear-sky days within each 8 d period may result in a higher variability in the mean summer MODIS-derived LST than actually exists in the true surface temperature. For the 2000–15 period, there were, on average, 4–5 clear-sky observations within each 8 d period (Supplemental Material S1–S4). A comparison of the summer LST record with both 700 hPa air temperatures and in situ air temperature measurements from glaciers in the Canadian Arctic, Svalbard and Greenland between 2000 and 2008 found summer glacier LST to be highly correlated with summer air temperatures in continental climates. However, the relationship was often very weak in cloudy maritime regions situated near storm tracks (due to the bias induced by the lack of LST data during cloudy periods; Personal communication M-L Geai, 2013). For the period 2000–09, QEI summer mean glacier LST was highly correlated (r > 0.82) with both in situ summer near-surface air temperature measurements from on-ice AWS and summer mean air temperature anomalies at 700 hPa geopotential height derived from the NCEP/NCAR R1 Reanalysis (Sharp and others, Reference Sharp2011). Close coupling between variability in the mean summer LST and air temperature suggests that the LST record from ice caps in the QEI is a reasonable proxy for both the mean summer surface temperature and the summer melt intensity.
2.2. MOD11A2 data processing
Together, MODIS tiles h16v00, h17v00, h16v01 and 15v01 provide complete coverage of glaciated surfaces in the QEI. MODIS MOD11A2 Version 5 summer data (days 153–241) for these tiles were downloaded from the USGS Land Processes Distributed Active Archive Center (http://lpdaac.usgs.gov/) for the period 2000–15. Daytime clear-sky LST and accompanying quality assessment information were extracted from the hierarchical data format files and reprojected from the standard MODIS sinusoidal projection to a North America Albers Equal Area projection, WGS84 datum, 1 km resolution, using the MODIS reprojection tool version 4.1 (https://lpdaac.usgs.gov/tools/modis_reprojection_tool). Pixels for which the average LST error (QC_Day LST error flag) exceeded 2°C were removed from the analysis. Any remaining pixels with a temperature >0°C were assigned a temperature of 0°C (e.g. Hall and others, Reference Hall, Williams, Luthcke and DiGirolamo2008b). Rocks, dust, impurities and ponded water can exist on the snow/ice surface and their temperatures can exceed 0°C. The presence of such targets within a 1 km × 1 km pixel can result in a LST that exceeds 0°C. Pixels having an LST >0°C were usually located near the ice-cap margins and along narrow outlet glaciers, and likely contained a mixture of exposed rock, ice and meltwater during the melt season.
Since interannual variability in QEI annual mass balance is dominated by changes in the summer mass balance (Koerner, Reference Koerner2005), we evaluated spatial and temporal patterns in LST for the summer months (JJA). Mean summer LST was computed from all 8 d daytime MODIS LST observations between 1–2 June (day 153) and 28–29 August (day 241). If a pixel has an 8 d mean LST of 0°C or greater, we then assume that melt occurred during the 8 d period. This approach is conservative because melt can still occur in periods when the 8 d mean LST is <0°C. Investigation of all 8 d observations from 2000 to 2015 reveals that, although melt is largely confined to the JJA period, it does sometimes occur at other times (Supplementary Material Fig. S5; Table S6). Melt was observed as early as 1 May (2003; 0.004% of pixels) and as late as 7 October (2008; 0.02% of pixels). On average, only ~0.2% of pixels experience melt outside the JJA period with a maximum of 1.1% (spring 2008) and a minimum of 0.001% (in seven different years). For each year, mean summer LST was calculated for cells having at least seven of a possible 12 summer LST observations. To ensure that only data for glaciated surfaces were retained, the output was clipped to the Randolph Glacier Inventory v3.2 region 32 Arctic Canada North reference polygons (Arendt and others, Reference Arendt2012; Pfeffer and others, Reference Pfeffer2014).
Changes in mean summer LST with respect to elevation were evaluated using three broad elevation zones (Fig. 1b). The high and low elevation zones extend above 1400 and below 1000 m a.s.l. respectively, and are separated by an intermediate zone (1000–1400 m a.s.l.), which is centered on the regional mean upper limit of the superimposed ice zone (~1200 m a.s.l.) (Gardner and others, Reference Gardner2011). Much of the upper zone is likely to be snow-covered year round, while ice will almost always be exposed in summer in the lower zone. The extent and longevity of summer snow cover in the intermediate zone are likely to vary substantially between years with variations in the mean summer air temperature. Surface elevations were obtained from the Canadian Digital Elevation Dataset (CDED) edition 3.0, scale 1:50 k, resampled to a 1 km resolution.
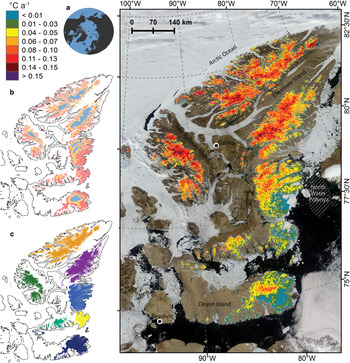
Linear rate of change in mean summer clear-sky LST (°C a−1) for 2000–15 for the QEI. Rate of change is computed only for pixels with annual summer mean clear-sky LST for all 16 a of observation. Black dots with white outline indicate location of Environment Canada Weather Stations at Eureka and Resolute Bay. Base image: Moderate Resolution Spectroradiometer, 4 July 2011. Left panel: (a) Red box indicates location of the study site. (b) Elevation zones: <1000 m a.s.l. (pink), 1000–1400 m a.s.l. (yellow), >1400 m a.s.l. (gray). (c) QEI glacial regions used in this study: Northwest Ellesmere Island (orange), Agassiz Ice Cap (purple), Prince of Wales Icefield (blue), Manson Icefield (yellow), Sydkap Ice Cap (blue-green), Devon Island and Coburg Island (navy), Axel Heiberg Island (green) and Meighen Ice Cap (red).
3. RESULTS
3.1. Mean summer glacier LST
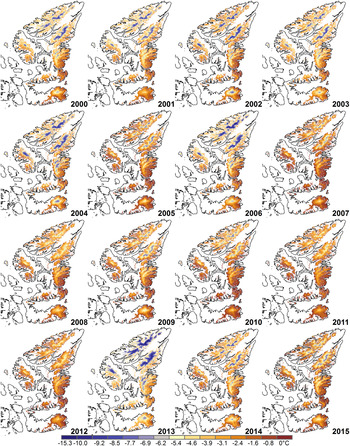
Mean summer clear-sky LST data for all glacier-covered surfaces in the QEI for each year of the period 2000–15 are presented in Figure 2. The QEI-wide mean summer glacier LST, averaged over all 16 a (Fig. 2), was −3.3 ± 1.8°C (mean ± 1 SD; Table 1; Supplementary Material; Fig. S7). The highest QEI-wide mean summer glacier LST (−2.3 ± 1.6°C) was recorded in 2007, while the lowest (−5.4 ± 2.2°C) was recorded in 2013. The mean summer glacier LST for each of the eight regions shown in Figure 1c was computed by averaging the mean summer LSTs (Fig. 2) for all glaciated pixels within each region. The lowest mean summer glacier LST occurred in 2013 in all regions, with the exception of the Meighen Ice Cap for which it occurred in 2001. The highest mean summer glacier LST was recorded in 2007 on Meighen Ice Cap and Axel Heiberg Island in the western QEI, and on the Agassiz Ice Cap and Prince of Wales Icefield in eastern Ellesmere Island. The highest mean summer glacier LST for a region in the southeast that includes the ice masses on Devon and Coburg Islands and the Sydkap Ice Cap and Manson Icefield on Ellesmere Island occurred in 2010. The highest regionally averaged mean summer glacier LST on Northwest Ellesmere Island occurred in 2012. High mean summer glacier LSTs for the period 2007–12 are consistent with the observed higher incidence of persistent positive mean 500 hPa geopotential height anomalies over the Canadian Arctic and western Greenland between 2007 and 2012 (Rajewicz and Marshall, Reference Rajewicz and Marshall2014; Bezeau and others, Reference Bezeau, Sharp and Gascon2015). Such synoptic conditions have previously been linked with extreme warm summers and negative glacier mass balances in the QEI (Alt, Reference Alt1978, Reference Alt1987; Gascon and others, Reference Gascon, Sharp and Bush2013a). The 500 hPa geopotential height anomalies for 2000–15 from NCEP/NCAR Reanalysis R1 data (Kalnay and others, Reference Kalnay1996) display a ridge (trough) centered over the north and west of the QEI during warm (cold) summers.
Mean summer clear-sky LST (°C) for the QEI.
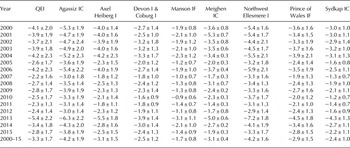
Clear-sky mean summer LST (°C) for glaciated regions of the QEI; ±1 SD
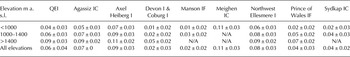
We observe a decrease in mean summer glacier LST (Fig. 2) and an increase in the standard deviation of the mean summer glacier LST (Supplementary Material; Fig. S8) with increasing latitude and elevation. In general, LST is highest across the southern regions of the QEI (Devon Ice Cap and Coburg Island, Sydkap Ice Cap, Manson Icefield and the southern part of Prince of Wales Icefield) and lowest on ice masses located further to the north and west (Axel Heiberg Island, Northwest Ellesmere Island, Agassiz Ice Cap and the northern part of the Prince of Wales Icefield). In any given year, mean summer glacier LST is, as expected, higher at low elevations around the margins of the ice masses than in higher elevation interior regions. The QEI-wide 16-a mean summer glacier LST was 3.8°C higher for areas below 1000 m a.s.l. than for areas above 1400 m a.s.l., indicating a longer and/or more intense melt season at lower elevations (Table 2). The 8 d mean LST reached 0°C at least once during the study period in 99.9% of all glacier-covered pixels, confirming that melt very likely occurred over the entire ice cover of the QEI at least once during the study period.
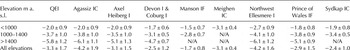
16-a average (2000–15) clear-sky mean summer LST (°C) for glaciated regions of the QEI by elevation zone (Section 2.2) ±1 SD
3.1.1. Glacier LST anomalies 2000–15
Annual summer QEI-wide and regional glacier LST anomalies were computed relative to the 2000–15 mean. For consistency with the LST regression analysis (Section 3.2), anomalies were only calculated for pixels that had mean summer LST observations for all 16 a, which amounted to 91% of all possible pixels. Positive (negative) LST anomalies indicate melt seasons that are longer (shorter) and/or warmer (cooler) than the 2000–15 mean. The interval 2000–15 is characterized by a 5-a period (2000–04) of negative glacier LST anomalies (between −0.35 ± 0.65°C and −0.93 ± 0.70°C) and a 6-a period (2007–12) of positive LST anomalies (between 0.54 ± 0.43°C and 1.08 ± 0.45°C), separated by two intermediate years: one of positive LST anomalies (2005; 0.76 ± 0.40°C) and one of negative LST anomalies (2006; −0.87 ± 0.79°C) (Fig. 3; Table 3). The largest QEI-wide negative glacier LST anomaly (−2.06 ± 0.84°C) was recorded in 2013. With the exception of Meighen Ice Cap (2001), the largest negative anomaly in each region also occurred in 2013. In 2014, regional glacier LST anomalies were positive in the northwest but negative in the south and east, and the QEI-wide glacier LST anomaly was mildly negative (−0.10 ± 0.49°C). 2015 saw a return to positive LST anomalies (0.46 ± 0.45°C) across the QEI. There is no year in which LST anomalies for all glaciated pixels in the QEI were either entirely positive or entirely negative. However, in 2007 (the year with the highest mean summer LST) and 2013 (the year with the lowest mean summer LST), only 1 and 0.05% of pixels respectively, had negative and positive summer glacier LST anomalies.
Mean summer clear-sky LST anomaly (°C) relative to the 2000–15 mean for the QEI.

Clear-sky mean summer LST anomaly (°C) with respect to the 2000–15 mean for glaciated regions of the QEI; ±1 SD
The sign of the LST anomaly also varies within each region. From Figure 3, we note that glacier LST anomalies were positive along the northwest coast of Ellesmere Island in 2002, 2003 and 2014, but were negative at higher elevations inland during those same years. With the exception of extreme warm or cold years, LST anomalies on the summit of Devon Ice Cap tended to be of opposite sign to those observed at lower elevations. Another area where summer LST anomalies were often of opposite sign to those in the rest of the region includes the northern part of Manson Icefield and the extreme southeast portion of the Prince of Wales Icefield. This area borders Baffin Bay and is downwind of the North Water (NOW) polynya (Fig. 1); this open water source may play a role in moderating the climate in this region by increasing cloud cover and summer snowfall in years when the polynya is relatively large. Baffin Bay is the primary moisture source for maritime-facing slopes in the southeast of the QEI (Koerner, Reference Koerner1979) and warm summers, inferred from ice core data, were well correlated with the maximum open water extent in the QEI's interisland channels for the 1961–74 period (Koerner, Reference Koerner1977).
3.2. LST change 2000–15
To determine whether there was a measurable change in mean summer glacier LST over the study period, we performed a linear regression analysis. Regressions were computed on a pixel-by-pixel basis for all pixels having mean summer LST observations in all 16 a (Fig. 1). Between 2000 and 2015, QEI-wide mean summer glacier LST increased at a rate of 0.06 ± 0.04°C a−1 (Table 4), for a total increase of 0.96°C over the 16-a study period. There is a general trend toward higher mean summer LSTs across most of the QEI (93% of pixels measured experienced an increase in LST), suggesting an increase in melt season duration and/or intensity in most regions. The measured increase in LST is markedly greater in the north and west of the QEI. The measured rates of change in LST on Meighen Ice Cap, Axel Heiberg Island and Northwest Ellesmere Island were two to four times higher than those observed in the southeast of the QEI. This spatial pattern of enhanced summer surface warming in the northwest of the QEI is consistent with that reported previously by Sharp and others (Reference Sharp2011). An apparent decrease in mean summer LST is observed for coastal regions of southeast Devon Ice Cap, as well as for Manson Icefield and the southeast coastal region of Prince of Wales Icefield below ~500 m a.s.l. This might indicate a trend toward a shorter and/or less intense melt season in these regions. The proximity of this region to open water sources in Baffin Bay and Nares Strait (including the NOW polynya; Fig. 1) may assist in maintaining these low-lying ice masses. During warm summers, when polynya extent is relatively large, we expect an increase in the frequency of storm systems that bring moist air masses from the east, causing snowfall and surface riming. Rime and fresh snow temporarily raise the surface albedo, decreasing the amount of solar energy absorbed at the surface and reducing the surface temperature. Such sudden increases in albedo, especially during the warm summer months, could partly explain the lower rates of LST increase along the southeast coasts of Devon and Ellesmere Islands.
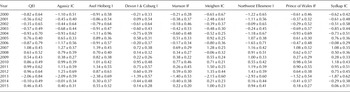
16-a linear rate of change (2000–15) of clear-sky mean summer LST (°C a−1) for glaciated regions of the QEI by elevation zone (Section 2.2) ±1 SD
The QEI-wide rate of change in the mean summer LST over the 16 ya period for regions above 1400 m a.s.l. (0.09 ± 0.03°C a−1) was more than double that for regions below 1000 m a.s.l. (0.04 ± 0.03°C a−1) (Table 4). The northwest/southeast spatial gradient in LST change is magnified at higher elevations. On both Axel Heiberg and northwest Ellesmere Islands, mean summer LST above 1400 m a.s.l. increased by more than 0.09°C a−1. Between 1000 and 1400 m a.s.l., the rate was between 0.08 and 0.09°C a−1. In contrast, the mean summer LSTs of the high and mid-elevation regions of Devon Ice Cap increased by only 0.05 ± 0.02°C a−1 and 0.02 ± 0.02°C a−1, respectively. This enhanced surface warming at higher elevations is not unexpected, because there is more potential for warming in these regions where the mean summer LST is lower. It is also possible that, as the incidence of surface melting increases at higher elevations, increased percolation of meltwater into cold snow and firn contributes to surface warming by the release of latent heat during refreezing.
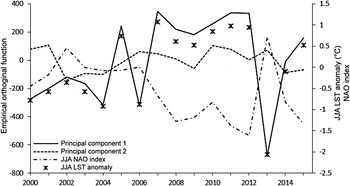
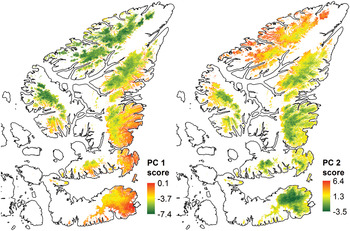
To explore whether there are any additional spatial patterns in the LST data that differ from the long-term (linear) LST trend, we performed a Principal Components Analysis on the 16-a mean summer LST record. Only the first two Principal Components had eigenvalues greater than one. The first Principal Component (PC1), which explains 79% of the variance in the LST record, closely follows the pattern of annual summer LST anomalies (Fig. 4). This component's scores are largest in the northwest and at higher elevations, consistent with the pattern of LST change described previously (Fig. 5). In addition, the departure from zero is much larger for the minimum scores than for the maximum scores, suggesting that positive and negative LST anomalies have the same pattern and are most likely caused by the same (atmospheric) forcing. Investigating potential atmospheric forcings, we find the Empirical Orthogonal Functions (EOFs) of PC1 to be well correlated (−0.79, p < 0.001) with the mean summer North Atlantic Oscillation (NAO) index, derived by averaging the JJA monthly mean NAO indices, for 2000–15 (http://www.cpc.ncep.noaa.gov). The JJA NAO index displays a similar trend to the EOFs of PC1 for 2007–15, but the extreme warm and cold years in 2005 and 2006 are not explained by this teleconnection. The second Principal Component, which explains 6% of the variance in the LST record yield very negative component scores on Devon Ice Cap and very positive component scores along the northwest coast of Ellesmere Island. The largest positive and negative EOFs for this Principal Component occurred in 2001 and 2002 respectively (Fig. 4). This suggests localized LST anomalies in these regions in 2001 and 2002 that were out of phase with the rest of the QEI. Large positive LST anomalies were observed on Devon Ice Cap in 2001 (when anomalies were negative elsewhere). In the following year, positive LST anomalies were observed along the northwest coast of Ellesmere Island.
EOF for the first Principal Component of the LST time series for 2000–15 (left-hand axis, solid black line segments). The mean summer (JJA) LST anomaly relative to the 2000–2015 mean (°C) (black star) and the mean JJA NAO index for 2000–15 (dashed curve) are plotted on the right-hand axis.
Component scores for the first two Principal Components of the mean summer clear-sky LST (Fig. 2) for the QEI.
There is a clear increase in mean summer glacier LST in all regions of the QEI over the 2000–15 period. Positive glacier LST anomalies from 2007 to 2012 suggest that the bulk of this increase occurred over the second half of the study period. The years 2010–12 produced three of the four highest QEI-wide mean summer glacier LSTs. Although the summer mean LST in 2013 was 1.4–2.9°C lower than the period mean, this extreme negative anomaly did not result in a decrease in mean LST during the 2011–15 pentad. A previous study identified extreme summer warming and enhanced melt over the QEI for a period ending in 2009 (Sharp and others, Reference Sharp2011). We find that even stronger summer warming occurred after the conclusion of that study.
3.3. Summer air temperatures
Mean summer near-surface and upper-air temperatures over glaciated surfaces in the QEI, are highly correlated with mean summer glacier LSTs (Sharp and others, Reference Sharp2011). Since variability in mean summer glacier LST and mean summer air temperature are strongly coupled, past air temperature changes can be used to infer past changes in glacier LST. The record of air temperature measurements is considerably longer (1948-present) than the MODIS satellite record (2000-present). To place our 16-e LST record in the context of the past 68 a we extend the record of 700 hPa geopotential height air temperatures and 2 m air temperatures presented by Sharp and others (Reference Sharp2011) to 2015.
Mean summer air temperatures at 700 hPa geopotential height were obtained from the NCEP/NCAR R1 Reanalysis (Kalnay and others, Reference Kalnay1996) for the seven locations used by Sharp and others (Reference Sharp2011) (Supplementary Material; Table S9). These locations correspond to high elevation sites on the seven major ice masses used in the current study. The Meighen Ice Cap contains only ~0.09% of the QEI glacier area and was not included in the analysis. Mean summer 700 hPa air temperatures (2005–15) were 1.0–1.2°C higher than the 1948–2015 mean in all regions (Fig. 6b). Six of the seven warmest years on record occurred between 2005 and 2015, expect on Devon Ice Cap where four of the seven warmest years occurred during this period. 2010 and 2011 were the two warmest years in all regions; 2005, 2007, 2008, 2010, 2011 and 2012 were among the 11 warmest years. 2013 was among the ten coldest years in all regions except for Manson Icefield and Devon Ice Cap (17th and 21st coldest respectively). Mean summer 2000–15 700 hPa temperatures were highly correlated with the regional mean summer LSTs (Manson Icefield r > 0.78, all other regions r ≥ 0.86; Table 5).
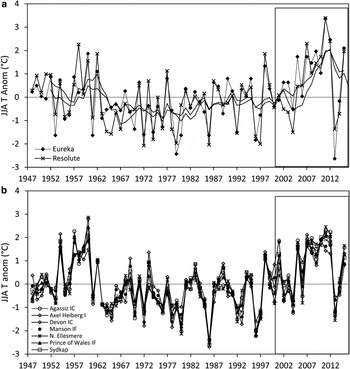
Annual anomalies (relative to the 1948–2015 mean) in (a) mean summer (JJA) near-surface air temperature at Eureka and Resolute; (b) mean summer 700 hPa air temperature for sites centered on the interior of each of the major glaciated regions in the QEI (all regions in Fig. 1c except for the Meighen Ice Cap) from the NCEP/NCAR R1 Reanalysis. Black box indicates period of MODIS satellite record.
Pearson correlation coefficient, r, of the mean summer LST versus the mean summer 700 hPa air temperature for the period 2000–15 for the seven major ice masses in the QEI (Fig. 1c)

Near-surface (2 m) air temperatures from Environment Canada's weather stations at Eureka and Resolute Bay are available for 1948-present (http://climate.weather.gc.ca). JJA mean air temperatures at these stations were calculated from monthly mean temperatures derived from daily averages. Daily averages were computed by averaging the daily maximum and minimum hourly temperatures. These stations are located at a distance from the glaciated regions studied and are not situated on ice. In the absence of long-term on-ice recording stations in the Canadian Arctic, these records provide a useful indication of long-term temperature trends in the region. A previous work found good agreement (r > 0.79) between the near-surface air temperature records at Eureka and Resolute Bay and on-ice near-surface air temperature measurements from the Agassiz Ice Cap (1988–2010) and Devon Ice Cap (1997–2010) (Sharp and others, Reference Sharp2011).
Eureka and Resolute Bay summer 2005–15 air temperatures were 1.2°C higher than the 1948–2015 mean (Fig. 6a). 2005–09 and 2010–14 were the warmest pentads on record at both stations. 2009, 2011 and 2012 were among the four warmest of the last 68 summers at Eureka. 2012, 2011 and 2007 were the three warmest summers recorded at Resolute Bay. 2013 was the coldest summer recorded at Eureka and the 11th coldest at Resolute Bay. The presence of a single extreme cold year (2013) did not significantly alter the upward trend in 21st-century summer air temperatures: 2010–14 was the second warmest pentad at both locations (0.8–1.5°C warmer than the next warmest pentad), suggesting that 2013 was more likely a single extreme (cold) year than the beginning of a more prolonged period of lower temperatures.
The near-surface and upper air temperature records display similar patterns of summer temperature anomalies for 1948–2015 (Fig. 6). Positive anomalies occurred from the mid-1950s until the early 1960s and were followed by a period of relatively lower temperatures lasting until the early to mid-1990s. Although positive summer air temperature anomalies were observed between the mid-1960s and mid-1990s, they did not persist for more than a few years and never exceeded 1°C. A sustained warm period began in the late 1990s and has continued until present, with a few exceptions: temperature anomalies were slightly negative in the early 2000s, and 2013 was one of the coldest years in all records. There is good agreement (r > 0.79) between the near-surface and upper-air temperature records for 1948–2015 and we have shown that the upper-air temperatures are highly correlated (r > 0.78) with the summer mean glacier LST for 2000–15. The close coupling between air temperatures and LST suggests that the most recent period of anomalously high QEI summer mean glacier LST (2007–12) was not just high with respect to the 16-a satellite record; it was likely one of the warmest periods since at least 1948.
4. DISCUSSION
We have presented the first picture of mean summer LST and its variability over all glaciated surfaces in the QEI. The only previous study to monitor QEI summer glacier LST using MODIS observations (Sharp and others, Reference Sharp2011) calculated summer LST for individual 23 km × 23 km boxes centered on interior regions of seven large ice masses. Boxes were chosen to avoid areas where the summer LST regularly reached 0°C. Given the significant differences in LST change observed for high- and low-elevation regions (Section 3.2), we would expect the magnitude of LST change calculated from select high-elevation boxes to be larger than that computed using all glaciated surfaces. For comparison, we computed mean summer LST anomalies relative to the 2000–09 mean for all QEI glaciated surfaces for the 2000–09 period. The difference in mean summer glacier LST between 2000–04 and 2005–09 was 0.2–0.5°C less than reported by Sharp and others (Reference Sharp2011) for all regions except Northwest Ellesmere Island where the difference was 0.3°C greater (Supplementary Material; Table S10). There is good general agreement between the 2000–09 LST records from the two studies, suggesting that, under current climatic conditions, a spatially distributed sample of high-elevation locations may be sufficient to determine the sign and approximate magnitude of LST changes and to identify broad spatial patterns. However, the point-based method does not permit evaluation of the complete spatial structure of LST change. For example, the inclusion of all glaciated surfaces has allowed the identification of areas for which the sign of the annual LST anomalies was often opposite to that in the rest of the region (Section 3.1.1).
High-elevation (>1400 m a.s.l.) LST change was more than double that at lower elevations (<1000 m a.s.l.) and the rate of LST increase was less at lower latitudes. LSTs in southern and low-elevation regions regularly reached the pressure melting point during the summer. Differences in the rate of LST change may be attributed, in part, to the fact that the potential for surface warming is greatest in regions where the initial mean LST is lower. Importantly, a smaller increase in mean summer LST does not necessarily imply a lower rate of glacier mass loss since an increase in atmospheric temperatures over a surface that is at the melting point will result in melting, runoff, and mass loss, rather than surface warming. Unfortunately, sparse in situ measurements and the coarse spatial resolution of the Reanalysis data prohibit determination of whether atmospheric warming was actually greater at higher elevations.
The occurrence of melt at all elevations and locations in the QEI could have important implications for the future distribution of melt, percolation and runoff on the region's ice caps and glaciers. Meltwater percolation into the firn is expected to increase as melt becomes more frequent at all elevations. Enhanced meltwater percolation and subsequent refreezing in the firn releases latent heat, which in turn, raises the temperature of the firn. Ultimately, if the firn temperature reaches the pressure melting point, runoff from the firn may occur (Pfeffer and Humphrey, Reference Pfeffer and Humphrey1998). Increased rates of firn densification (Zdanowicz and others, Reference Zdanowicz2012; Bezeau and others, Reference Bezeau, Sharp, Burgess and Gascon2013) and the growth of large ice bodies within the firn (Gascon and others, Reference Gascon, Sharp, Burgess, Bezeau and Bush2013b) have been observed across the Canadian Arctic in recent years. Gascon and others (Reference Gascon, Sharp, Burgess, Bezeau and Bush2013b) speculate that this buildup of ice bodies could prevent deep penetration of meltwater into the firn and promote horizontal runoff, thereby increasing the percentage of snowmelt that runs off from higher elevation regions of ice caps. This buildup of ice bodies could also result in a spread of supraglacial lakes to higher elevations, if a perched water table forms above these ice bodies and could also occur without the firn as a whole reaching the melting point (Bezeau and others, Reference Bezeau, Sharp, Burgess and Gascon2013; Machguth and others, Reference Machguth2016). It could also result in more widespread slush flows that cause rapid ablation by failure and downslope transport of water saturated snow/firn.
Increases in summer LST can influence QEI glacier mass balance through the ice-albedo feedback. Absorption of solar radiation at the surface is governed by the surface albedo – the ratio of reflected to incoming solar radiation. Increases in LST promote grain growth, which lowers the surface albedo, while the rate of snow/ice grain metamorphism increases with temperature and in the presence of liquid water (Wiscombe and Warren, Reference Wiscombe and Warren1980; Colbeck, Reference Colbeck1982). Atmospheric warming and higher LSTs result in a more rapid and/or earlier removal of the previous year's snowpack. Since the albedo of bare ice (~0.2–0.35) is lower than that of fresh snow (0.6–0.8) (Cuffey and Paterson, Reference Cuffey and Paterson2010), earlier exposure of bare ice by snowpack removal increases energy absorption, leading to enhanced surface warming and/or melt. Increased melt can also lead to a more rapid release of impurities contained in snow and ice. These impurities become concentrated on the snow/ice surface, further reducing the surface albedo, leading to increased surface temperatures and/or melt (Flanner and others, Reference Flanner, Zender, Randerson and Rasch2007 and references therein). Thus, higher LSTs and atmospheric temperatures can lead to a reduction in the surface albedo, which increases solar energy absorption and promotes further surface warming and/or melt. This positive feedback mechanism is expected to result in more negative glacier mass balances in the QEI, unless there is a compensating increase in precipitation and fresh snowfall, which would temporarily increase the surface albedo (e.g. Box and others, Reference Box2012).
Ice masses in the QEI contain a total of 86.3–138.1 mm of sea level equivalent (Radić and others, Reference Radić2014). A higher mean summer glacier LST implies a longer and/or more intense melt season, while higher air temperatures imply an increase in energy available for melt. Since interannual variability in QEI glacier surface mass balance is governed by changes in summer melt and runoff (which may be further enhanced through ice-albedo feedbacks), the observed increases in LST and air temperature should be reflected in the mass-balance record. In situ mass-balance observations extend up until 2013/14 and indicate that 2007 was the most negative mass-balance year in the QEI since the 1960s (http://wgms.ch/latest-glacier-mass-balance-data/). Regional climate and mass-balance modeling, and remote sensing measurements, also indicate strongly negative Canadian Arctic glacier mass balances between 2003 and 2014 (Gardner and others, Reference Gardner2013; Lenaerts and others, Reference Lenaerts2013; Sharp and others, Reference Sharp2015).
Annual estimates of glacier mass change in the QEI as a whole over the period 2002–15 were derived by differencing successive annual summer minima in the time series of regional mass anomalies measured by the Gravity Recovery and Climate Experiment (GRACE; update from Gardner and others, Reference Gardner2011). The GRACE mass change data are consistent with the mean summer LST record for 2003/04–2014/15. 2013 had the lowest QEI-wide mean summer LST and the least negative QEI-wide mass change. 2007, 2011 and 2012 had the three highest QEI-wide mean summer LSTs and the three most negative annual mass changes. The QEI annual mass change and QEI mean summer LST are strongly correlated (r = −0.82; p < 0.01), confirming that variations in annual mass balance in this region are strongly influenced by variations in summer air temperature.
5. CONCLUSIONS
This study provides the first complete picture of summer mean LST variations over all glaciated surfaces of the QEI from 2000 to 2015. QEI mean summer glacier surface temperature increased by 0.06 ± 0.04°C a−1, for a total change of 0.96°C over the 16-a period. More than 90% of the QEI's glaciated area experienced an increase in LST. Nearly all glaciated pixels recorded at least one LST observation of 0°C, suggesting that melt occurred at all elevations and all locations in the region. The LST change was greatest in the northwest, which is consistent with the findings of a previous study (Sharp and others, Reference Sharp2011) that covered a shorter time period with less complete spatial coverage. 2007 had the highest mean summer glacier LST, followed by 2011 and 2012. Summer 700 hPa and near-surface air temperatures from 2010 to 2012 were among the warmest on record. The strong correlation between summer LST and 700 hPa air temperatures suggests that recent summers were not only anomalously warm relative to the 16-a satellite record, but were likely some of the warmest since at least 1948. Increases in LST have important implications for glacier surface mass balance. Longer and/or more intense melt seasons will likely result in more negative glacier mass balances and higher rates of glacier mass loss in a region that is already one of the largest non-ice sheet contributors to the eustatic component of global sea level rise.
SUPPLEMENTARY MATERIAL
The supplementary material for this article can be found at http://dx.doi.org/ 10.1017/jog.2016.80.
ACKNOWLEDGEMENTS
We thank NSERC Canada (Discovery Grant to M.S., Vanier Canada Postgraduate Scholarship to C.M.), Alberta Innovates – Technology Futures (M.S.), and the Netherlands Polar Program – NWO (B.W) for financial support, David Burgess for providing Devon Ice Cap in situ mass-balance data, and two anonymous reviewers for their comments.


 Open access