



No CrossRef data available.
Article contents
Exploring matrilocality in history: insights from ancient DNA
Published online by Cambridge University Press: 06 April 2026
Abstract

Patterns of social organisation and gender differentiation in past societies are difficult to reconstruct from material culture data alone, are prone to modern interpretation biases, and often remain subjects of controversy. An important aspect of social organisation is patterns of post-marital residence, for example, matrilocality and patrilocality. To date, archaeological studies have recognised mostly patrilocal communities, with rare contested exceptions that were considered ‘outliers’ to the established rule of patrilocality. The advent of ancient DNA analysis has made it possible to evaluate past social structures from a genetic perspective as well, with the majority of ancient DNA studies identifying patrilocal communities and highlighting genetic patriline connections. Recently, three studies reported genetic evidence for matrilocality and genetic matriline connections across broad geographical and temporal scales. Here, we draw on these three studies to explore past social organisation forms in light of new evidence and reconsider preconceptions that continue to endure over time.
Information
- Type
- Perspective
- Information
- Creative Commons


 This is an Open Access article, distributed under the terms of the Creative Commons Attribution-NonCommercial-ShareAlike licence (http://creativecommons.org/licenses/by-nc-sa/4.0), which permits non-commercial re-use, distribution, and reproduction in any medium, provided the same Creative Commons licence is used to distribute the re-used or adapted article and the original article is properly cited. The written permission of Cambridge University Press or the rights holder(s) must be obtained prior to any commercial use.
- Copyright
- © The Author(s), 2026. Published by Cambridge University Press.
References
Allason-Jones, L. (2012). Women in Roman Britain. In S. L. James & S. Dillon (Eds.), A Companion to Women in the Ancient World (pp. 467–477). John Wiley & Sons, Ltd. https://doi.org/10.1002/9781444355024.ch34Google Scholar
Altınışık, N. E., Kazancı, D. D., Aydoğan, A., Gemici, H. C., Erdal, Ö. D., Sarıaltun, S., Vural, K. B., Koptekin, D., Gürün, K., Sağlıcan, E., Fernandes, D., Çakan, G., Koruyucu, M. M., Lagerholm, V. K., Karamurat, C., Özkan, M., Kılınç, G. M., Sevkar, A., Sürer, E. …, Somel, M. (2022). A genomic snapshot of demographic and cultural dynamism in upper Mesopotamia during the Neolithic transition. Science Advances, 8(44), eabo3609. https://doi.org/10.1126/sciadv.abo3609Google Scholar
Armit, I., Fischer, C.-E., Koon, H., Nicholls, R., Olalde, I., Rohland, N., Buckberry, J., Montgomery, J., Mason, P., Črešnar, M., Büster, L., & Reich, D. (2023). Kinship practices in Early Iron Age South-east Europe: Genetic and isotopic analysis of burials from the Dolge Njive barrow cemetery, Dolenjska, Slovenia. Antiquity, 97(392), 403–418. https://doi.org/10.15184/aqy.2023.2Google Scholar
Benjamin, R. (2015). The emperor’s new genes: Science, public policy, and the allure of objectivity. The Annals of the American Academy of Political and Social Science, 661, 130–142. https://doi.org/10.1177/000271621558785Google Scholar
Bentley, R. A., Bickle, P., Fibiger, L., Nowell, G. M., Dale, C. W., Hedges, R. E. M., Hamilton, J., Wahl, J., Francken, M., Grupe, G., Lenneis, E., Teschler-Nicola, M., Arbogast, R.-M., Hofmann, D., & Whittle, A. (2012). Community differentiation and kinship among Europe’s first farmers. Proceedings of the National Academy of Sciences, 109(24), 9326–9330. https://doi.org/10.1073/pnas.1113710109Google Scholar
Bickle, P. (2020). Thinking gender differently: New approaches to identity difference in the central European Neolithic. Cambridge Archaeological Journal, 30(2), 201–218. https://doi.org/10.1017/S0959774319000453Google Scholar
Bickle, P., & Hofmann, D. (2022). Female mobility patterns in prehistory: Patrilocality, descent and kinship of the Linearbandkeramik (LBK). In A. Denaire, R. M. Arbogast, Š. Grando-Válečková, P. Lefranc, M. Mauvilly, & S. Van Willingen (Eds.), D’Oberlarg à Wesaluri, itinéraire d’un préhistorien: Mélanges offerts à Christian Jeunesse (pp. 105–122). AVAGE.Google Scholar
Bickle, P., Hofmann, D., Souvatzi, S., Cintas-Peña, M., Rebay-Salisbury, K., Schauer, P., Khalil, U., Shaw, D., & Vleet, K. E. V. (2025). Moving to Stay in (a Woman’s) Place. Current Anthropology, 66, 954–968. https://doi.org/10.1086/738727Google Scholar
Blöcher, J., Brami, M., Feinauer, I. S., Stolarczyk, E., Diekmann, Y., Vetterdietz, L., Karapetian, M., Winkelbach, L., Kokot, V., Vallini, L., Stobbe, A., Haak, W., Papageorgopoulou, C., Krause, R., Sharapova, S., & Burger, J. (2023). Descent, marriage, and residence practices of a 3,800-year-old pastoral community in Central Eurasia. Proceedings of the National Academy of Sciences, 120(36), e2303574120. https://doi.org/10.1073/pnas.2303574120Google Scholar
Booth, T. J., Brück, J., Brace, S., & Barnes, I. (2021). Tales from the supplementary information: Ancestry change in Chalcolithic–Early Bronze Age Britain was gradual with varied kinship organization. Cambridge Archaeological Journal, 31(3), 379–400. https://doi.org/10.1017/S0959774321000019Google Scholar
Bretos Ezcurra, M., Rohrlach, A. B., Papac, L., Royo Guillén, J. I., Barquera, R., Gómez Lecumberri, F., Laborda Lorente, R., Risch, R., Krause, J., Picazo Millán, J. V., Haak, W., & Villalba-Mouco, V. (2025). Genomic insights from a final Bronze Age community buried in a collective tumulus in an Urnfield settlement in Northeastern Iberia. Communications Biology, 8(1), 1299. https://doi.org/10.1038/s42003-025-08668-7Google Scholar
Britton, K., & Richards, M. P., Eds. (2020). Biomolecular archaeology. In Archaeological science: An introduction (pp. 11–144). Cambridge University Press. https://www.cambridge.org/core/books/archaeological-science/biomolecular-archaeology/1E24CD8215D684CF84412B12237E1B9BGoogle Scholar
Brück, J. (2021). Ancient DNA, kinship and relational identities in Bronze Age Britain. Antiquity, 95(379), 228–237. https://doi.org/10.15184/aqy.2020.216Google Scholar
Cassidy, L. M., Russell, M., Smith, M., Delbarre, G., Cheetham, P., Manley, H., Mattiangeli, V., Breslin, E. M., Jackson, I., McCann, M., Little, H., O’Connor, C. G., Heaslip, B., Lawson, D., Endicott, P., & Bradley, D. G. (2025). Continental influx and pervasive matrilocality in Iron Age Britain. Nature, 637(8048), 1136–1142. https://doi.org/10.1038/s41586-024-08409-6Google Scholar
Chyleński, M., Makarowicz, P., Juras, A., Krzewińska, M., Pospieszny, Ł., Ehler, E., Breszka, A., Górski, J., Taras, H., Szczepanek, A., Polańska, M., Włodarczak, P., Lasota-Kuś, A., Wójcik, I., Romaniszyn, J., Szmyt, M., Kośko, A., Ignaczak, M., Sadowski, S. …, Malmström, H. (2023). Patrilocality and hunter-gatherer-related ancestry of populations in East-Central Europe during the Middle Bronze Age. Nature Communications, 14(1), 4395. https://doi.org/10.1038/s41467-023-40072-9Google Scholar
Coltofean-Arizancu, L., Matić, U., & Gaydarska, B. (2021). Gender stereotypes in archaeology. A short reflection in image and text. Sidestone Press. https://www.sidestone.com/books/gender-stereotypes-in-archaeologyGoogle Scholar
Cveček, S. (2023). Enthrone, dethrone, rethrone? The multiple lives of matrilineal kinship in Aegean prehistory. Archaeological Dialogues, 30(2), 102–122. https://doi.org/10.1017/S1380203824000059Google Scholar
Dulias, K., Foody, M. G. B., Justeau, P., Silva, M., Martiniano, R., Oteo-García, G., Fichera, A., Rodrigues, S., Gandini, F., Meynert, A., Donnelly, K., Aitman, T. J., Chamberlain, A., Lelong, O., Kozikowski, G., Powlesland, D., Waddington, C., Mattiangeli, V., … & Richards, M. B. (2022). Ancient DNA at the edge of the world: Continental immigration and the persistence of Neolithic male lineages in Bronze Age Orkney. Proceedings of the National Academy of Sciences, 119(8), e2108001119. https://doi.org/10.1073/pnas.2108001119Google Scholar
Ember, C. R., Droe, A., & Russell, D. (2022). Residence and kinship. In Ember, C. R. (Ed.), Explaining human culture. Human Relations Area Files. https://hraf.yale.edu/ehc/summaries/residence-and-kinshipGoogle Scholar
Ensor, B. E. (2021a). Making aDNA useful for kinship analysis. Antiquity, 95(379), 241–243. https://doi.org/10.15184/aqy.2020.234Google Scholar
Ensor, B. E. (2021b). The not very patrilocal European Neolithic: Strontium, aDNA, and archaeological kinship analyses. Archaeopress. https://doi.org/10.2307/j.ctv209xn0x.Google Scholar
Fontani, F., Larocca, F., Cilli, E., Iacovera, R., Andrews, A. J., Latorre, A., Arena, F., Veneziano, R., Calcagnile, L., Quarta, G., Ringbauer, H., Stockhammer, P. W., Krause, J., Luiselli, D., & Mittnik, A. (2025). Archaeogenetics reconstructs demography and extreme parental consanguinity in a Bronze Age community from Southern Italy. Communications Biology, 8(1), 1766. https://doi.org/10.1038/s42003-025-09194-2Google Scholar
Frieman, C. J., & Hofmann, D. (2019). Present pasts in the archaeology of genetics, identity, and migration in Europe: A critical essay. World Archaeology, 51(4), 528–545. https://doi.org/10.1080/00438243.2019.1627907Google Scholar
Frieman, C. J., Teather, A., & Morgan, C. (2019). Bodies in motion: Narratives and counter narratives of gendered mobility in European later prehistory. Norwegian Archaeological Review, 52(2), 148–169. https://doi.org/10.1080/00293652.2019.1697355Google Scholar
Furholt, M. (2018). Massive migrations? The impact of recent aDNA studies on our view of third millennium Europe. European Journal of Archaeology, 21(2), 159–191. https://doi.org/10.1017/eaa.2017.43Google Scholar
Furholt, M. (2021). Mobility and social change: Understanding the European Neolithic period after the archaeogenetic revolution. Journal of Archaeological Research, 29(4), 481–535. https://doi.org/10.1007/s10814-020-09153-xGoogle Scholar
Gnecchi-Ruscone, G. A., Rácz, Z., Samu, L., Szeniczey, T., Faragó, N., Knipper, C., Friedrich, R., Zlámalová, D., Traverso, L., Liccardo, S., Wabnitz, S., Popli, D., Wang, K., Radzeviciute, R., Gulyás, B., Koncz, I., Balogh, C., Lezsák, G. M., Mácsai, V. …, Hofmanová, Z. (2024). Network of large pedigrees reveals social practices of Avar communities. Nature, 629(8011), 376–383. https://doi.org/10.1038/s41586-024-07312-4Google Scholar
Gretzinger, J., Schmitt, F., Mötsch, A., Carlhoff, S., Lamnidis, T. C., Huang, Y., Ringbauer, H., Knipper, C., Francken, M., Mandt, F., Hansen, L., Freund, C., Posth, C., Rathmann, H., Harvati, K., Wieland, G., Granehäll, L., Maixner, F., Zink, A. …, Schiffels, S. (2024). Evidence for dynastic succession among early Celtic elites in Central Europe. Nature Human Behaviour, 8(8), 1467–1480. https://doi.org/10.1038/s41562-024-01888-7Google Scholar
Guyon, L., Heyer, E., & Chaix, R. (2025). Was descent in Neolithic and Bronze Age Europe patrilineal or bilateral? Proceedings of the Royal Society B: Biological Sciences, 292(2057). https://doi.org/10.1098/rspb.2025.0815Google Scholar
Haas, R., Watson, J., Buonasera, T., Southon, J., Chen, J. C., Noe, S., Smith, K., Viviano Llave, C., Eerkens, J., & Parker, G. (2020). Female hunters of the early Americas. Science Advances, 6(45), eabd0310. https://doi.org/10.1126/sciadv.abd0310Google Scholar
Hedenstierna-Jonson, C., Kjellström, A., Zachrisson, T., Krzewińska, M., Sobrado, V., Price, N., Günther, T., Jakobsson, M., Götherström, A., & Storå, J. (2017). A female Viking warrior confirmed by genomics. American Journal of Physical Anthropology, 164(4), 853–860. https://doi.org/10.1002/ajpa.23308Google Scholar
Hofmann, D., Hanscam, E., Furholt, M., Bača, M., Reiter, S. S., Vanzetti, A., Kotsakis, K., Petersson, H., Niklasson, E., Hølleland, H., & Frieman, C. J. (2021). Forum: populism, identity politics, and the Archaeology of Europe. European Journal of Archaeology, 24(4), 519–555. https://doi.org/10.1017/eaa.2021.29Google Scholar
Hrnčíř, V., Vondrovský, V., & Květina, P. (2020). Post-marital residence patterns in LBK: Comparison of different models. Journal of Anthropological Archaeology, 59, 101190. https://doi.org/10.1016/j.jaa.2020.101190Google Scholar
Ion, A. (2017). How interdisciplinary is interdisciplinarity? Revisiting the impact of aDNA research for the archaeology of human remains. Current Swedish Archaeology, 25(1), 177–198. https://doi.org/10.37718/CSA.2017.18Google Scholar
Johnson, M. (2019). Archaeological theory: An introduction (3rd ed). Wiley-Blackwell. https://www.wiley.com/en-us/Archaeological±Theory%3A±An±Introduction%2C±3rd±Edition-p-9781118475027Google Scholar
Kirby, K. R., Gray, R. D., Greenhill, S. J., Jordan, F. M., Gomes-Ng, S., Bibiko, H.-J., Blasi, D. E., Botero, C. A., Bowern, C., Ember, C. R., Leehr, D., Low, B. S., McCarter, J., Divale, W., & Gavin, M. C. (2016). D-PLACE: A global database of cultural, linguistic and environmental diversity. PLOS ONE, 11(7), e0158391. https://doi.org/10.1371/journal.pone.0158391Google Scholar
Knipper, C., Mittnik, A., Massy, K., Kociumaka, C., Kucukkalipci, I., Maus, M., Wittenborn, F., Metz, S. E., Staskiewicz, A., Krause, J., & Stockhammer, P. W. (2017). Female exogamy and gene pool diversification at the transition from the Final Neolithic to the Early Bronze Age in central Europe. Proceedings of the National Academy of Sciences, 114(38), 10083–10088. https://doi.org/10.1073/pnas.1706355114Google Scholar
Koptekin, D., Aydoğan, A., Karamurat, C., Altınışık, N. E., Vural, K. B., Kazancı, D. D., Doğu, A. K., Kaptan, D., Gemici, H. C., Yüncü, E., Moots, H. M., Umurtak, G., Duru, R., Fidan, E., Çevik, Ö., Erdoğu, B., Korkut, T., Knüsel, C. J., Haddow, S. …, Somel, M. (2025). Out-of-Anatolia: Cultural and genetic interactions during the Neolithic expansion in the Aegean. Science, 388(6754), eadr3326. https://doi.org/10.1126/science.adr3326Google Scholar
Leonetti, D. L., Nath, D. C., & Hemam, N. S. (2007). In-law conflict: Women’s reproductive lives and the roles of their mothers and husbands among the matrilineal Khasi. Current Anthropology, 48(6), 861–890. https://doi.org/10.1086/520976Google Scholar
Lowes, S. (2020). Kinship structure & women: Evidence from economics. Daedalus, 149(1), 119–133. https://doi.org/10.1162/daed_a_01777Google Scholar
Marlowe, F. W. (2005). Hunter-gatherers and human evolution. Evolutionary anthropology: Issues. News, and Reviews, 14(2), 54–67. https://doi.org/10.1002/evan.20046Google Scholar
Mazzucato, C., Coscia, M., Küçükakdağ Doğu, A., Haddow, S., Kılıç, M. S., Yüncü, E., & Somel, M. (2025). “A network of mutualities of being”: Socio-material archaeological networks and biological ties at Çatalhöyük. Journal of Archaeological Method and Theory, 32(1), 25. https://doi.org/10.1007/s10816-024-09692-3Google Scholar
Meskell, L. (1995). Goddesses, GImbutas and New Age archaeology. Antiquity, 69(262), 74–86. https://doi.org/10.1017/S0003598X00064310Google Scholar
Mittnik, A., Massy, K., Knipper, C., Wittenborn, F., Friedrich, R., Pfrengle, S., Burri, M., Carlichi-Witjes, N., Deeg, H., Furtwängler, A., Harbeck, M., von Heyking, K., Kociumaka, C., Kucukkalipci, I., Lindauer, S., Metz, S., Staskiewicz, A., Thiel, A., Wahl, J. …, Krause, J. (2019). Kinship-based social inequality in Bronze Age Europe. Science, 366(6466), 731–734. https://doi.org/10.1126/science.aax6219Google Scholar
Moen, M., & Pedersen, U. (2024). The Routledge Handbook of Gender Archaeology. Taylor & Francis.Google Scholar
Moore, H., Wilson, G., Challanain, M. N., McCormick, M., Marshall, P. D., Dulias, K., Foody, M. G. B., Justeau, P., Pala, M., Richards, M. B., & Edwards, C. J. (2022). Migration and community in Bronze Age Orkney: Innovation and continuity at the links of Noltland. Antiquity, 96(387), 541–559. https://doi.org/10.15184/aqy.2021.185Google Scholar
Morell-Rovira, B., Tvrdý, Z., Díaz-Zorita Bonilla, M., Bickle, P., Tóth, P., Přichystal, M., Bedáňová, A., & Masclans, A. (2024). Patrilocality at the beginning of farming? An isotopic approach from SE Moravia. Journal of World Prehistory, 37(1), 1–25. https://doi.org/10.1007/s10963-024-09181-1Google Scholar
Nägele, K., Rivollat, M., Yu, H., & Wang, K. (2022). Ancient genomic research—From broad strokes to nuanced reconstructions of the past. Journal of Anthropological Sciences = Rivista Di Antropologia: JASS, 100, 193–230. https://doi.org/10.4436/JASS.10017Google Scholar
Nongbri, T. (2010). Family, gender and identity. Contributions to Indian Sociology, 44(1–2), 155–178. https://doi.org/10.1177/006996671004400208Google Scholar
Pearson, J., Evans, J., Lamb, A., Baird, D., Hodder, I., Marciniak, A., Larsen, C. S., Knüsel, C. J., Haddow, S. D., Pilloud, M. A., Bogaard, A., Fairbairn, A., Plug, J.-H., Mazzucato, C., Mustafaoğlu, G., Feldman, M., Somel, M., & Fernández-Domínguez, E. (2023). Mobility and kinship in the world’s first village societies. Proceedings of the National Academy of Sciences, 120(4), e2209480119. https://doi.org/10.1073/pnas.2209480119Google Scholar
Pope, R. (2022). Re-approaching Celts: Origins, society, and social change. Journal of Archaeological Research, 30(1), 1–67. https://doi.org/10.1007/s10814-021-09157-1Google Scholar
Rivollat, M., Rohrlach, A. B., Ringbauer, H., Childebayeva, A., Mendisco, F., Barquera, R., Szolek, A., Le Roy, M., Colleran, H., Tuke, J., Aron, F., Pemonge, M.-H., Späth, E., Télouk, P., Rey, L., Goude, G., Balter, V., Krause, J., Rottier, S. …, Haak, W. (2023). Extensive pedigrees reveal the social organization of a Neolithic community. Nature, 620(7974), 600–606. https://doi.org/10.1038/s41586-023-06350-8Google Scholar
Russell, M., Smith, M., Cheetham, P., Evans, D., & Manley, H. (2019). The girl with the chariot medallion: A well-furnished, Late Iron Age Durotrigian burial from Langton Herring, Dorset. Archaeological Journal, 176(2), 196–230. https://doi.org/10.1080/00665983.2019.1573551Google Scholar
Sjögren, K.-G., Olalde, I., Carver, S., Allentoft, M. E., Knowles, T., Kroonen, G., Pike, A. W. G., Schröter, P., Brown, K. A., Brown, K. R., Harrison, R. J., Bertemes, F., Reich, D., Kristiansen, K., & Heyd, V. (2020). Kinship and social organization in Copper Age Europe. A cross-disciplinary analysis of archaeology, DNA, isotopes, and anthropology from two Bell Beaker cemeteries. PLOS ONE, 15(11), e0241278. https://doi.org/10.1371/journal.pone.0241278Google Scholar
Stege, K. E., & Huffer, E. (2008). Land and women: The matrilineal factor: The cases of the Republic of the Marshall Islands, Solomon Islands and Vanuatu. Pacific Islands Forum Secretariat. http://www.forumsec.org.fj/_resources/article/files/Land%20and%20Women.pdfGoogle Scholar
Surowiec, A., Snyder, K. T., & Creanza, N. (2019). A worldwide view of matriliny: Using cross-cultural analyses to shed light on human kinship systems. Philosophical Transactions of the Royal Society B: Biological Sciences, 374(1780), 20180077. https://doi.org/10.1098/rstb.2018.0077Google Scholar
Villalba-Mouco, V., Oliart, C., Rihuete-Herrada, C., Childebayeva, A., Rohrlach, A. B., Fregeiro, M. I., Celdrán Beltrán, E., Velasco-Felipe, C., Aron, F., Himmel, M., Freund, C., Alt, K. W., Salazar-García, D. C., García Atiénzar, G., de Miguel Ibáñez, M. P., Hernández Pérez, M. S., Barciela, V., Romero, A., Ponce, J. …, Haak, W. (2021). Genomic transformation and social organization during the Copper Age–Bronze Age transition in southern Iberia. Science Advances, 7(47), eabi7038. https://doi.org/10.1126/sciadv.abi7038Google Scholar
Wang, J., Yan, S., Li, Z., Zan, J., Zhao, J., Zhao, J., Chen, K., Wang, X., Ji, T., Zhang, C., Yang, T., Zhang, T., Qiao, R., Guo, M., Rao, Z., Zhang, J., Wang, G., Ran, Z., Duan, C. …, Ning, C. (2025). Ancient DNA reveals a two-clanned matrilineal community in Neolithic China. Nature, 647, 1–8. https://doi.org/10.1038/s41586-025-09103-xGoogle Scholar
Whyte, M. K. (2015). The status of women in preindustrial societies. Princeton University Press. https://doi.org/10.1515/9781400871810Google Scholar
Witte, M. D. (2001). Long live the dead!: Changing funeral celebrations in Asante, Ghana. Aksant Academic Publishers.Google Scholar
Yaka, R., Mapelli, I., Kaptan, D., Doğu, A., Chyleński, M., Erdal, Ö. D., Koptekin, D., Vural, K. B., Bayliss, A., Mazzucato, C., Fer, E., Çokoğlu, S. S., Lagerholm, V. K., Krzewińska, M., Karamurat, C., Gemici, H. C., Sevkar, A., Dağtaş, N. D., Kılınç, G. M. …, Somel, M. (2021). Variable kinship patterns in Neolithic Anatolia revealed by ancient genomes. Current Biology, 31(11), 2455–2468.e18. https://doi.org/10.1016/j.cub.2021.03.050Google Scholar
Yüncü, E., Doğu, A. K., Kaptan, D., Kılıç, M. S., Mazzucato, C., Güler, M. N., Eker, E., Katırcıoğlu, B., Chyleński, M., Vural, K. B., Sağlıcan, E., Atağ, G., Bozkurt, D., Pearson, J., Sevkar, A., Altınışık, N. E., Milella, M., Karamurat, C., Aktürk, Ş. …, Somel, M. (2025). Female lineages and changing kinship patterns in Neolithic Çatalhöyük. Science, 388(6754), eadr2915. https://doi.org/10.1126/science.adr2915Google Scholar
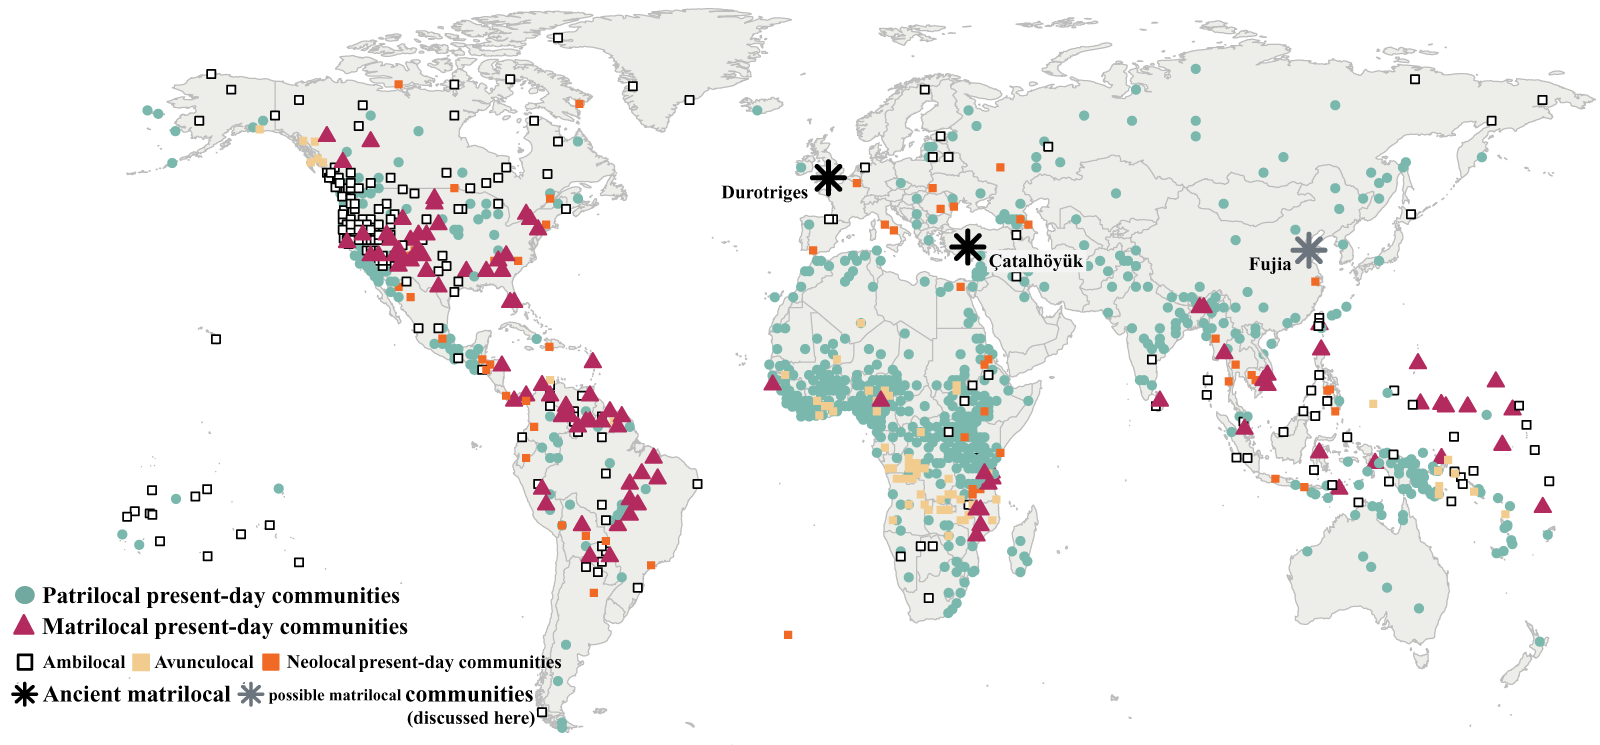
Figure 1. Global distribution of present-day societies that report patrilocal (green circles), matrilocal (purple triangles), ambilocal, avuncular, and neolocal (white, yellow, and orange squares, respectively) post-marital residence patterns. Data obtained from the D-place database (Kirby et al., 2016), using the variable ID EA012 and specifically data from Murdock et al. (1999) ‘Ethnographic Atlas’. In addition, the location of the three sites reporting on ancient DNA data discussed in this paper is shown with stars.
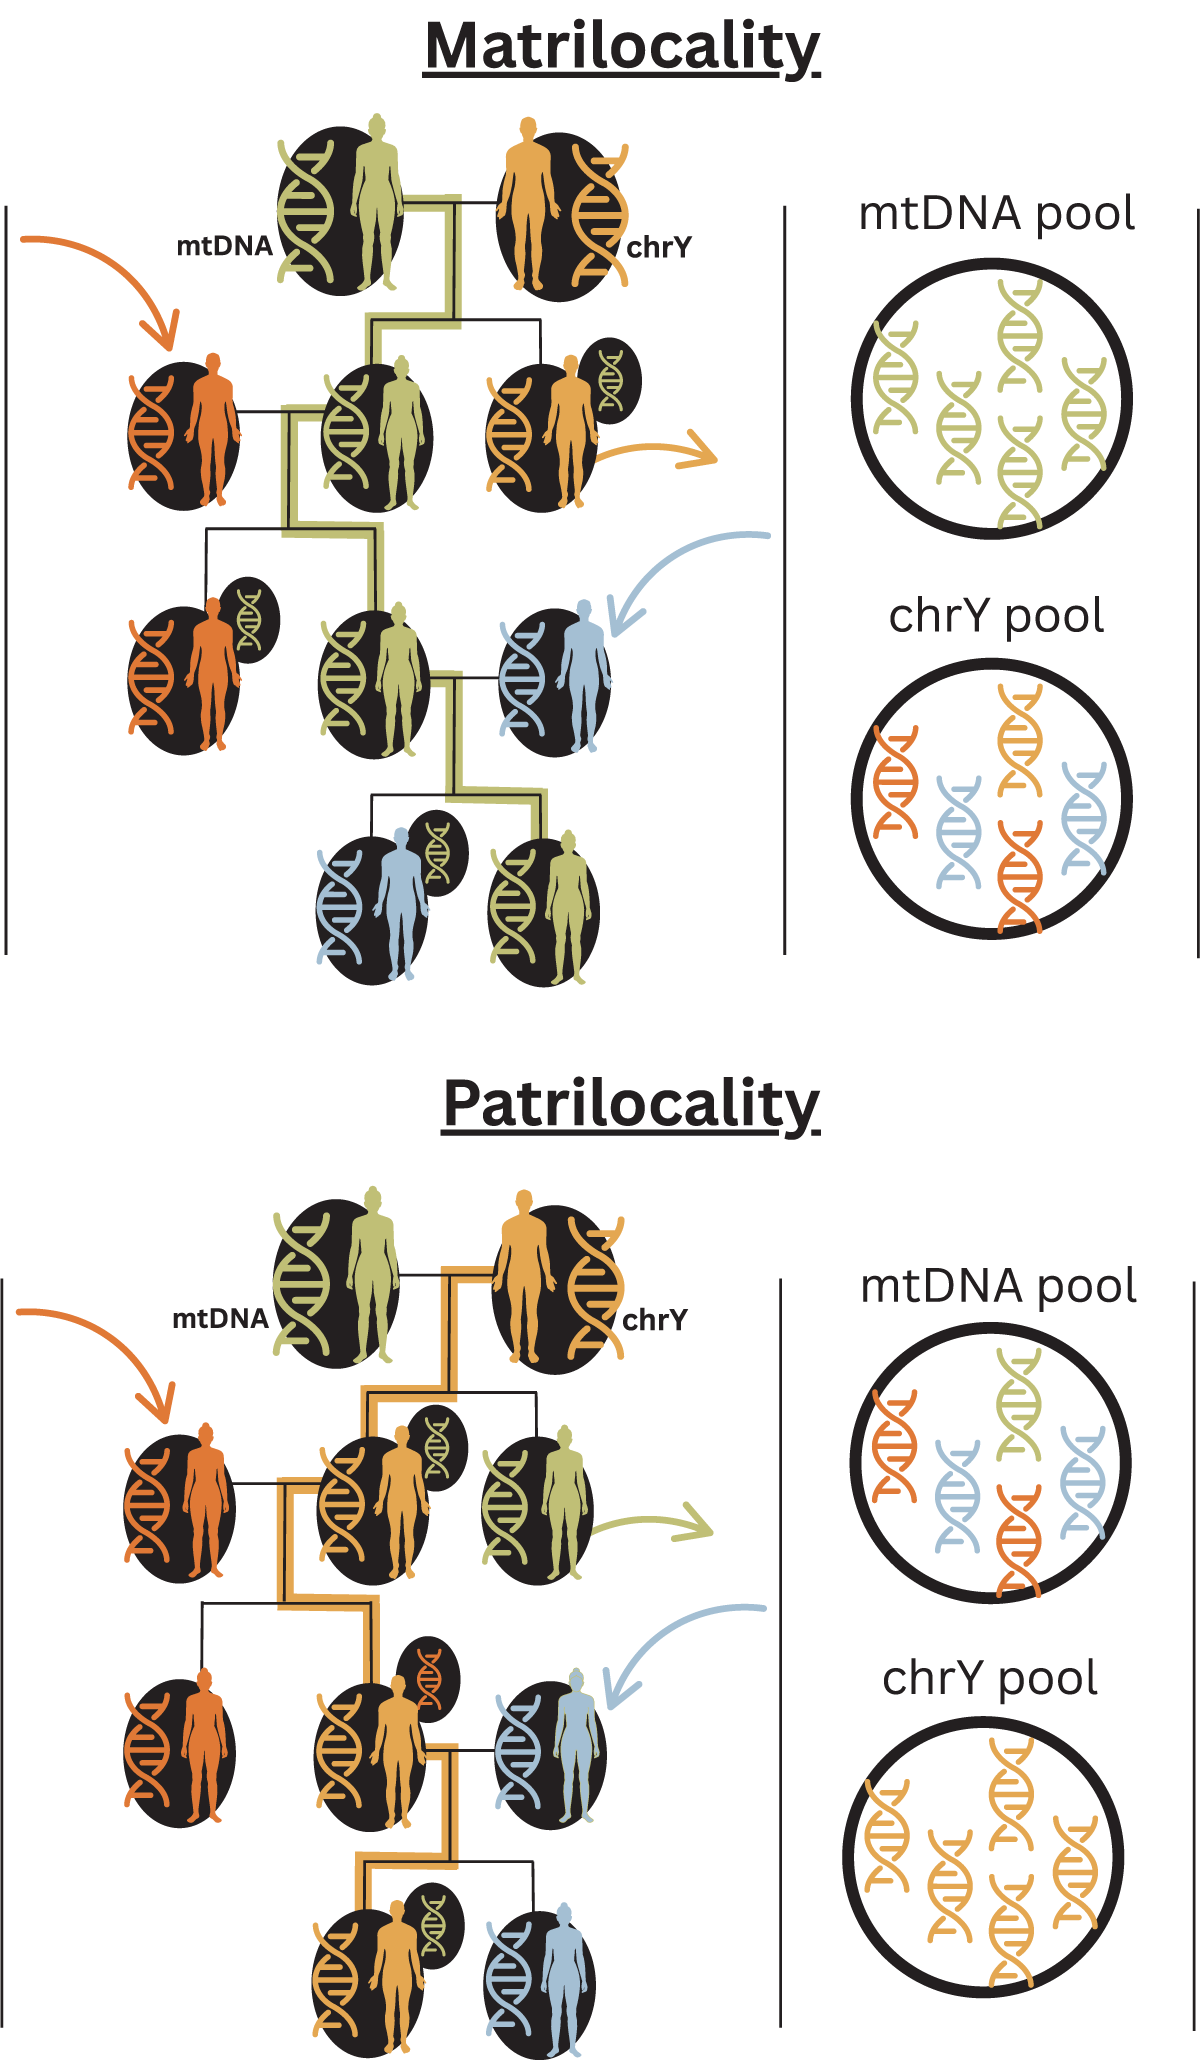
Figure 2. An example of how the mtDNA and chrY diversities contrast within a matrilocal and a patrilocal group of individuals. For the matrilocal example, in the pedigree on the upper panel, the mitochondrial haplotype of the oldest female individual is shown in green. The maternal lineage continues from the oldest female individual to the youngest (green line), since the females reside within the same group across the generations. In contrast, the male descendant of the oldest male individual leaves the group (orange arrow), resulting in the end of the paternal chrY line in the group. In the two consecutive generations, there is male influx from a different external group (red and blue arrows). In a case where we would have individuals’ mtDNA and chrY sequences in this group, we would have seen the same mtDNA haplotype in every individual – which reflects low diversity. However, the chrY haplotypes would have shown the opposite signal – high diversity. The difference we would have observed between the two markers is shown in the right panel. The opposite pattern – where the chrY pool has low diversity and the mtDNA pool shows high diversity – is shown for the patrilocal example.
 You have
Access
You have
Access
 Open access
Social media summary
Ancient DNA work highlights matrilocal residence patterns, inducing a rethink of how we study past social organisation.
Introduction
Social organisation in past societies is a central topic for the study of the human past. However, these patterns are challenging to reconstruct due to the incomplete nature of archaeological evidence, a lack of written records, and researchers’ biases; hence, interpretations often remain debated. Recently, ancient DNA (aDNA; genetic material retrieved from ancient remains [Britton & Richards, Reference Britton and Richards2020]) has offered an independent line of evidence for studying the social aspects of past societies, such as gender-differentiation or inter-communal relationships. While potential misapplications are indeed possible, such as conflating ancestry and cultural identity, or overlooking archaeological context (e.g. Brück, Reference Brück2021; Ensor Reference Ensor2021b; Furholt, Reference Furholt2018, Reference Furholt2021; Frieman & Hofmann, Reference Frieman and Hofmann2019; Hofmann et al., Reference Hofmann, Hanscam, Furholt, Bača, Reiter, Vanzetti, Kotsakis, Petersson, Niklasson, Hølleland and Frieman2021), in some cases it has refined archaeological interpretations (e.g. Hedenstierna-Jonson et al., Reference Hedenstierna-Jonson, Kjellström, Zachrisson, Krzewińska, Sobrado, Price, Günther, Jakobsson, Götherström and Storå2017). Integration of genetic data into interpretations based on archaeological evidence can complement our understanding of social dynamics in past societies (e.g. Bretos Ezcurra et al., Reference Bretos Ezcurra, Rohrlach, Papac, Royo Guillén, Barquera, Gómez Lecumberri, Laborda Lorente, Risch, Krause, Picazo Millán, Haak and Villalba-Mouco2025; Fontani et al., Reference Fontani, Larocca, Cilli, Iacovera, Andrews, Latorre, Arena, Veneziano, Calcagnile, Quarta, Ringbauer, Stockhammer, Krause, Luiselli and Mittnik2025; Haas et al., Reference Haas, Watson, Buonasera, Southon, Chen, Noe, Smith, Viviano Llave, Eerkens and Parker2020; Koptekin et al., Reference Koptekin, Aydoğan, Karamurat, Altınışık, Vural, Kazancı, Doğu, Kaptan, Gemici, Yüncü, Moots, Umurtak, Duru, Fidan, Çevik, Erdoğu, Korkut, Knüsel, Haddow and Somel2025; Sjögren et al., Reference Sjögren, Olalde, Carver, Allentoft, Knowles, Kroonen, Pike, Schröter, Brown, Brown, Harrison, Bertemes, Reich, Kristiansen and Heyd2020; Villalba-Mouco et al., Reference Villalba-Mouco, Oliart, Rihuete-Herrada, Childebayeva, Rohrlach, Fregeiro, Celdrán Beltrán, Velasco-Felipe, Aron, Himmel, Freund, Alt, Salazar-García, García Atiénzar, de Miguel Ibáñez, Hernández Pérez, Barciela, Romero, Ponce and Haak2021, Reference Villalba-Mouco, Oliart, Rihuete-Herrada, Childebayeva, Rohrlach, Fregeiro, Celdrán Beltrán, Velasco-Felipe, Aron, Himmel, Freund, Alt, Salazar-García, García Atiénzar, de Miguel Ibáñez, Hernández Pérez, Barciela, Romero, Ponce and Haak2021).
Post-marital residence patterns are an important aspect of social organisation that has recently gained a lot of attention. The fields that study the human past (archaeology and anthropology), following terminology consensus drawn from ethnology and sociology, commonly categorise the social structure of past societies according to the residence patterns of couples after marital union (Murdock, Reference Murdock1967). The most commonly observed patterns include those in which one of the partners relocates, while the other stays in their parental community. Within this system, societies are distinguished into patrilocal or matrilocal, according to the sex of the partner who relocates. In a patrilocal society, the male partner stays in his familiar community, and the female partner moves, while in a matrilocal society, the female remains with her community and the male partner relocates to where she resides (Murdock, Reference Murdock1967). These two patterns account for the vast majority (∼85%) of what we observe in present-day societies (Fig. 1). In those that recognise two genders and perform marital unions between them, patrilocality is most common (∼65%). On the contrary, matrilocality is rather rare in the ethnographic record (∼20%) (Surowiec et al., Reference Surowiec, Snyder and Creanza2019). In addition to these more common binaries (patrilocal vs matrilocal), present-day societies organise around a variety of residence patterns. These include, among others, bilocality (the couple chooses their place of residence in an equal manner), neolocality (a new place of residence is established, separate from both families), avunculocality (the couple relocates to where the husband’s uncle is), or natalocality (partners remain in their familiar houses and live apart). Also, residence might change throughout one’s life, especially for multiple partner couples (Hrnčíř et al., Reference Hrnčíř, Vondrovský and Květina2020; Murdock, Reference Murdock1967). Although recognising the full spectrum of these patterns in past societies is very challenging, they remain as a possibility when interpreting aspects of social organisation (Bickle et al., Reference Bickle, Hofmann, Souvatzi, Cintas-Peña, Rebay-Salisbury, Schauer, Khalil, Shaw and Vleet2025).
Global distribution of present-day societies that report patrilocal (green circles), matrilocal (purple triangles), ambilocal, avuncular, and neolocal (white, yellow, and orange squares, respectively) post-marital residence patterns. Data obtained from the D-place database (Kirby et al., Reference Kirby, Gray, Greenhill, Jordan, Gomes-Ng, Bibiko, Blasi, Botero, Bowern, Ember, Leehr, Low, McCarter, Divale and Gavin2016), using the variable ID EA012 and specifically data from Murdock et al. (1999) ‘Ethnographic Atlas’. In addition, the location of the three sites reporting on ancient DNA data discussed in this paper is shown with stars.
Post-marital residence patterns are closely linked to rules of descent and lineage in present-day societies. For example, in patrilocal societies, we mostly encounter patrilineal descent practices, meaning that all children from a marriage will be affiliated with the father’s family group (from which the mother is most often excluded). Meanwhile, in matrilocal societies, a matrilineal descent indicates kin association of the children with the mother’s family group (Ember et al., Reference Ember, Droe, Russell and Ember2022). However, this association is not absolute, and exceptions do occur. Identifying such patterns of descent in past societies is highly challenging, given the lack of definitive evidence and the contemporary interpretive biases in reconstructing past kinship structures. In genetic studies of the past, the terms matrilineality/patrilineality are almost exclusively used to describe biological connections through maternal or paternal lineages, without making inferences about social descent practices. However, this distinction is not always made clear in genetic studies, often causing confusion over terminology, especially when communicating across disciplines (see Bickle et al., Reference Bickle, Hofmann, Souvatzi, Cintas-Peña, Rebay-Salisbury, Schauer, Khalil, Shaw and Vleet2025; Brück, Reference Brück2021). Similarly, a direct link between residence patterns and sociopolitical systems is often assumed. Sociocultural anthropology has utilised a variety of terms to describe gender relationships, terms that have been – mistakenly – used interchangeably in archaeology, without highlighting their differences. To this end, we need to underline that, for example, a matriarchal society is a society in which women have more agency in communal decision-making and political power; in contrast, matrilocality refers strictly to post-marital residence patterns (Cveček, Reference Cveček2023).
To date, researchers have identified mostly patrilocal societies based on female exogamy (e.g. Bentley et al., Reference Bentley, Bickle, Fibiger, Nowell, Dale, Hedges, Hamilton, Wahl, Francken, Grupe, Lenneis, Teschler-Nicola, Arbogast, Hofmann and Whittle2012; Bickle, Reference Bickle2020; Morell-Rovira et al., Reference Morell-Rovira, Tvrdý, Díaz-Zorita Bonilla, Bickle, Tóth, Přichystal, Bedáňová and Masclans2024). However, these patterns need to be situated within the wider social and political contexts that influenced archaeological narratives. The foundation of archaeology – like many other disciplines – was shaped by the prevailing power structures at the time, and the social norms of its practitioners, primarily men from the Global North (see Johnson, Reference Johnson2019). Interpretive frameworks long presented as objective and neutral often treated patrilocal/patriarchal/patrilineal communities as the default. In these frameworks, evidence towards alternative social structures was either ignored, downplayed, misinterpreted, or seen as ‘exotic’ and required elaborate explanations for credibility (Coltofean-Arizancu & Matić, Reference Coltofean-Arizancu, Matić and Gaydarska2021; Johnson, Reference Johnson2019; Moen & Pedersen, Reference Moen and Pedersen2024). In this perspective article, we explore three cases of matrilocality and genetic matriline connections identified with aDNA in past societies. It is an attempt to explore past social organisation in light of new evidence and discuss its contribution to the way we perceive our past.
How to infer residence patterns from ancient DNA data
In recent years, aDNA data have provided a novel means to study social organisation in past communities (Nägele et al., Reference Nägele, Rivollat, Yu and Wang2022). These methods rely in part on the analysis of uniparentally inherited markers; mitochondrial DNA (mtDNA) and Y chromosome (chrY). mtDNA is inherited from mothers to all of their biological children, while chrY is passed from fathers to sons. In a patrilocal community, males remain local, and females move to the community from elsewhere, introducing new mtDNA that is passed on to their children. This increases mtDNA diversity; therefore, we expect the mtDNA diversity to be higher than the chrY diversity. Likewise in a matrilocal community, since females remain local, we expect continuity in the mtDNA lineages and higher diversity in chrY, as there is an influx of non-local males (Fig. 2). When tracing patterns of genetic descent for these two markers, matriline/patriline genetic connections (mtDNA or chrY lineages) are observed in cases where a single mitochondrial or chrY haplotype is continuously present within a household. In this text, we use the terms matrilineal and patrilineal connections to refer only to genetic descent structures.
An example of how the mtDNA and chrY diversities contrast within a matrilocal and a patrilocal group of individuals. For the matrilocal example, in the pedigree on the upper panel, the mitochondrial haplotype of the oldest female individual is shown in green. The maternal lineage continues from the oldest female individual to the youngest (green line), since the females reside within the same group across the generations. In contrast, the male descendant of the oldest male individual leaves the group (orange arrow), resulting in the end of the paternal chrY line in the group. In the two consecutive generations, there is male influx from a different external group (red and blue arrows). In a case where we would have individuals’ mtDNA and chrY sequences in this group, we would have seen the same mtDNA haplotype in every individual – which reflects low diversity. However, the chrY haplotypes would have shown the opposite signal – high diversity. The difference we would have observed between the two markers is shown in the right panel. The opposite pattern – where the chrY pool has low diversity and the mtDNA pool shows high diversity – is shown for the patrilocal example.
However, since mtDNA and chrY only capture information on the maternal and paternal lineages, multiple individuals can share the same mtDNA and/or chrY. Therefore, sharing a uniparentally inherited marker is not sufficient to estimate genetic relatedness between individuals. Additionally, the extent of genetic relatedness within a community can inform aspects of social organisation. In order to infer broader connections, such as genetic relatedness networks, the whole set of information from both parents, i.e. autosomal data, is required. Lately, the increase in aDNA data generation and the rise of large-scale genetic projects have allowed for the so-called ‘whole cemetery analyses’ (e.g. Rivollat et al., Reference Rivollat, Rohrlach, Ringbauer, Childebayeva, Mendisco, Barquera, Szolek, Le Roy, Colleran, Tuke, Aron, Pemonge, Späth, Télouk, Rey, Goude, Balter, Krause, Rottier and Haak2023; J. Wang et al., Reference Wang, Yan, Li, Zan, Zhao, Zhao, Chen, Wang, Ji, Zhang, Yang, Zhang, Qiao, Guo, Rao, Zhang, Wang, Ran, Duan and Ning2025), facilitating comprehensive identification of biological relations among the buried individuals. In this sense, elevated rates of genetic relatedness among the male individuals, in comparison to the cemetery-wide average, would indicate that males remain local and therefore have more relatives buried in the same cemetery and/or in close proximity, which is consistent with patrilocality. The opposite pattern – high genetic relatedness among females within a given cemetery – would suggest matrilocality, where females do not relocate and are buried in their ‘local’ residence.
A large number of aDNA studies have reported on patrilocal societies (e.g. Blöcher et al., Reference Blöcher, Brami, Feinauer, Stolarczyk, Diekmann, Vetterdietz, Karapetian, Winkelbach, Kokot, Vallini, Stobbe, Haak, Papageorgopoulou, Krause, Sharapova and Burger2023; Chyleński et al., Reference Chyleński, Makarowicz, Juras, Krzewińska, Pospieszny, Ehler, Breszka, Górski, Taras, Szczepanek, Polańska, Włodarczak, Lasota-Kuś, Wójcik, Romaniszyn, Szmyt, Kośko, Ignaczak, Sadowski and Malmström2023; Dulias et al., Reference Dulias, Foody, Justeau, Silva, Martiniano, Oteo-García, Fichera, Rodrigues, Gandini, Meynert, Donnelly, Aitman, Chamberlain, Lelong, Kozikowski, Powlesland, Waddington, Mattiangeli and Richards2022; Gnecchi-Ruscone et al., Reference Gnecchi-Ruscone, Rácz, Samu, Szeniczey, Faragó, Knipper, Friedrich, Zlámalová, Traverso, Liccardo, Wabnitz, Popli, Wang, Radzeviciute, Gulyás, Koncz, Balogh, Lezsák, Mácsai and Hofmanová2024; Marlowe, Reference Marlowe2005; Mittnik et al., Reference Mittnik, Massy, Knipper, Wittenborn, Friedrich, Pfrengle, Burri, Carlichi-Witjes, Deeg, Furtwängler, Harbeck, von Heyking, Kociumaka, Kucukkalipci, Lindauer, Metz, Staskiewicz, Thiel, Wahl and Krause2019; Moore et al., Reference Moore, Wilson, Challanain, McCormick, Marshall, Dulias, Foody, Justeau, Pala, Richards and Edwards2022; Rivollat et al., Reference Rivollat, Rohrlach, Ringbauer, Childebayeva, Mendisco, Barquera, Szolek, Le Roy, Colleran, Tuke, Aron, Pemonge, Späth, Télouk, Rey, Goude, Balter, Krause, Rottier and Haak2023; for some reviews on the topic, see Bickle & Hofmann, Reference Bickle and Hofmann2022; Bickle et al., Reference Bickle, Hofmann, Souvatzi, Cintas-Peña, Rebay-Salisbury, Schauer, Khalil, Shaw and Vleet2025; Guyon et al., Reference Guyon, Heyer and Chaix2025; Hrnčíř et al., Reference Hrnčíř, Vondrovský and Květina2020). However, during the last year, three research studies have been published from different parts of the world and from different time periods, reporting on evidence for past matrilocal societies and/or genetic matriline connections (Cassidy et al., Reference Cassidy, Russell, Smith, Delbarre, Cheetham, Manley, Mattiangeli, Breslin, Jackson, McCann, Little, O’Connor, Heaslip, Lawson, Endicott and Bradley2025; J. Wang et al., Reference Wang, Yan, Li, Zan, Zhao, Zhao, Chen, Wang, Ji, Zhang, Yang, Zhang, Qiao, Guo, Rao, Zhang, Wang, Ran, Duan and Ning2025; Yüncü et al., Reference Yüncü, Doğu, Kaptan, Kılıç, Mazzucato, Güler, Eker, Katırcıoğlu, Chyleński, Vural, Sağlıcan, Atağ, Bozkurt, Pearson, Sevkar, Altınışık, Milella, Karamurat, Aktürk and Somel2025).
Durotriges tribe
The first study discusses the British Celts who lived around 2,000 BP. The Celtic society has the earliest record of female rulers, indicating the possibility for women to reach the highest political status (Allason-Jones, Reference Allason-Jones2012). According to historical evidence, women in the Celtic society could inherit property and participate in and lead warfare actions. They are also reported to have practised polyandry (having more than one husband) and even divorced husbands, if wanted (Julius Caesar – De Bello Gallico; Allason-Jones, Reference Allason-Jones2012). In this case, as well, even though archaeology and material culture have provided evidence of a higher female status in Celtic societies, it is not possible to reconstruct societal structures in their entirety (Pope, Reference Pope2022). Historical records are themselves not a completely accurate source, as they are always subject to writers’ biases (e.g. Caesar – De Bello Gallico; Tacitus – Germania).
The study by Cassidy et al. (Reference Cassidy, Russell, Smith, Delbarre, Cheetham, Manley, Mattiangeli, Breslin, Jackson, McCann, Little, O’Connor, Heaslip, Lawson, Endicott and Bradley2025) focuses on the Durotriges tribe, who occupied the central southern English coast from 2,100 to 1,800 BP. Analysing their graves and the associated grave goods, it was inferred that in the Durotriges tribe, women had a higher status, as female burials were associated with more prestige items (Russell et al., Reference Russell, Smith, Cheetham, Evans and Manley2019).
Analysing aDNA data from the cemetery, researchers found that the majority of the interred individuals were genetically related. More than two-thirds of the studied individuals shared the same mtDNA haplotype, resulting in low mtDNA diversity. These results indicated an association of the specific mtDNA lineage, one that was maintained across multiple generations, with the archaeological site in which the remains were found, implying genetic matrilineality. In contrast, chrY diversity was much higher. Integrating the connections from autosomal DNA, the paper reports a higher rate of relatedness among female individuals across generations, with males having a much higher percentage among non-related individuals. These patterns point to a society of matrilineal genetic descent structure and an extensively male-biased movement.
Combining these results with other contemporary archaeological sites from Britain, researchers suggest that matrilocality appears to be widespread, with more communities being characterised by low mtDNA diversity. This contrasts evidence from previous time periods – Bronze Age (∼3,000 BP) – when mostly patrilocality has been recognised (Booth et al., Reference Booth, Brück, Brace and Barnes2021), suggesting matrilocality might have become more common with the passage of time, or that patrilocal and matrilocal societies co-existed. Similar patterns have also been reported for Celtic societies outside Britain. In a study from southern Germany, strontium isotope analyses present no differentiation based on biological sex (Gretzinger et al., Reference Gretzinger, Schmitt, Mötsch, Carlhoff, Lamnidis, Huang, Ringbauer, Knipper, Francken, Mandt, Hansen, Freund, Posth, Rathmann, Harvati, Wieland, Granehäll, Maixner, Zink and Schiffels2024), in contrast to evidence from other contemporary settings (e.g. Knipper et al., Reference Knipper, Mittnik, Massy, Kociumaka, Kucukkalipci, Maus, Wittenborn, Metz, Staskiewicz, Krause and Stockhammer2017; Mittnik et al., Reference Mittnik, Massy, Knipper, Wittenborn, Friedrich, Pfrengle, Burri, Carlichi-Witjes, Deeg, Furtwängler, Harbeck, von Heyking, Kociumaka, Kucukkalipci, Lindauer, Metz, Staskiewicz, Thiel, Wahl and Krause2019; Sjögren et al., Reference Sjögren, Olalde, Carver, Allentoft, Knowles, Kroonen, Pike, Schröter, Brown, Brown, Harrison, Bertemes, Reich, Kristiansen and Heyd2020).
Fujia
The second study (J. Wang et al., Reference Wang, Yan, Li, Zan, Zhao, Zhao, Chen, Wang, Ji, Zhang, Yang, Zhang, Qiao, Guo, Rao, Zhang, Wang, Ran, Duan and Ning2025) reports on a community from East Neolithic China, Fujia (4,700–4,500 BP), where genetic connections were mainly traced through the maternal line. Researchers analysed two cemeteries associated with the settlement of Fujia. These consist of both primary and secondary burials, with an assemblage exceeding 500 individuals, and a burial span of around 250 years (∼10 generations). Osteological analysis revealed no sex or age-at-death bias in the burial position or the associated mortuary practices. Isotopic analyses, to the limits of its resolution, recognised the community as ‘geographically constricted’, with no evidence of long-distance exogamy. This is in contrast to other contemporaneous groups in China that point to high population density and a hypothesised network of elite exchanges across regions (J. Wang et al., Reference Wang, Yan, Li, Zan, Zhao, Zhao, Chen, Wang, Ji, Zhang, Yang, Zhang, Qiao, Guo, Rao, Zhang, Wang, Ran, Duan and Ning2025).
In these two Fujia cemeteries, two distinct mtDNA haplogroups were identified. Interestingly, those buried in the same cemetery shared identical mitochondrial sequences, regardless of biological sex, indicating two shared maternal lineages. On the contrary, the chrY variation in both cemeteries was found to be higher than the mitochondrial one. Looking into the patterns of autosomal genetic similarity, researchers found higher degrees of relatedness within the cemeteries than between them, concluding that the individuals were buried first and foremost according to their maternal line. Given the longevity of the site’s occupation, the limited mitochondrial and the significantly higher chrY diversity, it seems that the two cemeteries were being used by matrilineal ‘close-kin’ groups.
Both osteoarchaeological and genetic data confirmed that male individuals were buried together with females of the same matriline, contrasting what is commonly observed in patrilineal cemeteries in which females are buried together with their male partners (e.g. Gnecchi-Ruscone et al., Reference Gnecchi-Ruscone, Rácz, Samu, Szeniczey, Faragó, Knipper, Friedrich, Zlámalová, Traverso, Liccardo, Wabnitz, Popli, Wang, Radzeviciute, Gulyás, Koncz, Balogh, Lezsák, Mácsai and Hofmanová2024). According to the authors, as Fujia shares archaeological characteristics with numerous contemporaneous sites in the region, this social structure associated with matrilineal organisation can potentially be a broader regional pattern rather than a unique isolated case.
Çatalhöyük
Tracing further back in time, new findings from an ∼9,000-year-old site in south-central Anatolia – Çatalhöyük – hint at the absence of patrilocal residence patterns (Yüncü et al., Reference Yüncü, Doğu, Kaptan, Kılıç, Mazzucato, Güler, Eker, Katırcıoğlu, Chyleński, Vural, Sağlıcan, Atağ, Bozkurt, Pearson, Sevkar, Altınışık, Milella, Karamurat, Aktürk and Somel2025). Çatalhöyük is a well-known Neolithic settlement owing to an extensive excavation history dating back to 1961, with continuous occupation for one thousand years, distinctive house structures, wall paintings, female figurines, and funerary practices.
One important feature of these funerary practices is that burials are placed inside the houses. This presents a unique opportunity to investigate genetic relatedness networks within and between households and can offer insights into potentially gender-based familial organisations. In the study, an investigation of multi-generational pedigrees showed that the co-buried individuals from the same houses had matrilineal genetic connections. The homogeneity of mtDNA within buildings was higher than the homogeneity between buildings, implying in-house connections through the female line. Conversely, the chrY homogeneity was comparable within and between buildings. The authors observe these patterns across all main periods of occupation (9,050–8,250 BP). Together, these findings point to female-centred practices within the site, with a likely matrilocal residence among the households. We note that this intra-house pattern is independent of the sex-biased mobility on the community level.
On the community level, when combining all households as a whole, the analysis of uniparental markers revealed comparable levels of mtDNA and chrY diversity, compatible with bilocality, i.e. no elevation in mtDNA diversity, which would be the case if the community was patrilocal. The authors argue that the absence of genetic and archaeological evidence for patrilocality in Çatalhöyük, which is similarly lacking in the few studies of other Neolithic settlements in Anatolia (Altınışık et al., Reference Altınışık, Kazancı, Aydoğan, Gemici, Erdal, Sarıaltun, Vural, Koptekin, Gürün, Sağlıcan, Fernandes, Çakan, Koruyucu, Lagerholm, Karamurat, Özkan, Kılınç, Sevkar, Sürer and Somel2022; Pearson et al., Reference Pearson, Evans, Lamb, Baird, Hodder, Marciniak, Larsen, Knüsel, Haddow, Pilloud, Bogaard, Fairbairn, Plug, Mazzucato, Mustafaoğlu, Feldman, Somel and Fernández-Domínguez2023; Yaka et al., Reference Yaka, Mapelli, Kaptan, Doğu, Chyleński, Erdal, Koptekin, Vural, Bayliss, Mazzucato, Fer, Çokoğlu, Lagerholm, Krzewińska, Karamurat, Gemici, Sevkar, Dağtaş, Kılınç and Somel2021), can suggest a bilateral residence, meaning gender-independent residence patterns. As such, with the current state of knowledge about the time period, existing evidence contrasts with the male-centred social structures observed in Neolithic Europe.
A separate study of the material culture at Çatalhöyük – for example, architectural features, technological elements, and burial practices – together with the genetic data, has provided additional insights into the social organisation in Çatalhöyük (Mazzucato et al., Reference Mazzucato, Coscia, Küçükakdağ Doğu, Haddow, Kılıç, Yüncü and Somel2025). Material culture similarity across the households correlated with genetic relatedness among individuals buried within them, with spatially concentrated patterns that change through time (Mazzucato et al., Reference Mazzucato, Coscia, Küçükakdağ Doğu, Haddow, Kılıç, Yüncü and Somel2025). Taken together with the genetic results on residence patterns, they show that residence and kinship in Çatalhöyük cannot be reduced to normative models, but rather were fluid and embedded in complex networks of interactions.
Discussion
Ancient DNA studies have contributed to the investigation of residence patterns by providing independent lines of evidence on mobility, descent, and relatedness. Within these aDNA studies that focus on past social organisation, the cases from Anatolia, Britain, and China are among the first to identify genetic patterns related to matrilocality. In Neolithic Anatolia, researchers report on intra-house female relationships that extend through generations, with bilocal residence possible on the community level. In Iron Age Britain, a matrilocal organisation of Celtic societies appears to be more likely, complemented by reports of women holding more political and social privileges. The Fujia site in Neolithic China is reported to have been organised according to genetic matrilineal structures, although this burial system – based on shared maternal descent – can be compatible with multiple residence structures, including matrilocal or avunculocal. In this context, the authors suggest that matrilineality was more common in the past than believed so far, despite being very rare in present-day China.
Yet, genetic connections through the maternal line can entail a wide range of social and political organisational systems. In several present-day matrilocal societies, political power and influence have been reported to be maintained by males (dependent on their position on the matriline), while aspects like higher status, children’s upbringing, property, and descent are passed down from mothers to daughters (Stege & Huffer, Reference Stege and Huffer2008). In general, the benefits that women have in matrilocal societies have been noted to be relatively higher (Lowes, Reference Lowes2020; Whyte, Reference Whyte2015). This pattern is often associated with female community ties, which are maintained through the generations, as women are not moving into groups where they have no kinship affinities, and can provide guidance and security after marriage (Leonetti et al., Reference Leonetti, Nath and Hemam2007). As such, networks are important for social standing, they are often also associated with marital autonomy e.g. the choice and the number of spouses (reported for the Ashanti in Ghana; Witte, Reference Witte2001), the option to leave a marriage, as well as regarding premarital pregnancy (Nongbri, Reference Nongbri2010) or adultery (Stege & Huffer, Reference Stege and Huffer2008). Even though it is very difficult to make such status-wise inferences for past communities based on archaeological and/or aDNA data, they show how residence patterns are embedded within broader social aspects.
Despite the emerging body of research (ethnological, anthropological, and archaeological) pointing to diverse social organisation forms, archaeological interpretations have identified the vast majority of past societies as patrilocal. The uneven, Eurocentric concentration of research, originating primarily from Western Europe, also contributes to shaping falsely generalised universal expectations. At the same time, even within Europe and based on critical reassessment of archaeological and biomolecular data, there is growing evidence and debate on much greater variability than claimed by the entrenched narratives that reduce all to patrilocality/patriarchy/patrilineality (Bickle et al., Reference Bickle, Hofmann, Souvatzi, Cintas-Peña, Rebay-Salisbury, Schauer, Khalil, Shaw and Vleet2025; Ensor Reference Ensor2021a; Guyon et al., Reference Guyon, Heyer and Chaix2025; Hrnčíř et al., Reference Hrnčíř, Vondrovský and Květina2020). Within the confines of these narratives, in the rare cases when matrilocality was inferred (see, for example, Çatalhöyük and the discussions about the ‘Seated Woman’ [Gimbutas, Reference Gimbutas2001]), they were encountered with scepticism (in the best case) and usually with heavy criticism (see Meskell, Reference Meskell1995). This possibility of matrilocality, when not outright dismissed, had to be restricted to several constraints (e.g. only in hunter-gatherer societies, vanishing with the advent of neolithisation and large-scale societies, or only when men were absent from war). The systemic framing of female-focused societies as outliers, exceptions that need special justifications, is reflected in what has been termed by researchers as the ‘matrilineal puzzle’ (Stone & King, Reference Stone and King2018), and has severely impeded interpretations pointing in that direction. Discussions that challenge constraints like these on the topic of addressing bias in archaeological interpretations (e.g. Bickle et al., Reference Bickle, Hofmann, Souvatzi, Cintas-Peña, Rebay-Salisbury, Schauer, Khalil, Shaw and Vleet2025; Coltofean-Arizancu & Matić, Reference Coltofean-Arizancu, Matić and Gaydarska2021; Frieman et al., Reference Frieman, Teather and Morgan2019; Moen & Pedersen, Reference Moen and Pedersen2024) attempt to put forward alternative ideas regarding past human societies, and have recently been complemented by the advancement of molecular anthropology, including aDNA.
Taken together, this leads us to consider that past societies could have been many things: patrilocal, matrilocal, bilocal, avunculocal, neolocal, or with couples moving residence throughout their lives, with multiple locally shaped patterns possibly coexisting across regions and time periods (Bickle et al., Reference Bickle, Hofmann, Souvatzi, Cintas-Peña, Rebay-Salisbury, Schauer, Khalil, Shaw and Vleet2025; Cveček, Reference Cveček2023; Hrnčíř et al., Reference Hrnčíř, Vondrovský and Květina2020). Ancient DNA studies that report on past residence patterns have focused largely on patrilocality versus matrilocality, as these are the most straightforward to infer from genetic data. When genetic data does not show evidence towards either end of this spectrum, residence patterns are often not discussed at all, limiting the consideration of alternative structures (Armit et al., Reference Armit, Fischer, Koon, Nicholls, Olalde, Rohland, Buckberry, Montgomery, Mason, Črešnar, Büster and Reich2023; Hrnčíř et al., Reference Hrnčíř, Vondrovský and Květina2020). Various circumstances, including environmental, cultural, and economic phenomena, as well as the agency to actively influence social structures, can lead a society to adopt one or another way of organisation, a shift that in turn can change repeatedly in time. The more information we gather about the human past – especially through shared frameworks across disciplines – the more power we have to debunk preconceptions about social organisation, particularly those that speak for exclusive male dominance throughout human history, and hence reveal more cases of alternative social structures previously deemed ‘exotic’.
Finally, while aDNA analyses are contributing to the investigation of the human past like never before, it is important to consider that, like every investigative tool, they are subject to biases, both by the researchers and by the public that is interested in learning about their conclusions (Benjamin, Reference Benjamin2015; Ion, Reference Ion2017). Therefore, we do not present these forms of findings as indisputable, but rather as another basis for challenging the immutability of – patriarchal – social structures.
Acknowledgements
We are grateful to Hannah Marie Moots, Arev Pelin Sümer, Sabina Cveček, Benjamin Vernot, Kathrin Nägele, Eleftheria Orfanou, and Mehmet Somel for helpful comments and valuable discussions.
Author contributions
ES and GA conceived and wrote the article.
Financial support
The authors were supported by the Max Planck Society.
Competing interests
Authors declare no conflicts of interest.
Research transparency and reproducibility interest
No new data are presented.
Data availability statement
NA.