


1. Introduction
Many important economic and politically relevant decisions are made by groups, such as boards of directors, supervisory boards, parliaments, and other political bodies, as well as smaller-scale working groups and teams. Increasing gender diversity in these decision-making bodies, which are often male-dominated, has been a key political goal. To achieve this, measures such as gender quotas and mentorship programs (Flory et al., Reference Flory, Leibbrandt, Rott and Stoddard2021; Kofoed, Reference Kofoed2019) have been implemented with varying success.
The focus on gender diversity has spurred a growing body of research examining its impact on decision-making. Research in policymaking yields mixed results, ranging from no impact of quotas (Bagues & Campa, Reference Bagues and Campa2021; Ferreira & Gyourko, Reference Ferreira and Gyourko2014) to improved qualifications of politicians (Baltrunaite et al., Reference Baltrunaite, Bello, Casarico and Profeta2014) and the adoption of more egalitarian policies (Ranehill & Weber, Reference Ranehill and Weber2022). Studies of corporate boards similarly provide mixed evidence regarding the impact of quotas on firm performance and valuation (Ahern & Dittmar, Reference Ahern and Dittmar2012; Eckbo et al., Reference Eckbo, Nygaard and Thorburn2016; Johansen & Sandnes, Reference Johansen and Sandnes2008; Matsa & Miller, Reference Matsa and Miller2013; Nygaard, Reference Nygaard2011). However, research on gender-diverse management teams finds some evidence for better performance of more diverse teams (Adams & Ragunathan, Reference Adams and Ragunathan2015; Apesteguia et al., Reference Apesteguia, Azmat and Iriberri2012; Bansak et al., Reference Bansak, Graham and Zebedee2011; Cueva & Rustichini, Reference Cueva and Rustichini2015; Hoogendoorn et al., Reference Hoogendoorn, Oosterbeek and van Praag2013).
This paper focuses on risk-taking, a crucial aspect of many economic and political decisions. Risk-taking is, for instance, important for firm performance (e.g., Gilley et al., Reference Gilley, Walters and Olson2002; Walls & Dyer, Reference Walls and Dyer1996), and there are compelling reasons to believe that gender composition significantly affects group decisions under risk. Literature indicates that women and men differ in economic preferences (see Croson & Gneezy, Reference Croson and Gneezy2009, for an overview). There exists abundant evidence that women are more risk-averse than men in financial risk-taking and many other domains (Byrnes et al., Reference Byrnes, Miller and Schafer1999; Croson & Gneezy, Reference Croson and Gneezy2009), though the extent and economic relevance of this gender difference remain debated (Filippin & Crosetto, Reference Filippin and Crosetto2016). However, group decisions do not always reflect the individual preferences of group members.
A crucial yet underexplored question is how men and women change their decisions in a group setting and how gender diversity influences these shifts. This paper investigates how the level of risk-taking within a group is influenced by its gender composition and how this composition affects the shift from individual to group decisions. Our study contributes to the literature on choice shifts in group decision-making by examining how choice shifts are affected by gender composition. Understanding the impact of gender composition on group decision-making under risk has important implications for policymakers and organizations aiming to increase gender diversity and improve decision-making outcomes.
The difference between individual and group risk-taking has been extensively debated in social psychology, dating back to Stoner’s (Reference Stoner1961) seminal work, and has recently gained attention in the economics literature. A common pattern is the polarization of group decisions, where groups, on average, tend to take more risks than individuals, a phenomenon known as the “risky shift.” Early evidence on risky shifts was based on studies employing choice dilemma questionnaires. Recently, several studies analyzed group decisions under risk with monetarily incentivized experiments, producing mixed results. Some studies find evidence of risky shifts (Nieboer, Reference Nieboer2015; Sutter, Reference Sutter2009), while others report cautious shifts, where groups take less risk than individuals (Baker et al., Reference Baker, Laury and Williams2008; Masclet et al., Reference Masclet, Colombier, Denant-Boemont and Lohéac2009; Shupp & Williams, Reference Shupp and Williams2008), or observe no systematic differences (Harrison et al., Reference Harrison, Lau, Rutström and Tarazona-Gómez2013). Several reasons for these choice shifts have been proposed, including the conformity hypothesis (Cialdini & Goldstein, Reference Cialdini and Goldstein2004; Jagau & Offerman, Reference Jagau and Offerman2018), the diffusion of responsibility (Eliaz et al., Reference Eliaz, Ray and Razin2006; Wallach et al., Reference Wallach, Kogan and Bem1962, Reference Wallach, Kogan and Bem1964), and the risk-as-value hypothesis (Bauer & Turner, Reference Bauer and Turner1974; Vidmar, Reference Vidmar1970).Footnote 1
Evidence that gender plays a significant role in group decisions under risk is provided by Nieboer (Reference Nieboer2015) and Bogan et al. (Reference Bogan, Just and Dev2013). Using an investment task and an investment portfolio management decision task, respectively, they find that gender is the only individual characteristic that significantly affects risk-taking in group settings. Moreover, they observe that the presence of men increases risk-taking, although the effect is not linear in the case of Bogan et al. (Reference Bogan, Just and Dev2013). We add to this literature by using a simple lottery choice experiment and a one-shot decision task, avoiding potential priming effects related to investment tasks that can impact risk attitudes (Eckel & Grossman, Reference Eckel and Grossman2008), as well as learning effects or changes in group decision-making over multiple rounds. In contrast to previous studies that rely on between-subject comparisons, we use a within-subject design to directly compare individual and group decision-making under risk.
Despite the importance of understanding choice shifts in group decision-making, direct evidence of gender’s role remains limited. Our study directly addresses this gap. Daly and Wilson (Reference Daly and Wilson2001) offer indirect evidence by comparing individual risky decisions made in private with those made in public, where subjects had to announce their individual choice in front of a group of peers. They found that men took significantly more risk in public than in private, whereas women showed no such difference. This indirect evidence suggests that male group members may take more risks and appear more risk tolerant in group settings, thereby enhancing the risky shift with a higher proportion of males in the group.
Further indirect evidence is provided by Ertac and Gurdal (Reference Ertac and Gurdal2012), who find that men are generally more willing to lead groups. Those men willing to lead also take more risks on the group’s behalf than those not willing to lead. For women, they find no differences. This evidence is underpinned by literature focusing on leadership. Recent studies confirm that women are less willing to lead, particularly when the leader’s gender is revealed to group members, with female leaders being most willing to lead in all-female groups (e.g., Grossman et al., Reference Grossman, Komai and Jensen2015; Li et al., Reference Li, Chaudhuri and Sbai2020). This result also holds in a simple risky environment where decisions involve how much of a fixed endowment to invest in a risky asset. When placed in groups of five, women are more likely to refuse to decide on their group’s behalf (Ertac & Gurdal, Reference Ertac and Gurdal2012).
Recent discussions suggest that these differences arise because, on average, men are more self-confident, more likely to run for elections, have more influence, and are ranked higher than equally performing women (e.g., Born et al., Reference Born, Ranehill and Sandberg2022; Chen & Houser, Reference Chen and Houser2019; Kanthak & Woon, Reference Kanthak and Woon2015).
In this paper, we analyze the impact of gender composition on group decisions under risk and choice shifts by using a simple lottery choice experiment with monetary incentives. Groups of three with varying gender compositions were formed, and their group choices were compared to the individual choices of the group members. We varied whether the group or the individual decision was made first, and all group decisions were made face-to-face.
Our results reveal several important findings. First, our results show a clear and significant impact of gender composition on group decision-making. Female-dominated groups take significantly less risk than male-dominated groups. Second, and crucially, we find that gender composition plays an important role in choice shifts. While female-dominated groups show no significant shifts, male-dominated groups exhibit substantial risky shifts, taking on average more risk than the average and median preferences of group members would imply. Finally, we discuss potential channels for these observed choice shifts, highlighting the influence of male presence in driving the shift toward riskier decisions.
The paper is structured as follows: Section 2 outlines the experimental design, Section 3 formalizes our gender-specific hypothesis more precisely, and Section 4 presents the results. The conclusion follows in Section 5.
2. Experimental design
2.1. Participants and procedure
The experiment, involving 492 participants, was conducted in the student canteen of the University of Kiel, Germany.Footnote 2 The gender ratio was balanced (51.53% women), and the average age was 23.24 (SD 4.95). Participants were recruited among the canteen’s customers to take part in an economic experiment, which was conducted in designated quiet areas of the canteen. Potential participants were told they would receive a €2 participation fee and could gain additional money by playing a lottery.
To discreetly control the group’s gender composition, recruiters used a systematic approach. Participants were approached individually and invited to participate without revealing the gender-based aspect of the grouping. As individuals agreed to participate, their gender was recorded, and recruiters tracked the required gender balance for each group composition (FFF, FFM, FMM, MMM).Footnote 3 To ensure that group members were unfamiliar with each other, participants were asked if they knew anyone present before groups were formed.
The recruiters then formed groups of three people, ensuring a mix of gender compositions according to the experimental design. This process allowed the researchers to control the gender composition of each group discreetly without making it apparent to the participants that gender was a factor in their grouping.Footnote 4 All other group characteristics were randomly allocated.Footnote 5 The sample size was determined based on previous studies using the incentivized Eckel and Grossman (Reference Eckel and Grossman2002) task. A meta-analysis by Filippin and Crosetto (Reference Filippin and Crosetto2016) reports that the average gender effect size for this task is equal to Cohen’s d = .55 on the individual level.Footnote 6 Overall, data from 41 purely female groups (further mentioned as FFF), 44 groups with two women and one man (FFM), 42 groups with 1 woman and 2 men (FMM), and 37 purely male groups (MMM) were collected; an overview is given in Table 1.
Gender composition of groups

Notes: The left side of the table displays the number of participating groups in the two treatments sorted by their gender composition. The right side of the table shows the number of women and men who participated in the experiment, sorted by the gender composition of their group.
A critical feature of experimental designs that analyze group polarization is the order in which individual and group choices are elicited. Most studies elicited individual preferences first, although some have reversed the order, each approach has its distinct advantages and drawbacks. When participants make multiple evaluations, earlier decisions can serve as an anchor, biasing subsequent choices (Ariely et al., Reference Ariely, Loewenstein and Prelec2003). As a result, anchoring tends to favor eliciting individual preferences first. Recent research, however, suggests that individual decisions are also heavily influenced by the social context, particularly gender composition. For instance, Castillo et al. (Reference Castillo, Leo and Petrie2015) let subjects make individual risk-taking decisions while sitting in a room with other people. Although the decisions are private and not revealed to other subjects, the gender composition in the room systematically impacts individual preferences. Consequently, in the case of group decisions, the gender composition of the group might also influence individual risk preferences. However, this effect is at least reduced if subjects anchor on the individual decision they made before in private, that is, without any influence of the social context.
Given the significant role of social context in decision-making, we implemented two experimental treatments to vary the order of the choices: one with the group decision first (GF) and the other with the individual decision first (IF). Consistent with previous literature on choice shifts, participants in the IF treatment were unaware of their group’s composition when making individual choices. We tested whether the order of decisions systematically affected the group and individual preferences and found no significant impacts on either group or individual decisions (see Section 4). This supports previous work by Harrison et al. (Reference Harrison, Lau, Rutström and Tarazona-Gómez2013), which found that the order of decisions does not influence individual risk preferences.
For both treatments, participants were approached as they were about to leave the canteen, minimizing the chance they could share information with others who had yet to participate. While we cannot entirely exclude this possibility of information exchange, the risk is inherent in consecutive sessions of lab experiments as well. Conducting the experiment in a natural canteen setting, rather than in a lab, allowed for a more realistic group context. Although the risk of information transmission was potentially greater in this environment, we think it did not bias our results. First, subjects were unaware that gender composition was central to the study and could, therefore, not transmit this information. Second, even if some information about the experiment was shared, this would have no systematic impact on the differences we observe related to group composition.
In the GF treatment, groups were formed at the beginning of the experiment, and it was explained to the participants that they had to make a risky decision as a group first, then had to fill out a questionnaire on their own, and in the end, had to reunite in their initial group to receive their payment. After the groups were formed, a card displaying six lottery options was provided to them (see Fig. 1). Participants were told that the group had to choose exactly one of these lotteries by consensus. There were no time constraints for discussion and reaching a consensus and no fallback option (no group took longer than five minutes to reach a consensus). When participants within a group agreed on a lottery, they stated their choice to the experimenter and were handed the questionnaires, which had to be filled out in private. The questionnaire included an individual risk preference task (which equaled the group task with all amounts divided by three), basic demographic questions (gender, age, highest educational degreeFootnote 7), happiness (self-reported happiness on a five-point Likert scale) and their level of satisfaction with the group choice on a five-point Likert scale. After completing the questionnaires, participants reunited in their groups for the payoff.
Lotteries for group decision-making

In the IF treatment, participants first had to decide on the individual risk preferences task in private, without being aware of the group composition they were allocated to in the sequel. We had four quiet places (each for one subject only) for these private decisions in different corners of the canteen, so subjects could not see that other subjects were also making a private decision simultaneously. After the group decided, subjects had to fill out the individual questionnaire again in private and finally reunited for the payoff.
The payoff mechanism was the same in both treatments and took place at the very end of the experiment. To determine the payoff, a coin was flipped twice. The first coin flip indicated whether the group or the individual lottery choice would be relevant for payment. The second coin flip determined the outcome – high or low payoff – according to the group or individual choice.
2.2. Methods
Risk preferences. A well-established task developed by Eckel and Grossman (Reference Eckel and Grossman2002) was used to elicit risk preferences. The task is distributed along a one-dimensional spectrum. The groups had to choose exactly one out of six lotteries depicted in Fig. 1 by consensus. The lotteries were represented with coins that had two colored sides indicating the size of a gain (in Euro) – orange (high gain) and pink (low gain). For all six lotteries, the chances to win the high or low gain were equal (50% probability).
The lotteries increased in risk and expected value starting from lottery 1 with a sure gain of €12 (or €4 for each group member) to lottery 5 with an expected value of €15 (€8 or €2 for each group member). Lottery 6 had the same expected value as lottery 5 but a higher risk (€9 or €1 for each group member) and allowed the detection of risk-loving attitudes. The lottery number chosen by the group will be referred to as group choice (GC) in the sequel. Generally, the higher the GC, the lower the given group’s degree of risk aversion. To control for individual risk preferences, the questionnaire included the same lottery task but with individual gains (i.e., group amount divided by three). Responses to this task will be termed individual choice (IC). Again, a higher number of IC indicates lower risk aversion. The group shift is given by GC – IC where GC – IC > (< 0) indicates a risky (cautious) shift.
3. Hypotheses
There is abundant evidence that women are more risk-averse than men in financial risk-taking (Charness & Gneezy, Reference Charness and Gneezy2012; Croson & Gneezy, Reference Croson and Gneezy2009), although the effects are sometimes small and task-specific (Filippin & Crosetto, Reference Filippin and Crosetto2016). For the task employed in the present paper, gender differences were consistently observed, such that we expect to see them also reflected in individual choices.
Hypothesis 1:
IC is higher for men than for women.
In the group setting, we did not provide specific instructions to subjects on how to reach a group decision, leading to two potential scenarios for how decisions might be made.
The first scenario assumes majority voting as the decision process. From the political economy literature, it is well-established that under certain conditions, in particular a one-dimensional spectrum and single-peaked preferences, the outcome of majority voting is determined by the median voter (Black, Reference Black1948). This has also been supported by experimental evidence (Ambrus et al., Reference Ambrus, Greiner and Pathak2015). Assuming that women are generally more risk-averse than men, the median voter in female-dominated groups (FFF and FFM) is more likely to be female, leading to more cautious group decisions. Conversely, in male-dominated groups (FMM and MMM), the median voter is likely to be male, resulting in riskier group decisions.
The second scenario considers the possibility of a leading group member influencing the group’s decision. Literature suggests that women are less willing to take on leadership roles, especially when the leader’s gender is revealed to group members (Grossmann et al., Reference Grossman, Komai and Jensen2015; Li et al., Reference Li, Chaudhuri and Sbai2020). Women are most willing to lead in all-female or female-majority groups (Born et al., Reference Born, Ranehill and Sandberg2022). Consequently, the leader is more likely to be male, as the number of male group members increases, which should, according to Hypothesis 1, result in higher risk-taking of the group also in this scenario.
Therefore, based on both scenarios, we hypothesize that:
Hypothesis 2:
GC increases with the number of male group members.
The primary focus of this paper is to compare individual and group choices. As mentioned, group decisions do not always reflect the individual preferences of group members, and several explanations exist for that behavior.
The conformity hypothesis states that individuals tend to align their preferences with those of the majority (Cialdini & Goldstein, Reference Cialdini and Goldstein2004; Jagau & Offerman, Reference Jagau and Offerman2018). This conformity can arise from two primary goals: (1) an accuracy goal, where individuals adjust their choices based on the belief that the majority is more likely to be correct, and (2) an affiliation goal, where individuals conform to the group to gain social approval and avoid negative judgment (Asch, Reference Asch1956; Brown, Reference Brown1965; Nordhøy, Reference Nordhøy1962; Stoner, Reference Stoner1968).
In a group setting, this could lead to shifts toward either more cautious or riskier decisions depending on the majority’s preferences. Based on Hypotheses 1 and 2, we predict that in male-dominated groups, these majority preferences would align with those of the male group members, leading to a risky shift. Conversely, in female-dominated groups, the majority will reflect the female members’ preferences, resulting in a cautious shift.
Another explanation for choice shifts is the diffusion of responsibility in the group context. When individuals make risky decisions, they bear the full responsibility for the outcome. However, in the group context, the perception of responsibility is diffused, and individuals may feel less accountable for the final decision.(Wallach et al., Reference Wallach, Kogan and Bem1962, Reference Wallach, Kogan and Bem1964). The reduced sense of responsibility can make individuals more willing to take risks in the group setting, leading to riskier group decisions and explaining the phenomenon of a risky shift.
While the diffusion of responsibility has been initially used to explain risky shifts, Eliaz et al. (Reference Eliaz, Ray and Razin2006) showed that the direction of choice shifts depends on the prevailing social norm within the group. If the social norm is cautious, the group is more likely to shift toward safer decisions; if the norm favors risk-taking, the group is more likely to shift to riskier choices. We hypothesize that the social norm in male-dominated groups is riskier than in female-dominated groups. Therefore, we expect a risky shift in male-dominated groups.
A related theory is the risk-as-value hypothesis, which suggests that (moderate) risk-taking is a socially approved trait (Bauer & Turner, Reference Bauer and Turner1974; Vidmar, Reference Vidmar1970). According to this hypothesis, individuals who perceive themselves as more risk-averse than others in the group may adjust their preferences to align more closely with the perceived cultural norm, which could lead to a general risky shift. However, previous studies with designs similar to ours have not observed a universal risky shift. Based on the literature that suggests that risk-taking is a cultural value more strongly associated with men (e.g., Daly & Wilson, Reference Daly and Wilson2001), we hypothesize that men particularly change their individual preferences toward higher risk-taking in group contexts, leading to a risky shift in group decision.
Combining these theories, we propose the following hypothesis:
Hypothesis 3:
GC – IC is higher in male- than in female-dominated groups
4. Results
4.1. Individual choice
The average individual choice IC is 3.48 (SD = 1.79). In line with Hypothesis 1, we find that men take more risk (M = 3.97, SD = 1.74) than women (3.02, SD = 1.72). This difference is statistically significant (Wilcoxon rank sum test: z = 5.884, p < .001).Footnote 8 There are no significant differences between the two treatments (GF and IF) in terms of IC (which holds for all subjects, for women only, and for men onlyFootnote 9).
4.2. Group choice
The average group choice is 3.58 (SD = 1.73). In the first step, we compare the average group decisions between male-dominated and female-dominated groups and between group types, as shown in Fig. 2.Footnote 10
Average group choices by group types

Figure 2 shows that group risk-taking generally increases with the number of male group members, supporting our second hypothesis.
Purely female groups (FFF) thereby have the lowest mean with 2.8 (SD = 1.57), while purely male groups (MMM) have the highest mean with 4.19 (SD = 1.52). A pairwise comparison of the means with a two-sample Wilcoxon rank sum test reveals a significant difference between purely male (MMM) and purely female groups (FFF) (z = −3.63, p < .001) and also between FMM and FFM (z = −2.51, p = .012). However, the differences between purely female and FFM groups and between purely male (MMM) and FMM groups are not statistically significant. In the following, we compare female-dominated (FFF and FFM) and male-dominated groups (FMM and MMM).
To gain further insight into group decision-making, we conducted ordered Probit regressions with the group choice as the dependent variable and male-dominated as the key independent variable (Table 2, Model 1). The coefficient for male-dominated groups is highly significant, confirming that these groups exhibit higher risk-taking than female-dominated groups. Importantly, this effect remains significant when controlling for the average and median of the group member’s individual choices (Models 2 and 3). This suggests that the higher risk-taking in male-dominated groups cannot be fully explained by the individual choices of group members (their higher average and median IC). As expected, the positive coefficients for the average and median IC indicate that the groups’ risk-taking increases with the individual risk tolerance of group members. All other control variables (group averages of age, highest degree, happiness, and treatment) do not alter the results.Footnote 11
Ordered Probit regressions with group choice as the dependent variable and male-dominated as the independent variable plus controls

Notes: Regressions at the group level, standard errors in parenthesis, significance level:
* p < .1, **p < .5, ***p < .1.
Male-dominated group is a dummy variable equal to 0 for FFF and FFM groups and 1 for FMM and MMM groups. Avg. IC reflects the average individual choice in a group, ranging from 1 (no risk) to 6 (risk-seeking). As group controls, we included the following variables: Avg. age is the average age in the group. Avg. degree reflects average degrees in the group, ranging from 0 (no degree) to 4 (PhD). Avg. happiness reflects average self-reported happiness in the group, ranging from 1 (unhappy) to 5 (very happy). Treatment is a dummy variable equal to 0 for the GF treatment and 1 for the IF treatment. The full regression table is given in Appendix A.
4.3. Choice shifts and polarization
4.3.1. Group level
The paper’s primary focus is whether the group composition influences choice shifts. We begin our analysis at the group level. Overall, we find no general choice shift in our sample. As shown in Table 3, the average group choice (M = 3.58, SD = 1.73) is slightly higher than o the average individual choice (M = 3.48, SD = 1.22), but the difference is small and statistically insignificant (GC – avg. IC = .1, SD = 1.35). Therefore, our data does not reveal a general risky or cautious shift. However, when we differentiate between group types, we find that, in line with Hypothesis 3, the difference between group choice and average individual choice is notably higher in male- than in female-dominated groups (see Table 3). In female-dominated groups, the difference is slightly negative but insignificant (Diff = -.07, SD = 1.24). In contrast, male-dominated groups show a significant positive difference (Diff = .29, SD = 1.45, Two-sample Wilcoxon rank-sum test z = 2.032, p = .042), indicating a risky shift. The positive difference suggests that group members in male-dominated groups are willing to take more risks as a group than they would individually, on average. Most studies analyze choice shifts by comparing group choice with the average individual choice, often using between-subject designs (see Nieboer, Reference Nieboer2015; Sutter, Reference Sutter2009). In our within-subject, we can also compare the group choice with the median individual choice of the corresponding group members, providing a benchmark in the decision process under majority voting. According to the median voter theorem, we would expect that the group choice reflects the median individual choice. Table 3 shows that, in the general data, we observe no choice shift using the median individual choice. However, the risky shift observed in male-dominated groups is also visible when comparing the median individual choice, though the difference is not statistically significant.
Comparison of group and individual choice

Notes: The table displays the frequencies, means, and standard deviations (in parenthesis) of GC, average IC, and the difference between the two, as well as the Median IC and the difference between GC and median IC at the group level. GC and avg. ICs are statistically significantly different from each other for male-dominated groups (2-sample Wilcoxon rank sum test – z = 2.032, p = .042).
* Significance level: p < .1, **p < .05, ***p < .01.
In the next step, we analyze the difference between group and individual choice in greater detail. Our within-subject design allows us to compare the average individual choices of group members with the group choice. We conduct OLS regressions and estimate the following regressions:
 \begin{equation*}{{\Delta }}\left( {G{C_i} - \overline {I{C_i}} } \right) = \alpha + \beta *{\text{Male-dominated}} + \gamma \overline {I{C_i}} + \delta {X_i} + {\text{ }}{\varepsilon _i}\end{equation*}
 \begin{equation*}{{\Delta }}\left( {G{C_i} - \widetilde{I{C_i}} } \right) = \alpha + \beta *{\textrm{Male-dominated}} + \gamma \widetilde{I{C_i}} + \delta {X_i} + {\varepsilon _i}\end{equation*}
 We analyze the shift from individual to group decision at the group level  $i$, using the difference between the group choice (GC) and the average (
 $\overline {IC} )$ or median (
 $\widetilde {IC}$) individual choice as the dependent variable. To account for the effects of gender composition, we include a dummy variable for male-dominated groups. To ensure that the effect is not driven by general differences in risk preferences (mechanical effect), we also control for the average or median individual choice of the group members and individual characteristics
  $\left( {{X_i}} \right)$.
Table 4 presents our regression results. Male-dominated groups have significantly larger differences between group choice and both the average and median individual choice than female-dominated groups, confirming Hypothesis 3. This result remains robust when controlling for the average or median individual choices of group members. By construction, the average individual choice is negatively correlated with the size of the choice shift. As in the previous analysis, there is no significant difference between the two treatments (GF and IF). As a robustness check, we also ran the regression at the individual level, and the results are consistent with the results on the group level (see Table A4 in Appendix A).
OLS regressions with group shift as the dependent variable

Notes: Regression at the group level, standard errors are given in parenthesis, significance level:
* p < .1, **p < .05, ***p < .01. Male-dominated group is a dummy variable equal to 0 for FFF and FFM groups and 1 for FMM and MMM groups. Avg. IC/Median IC reflects the average/median I in the group, ranging from 1 (no risk) to 6 (risk-seeking). As group controls, we included the following variables: Avg. age is the average age in the group. Avg. degree reflects average degrees in the group, ranging from 0 (no degree) to 4 (PhD). Avg. happiness reflects average self-reported happiness in the group, ranging from 1 (unhappy) to 5 (very happy). Treatment is a dummy variable equal to 0 for the GF treatment and 1 for the IF treatment.
4.3.2. A closer look at the choice shifts
In the previous subsection, we showed that male-dominated groups exhibit risky shifts compared to female-dominated groups. In this subsection, we further investigate the difference between group and individual decisions at both the group and individual levels. Table 5 presents the frequencies and the sizes of choice shifts, while Fig. 3 displays the distribution of choice shifts. The shifts are calculated as the difference between group choice and median individual choice at the group level or the differences between group choice and individual choice at the individual level.Footnote 12 Overall, the majority of groups – about 57 % – do not exhibit choice shifts. Approximately 24 % of groups show risky shifts, and 18 % exhibit cautious shifts. The average size of the shifts is more than one step in our lottery task for cautious (M = −1.97, SD = 1.13) and risky shifts (M = 1.91, SD = 1.04). When comparing male and female-dominated groups, we observe two main patterns: (i) male-dominated groups are more likely to exhibit risky shifts, and (ii) the size of these shifts is larger in male-dominated groups (more than 2.17 steps in the lottery task on average).
Distribution of choice shifts at the group and individual level by group composition

Comparison of group and (median) individual choice

Notes: The left side of the table displays the frequencies and sizes of the choice shifts when switching from GC to IC at the group level, sorted by the gender composition of the groups. The right side displays the distribution of choice shifts between men and women at the individual level. Cautious shift: GC – IC < 0, No shift: GC – IC = 0, Risky shift: GC – IC > 0.
At the individual level, average choice shifts and their standard deviations are larger than at the group level. While there are no significant differences in the size of the cautious shifts between male- and female-dominated groups, the risky shifts are significantly larger in male-dominated groups.Footnote 13 This is true for both men and women. Notably, over 70% of women exhibit choice shifts in male-dominated groups compared to about 55% of men in female-dominated groups.
The distribution of the choice shifts depicted in Fig. 3 reveals that most shifts are small, but a small proportion of groups and individuals exhibit extreme risky (5) or cautious shifts (−5). Interestingly, women in male-dominated groups most often exhibit risky shifts of two steps in the lottery task, while no consistent patterns are observed for men in female-dominated groups.
4.4. Potential decision mechanism
In the previous subsection, we provided evidence of gender-specific group polarization, showing that male-dominated groups take more risks than they would individually, while no such shift occurs for female-dominated groups. A natural question is why this is the case. In the previous section, we demonstrated that the risky shift comes in addition to a purely mechanical effect – an increase in risk tolerance for male-dominated groups since men exhibit higher risk tolerance on average than women in our sample. We have also provided evidence that the effect is not driven by a preference effect on individual preferences, that is, by the potential effect that individual preferences change according to the social context.Footnote 14
Until now, we have analyzed the choice shift from individual to group choice relative to the average individual choice  $GC - \overline {IC} $ and the median individual choice
  $GC - \widetilde {IC}$. These are two plausible and straightforward benchmarks for group decision-making mechanisms. The first assumes that all group members have equal weight in the decision-making process. The second assumes that the group choice reflects the outcome of majority voting, aligning with the preference of the median individual, provided that the assumptions of the median voter theorem hold. In this subsection, we explore additional potential consensus-making mechanisms to rule out that the observed choice shift is driven by a mechanical effect resulting from a different underlying consensus-making mechanism. Specifically, we examine the following mechanisms:Footnote 15
a) Central tendency schemes: Average IC and Median ICFootnote 16
b) Coalition-based schemes: Low and High Majority Coalition, Minimum Range Coalition
c) Dictator schemes: Minimum IC in group, Maximum IC in group, Leader
All mechanisms build on the assumption that the decision of group  $g$ (
$g$ ( $G{C_g}$) results directly from aggregating the group members’ individual decisions represented by the vector
 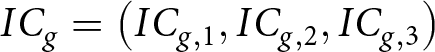 $I{C_g} = \left( {I{C_{g,1}},I{C_{g,2}},I{C_{g,3}}} \right)$, where
  $I{C_{g,m}}$ is group member
  $m$’s individual choice. The central tendency schemes assume that
  $G{C_g}$ equals the arithmetic mean or median of
  $I{C_g}$, respectively. The coalition-based schemes predict that two group members form a coalition and that the arithmetic mean of their
  $IC$s forms the group choice. The coalition can be formed in three ways. For the Low (High) Majority Scheme, we define the coalition as the median voter plus the subject with the
  $IC$ equal or below (above) the median. The Low (High) Majority Scheme can serve as a potential benchmark for the hypothesis that lower (higher) risk-taking is the socially accepted group choice; this might, for example, be the case in female(male)-dominated groups. For the Minimum Range Coalition Scheme, the two group members with the smallest distance between their individual choices will form a coalition, and the
  $GC$ equals the arithmetic mean of their
  $IC$s.Footnote 17 The Dictator Schemes assume that one group member who stands out from the group (minimum or maximum
  $IC$) dominates the discussion so that the final
  $GC$ will equal his or her
  $IC$. Finally, we also look at group leaders. For the treatment IF, we collected data on whether the other group members perceived a person within a group as driving the group decisionFootnote 18 (further details will be discussed in the Subsection 4.4.2). In the Leader Scheme, the
  $GC$ is assumed to reflect the leader’s
  $IC$.
$IC$.
4.4.1. Choice shifts relative to potential consensus-making mechanisms
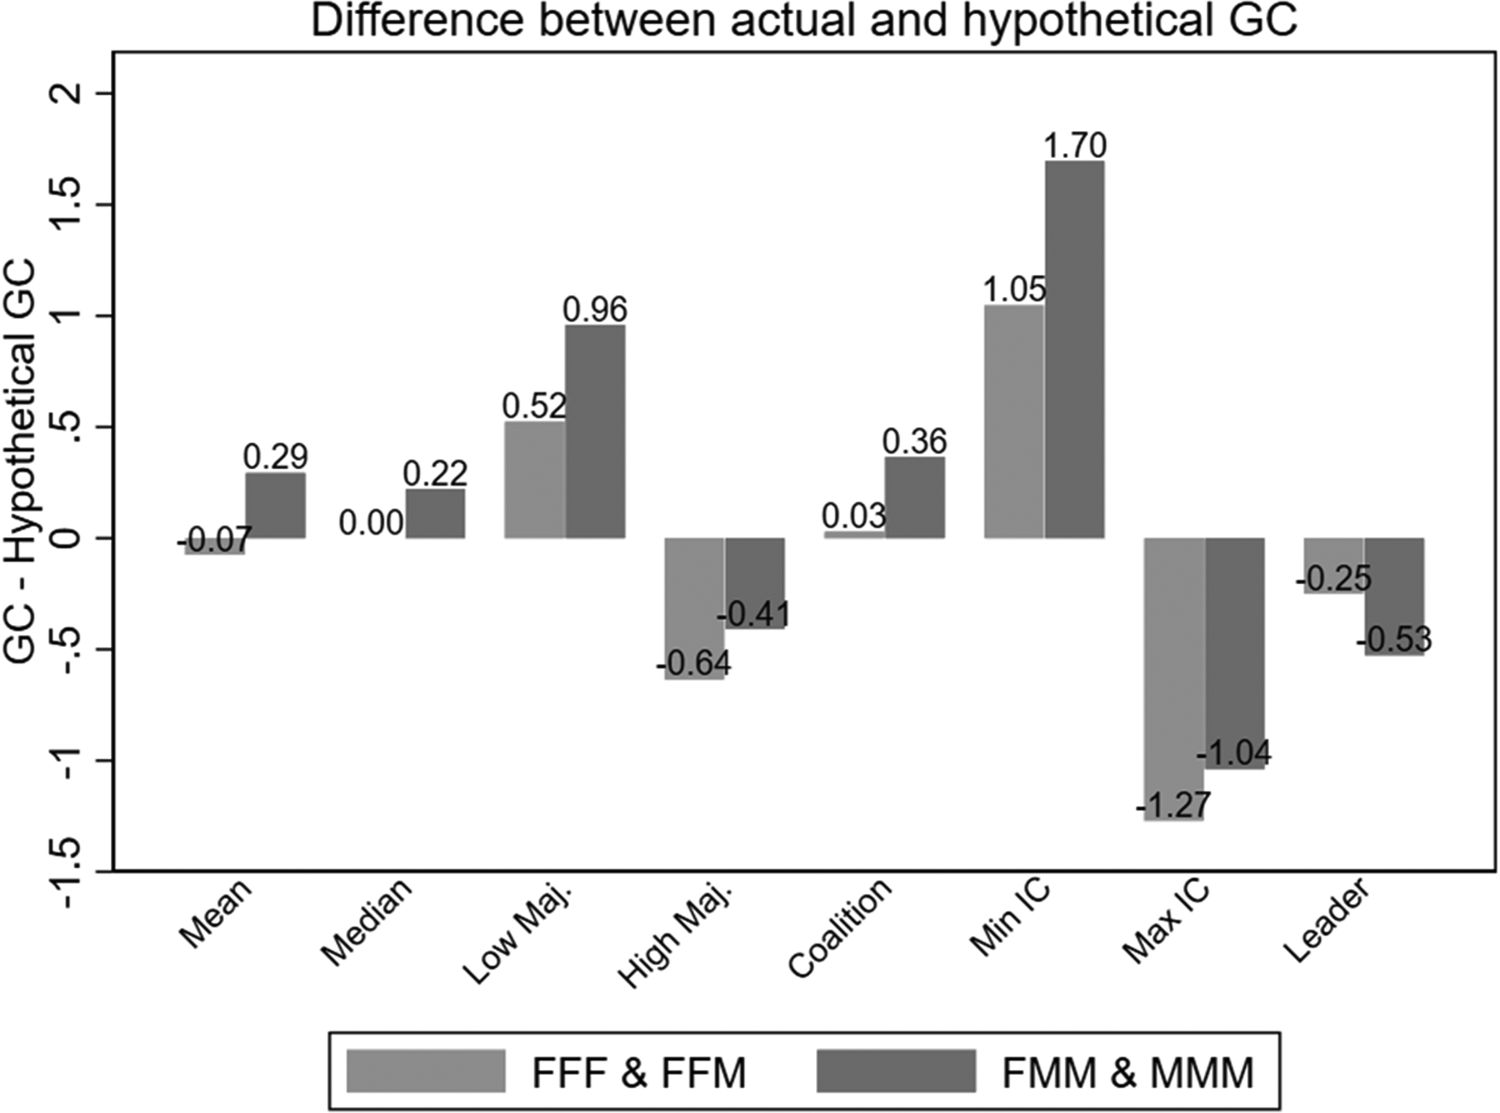
Next, we investigate choice shifts relative to the potential consensus-making mechanisms described above. We examine the differences between observed group choices and hypothetical group choices constructed for each group according to different consensus-making mechanisms, that is,  $G{C_g} - {\text{ }}GC_g^c$, where
  $c = $ {Mean, Median, Min IC, Max IC, Low Majority, High Majority, Minimum Range Coalition, Leader}. Positive values indicate a risky shift relative to the potential consensus-making mechanism, while negative values indicate a cautious shift. Figure 4 shows that, for all mechanisms except the Leader scheme, choice shifts are larger for male-dominated groups compared to female-dominated groups. Specifically, male-dominated groups exhibit a larger risky shift under the Mean, Median, Min IC, and Low Majority schemes and a smaller cautious shift under the Max IC and High Majority schemes. In the Leader scheme, we find the opposite – a smaller cautious shift for female-dominated groups. Potential explanations for this result are discussed in the following subsection. On average, the median IC seems to align most closely with the observed group choices. Nevertheless, a risky shift for male-dominated groups can be observed.
Potential consensus-making mechanisms

Table 6 shows that, for all consensus-making mechanisms except the Leader scheme, male-dominated groups consistently demonstrate a significant additional risky shift compared to female-dominated groups. In the case of Max IC and High Majority Coalition, male-dominated groups exhibit smaller cautious shifts. In the Leader scheme, the results are qualitatively and quantitatively similar, but the sample size (N = 39) is too small to detect a statistically significant effect.
OLS regressions with the difference between actual and hypothetical group choice as dependent variable (group level)

Notes: Regression at the group level, standard errors are given in parenthesis, significance level:
* p < .1, **p < .05, ***p < .1.
To further rule out a purely mechanical effect, we simulate hypothetical groups based on the average ICs of men and women. Figure 5 illustrates this comparison, showing that the observed average GC in male-dominated groups exceeds all consensus-making mechanisms considered. In contrast, for female-dominated groups, the observed GC is equal to or below these mechanisms. This confirms that the effect extends beyond a purely mechanical effect.
Simulated group choice according to potential consensus-making mechanisms

4.4.2. Leader
In treatment IF (79 groups in total), we included additional questions to identify whether group decisions were driven by a single individual. Table 7 shows that group leader were identified in many groups, with their occurrence evenly distributed across group types. In FMM, most leaders are male (nine men vs. two women), whereas leadership is evenly split between men and women in FFM (five men vs. five women).
Distribution of leaders across group types

Notes: The table shows the number of groups, with and without leaders, sorted by group gender composition.
An important question is whether leaders exhibit different risk characteristics than non-leaders and whether these characteristics differ between male and female-dominated groups. Table 8 shows that leaders are generally more risk-taking than non-leaders. In male-dominated groups, this difference is marginally significant for the experimentally elicited risk preference (IC, row 1) and highly significant for subjective risk tolerance (row 2). Leaders in male-dominated groups also perceive themselves as more risk tolerant relative to others, that is, their subjective risk tolerance relative to others is, on average, higher than for non-leaders in these groups (row 3). For female-dominated groups, we do not find statistically significant differences in risk preferences or subjective risk tolerance between leaders and non-leaders.Footnote 19 However, leaders in female-dominated groups believe that others should generally take less risk (row 4).
Comparison of individual risk preferences and subjective risk tolerance between leaders and non-leaders

Notes: Regressions at the group level, standard errors in parenthesis, significance level:
* p < .1, **p < .5, ***p < .1.
IC represents the individual choices in the incentivized risk experiment. Subjective risk tolerance, subjective risk tolerance relative to others and recommendation risk-taking are hypothetical self-assessments. Higher numbers indicated higher risk-taking (the original questions in the questionnaire are recoded to allow for an easier interpretation of results).
5. Conclusion
The growing political focus on gender diversity has spurred studies examining its economic impact and the influence of an increasing proportion of women in decision-making bodies on decision-making. In this paper, we examine how gender diversity affects group decision-making, focusing on risk-taking, a key aspect of many economic and political decisions.
Using a simple lottery choice experiment with monetary incentives, we find that risk-taking increases as the share of male group members rises, resulting in greater risk-taking in male-dominated groups compared to female-dominated groups. The main result of this paper is gender-specific polarization in group decision-making. A clear choice shift pattern emerges when we account for the group composition: male-dominated groups exhibit risky shifts, taking more risks than the average and median individual preferences of group members would suggest. In contrast, female-dominated groups show no significant shift in risk preferences.
To better understand the mechanisms behind these choice shifts, we examined eight potential consensus-making processes. This approach allowed us to rule out the possibility that the observed choice shift is due to a mechanical effect resulting from the underlying consensus-making processes. Our findings provide three key insights.
First, while the median group choice is closest to the actual group choice, male-dominated groups display an additional risky shift compared to female-dominated groups.
Second, the results for the majority mechanism align with theories such as the conformity and responsibility hypotheses, indicating that group members conform to the majority preferences. However, the majority preferences differ in male and female-dominated groups, leading to different choice shifts. Specifically, our findings support the assumption that men in male-dominated groups tend to adjust their choices to higher levels of risk when deciding in the group context.
Third, leaders in male and female-dominated groups differ in their risk preferences and subjective risk tolerance. Leaders in male-dominated groups are more risk-taking than non-leaders, while we find no such difference in female-dominated groups. This result is consistent with the findings of Ertac and Gurdal (Reference Ertac and Gurdal2012), who show that men are generally more willing to lead groups and that those who choose to lead tend to take more risks on behalf of the group than those who are not. For women, they find no differences. Additionally, we find that leaders in female-dominated groups generally recommend others to take less risk. This result aligns with our observation of a general trend of cautiousness in female-dominated groups. Furthermore, it supports the findings of Eckel and Grossman (Reference Eckel and Grossman2002), who show that women are stereotyped as more risk-averse than men and that beliefs about gender differences are greater than the actual gender differences in risk aversion.
While our evidence is rather clear-cut, it may be sensitive to the elicitation method. Filippin and Crosetto (Reference Filippin and Crosetto2016) showed that gender differences in risk-taking are particularly pronounced for elicitation methods involving a safe option, as in our study. Without such an option, gender differences are minimized, which could also reduce the effect of group composition on decisions. Additionally, the direction of group shifts seems to depend on the elicitation method. While we do not observe a general shift in our data, other studies with monetary incentives did. Pairwise choices, elicitation of willingness-to-pay, and the Holt-Laury method have generated cautious shifts in previous studies (Baker et al., Reference Baker, Laury and Williams2008; Masclet et al., Reference Masclet, Colombier, Denant-Boemont and Lohéac2009; Pahlke et al., Reference Pahlke, Strasser and Vieider2012; Shupp & Williams, Reference Shupp and Williams2008). In contrast, the investment game of Gneezy and Potters (Reference Gneezy and Potters1997) has generated risky shifts (Nieboer, Reference Nieboer2015; Sutter, Reference Sutter2009). It remains an open question for future research to determine the impact of gender composition under these alternative elicitation methods. The behavior of gender-balanced groups, which was not considered in our study, also warrants further investigation.
Our findings are important in several ways. First, we contribute to the literature on group decision-making by demonstrating that the gender composition of a group impacts decision-making under risk. Second, we contribute to the literature on choice shifts by showing that gender is a crucial determinant. The differences between groups of varying gender composition might help explain the mixed evidence on choice shifts in the literature. Finally, our results have important implications for policymakers. The systematic impact of gender composition on group decision-making suggests that political and firm-level actions to increase gender diversity can be expected to change decision-making under risk in the group context.
In our experimental design with groups of three participants, a larger share of women reduced risk-taking in groups, but a majority of females was needed to significantly reduce the risk-taking of groups and prevent risky shifts. Choice shifts can be problematic in several ways. In particular, risky shifts can be expected to have undesired effects and potentially harm society. Risky shifts may be regarded as excessive risk-taking since the risk taken by the group exceeds that of the individual group members, creating a potentially undesired bias toward higher risk-taking. Consequently, this could induce decision-making bodies to take excessive financial risk, contribute to financial crises, or lead to risky, unethical decisions, resulting in a moral decline within companies or institutions (Armstrong et al., Reference Armstrong, Williams and Barrett2004). However, in certain contexts, higher risk-taking is desirable and can lead to better outcomes, such as greater creativity (Glover & Sautter, Reference Glover and Sautter1977) and innovation (Reynolds et al., Reference Reynolds, Joseph and Sherwood2009). In general, group polarization in decision-making may not be desirable in a multitude of situations as it can give rise to a detachment of a group from its’ context (den Nieuwenboer & Kaptein, Reference den Nieuwenboer and Kaptein2008), and both excessive risk-taking and risk avoidance may be harmful to an organization or the society (Harjoto & Laksmana, Reference Harjoto and Laksmana2018).
Supplementary material
The supplementary material for this article can be found at https://doi.org/10.1017/eec.2024.4.
Replication packages
A replication package for all results presented in this paper, including data and Stata code can be accessed here: https://osf.io/2wp4z/?view_only=fd895c321c564b169f4374338d34b774.
Acknowledgements
We would like to thank participants at ESA in Berlin, the 12th Nordic Conference in Gothenburg, the Annual Meeting of the German Economic Association, the 20th Spring Meeting of Young Economists, and the International Meeting on Experimental and Behavioral Social Science for their helpful comments. Many thanks also to Julia van Hanxleden and Kateryna Ukrainets for their excellent research assistance.
Funding statement
Financial support from the Kiel Institute for the World Economy is gratefully acknowledged.


 Open access