

An estimated 293,300 healthcare-associated cases of Clostridium difficile infection (CDI) occur annually in the United States.Reference Lessa, Winston and McDonald 1 Earlier identification of patients at high risk for CDI can allow for earlier treatment with improved outcomesReference Barbut, Surgers and Eckert 2 , Reference Cohen, Gerding and Johnson 3 as well as implementation of infection prevention measures, such as patient isolation, contact precautions, and management of the environment to decrease the potential for nosocomial transmission.Reference Dubberke, Carling and Carrico 4
To date, most prior work in learning risk-stratification models for CDI has focused on “one-size-fits-all” models limited to a small number of risk factors.Reference Na, Martin and Sethi 5 – Reference Henrich, Krakower, Bitton and Yokoe 10 However, past research has shown that a model that leverages the entire structured contents of the electronic health record (EHR) can perform statistically significantly better than a model based on a limited set of curated risk factors drawn from the literature.Reference Wiens, Campbell, Franklin, Guttag and Horvitz 11 Moreover, there is considerable evidence that hospital-specific factors can play an important role in predicting patient risk of CDI.Reference Miller, Polgreen, Cavanaugh and Polgreen 12 – Reference Wiens, Guttag and Horvitz 14
We present a generalizable machine-learning approach to using the structured data in an EHR to build a CDI risk-stratification model tailored to an individual facility. Using this approach, we learned separate facility-specific risk-stratification models for CDI using EHR data collected during the regular course of patient care at 2 different hospitals.
We report on the successful application of this approach to different patient populations, different facilities, and different EHRs, and we show that it can be used to produce models that predict CDI several days in advance of clinical diagnosis. The approach can be used at other institutions to create facility-specific predictive models that could be utilized prospectively to provide daily, automated, risk prediction for CDI, to target both clinical and infection prevention interventions more effectively.
METHODS
Study Population
The study cohort consisted of adult inpatients admitted to the University of Michigan Hospitals (UM) and the Massachusetts General Hospital (MGH). At UM, we considered all admissions that started and ended during the 6-year period between January 1, 2010, and January 1, 2016. At MGH, we considered all admissions between June 1, 2012, and June 1, 2014.
To focus on healthcare-associated cases, we excluded patients discharged before the third calendar day and those who tested positive for CDI within the first 2 calendar days of admission. 15 Patients with duplicate positive laboratory tests for toxigenic C. difficile, defined as having a prior positive test within 14 days,Reference McDonald, Coignard, Dubberke, Song, Horan and Kutty 16 were excluded. Additionally, UM excluded patients admitted to the inpatient psychiatric unit. This decision was based on the fact that psychiatric inpatients at UM are located in a secure region of the hospital isolated from other patients and caregivers. At MGH, psychiatric patients may be located throughout the hospital, and thus were included in the MGH analysis.
Identification of CDI Cases
The testing protocols for CDI were similar at both study sites. CDI cases were identified using a tiered approach in which clinical specimens submitted for C. difficile testing were first processed using a combined glutamate dehydrogenase (GDH) antigen enzyme immunoassay (EIA) and toxin A/B EIA (C. Diff Quik Chek Complete, Alere, Kansas City, MO). In instances of concordance (ie, both negative or both positive), the results are reported as negative or positive. In instances of discordance, reflex testing by polymerase chain reaction (PCR) for presence of toxin B gene (tcdB) using a commercial assay was conducted. The Xpert C. difficile assay (Cepheid, Sunnyvale, CA) was used at MGH. At UM, the GeneOhm assay (Becton Dickinson, Franklin Lakes, NJ) was used through 2013 and the Simplexa assay (Focus Diagnostics, Cypress, CA) was used thereafter. At MGH, formed stools were not rejected from the microbiology laboratory during the study period. At UM, formed stools were rejected beginning in May 2015. At each institution, the decision to test rested with the clinicians caring for the patient.
Data Extraction and Preprocessing
We considered the structured contents of the EHR. During the study period, each hospital utilized an EHR system that consisted of a combination of locally developed and commercial software. Rather than trying to develop a common mapping across variables, we instead focused on a generalizable data extraction method.
We split variables into 2 main categories: (1) time invariant and (2) time varying. Time-invariant variables are available at the time of admission and do not change over the course of the admission. These variables include patient demographics (eg, gender), statistics on encounter history (eg, number of inpatient admissions in last 90 days), and treatment and diagnoses associated with the most recent previous hospitalization. Time-varying variables, extracted daily for each patient, included laboratory results, procedure codes, medications, and vital signs collected during the hospitalization. In addition, exposure to the pathogen was estimated based on daily in-hospital locations and both hospital-level and ward-level colonization pressure.Reference Wiens, Campbell, Franklin, Guttag and Horvitz 11 , Reference Dubberke, Reske and Olsen 17
All data considered were structured (ie, we did not consider free text notes); some variables were continuous and others categorical. We mapped all categorical data (eg, medications) to binary features (eg, if a patient received a medication on a given day, then for that patient the binary feature associated with that medication and that day is set to “1,” and “0” otherwise). For many of the continuous features (eg, glucose levels, white blood cell count [WBC]), we used the reference ranges available in the EHR. If the value fell outside of the normal reference range, then a flag was set in the database (eg, “high”). We mapped each combination of variable and flag to a binary feature (eg, “WBC=high”). For continuous variables without reference ranges (eg, heart rate and age), we used either well-established ranges (eg, heart rate: 60–100 beats per minute) or discretized the continuous values based on quintiles (combining homogeneous quintiles) and mapped each quintile to its own binary feature.
Finally, we concatenated the time-invariant with the time-varying features for each patient day. This approach results in a high-dimensional binary feature vector representing each patient admission day. We extracted data up to, but not including, the calendar day of the positive C. difficile test and the day of discharge.
While the procedure described above was applied uniformly, the data are represented differently between hospitals. For example, medication orders at UM are encoded based on the medication identification (medID), the main ingredient, and the medication class code, whereas only the medID was present at MGH. In addition, MGH did not have electronic records of vital signs, including heart rate, respiratory rate, blood pressure (diastolic and systolic), peripheral capillary oxygen saturation, and temperature.
Statistical Methods
We labeled patient admissions according to whether the patient was diagnosed with CDI during the admission. The learning task was to predict in advance of clinical diagnosis which patients would be diagnosed with CDI. We labeled each day from a CDI case as positive, and negative otherwise. We then applied multitask L2-regularized logistic regression to produce models for each institution that were used to generate daily estimates of patient risk. We smoothed daily risk scores by averaging over time, a previously validated approach.Reference Wiens, Guttag and Horvitz 18
To learn and evaluate the model, the data were split temporally: both models were tested on the last year and trained on the preceding years. A temporal split was used because it provides a better estimate of prospective performance than a random split. In addition, from the training data, we excluded data pertaining to the sample collection date and the preceding day for positive cases. This approach prevented the model from using empiric CDI therapy as a factor in predicting CDI.
Model Outcomes
The models output a daily risk score for each patient admission. If the daily risk estimate of a patient ever exceeds a specific threshold, she or he is classified as high risk. By sweeping this threshold, we calculated the receiver operating characteristics (ROC) curve and the area under the ROC curve (AUROC) on the held-out test data. We computed 95% empirical bootstrap confidence intervals (CI) for the AUROC using 1,000 Monte Carlo case resampled bootstraps of the test set. Finally, we measured how well the predicted probabilities matched the actual CDI rates in the test data (ie, calibration performance). We generated a reliability curve and computed the Brier score for each classifier.
Using a decision threshold based on the 95th percentile, we classified patients and computed confusion matrices, representing the number of true positives, true negatives, false positives, and false negatives. We computed the positive predictive value (PPV), sensitivity, specificity, and negative predictive value. In addition, we considered how far in advance each model predicted positive cases, by measuring the time from when a patient’s risk first exceeds the 95th percentile decision threshold to the day the sample was collected.
In addition to model performance, we investigated model feature weights. Because model feature weights change over the course of an admission, we focused on those that are shared among all days. We recorded the weights associated with the top 10 risk and/or protective factors at each institution. We trained the models based on 1,000 Monte Carlo case resampled, block bootstraps of the training data. This approach produced an empirical distribution for each weight, for which we report the standard deviation.
All preprocessing and statistical analyses were performed in Python (Python, Wilmington, DE). The code is publicly available (https://gitlab.eecs.umich.edu/jeeheh/ICHE2018_CDIRiskPrediction.git). Using this code, individuals at other institutions who want to develop facility-specific models can use data extracted from their EHR to train and evaluate an L2-regularized logistic regression risk stratification model with time-varying parameters.
RESULTS
During the study period, UM had an average of 59,809 discharges per year. MGH had an average of 65,536 discharges per year. The number of licensed beds increased at both institutions over the course of the study period, from 849 to 993 beds at UM and from 950 to 999 at MGH.
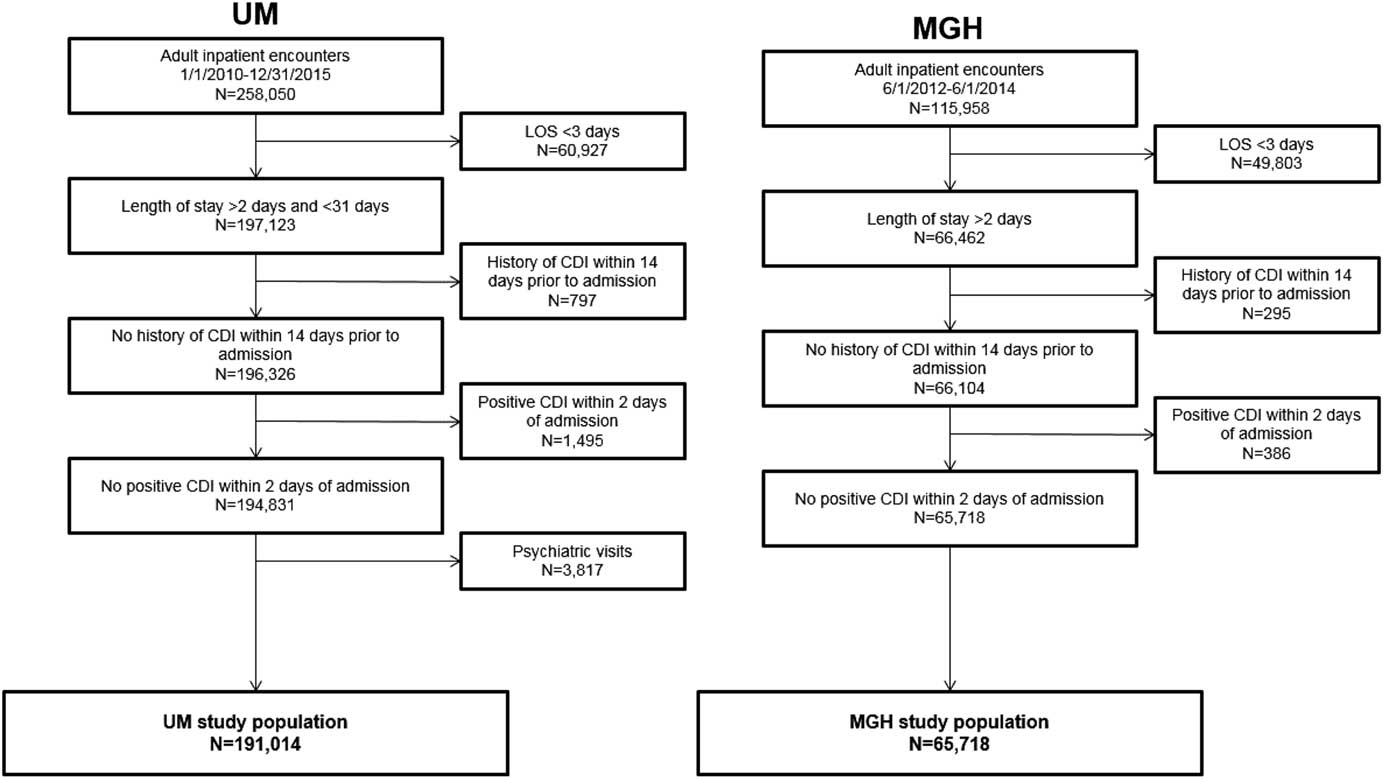
After applying exclusion criteria, the final dataset included 191,014 UM admissions and 65,718 MGH admissions (Figure 1). Within each population, we identified 2,141 nosocomial CDI cases at UM and 552 nosocomial CDI cases at MGH (Figure 1). Selected demographic and clinical characteristics of the study populations are provided (Table 1). After preprocessing, we considered 4,836 variables for UM data and 1,837 variables for MGH data (supplemental Table 1). Once split into training and test sets, we trained the UM model on 155,009 patients (1,781 cases), and the MGH model on 33,477 patients (315 cases). This allocation left 36,005 patients (360 cases), and 32,241 patients (237 cases) in the test sets for UM and MGH, respectively.
Inclusion and exclusion criteria and demographics of study populations. The inclusion and exclusion criteria for the study population at each institution are shown, along with the demographics of the final study populations. The period for inclusion, length of stay duration requirements, and kind of visit differed slightly between study populations. The same exclusion criteria were applied with regards to history of CDI within 14 days prior to admission and positive CDI within 2 calendar days of admission for both study populations. The final study populations comprised 191,014 and 65,718 adult inpatient encounters at UM and MGH, respectively.
Selected Characteristics of Study Cohorts
NOTE. UM, University of Michigan Hospitals; MGH, Massachusetts General Hospital; IQR, interquartile range; CDI, Clostridium difficile infection; PD, patient days.
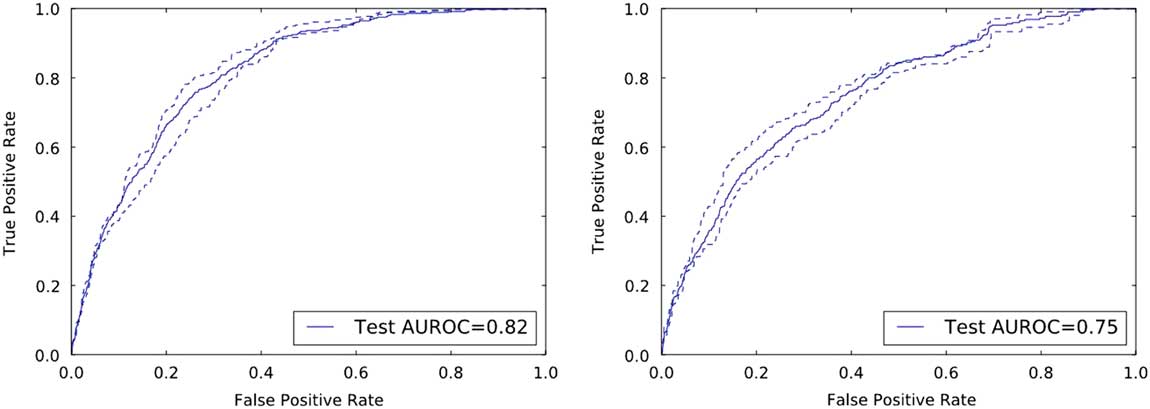
On the held-out UM and MGH test data, the risk prediction models achieved AUROCs of 0.82 (95% CI, 0.80–0.84) and 0.75 (95% CI, 0.73–0.78), respectively (Figure 2).
Discriminative performance of the institution specific classifiers on their respective held-out test sets. The receiver operating characteristics curves illustrate the tradeoff in performance between the false-positive rate (1-specificity) and the true-positive rate (sensitivity). Both classifiers achieve good discriminative performance as measured by the area under the ROC curve (AUROC): an AUROC of 0.82 and an AUROC of 0.75 at UM and MGH, respectively.
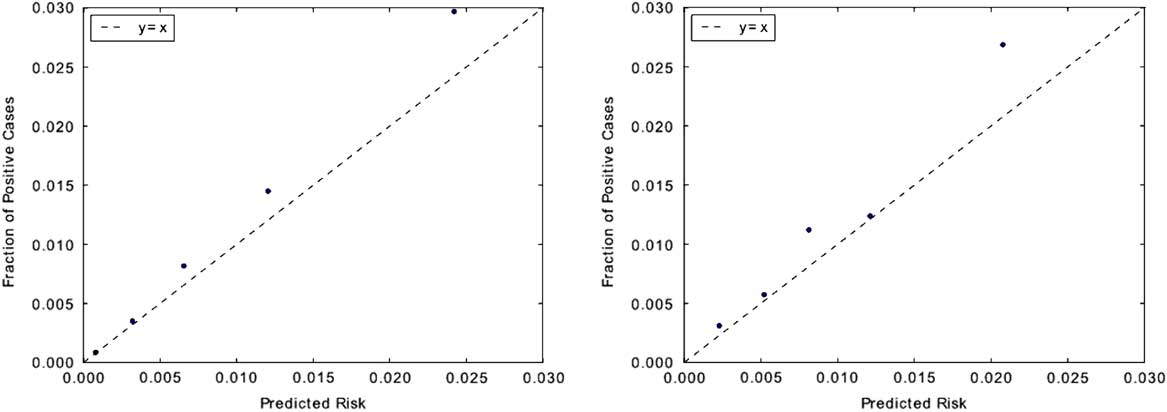
In terms of calibration performance, both classifiers demonstrated good calibration (Figure 3), with Brier scores of 0.01 on each institution’s respective held-out data.
Measuring model calibration. Predictions are grouped into quintiles by predicted risk and plotted against observed CDI incidence rate within each quintile. Points that fall closer to the “y=x” line are better calibrated. Classifiers for both institutions appear to be well calibrated. This is also evident in their low Brier scores: both classifiers have scores of 0.01. Brier scores measure the accuracy of probabilistic predictions and range from 0 to 1, where 0 represents perfectly calibrated predictions. The calibration plot for UM is shown on the left, with MGH on the right.
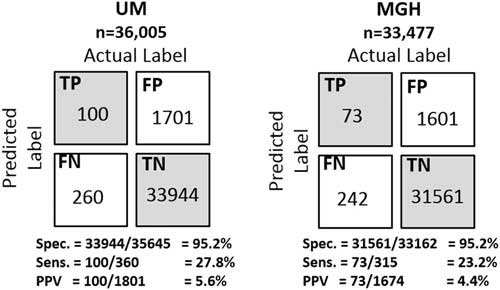
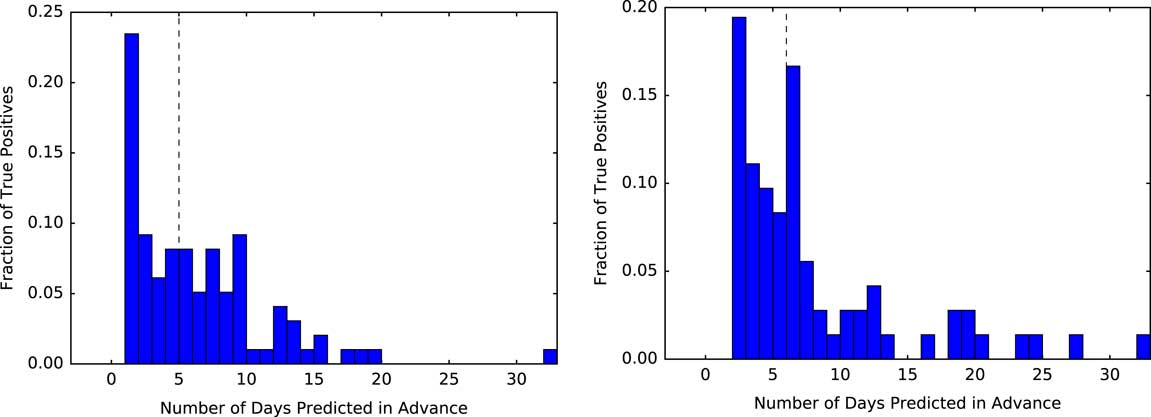
Selecting a decision threshold based on the 95th percentile resulted in classifiers with a sensitivity of 0.28, specificity of 0.95, and PPV of 0.06 for UM, and a sensitivity of 0.23, specificity of 0.95, and PPV of 0.04 for MGH (Figure 4). Using the selected thresholds, half of the cases predicted correctly were predicted at least 5 days in advance of sample collection within both study populations (Figure 5).
Confusion matrices of the institution specific classifiers on their respective held-out test sets. Selecting a decision threshold based on the 95th percentile results in classifiers that achieves very good specificity 95.2% at both institutions and relatively good positive predictive values of 5.6% and 4.4% at UM and MGH, respectively. For perspective, the baseline positive predictive values (ie, fraction of positive cases) at each institution are 1.00% and 0.74%, respectively. Thus, both were approximately 6 times better than the baseline.
Measuring how far in advance the model correctly identifies cases. Using a threshold based on the 95th percentile, we measure the time from when each positive patient first crosses that threshold to when they are clinically diagnosed with CDI. At both institutions, of those patients who are correctly identified as positive (ie, the true positives) the model identifies half of the patients at least 5 days in advance (black dashed line represents the median). The plot for UM is shown on the left, with MGH on the right.
Considering the top predictive factors (Table 2), we observe some similarities across the 2 institutions. A 1-year history of CDI appears as a top risk factor, while younger age and obstetrics are protective. Aside from these clear similarities, the top 10 risk factors and the top 10 protective factors varied by institution.
Final Regression Coefficients With Positive Coefficients Conferring Risk and Negative Values Indicating ProtectionFootnote a
NOTE. UM, University of Michigan Hospitals; MGH, Massachusetts General Hospital; SD, standard deviation; CDI, Clostridium difficile infection; ED, emergency department; CP, colonization pressure; NSAI, nonsteroidal anti-inflammatory; MICU, medical intensive care unit.
a While the model learns different models for different periods of an admission (eg, beginning of the admission vs the end of the admission), here we present the top risk/protective factors shared across time periods. We sorted the features according to their learned regression coefficient.
b Age ranges were based on the study population at each institution (ie, quintiles).
DISCUSSION
The prevention and control of hospital-associated infections like CDI (and other multidrug-resistant organisms) is a major problem. Despite concerted preventative efforts, the incidence of CDI continues to rise.Reference Ma, Pegues and Kochman 19 Successfully tackling this complex problem requires a multipronged solution that relies on both the appropriate identification and treatment of patients with CDI and on mechanisms for managing risk and preventing the spread of disease. This approach could include reducing exposure to high-risk antibioticsReference Vardakas, Trigkidis, Boukouvala and Falagas 20 and acid-suppressive medications,Reference Tariq, Singh, Gupta, Pardi and Khanna 21 testing for C. difficile carriage and selectively isolating carriers,Reference Longtin, Paquet-Bolduc and Gilca 22 or even deploying currently experimental preventative treatments such as probioticsReference Shen, Maw and Tmanova 23 and gut-specific β-lactamases.Reference Kokai-Kun, Roberts and Coughlin 24 At a hospital unit level, high-risk patients could be targeted with enhanced environmental cleaning interventions or additional auditing of cleaning practices.Reference Manian, Griesnauer and Bryant 25 – Reference Han, Sullivan and Leas 27
The timely and appropriate deployment of such prevention strategies would be enhanced by the early identification of patients at greatest risk of developing CDI.Reference Barbut, Surgers and Eckert 2 , Reference Cohen, Gerding and Johnson 3 While testing for CDI should be limited to patients with clinically significant diarrhea,Reference Mills, Rao and Young 28 identifying at-risk patients in advance of clinical diagnosis or even acquisition could enable the efficient and cost-effective application of pre-emptive interventions in a subset of the population.Reference Dubberke, Carling and Carrico 4
To this end, we explored a data-driven approach based on machine learning to automatically construct patient risk-stratification models for CDI at 2 large academic centers. Despite substantial differences across institutions, including patient populations, exclusion criteria, differences in CDI testing protocols, and availability of data, the same technique was successfully used to train institution-specific models that identified patients at high-risk of CDI, well in advance of clinical diagnosis. Our approach comprehensively considers EHR data, incorporating thousands of variables. While ambitious, we have demonstrated that the proposed approach is both feasible and flexible.
Our results highlight the advantages of an automated approach to building institution-specific models over the typical “one-size-fits-all” approach. If we had simply focused on the UM data, for example, much of what our algorithm had learned would not have applied to MGH (or any other institution) because we did not have the same variables at MGH. Even if vital signs had been available at MGH, mapping features across hospitals would have been labor-intensive and error-prone. This process would have to be repeated any time a different hospital wanted to use the model. Furthermore, such feature mapping would inevitably be flawed because even when 2 variables share the same name, institutional differences can affect the true meaning of that variable.
Within specific institutions, changes occur over time (eg, EHR systems, testing protocols, facility structure, and infection control policies). Such changes provide additional motivation for developing generalizable approaches that can also evolve over time rather than “one-size-fits-all” models. This flexible approach enables an institution (or even units within an institution) to (1) tailor the model to the population of interest, the available data, and the outcome of interest (eg, CDI) and (2) update the model as things change.
The top predictive factors differed across institutions. We refrain from speculating about the causes of these differences; such a discussion would require a detailed understanding of how the factors translate between hospitals. Moreover, because of the collinearity present among the covariates, one must be cautious in drawing conclusions about what does or does not confer risk. Nonetheless, examining the list of predictive factors leads to interesting and in some cases testable hypotheses regarding hospital-specific risk and/or protective factors.
We achieved similar classification performance across both institutions using a classifier based on the 95th percentile. Moreover, our models successfully identified cases well in advance of clinical diagnosis—at least 5 days in advance in half of the correctly identified cases. Such early identification is an important factor in enhancing the effectiveness of many interventions. Going forward, risk stratification algorithms should be compared in terms of how far in advance of clinician suspicion the model correctly identifies high-risk patients, in addition to the standard measures of prediction performance.
The PPV of our classifiers fell between 4% and 6%. Notably, however, increased PPV can be achieved by choosing a higher threshold (eg, 99th percentile). This higher PPV, however, comes at the cost of lower sensitivity. Managing the tradeoff between PPV and sensitivity depends on the costs and benefits of the intervention. Prior to considering the implementation of practice changes based on the risk prediction, the costs and benefits need to be assessed carefully.
This study has several limitations. First, we used only retrospective data. While we tested on held-out data from the most recent year, this approach is not equivalent to integration into an EHR system and prospective application. Such prospective testing requires considerably more resources, but it is the logical next step in determining the potential impact of early identification of patients at high risk for developing CDI. Second, the approach is limited to predicting CDI cases that will be clinically diagnosed during the current hospital stay, so it may miss cases in which a patient acquired C. difficile during his or her hospital visit but was discharged before diagnosis. Third, we focused on a linear model as opposed to a nonlinear approach.Reference Gulshan, Peng and Coram 29 While this ignores potential nonlinear interactions between features, it facilitates model interpretation and transparency. Accounting for nonlinear interactions could increase the predictive performance of the model by capturing population-specific risk factors (eg, factors specific to the ICU), but likely requires more data. Fourth, the model focuses largely on variables related to patient susceptibility to CDI, and not exposure, both of which are required to manifest disease. While we include variables related to colonization pressure and in-hospital locations, exposure-related variables account for a relatively small fraction of the overall feature set. We could not account for any interactions at the level of the individual healthcare provider. Finally, we caution that the clinical utility of such models depends on the actions taken based on the model predictions. More research assessing the actionability of these models is needed to determine their appropriate role in day-to-day clinical practice.
The approach described in this study could be used to build hospital-specific models for other pathogens (eg, methicillin-resistant Staphylococcus aureus) and/or other outcomes (eg, CDI severity), where there is reason to believe that both patient-specific and institution-specific factors play an important role. The resulting models could apply in several different settings, serving different purposes. In clinical trials, costs for new therapeutics are driven in large part by the ability to enroll appropriate subjects.Reference Walters, dos Anjos Henriques-Cadby and Bortolami 30 , Reference Wong 31 Good predictive models could enable investigators to focus recruitment on patient populations at highest risk for disease. This application could, in turn, result in more efficient, and less costly, clinical studies. In a research setting, the factors that confer risk and protection can serve to generate testable hypotheses. For example, when specific hospital locations appear to confer higher or lower risk, a detailed examination of distinguishing features (eg, room layout, cleaning practices, staff training, etc) may identify specific opportunities for improvement.
ACKNOWLEDGMENTS
The authors would like to thank Joseph Marchesani, Irina K. Kamis, Daorsa Shuka, Micah H. Flynn, Mariah P. Mitchell, Laurie Bogosian, Rose B. Mandelbaum, Xiang Shirley Fei, and Brian P. Hingston of Information Systems at Partners HealthCare; Milcho I. Nikolov of MGH Anesthesia, Critical Care, and Pain Medicine; Cassie Kraus of the MGH Emergency Medicine Department; Melinda Abelman of the Partners Human Research Affairs office; Irene Goldenshtein of the MGH Infection Control Unit; Winston Ware of the MGH Center for Quality and Safety; Kathryn M. Turcotte, Stephen V. Buonopane, Kevin C. Murphy, of the MGH Admitting Services; Aaron Fishman of the MGH Finance Department; and Karen E. Lynch of the MGH Laboratory of Computer Science for their assistance in creating the MGH database for this project. The authors would also like to acknowledge Keith Jennings and Karina Bradford of Information Systems at Partners HealthCare for their support of this project. The authors would like to acknowledge Eric Horvitz for his early contributions to the algorithm development. Finally, the authors would like to acknowledge Sachin Kheterpal, Erin Kaleba, John Vandervest, Jeremy Jared, Hyeon Joo, Don Liamani, and Tomas Medina of the Michigan Medicine Research Data Warehouse team at UM for their help and support in navigating the UM data for this project.
The views and conclusions in this document are those of the authors and should not be interpreted as necessarily representing the official policies, either expressed or implied, of the National Science Foundation nor the National Institute of Allergy and Infectious Diseases of the National Institutes of Health.
Financial support: This work was supported by the MGH-MIT Grand Challenge, the National Science Foundation (NSF award no. IIS-1553146); the National Institute of Allergy and Infectious Diseases of the National Institutes of Health (grant no. U01AI124255 to UM researchers and grant no. K01AI110524 to E.S.S.); a Morton N. Swartz Transformative Scholar Award to E.S.S.; and departmental funds at the Massachusetts General Hospital.
Potential conflicts of interest: All authors report no conflicts of interest relevant to this article.
SUPPLEMENTARY MATERIAL
To view supplementary material for this article, please visit https://doi.org/10.1017/ice.2018.16


