


Introduction
The study of policy innovation and diffusion among governments is vibrant (Mooney Reference Mooney2021). Particularly since F. S. Berry and Berry (Reference Berry and Berry1990) introduced event history modeling, hundreds of largely single policy diffusion models have been published (Mallinson Reference Mallinson2021a). Not to mention that hundreds more likely remain unpublished in virtual file drawers (Franco, Malhotra, and Simonovits Reference Franco, Malhotra and Simonovits2014). Policy innovation and diffusion analyses are necessarily retrospective, but scholars do not always wait until a policy has fully diffused before estimating quantitative models and publishing the results. While some studies reach further into the past and, thus, confidently capture the whole adoption picture (e.g., Allard Reference Allard2004; Chamberlain and Yanus Reference Chamberlain and Yanus2021), scholars have also published studies of emergent policies such as medical and recreational marijuana (Hannah and Mallinson Reference Hannah and Mallinson2018; Vann Jr. Reference Vann2022), climate action plans (Rai Reference Rai2020), and same-day voting (Caron Reference Caron2022). This begs a question not addressed in these hundreds of studies: When is it appropriate to conduct a diffusion study? A derivative question that we then address is: How should we interpret models of policy diffusion histories that may not have fully diffused? These seemingly simple questions mask complicated answers.
Policy innovation and diffusion studies necessarily take snapshots of a policy’s spread. These snapshots may be complete, in that no future adoptions occur after the study is conducted, but many are not. Research on the motivations of leaders and laggards (Mooney Reference Mooney2001), as well as on the full policy diffusion life course (Mallinson Reference Mallinson2021b), reveals that the so-called determinants of adoption change as the diffusion process unfolds. This means that diffusion models relying on incomplete “snapshots” may yield results that change as they are replicated and extended. Alas, generalizable conclusions are often drawn from incomplete studies, and replication work remains more difficult to publish than more “novel” early takes (Koole and Lakens Reference Koole and Lakens2012; Madden, Easley, and Dunn Reference Madden, Easley and Dunn1995). But results do change. For example, Hannah and Mallinson (Reference Hannah and Mallinson2018) found that medical marijuana policies spread through ideological channels, as opposed to geographic ones. However, their updated work on a fuller “snapshot” resulted in that ideological pathway disappearing (Mallinson and Hannah Reference Mallinson and Hannah2024). What is likely happening is that early takes capture the determinants that matter, on average, in early stages of the diffusion life course, whereas updated analysis better captures the average effects across the entire span (Mallinson Reference Mallinson2021b). The challenge, of course, is knowing where in the diffusion life course a policy currently resides, especially for issues that are emergent, like recent analyses of AI policies spreading across the states (Parinandi et al. Reference Parinandi, Crosson, Peterson and Nadarevic2024; Robles and Mallinson Reference Robles and Mallinson2024).
We aim to provoke discussion of the question, “When is it appropriate to conduct a diffusion analysis?” Our aim is not to provide a definitive answer, but to demonstrate how results can change as the “snapshot” of time observed for an innovation expands and discuss how scholars should approach reporting the results from early diffusion analyses of emergent policies. We begin by briefly reviewing the concept of the diffusion life course and the variation in completeness of diffusion studies published using event history analysis (EHA). We first turn to the literature on survival modeling and raise model-based considerations of when there are enough observed events to conduct such a study. We then use the State Policy Innovation and Diffusion (SPID) database (Boehmke et al. Reference Boehmke, Brockway, Desmarais, Harden, LaCombe, Linder and Wallach2020) to examine how the results of EHA models change as new observations are added. Specifically, we extract 83 policies that have been adopted by at least 42 states and estimate iterative EHAs that show how the size, direction, and statistical significance of results change as the observed window of adoptions expands. Finally, we conclude with a discussion of what this means for the numerous scholars conducting diffusion analyses. We make recommendations for how scholars should think about and report the models they estimate. A more sober approach to considering what is generalizable and how, dependent on the completeness of the observed diffusion process, is warranted to ensure that diffusion researchers are not drawing broad conclusions that cannot be supported by their evidence.
Modeling policy innovation
For decades, political scientists and increasingly scholars from myriad other fields have been trying to understand why policy innovations spread across governments. While the longest strand of research has focused on the American states (Walker Reference Walker1969), the scope has moved to range from local governments (Einstein, Glick, and Palmer Reference Einstein, Glick and Palmer2019; Yi and Liu Reference Yi and Liu2022) to cross-national diffusion (Cao Reference Cao2010; Mistur, Givens, and Matisoff Reference Mistur, Givens and Matisoff2023). Crucially, F. S. Berry and Berry (Reference Berry and Berry1990) brought together two disparate explanations for innovation diffusion – external influences and internal attributes – theoretically and empirically using EHA. They tested this theory using the spread of state lotteries. Published in 1990, Berry and Berry captured lottery adoptions from 1964 to 1986. They found that external adoptions by contiguous neighboring states, internal electoral politics, and poor fiscal health predicted lottery adoption. But that was not the whole story.
The EHA approach introduced by Berry and Berry and used by hundreds of subsequent analyses across subfields and disciplinesFootnote 1 measures time discretely. Diffusion scholars typically try to bring the analysis back to the very first instance of adoption, which avoids left-censoring of unobserved prior adoptions. The units being observed (e.g., states) are at risk of adopting the innovation and thus have observed independent variables until they adopt the policy and drop out of the risk set. While left-censoring is typically avoided, many diffusion models have right-censoring – that is, states that remain “at risk” of adoption at the end of the observed period. In the case of Berry and Berry, only 27 states had adopted a lottery by 1986. In fact, according to updated data in SPID, 44 total states adopted lotteries by 2013. While EHA and the broader family of survival analysis models incorporate censoring into their estimations, that does not mean that expanding the window of observation will yield the same results. In fact, the nature of diffusion and variation in the relevance of different external and internal determinants throughout the spread of an innovation means that we should expect estimated average effects to change as the observation window changes.
The diffusion life course and EHA models
Originally conceptualized by Rogers (Reference Rogers2003) as adopter types, Mallinson (Reference Mallinson2021b) reconceptualized adopters into five stages of a continuous diffusion life course. Initially, a small set of innovators ventures out and tries something new. Innovators tend to be “cosmopolites,” with individual and social resources that come through their networks (Rogers Reference Rogers2003, 282). In early adoption, regional and ideological influences should take hold through local leaders (Mooney Reference Mooney2001). While states such as California and New York tend to be innovators who trigger adoption cascades, regional leaders such as Florida, Oregon, Texas, and Massachusetts tend to be the roots of localized diffusion (Desmarais, Harden, and Boehmke Reference Desmarais, Harden and Boehmke2015; Jensen Reference Jensen2003). It is important to recognize that “local” is not always based on geography, as traditionally assumed in policy diffusion research, but can also be ideological (Grossback, Nicholson-Crotty, and Peterson Reference Grossback, Nicholson-Crotty and Peterson2004).
The early majority stage sees adopters who require more deliberation before following in the footsteps of opinion leaders in their networks. This means that network effects remain strong throughout the first half of the diffusion life course (Pacheco and Maltby Reference Pacheco and Maltby2017). Public opinion also accelerates the diffusion process, meaning that early and late majority adopters are responding to public pressures in ways that innovators may not be. The late majority stage, however, sees skeptical adopters slowly coming along. This is where normative pressure plays a greater role, as “the weight of system norms must definitively favor an innovation before the late majority are convinced to adopt” (Rogers Reference Rogers2003, 284). Thus, regional networks matter more earlier in the policy diffusion life course, whereas normative pressures from ideological networks increase as the stages progress (Mallinson Reference Mallinson2021b; Mooney Reference Mooney2001). Later adopters also tend to have fewer resources, which contributes to their hesitance to adopt an innovation earlier. Finally, the laggard phase sees plateauing with a trickle of additional adopters over time. Laggards are “suspicious” of an innovation, and it may take longer-term institutional, political, or social change before a laggard is willing to adopt.
Notably, not all policies go through the entire life course. Some go through the process quickly, whereas others are slow or never fully saturate all potential adopting governments (Boushey Reference Boushey2010; Mallinson Reference Mallinson2016; Menon and Mallinson Reference Menon and Mallinson2022; Nicholson-Crotty Reference Nicholson-Crotty2009). Not all policy innovations are relevant for all states, nor are they all politically feasible. Analyzing the adoption of interstate compacts, Karch et al. (Reference Karch, Nicholson-Crotty, Woods and Bowman2016) demonstrate that several compacts did not diffuse widely. For example, the Health Care Compact that was proposed as a response to the Affordable Care Act – requesting Congress devolve healthcare authority and resources to the states joining the compact – was adopted by just four conservative states at the time Karch et al. (Reference Karch, Nicholson-Crotty, Woods and Bowman2016) published. This policy was politically infeasible in many states, just as it is unlikely that restrictive abortion bans will be adopted by all 50 states (Kreitzer Reference Kreitzer2015; Medoff, Dennis, and Stephens Reference Medoff, Dennis and Stephens2011). Other innovations are adopted by all 50 states (Schiller and Sidorsky Reference Schiller and Sidorsky2022). But as Karch et al. (Reference Karch, Nicholson-Crotty, Woods and Bowman2016) note, most analyses sample policies adopted by many states, creating a “pro-innovation bias” in the empirical literature on diffusion.
Why is the diffusion life course important to the timing of diffusion studies? While more work is needed to flesh out the stages concept, the life course and work on leader and laggard diffusion make clear that the determinants of diffusion vary as a policy is spreading. This means that if a researcher estimates an EHA to calculate the average effects of different determinants on the likelihood of adoption, those results can be very much shaped by how much of the diffusion life course is being observed. If someone estimates a model on a policy that is still emerging, the “average” effects that they find may, in fact, only represent those relevant to innovators and early adopters. In our experience peer-reviewing diffusion studies, early analyses of innovation diffusion sometimes include only 8–12 adoptions out of 50 possible. Point estimates, standard errors, and, relatedly, p-values that still drive much of the interpretation of the results can change drastically as even a few more adoptions are added to such an analysis. Thus, subsequent replication and extension work could find very different results as the observation window increases. This leaves it to subsequent researchers to sort out the “truth” of an innovation’s determinants of adoption. Yet, the incentives and infrastructure to publish replication work remain limited and uneven across journals, even if it is growing (Brodeur et al. Reference Brodeur, Esterling, Ankel-Peters, Bueno, Desposato, Dreber and Genovese2024; Key Reference Key2016).
So, what do we do? Policy diffusion research is a large enterprise built upon hundreds of EHA analyses. It is a significant research program within political science and public policy, but also spans many other disciplines (Mallinson Reference Mallinson2021a). While the study of diffusion has experienced significant methodological diversification in the last decade (Butler et al. Reference Butler, Volden, Dynes and Shor2017; Desmarais, Harden, and Boehmke Reference Desmarais, Harden and Boehmke2015; Gilardi, Shipan, and Wüest Reference Gilardi, Shipan and Wüest2021; Harden et al. Reference Harden, Desmarais, Brockway, Boehmke, LaCombe, Linder and Wallach2023; Hinkle Reference Hinkle2015; Linder et al. Reference Linder, Desmarais, Burgess and Giraudy2020), many studies still rely on either a monadic or dyadic model of the adoption of a single innovation. And whether intentionally or implicitly, these studies often draw claims of generalizability regarding the “determinants” of policy innovation adoption. However, the points we have raised suggest that there are important boundary conditions on the generalizability of these studies beyond the fact that they are focused on a single innovation. We turn now to consider what the EHA methodology literature says about the problem of incomplete adoption windows before presenting empirical evidence of the problem.
Event history modeling considerations
Many of the advances in knowledge about policy diffusion have been made possible by the use and development of EHA. F. S. Berry and Berry (Reference Berry and Berry1990) proposed the EHA method as a solution to a persistent problem in the diffusion literature: scholars either examined the effect of internal characteristics or external influences on policy adoption, but rarely, nor effectively, both. They called this “a critical conceptual weakness” because “neither a pure regional diffusion model nor a pure internal determinants model is a plausible explanation of state innovation in isolation” (F. S. Berry and Berry Reference Berry and Berry1990, 396). EHA provided a flexible approach for estimating the effect of both internal characteristics and external influences. It conceives of policy diffusion as an event that may or may not occur at a given point in time across a given set of political units. Thus, the data are structured as time-series cross-sectional with a political-unit time-period unit of analysis (e.g., country-year, state-month, and state-days; see Zapp and Dahmen Reference Zapp and Dahmen2017, Colvin and Jansa Reference Colvin and Jansa2024, and Adolph et al. Reference Adolph, Amano, Bang-Jensen, Fullman and Wilkerson2021 for recent examples of various configurations of units of analysis). In such a dataset, the dependent variable takes the value of 1 for each political unit at the time it adopts the policy, and 0 for all times before the adoption takes place.
Examining events across state-years is called a monadic EHA. However, monadic EHAs are limited in their ability to account for interdependence between units. The model itself treats observed units as independent observations, and interdependence is captured by predictor variables that purport to measure the relationship between units (e.g., proportion of geographic neighbors who have adopted the policy). Scholars consequently developed dyadic EHA to better account for how the interactions and shared characteristics between states affect policy diffusion (Boehmke Reference Boehmke2009b; Bricker and LaCombe Reference Bricker and LaCombe2021; Gilardi Reference Gilardi2010; Pollert and Mooney Reference Pollert and Mooney2022; Volden Reference Volden2006). In a dyadic EHA, each unit of analysis is a dyad-year, where a dyad is a pair of units. The dependent variable in the dyadic design measures policy convergence; it takes the value of 1 when unit B’s policy moves toward unit A’s. The structure of the dependent variable in the dyadic design brings the advantage of modeling diffusion itself and requires a shift in how researchers interpret the findings.
EHA methods carry several assumptions. The EHA assumes that the risk set – which is the set of political units that have a chance of experiencing an event at a given point in time – changes as jurisdictions experience the event. Typically, no unit is at risk until at least one unit has experienced the event. Thus, the dataset starts in the year that the first unit adopted the policy. In the monadic design, the risk set shrinks as units adopt the policy because they are no longer included in the dataset for all years after they adopt the policy. In the dyadic design, the risk set should shrink as both units in a dyad adopt the policy, but also should not include any dyads where neither unit has adopted the policy (Boehmke Reference Boehmke2009b) as there is no opportunity for policy spread between jurisdictions to take place if neither has adopted the policy.
Although, operationally, the dependent variable is a dichotomous observation of events among the units in the risk set, the EHA assumes that the unobserved dependent variable is the hazard rate or the probability that units in the risk set experience the event at a particular point in time. Under this assumption, a panel logit or probit estimator is often employed to estimate the effect of the predictor variables on likelihood policy adoption over time, but additional steps must be taken to model the baseline hazard, such as linear, quadradic, and cubic time indicators (Beck, Katz, and Tucker Reference Beck, Katz and Tucker1998; Buckley and Westerland Reference Buckley and Westerland2004; Carter and Signorino Reference Carter and Signorino2010). One could also model the hazard rate using continuous-time parametric models, such as the Weibull, or non-parametric models, such as the Cox proportional hazards (see Jones and Branton Reference Jones and Branton2005), each of which carries different assumptions about the shape of the hazard rate. Cox models have become more prevalent over time (Gordon-Rogers Reference Gordon-Rogers2025; Mallinson Reference Mallinson2020), at least in part because researchers do not have to make explicit choices about the shape of the baseline hazard.
Because of its advantages, EHA quickly became the method of choice for policy diffusion scholars, and diffusion studies proliferated. As the field has developed, the EHA methods employed have evolved to become more flexible and sounder. Developments in the EHA methodology include how to measure external influences in the monadic data structure (Mallinson Reference Mallinson2021c; Mooney Reference Mooney2001); how to properly model the baseline hazard when using logit estimators (Beck, Katz, and Tucker Reference Beck, Katz and Tucker1998; Carter and Signorino Reference Carter and Signorino2010); how to adapt the model for repeated events (Box-Steffensmeier and Zorn Reference Box-Steffensmeier and Zorn2002) or policies with multiple components (Boehmke Reference Boehmke2009a); how to account for changes in the baseline hazard rate over time (Box-Steffensmeier and Jones Reference Box-Steffensmeier and Jones2004), right-censoring (Hays, Schilling, and Boehmke Reference Hays, Schilling and Boehmke2015), and non-independence across observations in dyadic models (Gilardi and Füglister Reference Gilardi and Füglister2008); and how to explicitly model multi-state transitions (Metzger and Jones Reference Metzger and Jones2017) and properly define the risk set at each point in time (Boehmke Reference Boehmke2009b).
The newest frontier of development is marrying EHA and network inference to properly model the effect of internal determinants, external influences, and interdependence among units (Desmarais, Harden, and Boehmke Reference Desmarais, Harden and Boehmke2015; Harden et al. Reference Harden, Desmarais, Brockway, Boehmke, LaCombe, Linder and Wallach2023; LaCombe and Boehmke Reference LaCombe, Boehmke, Curini and Franzese2020). Paired with pooled datasets, which include event history data from hundreds of policies (e.g., Boehmke et al. Reference Boehmke, Brockway, Desmarais, Harden, LaCombe, Linder and Wallach2020), network event history analysis has the potential to fulfill the promise of EHA methods first introduced by F. S. Berry and Berry (Reference Berry and Berry1990) to fully and accurately model diffusion processes across political units.
Cure, or split population, survival models would be another option for estimating policy diffusion models. Cure models remove the assumption that all right-censored units will inevitably experience the event (Amico and Van Keilegom Reference Amico and Van Keilegom2018). They explicitly incorporate estimation for the probability that an observed unit will be cured or not cured, meaning that we can receive predictions for whether a unit will never adopt a given policy. Cure models yield less biased parameter estimates and better estimation of the baseline hazard function when some censored observations will never experience the event. While perhaps an approach that should be used more by policy diffusion researchers, the model is still subject to the prospect that additional adoptions in an expanded observation window will alter the results. In our minds, this goes back to the fundamental debate between Walker (Reference Walker1969) and Gray (Reference Gray1973) about the nature of policy innovation. While there are systematic predictors of adoption that broadly apply across very different policies (Mallinson Reference Mallinson2021c), individual policies do not always cascade in the same predictable ways. Meaning, a cure model will yield a prediction of which states or counties may never adopt a policy based on a set of covariates provided by the researcher; however, this does not mean that “cured” units will not in fact adopt, especially as the politics of adoption may change in the unobserved time window (i.e., later stages of the diffusion lifecycle). Should “cured” units adopt, subsequent EHA results based on an expanded observation window could differ considerably. Though spatial temporal models are more common than EHA in the international diffusion literature (Ward and John Reference Ward and John2013), they still may only capture a partial diffusion history.
The literature provides a bounty of methodologies building on F. S. Berry and Berry’s (Reference Berry and Berry1990) pioneering work, and rich theoretical development about diffusion mechanisms and the diffusion lifecycle. But the lack of attention to the implications of the number of adopters for one’s study leaves a critical question unanswered: When is the right time to do a diffusion study? That is, does the number of adoptions affect the conclusions one might make about what is driving diffusion? It is not our intention to answer this question by proposing a new methodology. Rather, we aim to point scholars to a better understanding of the consequences of when they choose to do a diffusion study. We believe that forethought on this point will lead to the selection of appropriate methods and a better explication of the implications of one’s findings. Moreover, such context will aid other researchers in better understanding how the literature fits together.
Data and methods
To consider the question of to what extent expanding adoption sets affect the results of policy diffusion studies, we conducted iterative EHA modeling of policies that have been adopted by most of the American states. SPID offers the broadest and most complete large dataset of policy innovation adoption data currently available for any type of government jurisdiction (Boehmke et al. Reference Boehmke, Brockway, Desmarais, Harden, LaCombe, Linder and Wallach2020). There is no comparable large dataset at the international or local levels. Using this dataset, we extracted all 83 policies that were adopted by at least 42 states and began diffusing in 1964 or later. We considered several potential thresholds for “full” adoption of innovations. Only using innovations adopted by all states would be unnecessarily restrictive. Forty-two adoptions provided a robust sample, and the results do not change substantially if using smaller samples from cutoffs of 43–46 adoptions. The first adoption year restriction is motivated by limitations in key measures of common independent variables, including legislative professionalism (Squire Reference Squire1992) and state ideology (W. D. Berry et al. Reference Berry, Ringquist, Fording and Hanson1998), that are included in the EHA models. The chosen policies also needed to have a full adoption window of at least five years, so there would be sufficient observations for estimating the logistic EHAs.
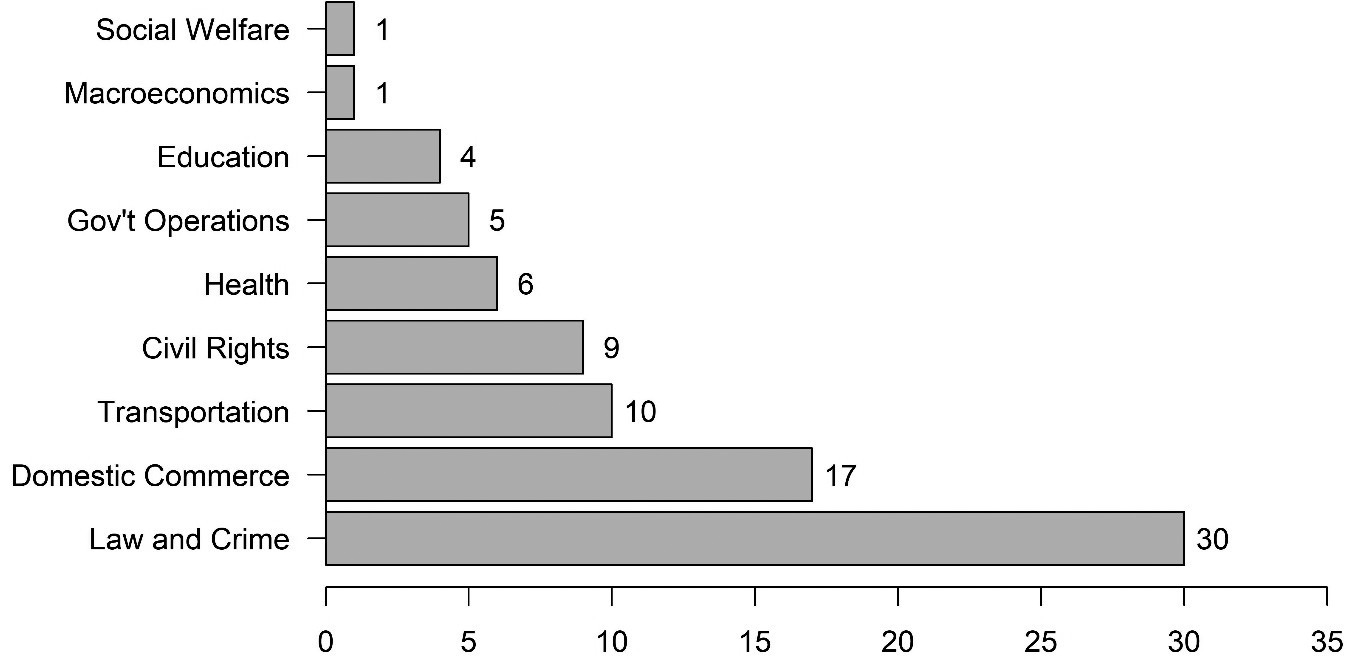
Figure 1 shows the major policy topics represented in this sample of 83 policies. The specific policies captured in this sample are quite diverse. They range from abortion restrictions to revisions of state commercial codes, health insurance portability, identity theft, and more. Eighteen of the policies were adopted by all 50 states, 14 were adopted by 49 states, 14 were adopted by 48 states, 7 were adopted by 47 states, 4 were adopted by 46 states, 7 were adopted by 45 states, 5 were adopted by 44 states, 9 were adopted by 43 states, and 5 were adopted by 42 states.
Count of major policy topics in State Policy Innovation and Diffusion (SPID) sample.

Iterative EHA
Using this sample of 83 policies, we conducted a series of iterative EHA models for each policy.Footnote 2 Taking the full observed adoption window for each policy, we began by identifying the fifth year that adoptions occurred for the policy. This was done to balance the fact that in any smaller window, the coefficient estimates and p-values varied massively for most analyses and, for some policies, the logistic regressions encountered perfect separation. Beginning with the first five states of the full adoption history, we estimated an EHA with a common set of predictor variables (discussed below) using logistic regression. We then run the same model over and over again, adding observations for each subsequent year that experience adoption(s). This continued until the full observed diffusion window was included. To use state lotteries as an illustration, the first EHA model included the years 1964–73, with New Hampshire (1964), New Jersey (1971), Michigan (1972), Massachusetts (1972), and Maryland (1973) included as adopters. A logistic regression EHA was estimated, and the results for the independent variables were stored. The next iteration stopped in 1974 with the addition of Maine. Another logistic regression for 1964–74 was estimated, and the results were stored. This process continued until the last observed year of 2013. By that year, 44 states had observed adoptions in the dataset. For each model estimated, the coefficients, standard errors, p-values, and total number of adopters were stored. For the other 82 policies, the start and end dates will vary depending on the first year a policy was adopted and the final observation included in SPID.
Policy diffusion models tend to contain both predictors that are common to many diffusion analyses – neighbor adoptions, state ideology, legislative professionalism, party control, economic indicators, and more – plus predictors that are specific to the context of the observed innovation (Mallinson Reference Mallinson2021a). For example, an EHA of human papillomavirus vaccine legislation includes predictors such as National Institutes of Health grants per capita by state (Bromley-Trujillo and Karch Reference Bromley-Trujillo and Karch2021). Because of the broad nature of our iterative EHA sample, we include independent variables used by Mallinson (2021c) in a previous pooled EHA of SPID data. Those variables include the proportion of neighbors adopting (F. S. Berry and Berry Reference Berry and Berry1990), relative ideology of past adopters (as measured by Cruz-Aceves and Mallinson Reference Cruz-Aceves and Mallinson2019), the percentage of total congressional hearings each year,Footnote 3 an indicator of whether a state had the direct initiative (Boehmke and Skinner Reference Boehmke and Skinner2012), and index of initiative qualification difficulty (Bowler and Donovan Reference Bowler and Donovan2004), an indicator of divided government (Klarner Reference Klarner2003), legislative professionalism (Squire Reference Squire1992), state per capita income (logged), state population (logged), and a count of years since the first adoption to address duration dependence (Beck, Katz, and Tucker Reference Beck, Katz and Tucker1998; Buckley and Westerland Reference Buckley and Westerland2004). Unlike Mallinson (2021c), we did not include the policy-level measures of salience or complexity because the adoption data are not pooled across multiple policies. These are all single-policy EHAs.
Notably, we are not claiming that these are fully and correctly specified models for each policy. They lack the contextualized variables that are common in diffusion models. They apply a common approach to accounting for duration dependence, though the choice of approach would normally be based on model fit for an individual model (Buckley and Westerland Reference Buckley and Westerland2004). Thus, any estimates presented are not to be considered “results” for any given policy. Rather, the intent is to examine how much estimates can change as the window of observation changes.
In the following, we focus on the stored coefficients and p-values for external determinants of policy diffusion common in the literature: neighbor adoptions and relative ideology to past adopters. We display the changes in both the coefficients and the p-values as the sample of observed adopters grows for each policy. We expect that results to be highly sensitive when sample sizes are smaller (i.e., there are few observed adoptions and many observed non-adoption state-years) but become more stable as the sample sizes grow. Moreover, while we expect the same behavior among estimates of the internal adoption determinants, we chose to focus on external because they are meant to capture the presence of some interdependency among states that suggests diffusion is occurring.
Results
Neighbor adoptions
Figures 2 and 3 show the substantial variation in the estimated coefficients and p-values for the effect of neighbor state adoptions on the likelihood of innovation adoption by a given observed state. Figure 2 plots the coefficients for all 83 single-policy EHA models. They are plotted based on the total number of adopting states represented in each iteration of model estimation. We would expect that as more observed adoptions are added to the models, the estimated coefficients would stabilize, though their specific value would vary across policies. It is notable that five coefficients appear to drop off the bottom of the figure. That is the case because they have exhibited very large negative values (≈ −100) when their EHA models are estimated with only a handful of adopting states. Because the point is not to offer a substantive interpretation of the estimated effects, the raw log-odds coefficients are plotted instead of a more typical quantity of interest (e.g., odds ratios). Notably, there appear to be substantial changes in estimated coefficients when fewer than approximately 20 adoptions are included in a model. Sign-switching is limited (i.e., coefficients jumping above and below the zero line), but it does occur. While the estimates themselves appear to level off after observing roughly 20 adopting states, Figure 2 does not give a sense as to whether the coefficients are statistically significant.
Estimated coefficients for proportion of neighbors previously adopting.

p-Values for proportion of neighbors adopting variable.

While norms of model interpretation are slowly changing in political science (McCaskey and Rainey Reference McCaskey and Rainey2015), null hypothesis testing and reliance on “magnitude-and-significance” remain prevalent. Moreover, a lack of effect for external variables like neighbor adoptions that imply inter-governmental interdependencies that are crucial – though perhaps not sufficient (Volden, Ting, and Carpenter Reference Volden, Ting and Carpenter2008) – for making a credible case of diffusion can make publishing such findings difficult (Mallinson Reference Mallinson2021a). Thus, we now examine how p-values change throughout the EHA iterations. Again, our initial expectation was that they would tend to be large when there were few observations, but would decline and stabilize as more adoptions were added. This relates to expected increases in precision in estimating the coefficients as the sample size grows. This proved to be completely wrong. First, of the 83 innovations included in the analysis, only 22 (27%) had at least one iteration where neighbor adoptions reached a conventional level of statistical significance (p < 0.05). This is not completely unexpected, given not all mechanisms driving innovation adoption are reliant on contiguous neighbors, and the neighbor adoption measure is only roughly in capturing diffusion (W. D. Berry and Baybeck Reference Berry and Baybeck2005).
But even the results of significance are stark in their chaos. The 22 policies with at least one iteration yielding a statistically significant (p < 0.05) coefficient for neighbor adoptions are plotted in Figure 3. We can classify the relationship between the expansion of the observed window of diffusion and resulting p-values into three categories: decline and stable, increase and stable, and unstable. Figure 3 uses dark lines to illustrate exemplar policies for each of these categories. The first is the classic example of lotteries, but with adoption data updated through 2013. While in the first model iteration, neighbor adoptions did not yield statistical significance, the p-value dropped well below 0.05 in the second iteration and remained stable. Tying back to the findings in Figure 2, the coefficient also generally stabilized around 3, though it did steadily shrink as the observation window expanded beyond 1988 – just after the end of Berry and Berry’s original analysis. The second exemplar is states adopting greater penalties for shoplifting (Boushey Reference Boushey2016). The p-value for neighbor adoptions only drops below 0.05 in the second model iteration, but then steadily climbs to above 0.9. For both types of policies (and specifically this variable), the estimated effect is not sensitive to the width of the observation window and the number of adopters.
Perhaps of greater concern is the unstable category. The final exemplar in this category is state protections of victims of sex crimes during criminal proceedings (Boushey Reference Boushey2016). The first iteration, which includes 30 adopting states, yields a p-value greater than 0.05, but it then drops below 0.05 before rising above 0.05 with 40 adoptions and steadily declines again and falls below 0.05 in the final model that has 48 adopters. Moreover, the log-odds coefficient, which is consistently negative, is double the size during the period when the p-value is below 0.05, and it is halved for the rest of the period when the p-value is greater than 0.05. With the standard errors remaining stable, this is why the p-value changes as it does. What this means for diffusion researchers, however, is that the estimate and interpretations of its statistical significance are highly sensitive to the observation window.
Relative ideology
We turn now to considering a measure of diffusion that is increasing in prevalence: relative ideology. Figure 4 demonstrates that there is some variation in the estimated log-odds coefficients, though they are more stable across the entire window of observation than neighbor adoptions. There is some, though little, sign switching. Figure 5, however, reveals the same chaos in calculated p-values. We also find the same three categories of changes in statistical significance. The Child Custody Jurisdiction and Enforcement Act is stable in demonstrating statistical significance, regardless of the sample size. The ideological pathway is not statistically significant for state anti-hazing laws, becomes significant when there are 16–19 adopters, and then becomes not significant again. Finally, state living will laws show statistical significance for relative ideology in the first two iterations, but then the p-value consistently grows as more adoptions are added.
Estimated coefficients for relative ideology of previous adopters.

p-Values for relative ideology of past adopters.

We replicated each of the above analyses using Cox Proportional Hazards modeling, which has become more popular in diffusion studies. Figures 2–5 are replicated in the Supplementary Material, which shows very similar results to those discussed above. Meaning, simply using the Cox model instead of logistic regression does not change our findings.
Discussion and conclusions
The study of policy innovation and diffusion is large and crosses all fields in political science (Graham, Shipan, and Volden Reference Graham, Shipan and Volden2013). Hundreds of diffusion studies have been published at all levels of government – local, subnational, national, and international (Maggetti and Gilardi Reference Maggetti and Gilardi2016; Mallinson Reference Mallinson2021a). We herein consider EHA, one of the most prevalent quantitative approaches to modeling policy diffusion. While we cannot expect every policy innovation to spread to all possible governments, many scholars have estimated diffusion models while policies are still being considered and adopted by governments. Moreover, there is evidence that the determinants of policy innovation adoption change as policies diffuse. These observations led to the seemingly simple question: When is it the right time to do a policy diffusion study?
The results of our iterative EHAs demonstrate the sensitivity of EHA findings to the window of observation. Specifically, the results show that the conclusions one makes about what drives diffusion, including the impact of commonly used external determinants like geographic neighbor adoptions and relative ideology, depend on when one undertakes the diffusion study. For these two common measures of inter-state diffusion used in EHA models, we found three categories of estimate stability. Some estimates are consistently statistically significant at conventional levels (p < 0.05), some either trend towards or away from significance as the observation window widens, and some are highly sensitive to which states are included in the analysis. The latter are perhaps the most concerning, given the high degree of sensitivity to the sample. Of course, there is also a fourth category: the many EHA models we estimated where the effects of either geographic or ideological neighbors were never statistically significant. Moreover, while they may be better at specifying diffusion dynamics, other approaches, such as network EHA, cure models, and Cox models, are also susceptible to these same issues, even if they have features that help reduce estimate instability/bias. If they use partial adoption histories, they will likewise be capturing only one part of the diffusion life course. Additional observations, especially in less predictable cascades, can fundamentally change the results of subsequent replications with larger observation windows.
This is evidence that caution should be taken when making conclusions about the role of previous adoptions by either geographic neighbors or ideological peers in shaping policy diffusion. Rather than exhibiting volatility only at low numbers of adoptions, the coefficient estimates and p-values for both variables were quite volatile throughout the diffusion process. Both were quite sensitive to the number of adopters as they, fundamentally, define a condition based on which states have previously adopted and how many. Each additional adoption thus changes the condition. Further, theoretically, both measures are ambiguously tied to diffusion mechanisms (Shipan and Volden Reference Shipan and Volden2006, Reference Shipan and Volden2008). For neighbor adoptions, it is sometimes used to measure learning, sometimes competition, and sometimes to capture multiple diffusion mechanisms (Maggetti and Gilardi Reference Maggetti and Gilardi2016). Ideological adoption can represent political learning among states with similar voting populations, or it can signal ideological conformity that goes beyond seeking electoral success (Grossback, Nicholson-Crotty, and Peterson Reference Grossback, Nicholson-Crotty and Peterson2004; Mooney Reference Mooney2021). Studies that do not provide firm theoretical grounding for what these variables represent, nor justification for why the study was undertaken when it was, in terms of the number of adoptions observed, and that make generalized conclusions about the role of geographic neighbors or relative ideology in shaping diffusion, should be met with skepticism.
Moreover, this raises the same concern for other key internal determinants. While we focused on external diffusion pathways, the impacts of internal forces such as legislative professionalism, wealth, and partisan control of government also vary across the diffusion lifecycle (Mallinson Reference Mallinson2021b) and variation in estimated effects depending on the observed adoption window. Thus, the findings are of broader importance than just these two specific variables. It raises questions about generalizable conclusions across the many single-policy studies that have been published and those left in the desk drawer.
That said, our results should not be read as questioning the entire body of knowledge on policy diffusion. However, they suggest that caution should be taken in making generalized conclusions about policy diffusion. Ultimately, a study’s results may depend on whether adoption has stabilized. While adoption by laggard states may always be theoretically possible for any innovation that has not completely diffused, they do tend to reach some point of relative stability. That is when a cure model would be perhaps most useful, once a true plateau in adoptions has been reached. But it is hard to predict when that will happen, and no universal rule can be established based on the results herein. If, perhaps, the goal of one’s research is to better understand the influences of innovation and early adoption, then one must be very clear that one cannot conclude general effects from the findings, but only those specific to the context of early adoption. Essentially, greater thought and humility are needed when presenting the results of diffusion models for policies that have not spread completely, regardless of whether EHA or another method is used. Authors should be more explicit in discussing the trajectory of the innovation they are modeling and how that may affect the interpretation of their results.
Our main argument based on these results is that single-policy diffusion studies should be conducted and interpreted with care. Let us be clear that we are not suggesting that it is only worth modeling policy innovations that have fully diffused or even plateaued. In fact, doing so could exacerbate the potential pro-innovation bias of diffusion results (Karch et al. Reference Karch, Nicholson-Crotty, Woods and Bowman2016). There is no clear guideline for when a diffusion history is “complete,” nor is there a specified minimum number of states required to conduct a diffusion analysis. Certainly, from a statistical perspective, there are greater concerns of bias from modeling rare events if only a small number of adoptions are included. That said, earlier examinations of diffusion processes can be valuable, and updating models with larger windows of observation over time can likewise be valuable. For example, a researcher may want to understand what is driving innovation and early adoption of a policy. While perhaps less common, one may want to compare the diffusion of similar policies of varied completeness to know why one policy caught on and the other did not. Or perhaps to ask why a policy incompletely diffused, stalled, and recovered to spread more broadly, like Right to Work legislation. Further, intrinsically important policy cases, such as the development and diffusion of artificial intelligence policies, should be studied throughout their lifecycle. What we are arguing is that authors need to be thoughtful and clear about where an innovation stands, and that general conclusions about diffusion determinants should not be drawn from incomplete single-policy diffusion histories. In sum, single-policy diffusion studies can be useful, but their contribution must be clearly rooted in data.
The implications of these findings are not limited to single policy EHAs. Diffusion research has moved toward using pooled event history analyses that employ information on thousands of policy adoptions across hundreds of policies (Boushey Reference Boushey2016; Kreitzer Reference Kreitzer2015; Mallinson Reference Mallinson2021c). But even pooled analyses estimate average effects of independent variables on the risk of policy adoption using policies with as many as 50 adoptions and as few as 1 (e.g., Boehmke et al. Reference Boehmke, Brockway, Desmarais, Harden, LaCombe, Linder and Wallach2020), and at least some are incomplete, such as those tracking the diffusion of model bills from the Uniform Law Commission. The degree to which incomplete policy cascades are included could affect the conclusions, although these low-N, incomplete cascades should have less influence on the estimates than observations of large-N, complete cascades, since there are fewer adoptions usually over shorter periods of time. Nevertheless, scholars employing pooled analyses should also keep these caveats in mind when making conclusions about policy diffusion, as our knowledge of policy diffusion is still limited by incomplete observation of the universe of policy cascades (see also Karch et al. Reference Karch, Nicholson-Crotty, Woods and Bowman2016; Volden Reference Volden2016).
The implications of our findings for pooled analyses reinforce Kreitzer and Boehmke’s (Reference Kreitzer and Boehmke2016) recommendations for pooled EHA. They recognized that complete pooling across so many different and unique policies could lead to incorrect estimates. As a solution, Kreitzer and Boehmke (Reference Kreitzer and Boehmke2016) recommend using multilevel modeling with random intercepts, or partial pooling, which allows the model to account for heterogeneous effects across policies while estimating common effects.
Moreover, this elevates the need for more systematic meta-analysis in diffusion studies. Some such studies have been useful at raising measurement concerns (Maggetti and Gilardi Reference Maggetti and Gilardi2016) and trying to understand the general model of policy diffusion using the body of smaller studies (Mallinson Reference Mallinson2021a). However, the results of our analysis here also sound the alarm about how what we know about policy diffusion could be biased by the “file drawer problem” (Franco, Malhotra, and Simonovits Reference Franco, Malhotra and Simonovits2014). Typically, the file drawer problem concerns unpublished studies that are difficult to publish or abandoned because of null or contradictory effects. Given the sensitivity of results demonstrated in our iterative EHAs, there may be a consequential number of false-positive effects published on policy diffusion, and the file drawer could contain a consequential number of false-negative results, which goes beyond the problem of ignoring null results. Journals have been evolving in their approach to null results, including a few devoting sections of the journal to them (e.g., Political Studies Review). But the space will never be enough to clean out the entire desk drawer. This is why repositories like Social Science Research Network (SSRN) are useful for posting results that may never be published in a peer-reviewed journal. SSRN even experimented with a Negative Results Hub, but it was short-lived.Footnote 4 The American Political Science Association Preprints service could be modified to provide a specific outlet for negative results.Footnote 5 This could be a great service to the discipline and science by getting negative results into the light of day.
Given the size and breadth of policy diffusion studies in political science, and the continued reliance on EHA modeling, the implications of our findings should inform research across the discipline. Diffusion is a cornerstone policy process theory that has been developing for over half a century (Weible Reference Weible2023). Notably, many policy diffusion studies are also published outside the discipline (Mallinson Reference Mallinson2020), and these important methodological questions shape interdisciplinary understanding of innovation adoption. The primary aim of this study is to help us be more honest about what we are finding across the hundreds of diffusion studies that have been published and those that will be. Grappling with these issues and being clearer about the context within which each published study is conducted will serve to push the research forward in a positive and productive way.
Supplementary material
The supplementary material for this article can be found at http://doi.org/10.1017/spq.2025.10012.
Data availability statement
Replication materials are available on SPPQ Dataverse at Mallinson and Jansa (Reference Mallinson and Jansa.2025).
Acknowledgements
The authors thank Bruce Desmarais and audience members at the 2023 American Political Science Association Annual Meeting and the 2023 Conference on Policy Process Research for their input on this article.
Funding statement
The authors received no financial support for the research, authorship, and/or publication of this article.
Competing interests
The authors declared no potential competing interests with respect to the research, authorship, and/or publication of this article.
Author biographies
Daniel J. Mallinson is an Associate Professor of Public Policy Administration at Penn State Harrisburg. His research focuses on policy process theory (principally policy diffusion and punctuated equilibrium theory), cannabis policy, and energy policy.
Joshua M. Jansa is an Associate Professor of Political Science at Oklahoma State University. His research focuses on policy diffusion, state politics, political and economic inequality, and civic education.


 Open access

