


Introduction
Threat of climate change
While birds have adapted to changing climates through evolutionary history, the current rate of climate change, accelerated by anthropogenic forces, presents a unique challenge (Chen et al. Reference Chen, Hill, Ohlemüller, Roy and Thomas2011, Staudinger et al. Reference Staudinger, Carter, Cross, Dubois, Duffy, Enquist, Griffis, Hellmann, Lawler, O’Leary, Morrison, Sneddon, Stein, Thompson and Turner2013). In the interest of facilitating climate adaptation efforts to conserve bird habitat (Warren et al. Reference Warren, VanDerWal, Price, Welbergen, Atkinson, Ramirez-Villegas, Osborn, Jarvis, Shoo and Williams2013), significant effort has been devoted to developing methods for predicting and projecting future areas of climatic suitability (Elith et al. Reference Elith, Phillips and Kearney2010, Owens et al. Reference Owens, Campbell, Dornak, Saupe, Barve, Soberón, Ingenloff, Lira-Noriega, Hensz and Myers2013). Recent studies have projected climate futures of birds in North America, with long-running, repeated survey data (Langham et al. Reference Langham, Schuetz, Distler, Soykan and Wilsey2015). However, in many of the most biodiverse parts of the world, such as South America, datasets of this kind do not exist. Yet, we must attempt to understand the threat that climate change may pose to the region’s birds if we are to make conservation decisions in the face of an uncertain climate future.
Citizen science and gaps
While the type of traditional, strongly-structured repeated survey data common in North America may be lacking from Latin America, efforts are underway to increase the volume and spatial extent of bird observations collected in Latin America through citizen science effort (Ortega-Álvarez et al. Reference Ortega-Álvarez, Sánchez-González, Rodríguez-Contreras, Vargas-Canales, Puebla-Olivares and Berlanga2012, Şekercioğlu Reference Şekercioğlu2012). Particularly, the citizen science project eBird (Sullivan et al. Reference Sullivan, Aycrigg, Barry, Bonney, Bruns, Cooper, Damoulas, Dhondt, Dietterich, Farnsworth, Fink, Fitzpatrick, Fredericks, Gerbracht, Gomes, Hochachka, Iliff, Lagoze, La Sorte, Merrifield, Morris, Phillips, Reynolds, Rodewald, Rosenberg, Trautmann, Wiggins, Winkler, Wong, Wood, Yu and Kelling2014) is working to fill in our knowledge gaps in this part of the world. In the past 10 years, eBird has become the global standard for collecting, storing, and distributing bird observation records generated through citizen science birding efforts. While other biodiversity stores contain significant amounts of presence-only information about species across Latin America (e.g. the Global Biodiversity Information Facility; gbif.org), these resources lack a natural avenue to directly promote data collection, especially from the birding community. Considering the potential power of eBird to facilitate broad scale ecological analysis, such as climate modelling (Hochachka et al. Reference Hochachka, Fink, Hutchinson, Sheldon, Wong and Kelling2012), eBird will likely become the de facto data source for scientific efforts seeking to better understand potential future climates for birds in Latin America. However, in modelling potential future climates, the distinction needs to be made between geographic space and climate space (Owens et al. Reference Owens, Campbell, Dornak, Saupe, Barve, Soberón, Ingenloff, Lira-Noriega, Hensz and Myers2013). While a certain number of eBird observations may cover a particular geographic extent, to understand potential climate futures, an understanding of how well those observations capture unique climate spaces, as described by relevant climate variables, is needed.
Uniqueness of migrants
A group of species that has received research attention in North America of late are long-distance Neotropical migrant birds (Webster et al. Reference Webster, Marra, Greenberg and Marra2005, Martin et al. Reference Martin, Chadès, Arcese, Marra, Possingham and Norris2007), those that primarily breed in the continental United States and Canada during the boreal summer and vacate North America during the boreal winter, migrating long distances to winter in Central and South America. For many of these species, we still lack a complete understanding of movements throughout their full life cycle (but see Marra et al. Reference Marra, Culp and Cohen2014), a gap that needs to be addressed to adequately implement conservation for these species (Small-Lorenz et al. Reference Small-Lorenz, Culp, Ryder, Will and Marra2013). Only recently have the wintering ranges of some species, such as Black Swift Cypseloides niger, been described through the use of geolocators (Beason et al. Reference Beason, Gunn, Potter, Sparks and Fox2012). At the same time, many Neotropical migrants are experiencing population declines (Robbins et al. Reference Robbins, Sauer, Greenberg and Droege1989) and causes on both the breeding and wintering grounds have been implicated (Holmes Reference Holmes2007). Understanding the threats facing these birds on their wintering grounds is difficult considering how poorly we know the wintering ranges of these species, especially cryptic ones (Faaborg et al. Reference Faaborg, Holmes, Anders, Bildstein, Dugger, Gauthreaux, Heglund, Hobson, Jahn and Johnson2010). While we continue to describe the life cycles and migratory connectivity of these species, we should also seek to describe the relationships of these species with climate variables, in an effort to understand what potential threat climate change may pose to Neotropical migrants on their wintering grounds.
Objectives
Recent work (e.g., Langham et al. Reference Langham, Schuetz, Distler, Soykan and Wilsey2015) characterised the potential impacts of climate change on climatically suitable ranges for hundreds of species in North America. However, the analysis was limited to the U.S. and Canada, due to its exclusive use of Christmas Bird Count and Breeding Bird Survey data. Both datasets have extensive coverage in the U.S. and Canada, but not elsewhere. This resulted in the seasonal exclusion of a significant number of long-distance Neotropical migrants that winter primarily in Latin America. Although citizen science monitoring efforts such as eBird may provide the data needed for future evaluations of climate change effects on Neotropical migrants, such analyses are also contingent upon representative sampling of climatic space. We seek to answer two questions. First, how well have citizen science monitoring efforts described the wintering ranges and captured unique climates in Latin America and where is further monitoring effort needed most to address climatic undersampling? Second, can we create a map of monitoring priorities that would improve sampling of climatic space while minimising effort? To answer the first question, we used Mobility-Oriented Parity (MOP), a method for calculating environmental dissimilarity between two regions based on multiple climate variables (Owens et al. Reference Owens, Campbell, Dornak, Saupe, Barve, Soberón, Ingenloff, Lira-Noriega, Hensz and Myers2013), to describe the extent of unique climates captured by eBird. To answer the second question, we simulated additional survey effort in Colombia and contrasted mean and minimum environmental dissimilarity when surveys were positioned based on our MOP analysis relative to sampling in geographic space and a control.
Methods
Species selection
We selected 136 migrant species from the list of 588 species originally analysed by Langham et al. (Reference Langham, Schuetz, Distler, Soykan and Wilsey2015) that depart boreal breeding grounds for Neotropical wintering grounds each year. This was done by comparing the list of 588 to the Neotropical Migratory Bird Conservation Act Bird List (2015; NMBCA) which has defined Neotropical migrants as “Some individuals of the species can be found in Mexico, Caribbean Basin, Central America or South America during the boreal winter (≥ 5% of their boreal winter distribution).” However, the 5% threshold definition included species that have small, limited wintering ranges in northern Mexico. To create a more conservative and cohesive list for our analysis, we further limited our list to select only terrestrial species from the NMBCA list that currently winter primarily south of central Mexico and outside the United States and Canada, while breeding primarily in the United States and Canada, and lack significant resident South American populations. The full list of 136 species can be found in Appendix S1 in the online supplementary material. We added a further 37 species local to parts of Latin America, those that are of particular conservation interest and relevant to Important Bird Areas (Devenish et al. Reference Devenish, Díaz Fernández, Clay, Davidson and Yépez Zabala2009) across the region, to provide contrasting migration and life-cycle strategies when performing analyses.
eBird data selection
Parameters for selecting eBird data for analysis were guided by past studies (Fink et al. Reference Fink, Hochachka, Zuckerberg, Winkler, Shaby, Munson, Hooker, Riedewald, Sheldon and Kelling2010, Sohl Reference Sohl2014). To match our spatial scale of analysis (10 x 10 km grid cell), we selected eBird checklists within 5 km of land in the Western Hemisphere (excluding Greenland), where all observed species had been reported (complete checklists), the duration of observation was greater than five minutes but less than three hours, travelling checklist distance effort was less than 5 km, exhaustive area checklists covered less than 250 ha, and the time of observation was between 05h00 and 20h00. For our analysis, we selected records from 2000 through 2013 and limited our period of winter from 15 December through to 15 February in an effort to avoid missing late migrants in early winter and capturing early migrants in late winter. In addition to gathering positive observations of species, we applied these parameters to all eBird data for selecting checklists as the measure of sampling effort that was the primary input in our MOP analysis.
Descriptive summaries
We compared eBird sampling coverage for our target species with expert knowledge on species wintering ranges. Currently, the most unified source of expert range representation is the Digital Distribution Maps of the Birds of the Western Hemisphere (Ridgely et al. Reference Ridgely, Allnutt, Brooks, McNicol, Mehlman, Young and Zook2003) administered by BirdLife International. While this source is one of the most complete, the distribution maps are hand drawn by experts and have a variable level of resolution across species, such that it is difficult to estimate the effective resolution of the dataset as a whole. We evaluated those areas where BirdLife expert ranges are too restrictive (i.e. high omission error or instances where eBird records exist outside of expert ranges), by comparing the ratio of grid cells with observations outside the expert range to cells with observations inside the expert range. High values suggest expert ranges have high omission error. Low values are more difficult to interpret. They may suggest that expert ranges have high commission error, however it is impossible to distinguish between low occurrence and low detectability within an expert range. This issue also precludes an evaluation of commission error (i.e. whether expert ranges were too broad). In an attempt to identify the least detectable species, we estimated prevalence using eBird data within expert ranges as a rough approximation of detectability by looking at the ratio of grid cells with presences to cells with sampling events, all within inside expert ranges. These prevalence values need to be evaluated judiciously as our estimate of prevalence may be confounded with the relative density of a species and the commission error in the expert range. Finally, as efforts to increase monitoring are often influenced by political factors, we calculated the number of eBird checklists per 1,000 km2 for each country in the Western Hemisphere, as well as the percentage of each country covered by grid cells with eBird observations.
Climate data selection
Thirty-three climate variables were available for both North and South America during the timespan of interest (2000–2014). We dropped variables that were less relevant to the analysis based on our knowledge of birds and the nature of the variable. In general, we favoured relevant seasonal variables over annual variables, selecting those from the winter and/or autumn when available, but also included annual variables, such as relative humidity and precipitation, that are good overall climatic descriptors that will contrast with the seasonal variables. This left us with 18 climate variables (descriptions in Appendix S3).
MOP methods
We used Mobility-Oriented Parity (MOP) to estimate how much of the climate space in the Western Hemisphere (WH) has been sampled by eBird. We selected MOP over other statistical methods that measure environmental similarity between two regions because it estimates similarity across all climate variables included in the model rather than just the one that is most dissimilar (Owens et al. Reference Owens, Campbell, Dornak, Saupe, Barve, Soberón, Ingenloff, Lira-Noriega, Hensz and Myers2013). This provides a more holistic comparison of climate space between regions. In MOP, the projection region is the geographic space into which one plans to project models built with data from a calibration region. In general, the calibration region represents areas/climates that have been sampled, whereas the projection region is the area of interest that is being compared with the areas/climates that have already been sampled. MOP analyses also account for mobility by defining the projection region as surrounding areas that are within relevant dispersal distances for the focal species (Owens et al. Reference Owens, Campbell, Dornak, Saupe, Barve, Soberón, Ingenloff, Lira-Noriega, Hensz and Myers2013).
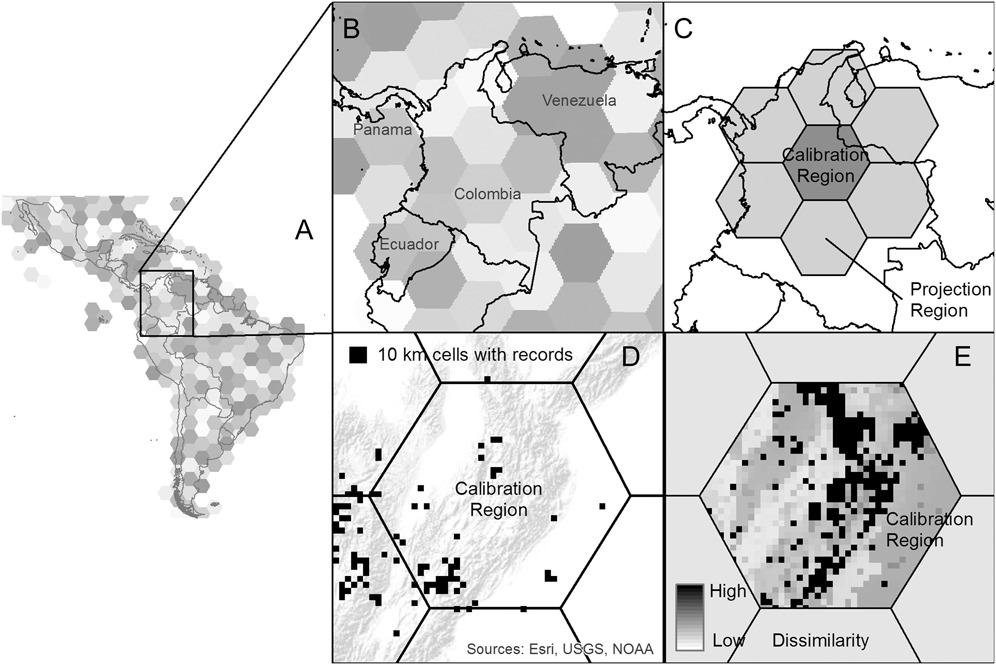
For this study, we segmented the western hemisphere (WH) using hexagons with 250 km sides, to prevent the comparison of climatically similar, yet biogeographically distinct, regions (e.g., the United States and Argentina). To do this, we created a hexagonal grid and for each hexagon, generated “super-regions” that represented the given hexagon and its adjacent hexagons. Accordingly, our calibration regions were the areas in each individual hexagon that included all 10 x 10 km grid cells sampled by eBird between 2000 and 2013, whereas the projection region was all 10 x 10 km terrestrial grid cells within the “super-region” composed of the surrounding hexagons (Figure 1). MOP calculates the multivariate distance between individual points in the calibration region and a subset of points from the projection region. The larger the subset, the more dissimilar the two regions will appear (since the subset is based on those points in the calibration region that are most similar to the projection region). If all points in the projection region are used, MOP gives the mean similarity in climate between regions, comparable to the mean environmental similarity (MESS) between regions (Elith et al. Reference Elith, Phillips and Kearney2010), but across all climate variables (rather than just the most dissimilar one).
Visual explanation of the Mobility-Oriented Parity (MOP) method. This figure: (a) depicts the hexagon partitioning at a hemispheric view, (b) depicts the hexagons in our case study region, Colombia, (c) defines the calibration and projection regions in terms of the hexagon partitions, (d) depicts eBird observations mapped to the 10 km grid within a subset of hexagons (topography in background for context), and, (e) is the MOP output for hexagon 244 in Colombia.
Prior to running the MOP analysis, we formatted the climate data. First, we generated mean annual and seasonal climate data for the WH across the years 2000–2013. These mean estimates for the timespan of interest were then uncorrelated and standardized using principle components analysis in R (function prcomp with the scale parameter set to “TRUE”) (R Core Team 2015). The full dataset covering all terrestrial 10 x 10 km grid cells in the WH, segmented into hexagons represented the projection regions. The full WH dataset was merged with the eBird observation dataset, with the procedure assigning the principle component scores from the projection region to the grid cells surveyed at least once by eBird. This union of eBird and scaled climate data, segmented by hexagons, represented our calibration regions.
The MOP analysis was conducted in R following the method detailed in Owens et al. (Reference Owens, Campbell, Dornak, Saupe, Barve, Soberón, Ingenloff, Lira-Noriega, Hensz and Myers2013), but using a script provided by N. Barve (in litt. 2015), written specifically for conducting MOP analyses with large geographic datasets. Since our interest was in comparing all grid cells with eBird data (the calibration regions) with all grid cells in the “super-region” (the projection region), we set the subsampling proportion to one for both reference and extent datasets and used a value of one for the proportion of points in the calibration region to compare with each grid cell in the projection region. The output of the MOP analysis is a matrix where each row corresponds with a unique grid cell and the similarity between each grid cell and the reference region is recorded in one column. To combine the segmented “super-region” hexagons, where there is overlap among hexagons, we used the minimum dissimilarity value (or the value with the highest similarity). For visualisation, we translate the matrix into a map that depicts the degree of climate dissimilarity between each individual grid cell and the climate in those parts of the Western Hemisphere that have been sampled by eBird.
Case study
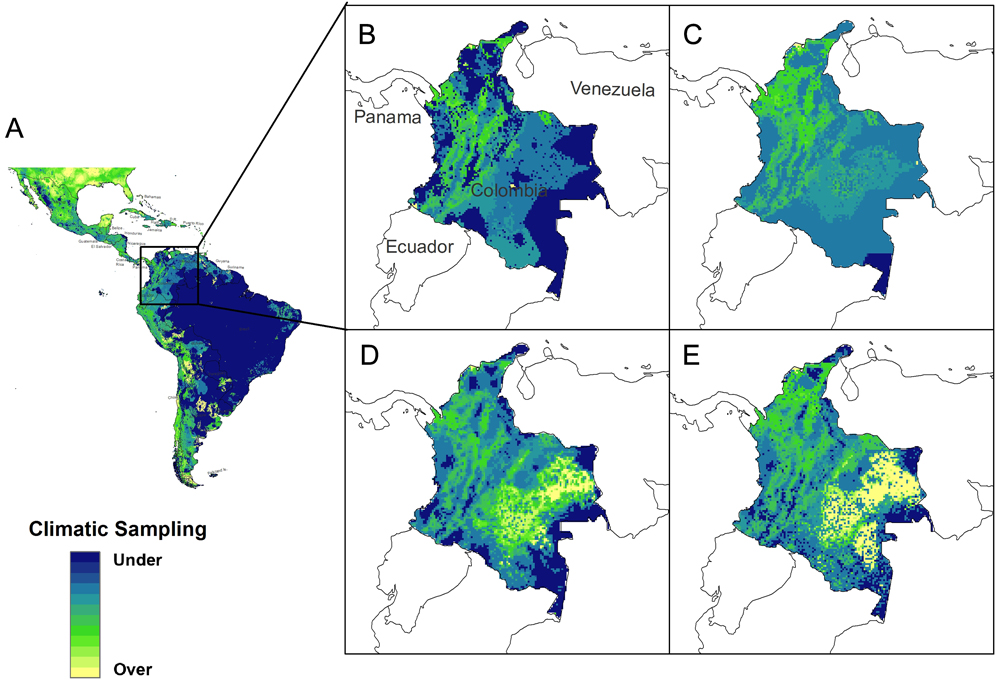
In order to estimate the benefit of the MOP analysis for guiding future data collection by citizen scientists, we simulated additional sampling in a case study focused on Colombia. Colombia is a mega-diverse country (Mittermeier et al. Reference Mittermeier, Robles-Gil and Mittermeier1997) with high topographic diversity. Most eBird checklists have been submitted around the major cities in the Andes. We simulated the addition of 100 eBird checklists, equivalent to a 70% increase beyond the 145 grid cells sampled in our eBird dataset, mapped to the 10-km grid. We then recalculated minimum dissimilarity values for each grid cell in those hexagons that overlapped with Colombia. Simulated checklists were positioned based on three scenarios. The first used the combined dissimilarity map (described above) to assign probabilities to each grid cell for additional sampling. This scenario led to increased sampling in climatically distinct and undersampled regions. The second scenario used a smoothed density map derived from historical checklist submissions to assign additional sampling. The density map was generated with a moving window analysis in which each grid cell was assigned a probability based on the mean sampling density within a 100-km radius. This scenario led to increased sampling within 100 km of historical sampling distributed similarly to historical effort. The third scenario used the same smoothed density map derived from historical checklist submissions, but generated samples in which each grid cell was assigned a probability based on the inverse of the mean sampling density within a 100-km radius. This scenario led to improved geographic coverage by increasing sampling in areas with less historical sampling effort. For all scenarios, additional sampling was only allowed in grid cells not currently sampled. We then compared minimum dissimilarity, averaged across Colombia, between scenarios based on 10 simulated replicates. We calculated grand medians and pooled variances for each simulation and scenario, and used permutation tests with n = 10,000 replicates to test the null hypotheses that median country-level minimum dissimilarity values were similar using the three sampling methods.
Results
Descriptive summaries
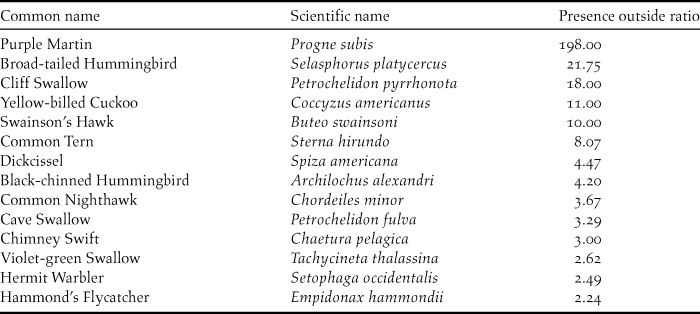
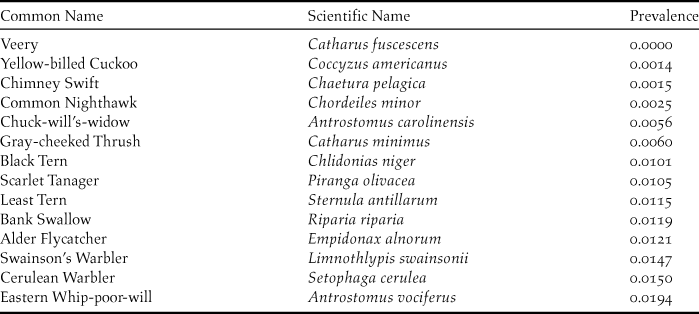
Comparing available eBird data to BirdLife ranges, we looked at potentially restrictive expert ranges, to understand divergence between real data and expert understanding. While the expert ranges of most species either captured well or potentially overpredicted true species ranges, eBird data for 14 of 133 migrant species showed strong disagreement with expert ranges (Table 1). Some of the highest values are likely due to the early onset of migration (Purple Martin Progne subis, specifically), but many likely represent a growing understanding of the true winter range of these species as described by eBird data and not captured in often outdated expert range maps. Additionally, we sought to estimate prevalence, a combination of abundance and detectability, that for species with similar abundance values, will yield an indicator of relative detectability. To estimate prevalence, we evaluated the ratio of grid cells with presences to cells with sampling events, inside the expert ranges. This information can be used to evaluate specific species that may be in need of better wintering grounds descriptions, as a result of poor relative detectability. Table 2 shows the species in the bottom 10th percentile of prevalence values.
Neotropical migrants in the top 10th percentile for the ratio of the number of grid cells with eBird observations outside of BirdLife expert ranges to the number of grid cells with eBird observations inside of BirdLife expert ranges. Population Median = 0.68, Mean = 2.45. Values greater than 1 represent a majority of records outside of the expert range and thus large disagreement between eBird records and expert knowledge, while values closer to 0 represent agreement.
Bottom 10th percentile for prevalence of species in the study, as measured by taking the ratio of grid cells with presences to cells with sampling events inside the expert ranges. Population median = 0.1083, mean = 0.1274.
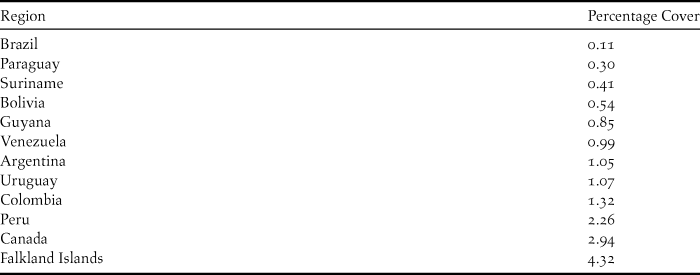
In an effort to aid country-specific monitoring efforts and provide policy developers with useful information, our analysis of eBird observations by country highlights those specific countries most in need of further citizen science monitoring effort. We summarised country-level data as both the number of checklists (meeting our previously described criteria) per square kilometre of the country (Table 3) and as percent of the country covered by grid cells with observations (Table 4). Brazil, Bolivia, Paraguay, Guyana, Suriname, and Uruguay were in the bottom 25th percentile for both metrics. Full lists of these metrics can be found in Appendix S2.
Countries in the bottom 25th percentile of number of complete checklists per 1000 square kilometers. Population median = 28.75, mean = 133.73.

Regions in the bottom 25th percentile of coverage of eBird checklists as measured by the number of grid cells with observations relative to the size of the region. Population median = 26.91, Mean = 40.57.
MOP Results
The MOP results are summarised in Figure 2, which depicts the degree of climate dissimilarity between each individual grid cell and the climate in those parts of the Western Hemisphere that have been sampled by eBird. For mapping purposes, we have assigned no-analog climates (e.g. grid cells with climates that have no analog in the reference area) to the highest dissimilarity category (i.e. dark red areas on the map). The results of the MOP analysis suggest that climate dissimilarity is highest in the following regions: A) parts of Mexico and Central America; B) parts of Colombia; C) the Amazon basin; D) coastal Peru and Chile; and E) northern Argentina.
Results of MOP Analysis as map describing dissimilar climates as places of high monitoring need across Latin America. The color ramp of the map is defined by 10 quantile classes that cover areas of analog climates. Non-analog climates are represented in the quantile class for the climatically undersampled areas.

Case study summaries
Simulating checklists using the dissimilarity map reduced climate dissimilarity across Colombia relative to checklists simulated using either geographic sampling scheme (Figure 3). Across Colombia the median climate dissimilarity, averaged across the 10 simulations, was significantly lower when adding checklists simulated using the dissimilarity map (median dissimilarity = 5.88; SD = 6.83; Figure 3E) than when adding checklists simulated by expanding the existing geographic sampling density (median dissimilarity = 6.65, SD = 4.02; P < 0.0001; Figure 3C). Median climate dissimilarity was also lower when simulating checklists using the dissimilarity map than when adding checklists simulated by prioritizing geographically undersampled areas (median dissimilarity = 6.12, SD = 7.24; P = 0.04; Figure 3D). Median climate dissimilarity did not differ between the two geographic sampling schemes (P = 1.00).
Results of the case study simulating the addition of checklists from Colombia. This figure: (a) climate dissimilarity across Latin America, (b) climate dissimilarity from the hemispheric MOP analysis for our case study region, Colombia, (c) median climate dissimilarity after adding 100 checklists simulated by expanding historical sampling density, (d) median climate dissimilarity after adding 100 checklists simulated by prioritizing geographic areas that were historically undersampled, and (e) median climate dissimilarity after adding 100 checklists simulated using the dissimilarity map.
Discussion
Data availability
We have used Mobility-Oriented Parity (MOP) to approximate climatic sampling, where sampling effort is proportional to the mean similarity between each grid cell and the climate in those areas sampled by eBird. The more dissimilar the climates, the less well sampled the climate space. Based on our method of assessing climatic sampling effort, the map suggests that additional sampling effort is needed to achieve coverage of climatically distinct regions throughout the Western Hemisphere (see Results above for list of regions). The most climatically undersampled regions relevant to Neotropical migrants and the perennially biodiverse tropics are found in areas throughout Latin America. This map of climatic undersampling during the winter season can help identify specific regions that are most in need of additional citizen science observations for climate-related research and can be used to target future monitoring efforts so that we may collectively improve our understanding of the wintering grounds of North American Neotropical migrants. By using the MOP method over simply analysing spatial patterns of sampling, we are able to describe and differentiate, climatically, regions that have been relatively undersampled, as opposed to mere geographic sampling.
Our analysis of estimated species prevalence identifies those species most poorly described by eBird data and we suggest that monitoring efforts should increase in these regions, to achieve good climatic space coverage and to continue exploring areas where the ranges of these species are poorly known. Spatial bias is present in prevalence values, as species that winter in areas of undersampling will have fewer observations than those that winter in well sampled locations. Three species have no winter season eBird observations meeting our criteria earlier described: Mississippi Kite Ictinia mississippiensis, Black-billed Cuckoo Coccyzus erythropthalmus, and Connecticut Warbler Oporornis agilis. Not surprisingly, many of the Caprimulgiformes and other cryptic species, such as Yellow-billed Cuckoo Coccyzus americanus, Swainson’s Warbler Limnothlypis swainsonii, and Gray-cheeked Thrush Catharus minimus, those that have particularly low detectability especially during the wintering season, have the lowest prevalence and are thus excellent candidates for targeting efforts to better understand the wintering grounds of these species. A potential future avenue of work would be to develop species-specific MOP maps that would complement such efforts by highlighting climatic sampling need on a species-by-species level.
Improved monitoring across the Western Hemisphere is needed to complete full-life cycle connectivity knowledge and contribute to improving our understanding of population statuses (Berlanga et al. Reference Berlanga, Kennedy and Rich2010). La Sorte et al. (Reference La Sorte, Fink, Hochachka, Aycrigg, Rosenberg, Rodewald, Bruns, Farnsworth, Sullivan, Wood and Kelling2015) highlight the need for assessments of ecological stewardship responsibilities within protected area networks with international perspective, especially with a focus on the wintering grounds of long-distance migrants to the Caribbean and Central and South America. Protected area networks provide one criterion for prioritising areas to increase monitoring to support both conservation planning efforts and ecological stewardship assessment. Other criteria that could be used to prioritise areas for monitoring include accessibility, climate dissimilarity, or in-country partnerships (the latter also supported by La Sorte et al. Reference La Sorte, Fink, Hochachka, Aycrigg, Rosenberg, Rodewald, Bruns, Farnsworth, Sullivan, Wood and Kelling2015). Accessibility could be approximated using open source road information, such as OpenStreetMap, which often provides more comprehensive road network information in less developed parts of the world (Haklay and Weber Reference Haklay and Weber2008), to estimate the distance from nearest towns and roads. Finally, information on which countries have the lowest spatial extent of complete eBird checklists, such as we have calculated, may be helpful to large-scale monitoring projects seeking to increase efforts in specific counties which currently have difficult to change political and cultural tendencies that have hampered existing monitoring efforts.
Case study
Our case study shows that climate dissimilarity provides valuable information for prioritisation of locations for future monitoring. Focusing citizen science birding efforts on geographic locations with climates that have been poorly sampled in previous surveys will improve our ability to model Neotropical migrant bird populations across their wintering range, and, more generally, better understand how well the climatic spaces of the highly biodiverse tropics have been sampled. Targeting climates that are poorly sampled but spatially extensive may also greatly improve climatic representation for minimal effort. For example, a sampling event in the Amazon Basin, where the climate is relatively homogenous across space, would be expected to affect a MOP analysis more than a sampling event in a heterogeneous area such as Colombia, as seen in our case study.
Conclusions
In this analysis, we have documented the extent of citizen science (eBird) data availability in the western hemisphere using Mobility-Oriented Parity (MOP) methods, describing the similarity in climate between locations with eBird sampling events and those without, for a 10 x 10 km grid of the Western Hemisphere. We found that many regions in Latin America (Central America, Colombia, the Amazon Basin, and northern Argentina) have climates quite dissimilar from those sampled by eBird data, indicating a need for more citizen science monitoring efforts in those locations. By simulating additional sampling effort with the climate dissimilarity product, as opposed to simulation using a geographic patterns, we have shown that we can improve the climatic sampling of species ranges effectively, providing information that can be used to prioritize efforts for developing a better understanding of the climatic relationships for all species. By improving our understanding of climatic relationships on the wintering grounds of migrant birds, we can begin to understand the threat that climate change might pose to these species through their full annual life cycles and complement existing conservations strategies that have until now primarily focused on the northern hemisphere and the breeding grounds.
Supplementary Material
To view supplementary material for this article, please visit https://doi.org/10.1017/S0959270916000265
Acknowledgements
We would like to thank all of the citizen scientists who contributed data to eBird. We also thank Hannah Owens for answering questions related to the analysis and Narayani Barve for providing the R script that allowed us to analyse such a large dataset. This work was supported by the Leo Model Foundation, Inc.



