


I. INTRODUCTION
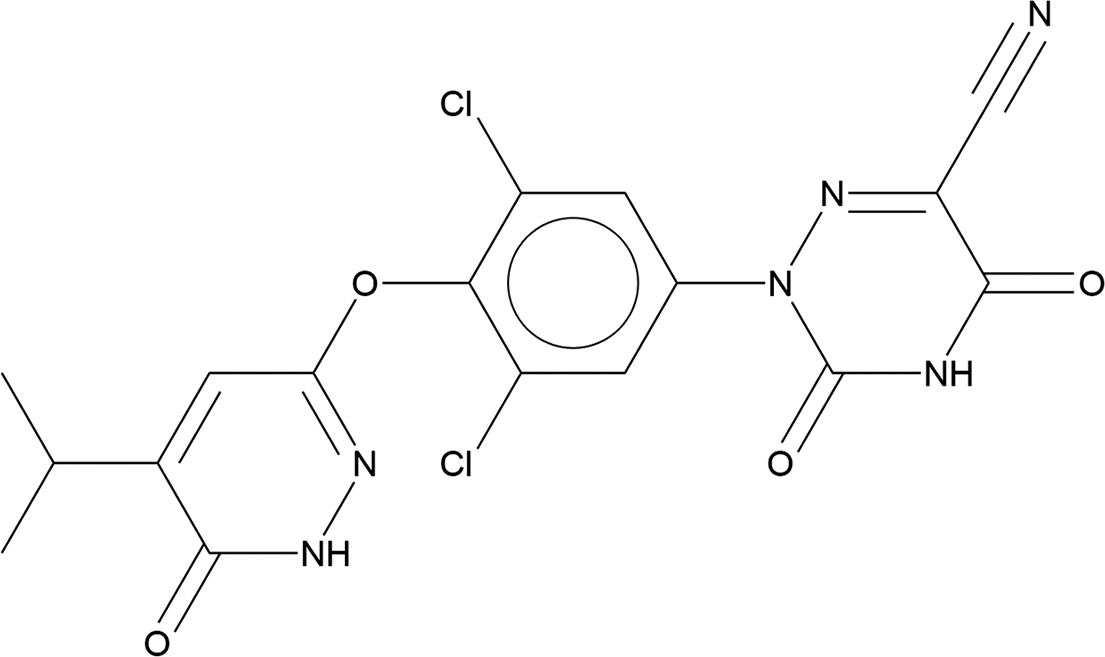
Resmetirom (marketed under the trade name Rezdiffra™) is a thyroid hormone receptor-beta agonist. It is approved by the US Food and Drug Administration (FDA) as the first treatment of liver fibrosis for adults with noncirrhotic non-alcoholic steatohepatitis (NASH). NASH is a progressive liver disease caused by the buildup of fat in the liver, resulting in fibrosis (scarring). The systematic name (CAS Registry Number 920509-32-6) is 2-[3,5-dichloro-4-[(6-oxo-5-propan-2-yl-1H-pyridazin-3-yl)oxy]phenyl]-3,5-dioxo-1,2,4-triazine-6-carbonitrile. A two-dimensional molecular diagram of resmetirom is shown in Figure 1.
The two-dimensional structure of the resmetirom molecule.

Resmetirom Form I is claimed in U.S. Patent 9266861 (Hester et al., Reference Hester, Duguid, Kelly, Chasnoff, Dong, Crow, Choi, Shu and Wang2016; Madrigal Pharmaceuticals and Hoffmann-La Roche), and a powder diffraction pattern is reported. Resmetirom Forms 2–19 (solvates), amorphous resmetirom, and a number of salts and hydrates are claimed in International Patent Application WO 2022/086894 A1 (Lapido et al., Reference Lapido, Goldshtein, Krimer and Rudik2022; Teva Pharmaceuticals International), and powder data are reported. A new crystalline form of resmetirom, Form CSI, is claimed in International Patent Application WO 2021/063367 A1 (Chen and Chang, Reference Chen and Chang2021; Crystal Pharmaceutical [Suzhou] Co. Ltd.), and powder data (no crystal structure) are provided. Thermogravimetric data provided in Example 2 of WO 2021/063367 A1 indicate that Form CSI is a dihydrate. The powder pattern of this study corresponds to Form CSI (Figure 2).
Comparison of the synchrotron diffraction pattern (this study) of resmetirom heminonahydrate Form CSI (black) and the patent diffraction pattern of Form CSI reported by Chen and Chang (Reference Chen and Chang2021) (green). The patent pattern (Chen and Chang, Reference Chen and Chang2021), measured using Cu Kα radiation, was digitized using UN-SCAN-IT (Silk Scientific, 2013) and converted to the synchrotron wavelength of 0.819826(2) Å using JADE Pro (MDI, 2025). Image generated using JADE Pro (MDI, 2025).

This work was carried out as part of a project (Kaduk et al., Reference Kaduk, Crowder, Zhong, Fawcett and Suchomel2014) to determine the crystal structures of large-volume commercial pharmaceuticals and include high-quality powder diffraction data for them in the Powder Diffraction File (Kabekkodu et al., Reference Kabekkodu, Dosen and Blanton2024).
II. EXPERIMENTAL
Resmetirom was a commercial reagent, purchased from TargetMol (Batch #T3595), and was used as received. The orange powder was packed into a 0.5-mm-diameter Kapton capillary and rotated during the measurement at ~2 Hz. The powder pattern was measured at 298(1) K at the Wiggler Low Energy Beamline (Leontowich et al., Reference Leontowich, Gomez, Diaz Moreno, Muir, Spasyuk, King, Reid, Kim and Kycia2021) of the Brockhouse X-ray Diffraction and Scattering Sector of the Canadian Light Source using a wavelength of 0.819826(2) Å (15.1 keV) from 1.6 to 75.0° 2θ with a step size of 0.0025° and a collection time of 3 minutes. The high-resolution powder diffraction data were collected using eight Dectris Mythen2 X series 1K linear strip detectors. NIST SRM 660b LaB6 was used to calibrate the instrument and refine the monochromatic wavelength used in the experiment.
The pattern was difficult to index, suggesting that the sample was not a single phase. After many failures using multiple programs, the successful strategy was to use N-TREOR as incorporated into EXPO2014 (Altomare et al., Reference Altomare, Cuocci, Giacovazzo, Moliterni, Rizzi, Corriero and Falcicchio2013), permitting up to three unindexed lines. The pattern was indexed on a primitive triclinic unit cell with a = 11.29881, b = 15.12763, c = 16.49587 Å, α = 67.695, β = 74.517, γ = 69.701°, V = 2,416.7 Å3, and Z = 4. The space group was assumed to be P-1, which was confirmed by the successful solution and refinement of the structure. A reduced cell search in the Cambridge Structural Database (Groom et al., Reference Groom, Bruno, Lightfoot and Ward2016) yielded one hit, but no structures for resmetirom or its derivatives.
The resmetirom molecular structure was downloaded from PubChem (Kim et al., Reference Kim, Chen, Cheng, Gindulyte, He, He and Li2023) as Conformer3D_COMPOUND_CID_15981237.sdf. It was converted to a *.mol2 file using Mercury (Macrae et al., Reference Macrae, Sovago, Cottrell, Galek, McCabe, Pidcock and Platings2020). The crystal structure was solved by Monte Carlo-simulated annealing techniques as implemented in EXPO2014 (Altomare et al., Reference Altomare, Cuocci, Giacovazzo, Moliterni, Rizzi, Corriero and Falcicchio2013), including a bump penalty on the non-H atoms. Using two resmetirom molecules and four O atoms (water molecules) yielded solutions that contained voids, so the process was repeated with six O atoms. In the best solution (R wp = 15.01%), one of the molecules had an unreasonable conformation, but the second-best solution (R wp = 15.73%) contained two reasonable molecules. Refinement of the O atoms led to one of the O atoms with an occupancy of about 0.25 and too close to the molecules, suggesting that the compound was a hemipentahydrate.
The structure model still contained voids, so the sample was analyzed by NMR. NMR analysis was conducted using a Bruker Avance 400 MHz spectrometer equipped with a multinuclear probe. The 1H NMR sample was assembled in a dry box with rigorously dried NMR tubes using flame-sealed ampoules of d6 DMSO. The 1H NMR spectrum, as displayed in Figure 3, shows the presence of significant water in addition to resmetirom. The symmetrical arene signal at 7.79 ppm, which corresponds to two protons, was then compared to the water signal at 3.34 ppm to estimate the presence of 4.7 water molecules per resmetirom. In addition, the triplet signal at 0.86 ppm combined with a multiplet at 1.24 ppm indicates the presence of an n-C11–C12 aliphatic hydrocarbon. The sample contained ~0.11 n-C11–12 per resmetirom molecule. The powder pattern in Figure 2 indicates that the sample contains a significant amount of an amorphous material; we assume that this phase contains the hydrocarbon. Using the normal rule of thumb of 18 Å3/non-H atom, the unit cell volume of 2,427 Å3 corresponds to 135 non-H atoms per cell. The resmetirom molecule (C17H12Cl2N6O4) contains 29 non-H atoms, so Z = 4 implies 116 atoms per cell. Thus, the cell volume indicates an additional 19 atoms per cell, or resmetirom(H2O)4.75.
1H NMR spectrum of resmetirom heminonahydrate.

To include the water molecules in the structure solution, the structure solution was thus repeated using two resmetirom molecules and nine O atoms (water molecules) as fragments. One of the O atoms was too close to the other atoms, so it was deleted from the model. After initial refinement, two additional O moved too close and were deleted. There were, however, two voids, so O atoms were placed at the centers of the voids and included in the refinement. Density functional theory (DFT) optimization (after recalculation of the H positions) using VASP indicated another void, and a ninth O atom was added to the refinement. Eighteen water molecules per cell resulted in no additional voids, so the compound is apparently a heminonahydrate (4.5 water/resmetirom).
Rietveld refinement was carried out with GSAS-II (Toby and Von Dreele, Reference Toby and Von Dreele2013). Only the 2.0–35.0° portion of the pattern was included in the refinements (d min = 1.363 Å). The absorption coefficient μR was fixed at 0.07. All non-H-bond distances and angles were subjected to restraints, based on a Mercury/Mogul Geometry Check (Bruno et al., Reference Bruno, Cole, Kessler, Luo, Motherwell, Purkis and Smith2004; Sykes et al., Reference Sykes, McCabe, Allen, Battle, Bruno and Wood2011). The Mogul average and standard deviation for each quantity were used as the restraint parameters. The rings were restrained to be planar. The restraints contributed 11.9% to the overall χ 2. The hydrogen atoms were included in calculated positions, which were recalculated during the refinement using Materials Studio (Dassault Systèmes, 2024). The U iso values of the heavy atoms were grouped by chemical similarity. The data did not support refinement of displacement coefficients; some refined too large and others too small. They were fixed at reasonable values. The peak profiles were described using the generalized microstrain model (Stephens, Reference Stephens1999); the coefficients were fixed at values obtained from a Le Bail fit of the pattern. The background was modeled using a six-term shifted Chebyshev polynomial, with peaks at 5.59, 9.57, and 13.68° to model the scattering from the amorphous component of the sample and the Kapton capillary.
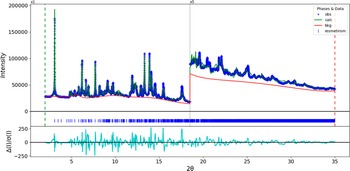
The final refinement of 251 variables using 13,201 observations and 158 restraints yielded the residual R wp = 0.07746. The largest peak (0.50 Å from O93) and hole (2.50 Å from C59) in the difference Fourier map were 0.37(10) and −0.38(10) eÅ−3, respectively. The final Rietveld plot is shown in Figure 4. The largest features in the normalized error plot are distributed among the intensities and shapes of the peaks and at unindexed peaks, which indicate the presence of a trace of at least one crystalline impurity. A Le Bail fit of the pattern (Figure 5) yielded a residual R wp = 0.05672. The residual of the Rietveld fit is 36% larger, so it falls within the acceptable range; if the Rietveld R wp is within a factor of 2 of the Le Bail R wp, the Rietveld refinement is generally considered acceptable.
The Rietveld plot for resmetirom heminonahydrate Form CSI. The blue crosses represent the observed data points, and the green line is the calculated pattern. The cyan curve is the normalized error plot, and the red line is the background curve. The blue tick marks indicate the peak positions. The vertical scale has been multiplied by a factor of 5× for 2θ > 18.5̊.

The Le Bail fit for resmetirom heminonahydrate Form CSI. The blue crosses represent the observed data points, and the green line is the calculated pattern. The cyan curve is the normalized error plot, and the red line is the background curve. The blue tick marks indicate the peak positions. The vertical scale has been multiplied by a factor of 5× for 2θ > 18.5̊.

The crystal structure of resmetirom heminonahydrate Form CSI was optimized (fixed experimental unit cell) with density functional theory techniques using VASP (Kresse and Furthmüller, Reference Kresse and Furthmüller1996) through the MedeA graphical interface (Materials Design, 2024). The calculation was carried out on 32 cores of a 144-core (768 GB memory) HPE Superdome Flex 280 Linux server at North Central College. The calculation used the GGA-PBE functional, a plane-wave cutoff energy of 400.0 eV, and a k-point spacing of 0.5 Å−1, leading to a 2 × 1 × 1 mesh, and took ~37 hours. Single-point density functional theory calculations (fixed experimental cell) and population analysis were carried out using CRYSTAL23 (Erba et al., Reference Erba, Desmarais, Casassa, Civalleri, Donà, Bush and Searle2023). The basis sets for the H, C, N, and O atoms in the calculation were those of Gatti et al. (Reference Gatti, Saunders and Roetti1994), and that for Cl was that of Peintinger et al. (Reference Peintinger, Vilela Oliveira and Bredow2013). The calculations were run on a 3.5 GHz PC using eight k-points and the B3LYP functional, and took ∼5.6 hours.
III. RESULTS AND DISCUSSION
The sample of resmetirom studied here does not correspond to Form 1 marketed by Madrigal Pharmaceuticals, but to Form CSI from Crystal Pharmaceutical (Suzhou) Co. Ltd. (Figure 2). The sample contains at least one crystalline impurity and an amorphous component. The peaks exhibit significant specimen broadening (average microstrain = 2.6%), cover a relatively limited angular range, and exhibit significant texture. Rather than the dihydrate claimed by Chen and Chang (Reference Chen and Chang2021), Form CSI seems to be a heminonahydrate.
The root-mean-square (rms) difference of the non-H atoms in the Rietveld-refined and VASP-optimized structures of resmetirom heminonahydrate Form CSI, calculated using the Mercury CSD-Materials/Search/Crystal Packing Similarity tool, is 0.51 Å (Figure 6). The rms Cartesian displacements of the non-H atoms in the optimized structures of Molecules 1 and 2, calculated using the Mercury Calculate/Molecule Overlay tool, are 0.463 and 0.805 Å (Figures 7 and 8). The agreements are outside the normal range for correct structures (van de Streek and Neumann, Reference van de Streek and Neumann2014). The refined structure has close contacts between Cl44···N51, H30···O42, and two symmetry-equivalent water molecules O84. These close contacts are relieved upon optimization. The rms difference in the absolute positions of the O atoms of the water molecules in the refined and optimized structures is 2.317 Å, with a range of 1.475–3.108 Å. We suspect that the water molecules are at least partially disordered. The asymmetric unit is illustrated in Figure 9. The remaining discussion will emphasize the VASP-optimized structure.
Comparison of the Rietveld-refined (colored by atom type) and VASP-optimized (green) structures of resmetirom heminonahydrate Form CSI using the Mercury CSD-Materials/Search/Crystal Packing Similarity tool. The root-mean-square Cartesian displacement is 0.51 Å. Image generated using Mercury (Macrae et al., Reference Macrae, Sovago, Cottrell, Galek, McCabe, Pidcock and Platings2020).

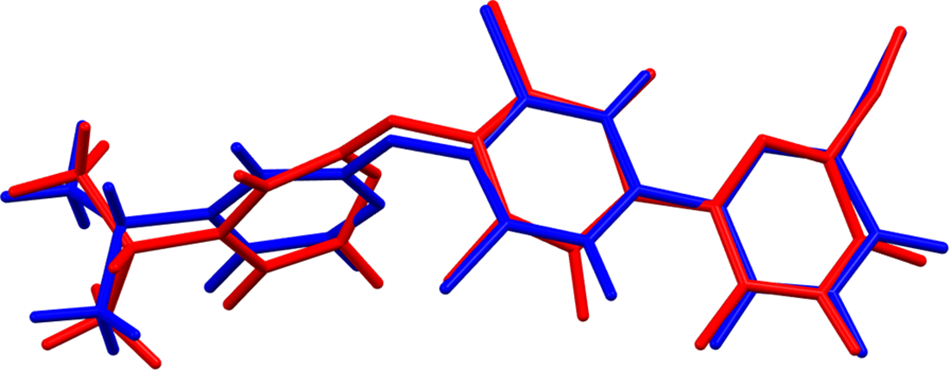
Comparison of the refined structure of Molecule 1 in resmetirom heminonahydrate Form CSI (red) and the VASP-optimized structure (blue). The comparison was generated using the Mercury Calculate/Molecule Overlay tool; the root-mean-square difference is 0.463 Å. Image generated using Mercury (Macrae et al., Reference Macrae, Sovago, Cottrell, Galek, McCabe, Pidcock and Platings2020).

Comparison of the refined structure of Molecule 2 in resmetirom heminonahydrate Form CSI (red) and the VASP-optimized structure (blue). The comparison was generated using the Mercury Calculate/Molecule Overlay tool; the root-mean-square difference is 0.802 Å. Image generated using Mercury (Macrae et al., Reference Macrae, Sovago, Cottrell, Galek, McCabe, Pidcock and Platings2020).

The asymmetric unit of resmetirom heminonahydrate Form CSI, with the atom numbering. Image generated using Mercury (Macrae et al., Reference Macrae, Sovago, Cottrell, Galek, McCabe, Pidcock and Platings2020).

Almost all of the bond distances, bond angles, and torsion angles fall within the normal ranges indicated by a Mercury Mogul Geometry check (Macrae et al., Reference Macrae, Sovago, Cottrell, Galek, McCabe, Pidcock and Platings2020). The C26–N8 bond of 1.440 Å (average = 1.394(14); Z-score = 3.2) and the C29–C27–C28 angle of 120.5° (average = 117.0(11)°; Z-score = 3.3) are flagged as unusual. Torsion angles involving rotation about the C20–N8 and C13–C14 bonds lie on tails of bimodal distributions of similar torsion angles. The conformation of Molecule 1 (lower atom numbers) is slightly unusual.
The two independent molecules have similar general conformations (Figure 10; rms displacement = 0.875 Å), but there are many differences. Quantum chemical geometry optimization of the isolated resmetirom molecules (DFT/B3LYP/6-31G*/water) using Spartan‘24 (Wavefunction, 2023) indicated that Molecule 2 is 0.6 kcal/mol lower in energy than Molecule 1. This difference is less than the expected accuracy of such calculations, so the two conformations should be considered equivalent in energy. The two molecules converge to different local minima (rms difference = 1.256 Å), which have the same energy. The orientations of the three rings and the isopropyl group differ between the minima. The global minimum energy conformation is only 0.3 kcal/mol lower in energy, and has the cyano-containing ring rotated approximately 180°. The conformational surface is thus apparently quite flat, so intermolecular interactions are important in determining the solid-state conformations.
Comparison of VASP-optimized Molecule 1 (green) and Molecule 2 (orange) on resmetirom heminonahydrate Form CSI. The root-mean-square difference is 0.875 Å. Image generated using Mercury (Macrae et al., Reference Macrae, Sovago, Cottrell, Galek, McCabe, Pidcock and Platings2020).

The crystal structure (Figure 11) consists of layers of resmetirom molecules parallel to the bc-plane. These layers are separated by water-rich layers, also parallel to the bc-plane. The water molecule O91 lies within the resmetirom layers. The Mercury Aromatics Analyser indicates one moderate interaction (distance = 5.52 Å) between the dichlorophenyl rings of adjacent molecules, and other weak interactions. The water molecules completely fill the void space between the resmetirom molecules (Figure 12; 20.7% of the cell volume).
The crystal structure of resmetirom heminonahydrate Form CSI, viewed down the c-axis. Image generated using Diamond (Crystal Impact, 2023).

The void volume (probe radius = 1.2 Å) occupied by the water molecules in resmetirom heminonahydrate Form CSI. Image generated using Mercury (Macrae et al., Reference Macrae, Sovago, Cottrell, Galek, McCabe, Pidcock and Platings2020).

Analysis of the contributions to the total crystal energy of the structure using the Forcite module of Materials Studio (Dassault Systèmes, 2024) indicated that the intramolecular energy is dominated by torsion angle distortion terms. The intermolecular energy is dominated by electrostatic attractions, which in this force field-based analysis also include hydrogen bonds. The hydrogen bonds are better discussed using the results of the DFT calculation.
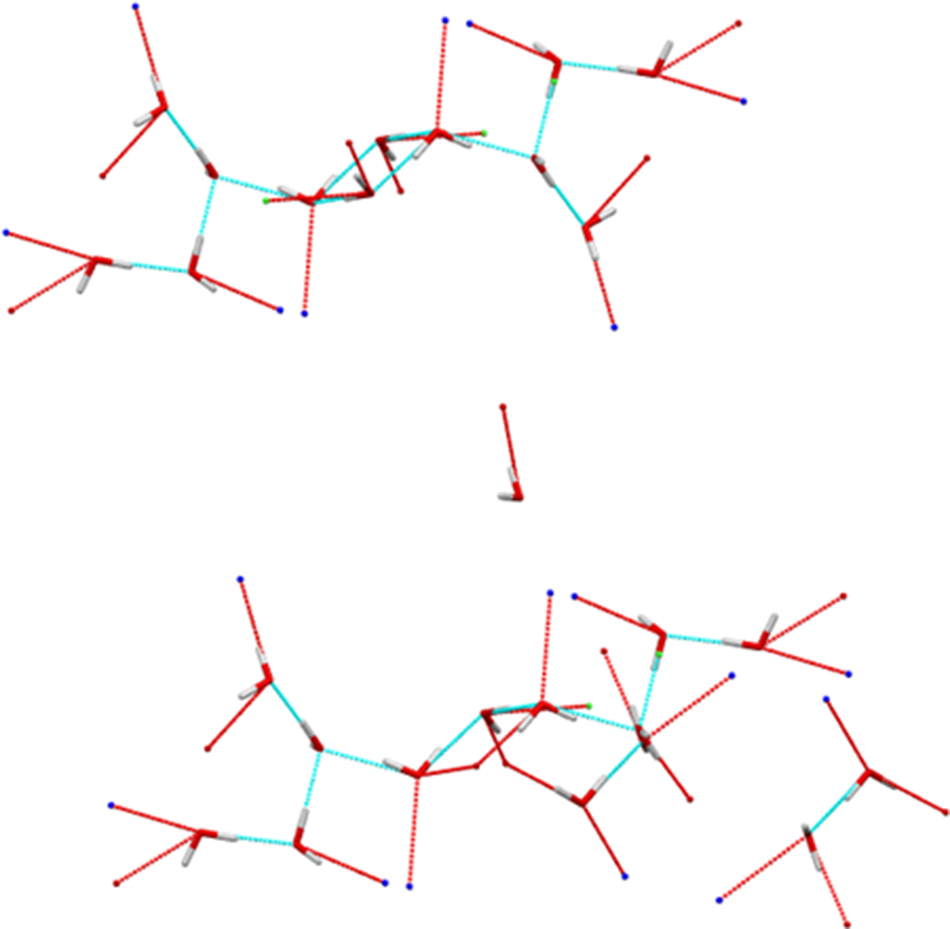
Hydrogen bonds are important in the structure (Table I). There are four types (donor···acceptor): resmetirom···resmetirom, resmetirom···water, water···resmetirom, and water···water. The energies of the O–H···O hydrogen bonds were calculated from the Mulliken overlap populations using the correlation of Rammohan and Kaduk (Reference Rammohan and Kaduk2018), and those of N–H···O using the correlation of Wheatley and Kaduk (Reference Wheatley and Kaduk2019). A strong N49–H80···O4 links the two resmetirom molecules. The equivalent N53–H83 amino group in Molecule 1 acts as a donor to a water molecule O93. A number of C–H···O and C–H···N hydrogen bonds also contribute to the lattice energy. Water molecules act as donors to both O and N in the resmetirom molecules. The structure is more complicated than a hydrogen-bonded framework of resmetirom molecules with water in the pores. The water molecules occupy discrete pockets (Figure 13) and do not form a three-dimensional framework.
Hydrogen bonds (CRYSTAL23) in resmetirom heminonahydrate Form CSI.

* Intramolecular.
The hydrogen bonding of the water molecules in the pockets in the structure of resmetirom heminonahydrate Form CSI. Image generated using Mercury (Macrae et al., Reference Macrae, Sovago, Cottrell, Galek, McCabe, Pidcock and Platings2020).

The Bravais–Friedel–Donnay–Harker (Bravais, Reference Bravais1866; Friedel, Reference Friedel1907; Donnay and Harker, Reference Donnay and Harker1937) algorithm suggests that we might expect elongated morphology for resmetirom heminonahydrate Form CSI, with [100] as the long axis. A sixth-order spherical harmonic model was included in the refinement. The texture index was 1.549(21), indicating that the preferred orientation was significant in this rotated capillary specimen.
DEPOSITED DATA
The powder pattern of resmetirom heminonahydrate from a Le Bail fit to this synchrotron dataset has been submitted to the International Centre for Diffraction Data (ICDD) for inclusion in the Powder Diffraction File. The Crystallographic Information Framework (CIF) files containing the results of the Rietveld refinement (including the raw data) and the DFT geometry optimization were deposited with the ICDD. The data can be requested at pdj@icdd.com.
ACKNOWLEDGMENTS
We thank Adam Leontowich for his assistance in the data collection. We also thank the ICDD team – Megan Rost, Steve Trimble, and Dave Bohnenberger – for their contribution to research, sample preparation, and in-house XRD data collection and verification.
FUNDING STATEMENT
Part of the research described in this paper was performed at the Canadian Light Source, a national research facility of the University of Saskatchewan, which is supported by the Canada Foundation for Innovation (CFI), the Natural Sciences and Engineering Research Council (NSERC), the Canadian Institute of Health Research (CIHR), the Government of Saskatchewan, and the University of Saskatchewan. This work was partially supported by the International Centre for Diffraction Data.
COMPETING INTERESTS
The authors have no competing interests to declare.


 Open access