


1. Introduction
The empirical growth-at-risk (GaR) concept introduced by Adrian et al. (Reference Adrian, Boyarchenko and Giannone2019) suggests that deteriorating financial conditions are associated with increased downside risks to economic growth. While standard forecasts focus on the expected value of future GDP growth, the GaR approach places a particular emphasis on the probability and magnitude of potentially adverse outcomes. Similar to the value-at-risk concept in finance, the GaR of an economy for a given time horizon is defined as a specific low quantile of the distribution of the projected GDP growth rate for the respective horizon. In this context, Adrian et al. (Reference Adrian, Boyarchenko and Giannone2019) show that the left tail of the distribution of (projected) GDP growth is less stable and more affected by financial conditions than the upper quantiles of the distribution. Against this background, the GaR concept is a useful and intuitive policy tool to identify and quantify systemic risk and has therefore gained traction among policymakers in recent years.
In the last few years, the GaR idea has been extended in various directions, for example, adding various risk indicators from the financial cycle literature (see, for instance, Aikman et al., Reference Aikman, Bridges, Hacioglu Hoke, O’Neill and Raja2019) or by examining the term structure of GaR (Adrian et al., Reference Adrian, Grinberg, Liang, Malik and Yu2022). In this context, the GaR framework is used as a composite indicator for systemic risk at the country level and can, therefore, also be taken as an indicator when to activate macroprudential policy measures. Consequently, recent research has also taken into account the impact of various policy instruments on GaR (e.g., Galán, Reference Galán2024). Remarkably, the entire strand of literature has relied entirely on data samples back to the 1970s without taking into account earlier developments in the last century.Footnote 1 This is insofar surprising, as the main objective of macroprudential policy is the prevention of financial crises (or alternatively, the reduction of the costs of such crises if they occur). Since financial crises appear infrequently, as also shown by the widely cited financial cycle literature (Schularick and Taylor, Reference Schularick and Taylor2012; Jordà et al., Reference Jordà, Schularick and Taylor2017), a long time series of the underlying drivers is crucial to capture the tail risks of the variables of interest.
Using long time series, however, raises additional econometric issues. For instance, these time series might be subject to structural breaks in the conditional mean. Such a behavior might reflect changes in key relationships between the conditional distribution of output growth on macrofinancial determinants. When conditioned on a particular quantile, standard quantile regressions (QRs) assume that the regression relationship between a given covariate and the corresponding quantile function is constant, and hence constancy of the parameter is assumed throughout. In this paper, we build on recent papers that show that simple heteroskedastic models perform well (or even better) than QRs (Carriero et al., Reference Carriero, Clark and Marcellino2024; Brownlees and Souza, Reference Brownlees and Souza2021) and propose using a time-varying parameter stochastic volatility regression model (TVP-SV) to capture changes in the relevance of different drivers of upside and downside risks to output growth. We use this framework to analyze an extended data set covering 130 years of macroeconomic data and show that it works well for predicting downside risks to GDP.Footnote 2 After providing evidence that such a model is competitive to standard QRs, we back out the contributions of individual variables over time using state-of-the-art techniques from statistics and machine learning (see, e.g., Crawford et al., Reference Crawford, Flaxman, Runcie and West2019; Woody et al., Reference Woody, Carvalho and Murray2021).Footnote 3 Thus, by applying novel methods to historical data, we are able to draw important policy implications for today’s policymakers.
Our findings provide a comprehensive historical context and several key policy implications. First, we demonstrate that the stability of upside risks to GDP growth observed in previous research is time-specific, to the period of the Great Moderation, with a more symmetric risk distribution prior to the 1970s. Both upside and downside risks to GDP have substantially decreased over time, remaining relatively low since the start of the Great Moderation. We also find that financial stress consistently correlates with higher downside risks, although the magnitude of this effect fluctuates over time, while upside risks remain unaffected by financial stress. Notably, the impact of credit and house price growth exhibit significant temporal variation. Specifically, the effect of credit growth during the Great Depression and the Great Financial Crisis show remarkable similarities, and the negative impact of house prices on growth risks during the Global Financial Crisis was unprecedented. Interestingly, credit growth and house prices drive both downside and upside risks, leading to a wider distribution of expected GDP growth. Our findings enrich the financial cycle literature by examining the entire distribution of expected GDP, thus providing a more comprehensive picture of the drivers and risks of economic booms and recessions over time. This enhanced understanding is crucial for the effective calibration and timing of macroprudential and monetary policy measures.
The remainder of the paper is structured in the following way. The next section fleshes out the data set and econometric methods adopted. Section 3 includes the empirical findings and consists of an out-of-sample tail forecasting exercise, provides quantitative evidence on the predictive distributions of GDP growth, and then proceeds by discussing the key drivers of GaR. The final section concludes the paper.
2. Data and methods
2.1. Data
Our analysis is based on a US data set stretching from 1893Q1 to 2016Q4. Using three different sources, our data includes annualized real GDP growth, a financial stress indicator, the 3-year average growth rate of the credit-to-GDP ratio, and the 3-year average growth rate of real house prices. The real GDP time series is taken from D’Agostino and Surico (Reference D‘Agostino and Surico2012) and updated using FRED data.Footnote 4 The dependent variable is constructed by using the logarithm of real GDP, $Y_t$
, and converting it into the annualized growth rate
$Y_t$
, and converting it into the annualized growth rate $h$
periods ahead,
$h$
periods ahead, $y_{t+h} = \frac{Y_{t+h} - Y_t}{h/4}$
.
$y_{t+h} = \frac{Y_{t+h} - Y_t}{h/4}$
.
In line with previous literature, we include a measure of financial stress as an explanatory variable. However, unlike other financial stress indicators, which are typically based on financial data and start in the 1970s, we use a historical newspaper-based financial stress indicator built by Püttmann (Reference Püttmann2018). As Püttmann (Reference Püttmann2018) notes, the index exhibits a long-run trend; hence, we detrend the time series using a slow-moving Hodrick–Prescott filter with a $\lambda$
of
$\lambda$
of $5 \times 10^6$
.
$5 \times 10^6$
.
While financial stress measures are highly relevant for short-term GaR estimations—at least since the 1970s—credit-to-GDP growth and house prices are frequently used as a signal for medium-term financial imbalances (Aikman et al., Reference Aikman, Bridges, Hacioglu Hoke, O’Neill and Raja2019; Galán, Reference Galán2024). Unfortunately, consistent quarterly data for credit (loans to the nonfinancial private sector) and house prices are not available for such a long time horizon. Therefore, we use data from Jordà et al. (Reference Jordà, Schularick and Taylor2017) and convert the annual data into quarterly by using the quadratic spline of Forsythe et al. (Reference Forsythe, Malcolm and Moler1977). Subsequently, annualized 3-year averages of the log differences of the credit-to-GDP ratio as a measure of credit growth and the 3-year average of the log differences of real house prices as a measure of house price growth are used.Footnote 5
2.2. Growth at risk through the lens of TVP regressions
Downside risks are typically analyzed through QRs (see Adrian et al., Reference Adrian, Boyarchenko and Giannone2019). However, one key shortcoming of QRs is that within a given quantile, they are not capable of capturing structural breaks in the regression coefficients, a feature that is crucial given the length of the time series we analyze. A natural way of capturing time variation in the parameter is through time-varying parameter (TVP) regression models. These models assume that the coefficients evolve smoothly over time and thus capture changes in transmission mechanisms but, conditional on appropriate modeling assumptions, also allow for rapid movements in the underlying parameters. To capture changing volatilities of the shocks, we also allow for heteroskedasticity in the regression model through a standard stochastic volatility specification. Our simple, yet flexible model enables us to capture differences in the relations between the determinants of GaR but also allows for situations where large, unobserved shocks are the main drivers of tail risks.
In its general form, we consider predictive equations with drifting parameters that take the following form:
 \begin{equation} y_{t+h} = \boldsymbol \beta '_{\!\!t+h} \boldsymbol x_t + \varepsilon _{t+h}, \quad \varepsilon _{t+h} \sim \mathcal{N}(0, \sigma _{t+h}^2) \end{equation}
where $\boldsymbol \beta _{t+h}$
is a vector of TVPs, which link
$\boldsymbol \beta _{t+h}$
is a vector of TVPs, which link $y_{t+h}$
to our set of
$y_{t+h}$
to our set of $K$
macrofinancial covariates in
$K$
macrofinancial covariates in $\boldsymbol x_t$
. We follow much of the literature (see, e.g., Primiceri, Reference Primiceri2005; Cogley and Sargent, Reference Cogley and Sargent2005) and assume that these evolve according to random walk processes. Moreover, the logarithm of the error variance is assumed to follow an AR(1) process.Footnote 6
$\boldsymbol x_t$
. We follow much of the literature (see, e.g., Primiceri, Reference Primiceri2005; Cogley and Sargent, Reference Cogley and Sargent2005) and assume that these evolve according to random walk processes. Moreover, the logarithm of the error variance is assumed to follow an AR(1) process.Footnote 6
These assumptions give rise to a system of state evolution equations:
 \begin{align*} \boldsymbol \beta _t &= \boldsymbol \beta _{t-1} + \boldsymbol \eta _t, \quad \boldsymbol \eta _t \sim \mathcal{N}(\boldsymbol 0_K, \boldsymbol V_\beta ),\\ \log \sigma _t^2 &= \mu _\sigma + \rho _\sigma (\log \sigma _{t-1}^2 - \mu _\sigma ) + w_t, \quad w_t \sim \mathcal{N}(0, \vartheta ^2),\\ \log \sigma _0^2 &\sim \mathcal{N}\left (\mu _\sigma, \frac{\vartheta ^2}{1-\rho _\sigma ^2}\right ) \end{align*}
where $\boldsymbol V_\beta = \text{diag}(v^2_1, \ldots, v^2_K)$
is a diagonal matrix with variances
$\boldsymbol V_\beta = \text{diag}(v^2_1, \ldots, v^2_K)$
is a diagonal matrix with variances $v_j^2$
. These variances control the amount of time variation in the regression coefficients. If
$v_j^2$
. These variances control the amount of time variation in the regression coefficients. If $v_j^2 = 0$
,
$v_j^2 = 0$
, $\beta _{jt}$
, the
$\beta _{jt}$
, the $j^{th}$
element of
$j^{th}$
element of $\boldsymbol \beta _t$
, would be constant over time since
$\boldsymbol \beta _t$
, would be constant over time since $\beta _{jt} = \beta _{jt-1}$
for all
$\beta _{jt} = \beta _{jt-1}$
for all $t$
. Hence, the corresponding effect of
$t$
. Hence, the corresponding effect of $x_{jt}$
on
$x_{jt}$
on $y_{t+h}$
is time invariant. By contrast, setting
$y_{t+h}$
is time invariant. By contrast, setting $v_j^2$
to a large value implies substantial variation in the corresponding coefficient, giving rise to overfitting concerns.
$v_j^2$
to a large value implies substantial variation in the corresponding coefficient, giving rise to overfitting concerns.
The coefficients associated with the law of motion of the log-volatilities are the long-run unconditional mean $\mu _\sigma$
, the persistence parameter
$\mu _\sigma$
, the persistence parameter $\rho _\sigma$
, and the innovation variance
$\rho _\sigma$
, and the innovation variance $\vartheta ^2$
. If
$\vartheta ^2$
. If $\rho _\sigma$
is close to one, the corresponding volatility estimate will be smooth. The variance parameter
$\rho _\sigma$
is close to one, the corresponding volatility estimate will be smooth. The variance parameter $\vartheta ^2$
controls the amount of time variation in the error variances. This model has two features necessary to produce asymmetries in the predictive distribution. The TVPs provide sufficient flexibility to capture movements in the conditional mean, and the stochastic volatility process allows the variance of the predictive density to shift flexibly.
$\vartheta ^2$
controls the amount of time variation in the error variances. This model has two features necessary to produce asymmetries in the predictive distribution. The TVPs provide sufficient flexibility to capture movements in the conditional mean, and the stochastic volatility process allows the variance of the predictive density to shift flexibly.
Deciding on whether we need time variation in the parameters is a nonstandard statistical problem and boils down to testing whether $v_j^2 = 0$
or
$v_j^2 = 0$
or $v_j^2 \gt 0$
. The Bayesian literature offers several solutions. Shrinkage priors that force
$v_j^2 \gt 0$
. The Bayesian literature offers several solutions. Shrinkage priors that force $v_j^2$
toward zero if the data suggests that
$v_j^2$
toward zero if the data suggests that $\beta _{jt}$
is time invariant are the most prominent way (see, e.g., Belmonte et al., Reference Belmonte, Koop and Korobilis2014; Bitto and Frühwirth-Schnatter, Reference Bitto and Frühwirth-Schnatter2019; Huber et al., Reference Huber, Koop and Onorante2021, for recent papers that develop and apply different shrinkage techniques). All these priors, commonly referred to as global-local shrinkage priors (Polson and Scott, Reference Polson and Scott2010), can be written as:
$\beta _{jt}$
is time invariant are the most prominent way (see, e.g., Belmonte et al., Reference Belmonte, Koop and Korobilis2014; Bitto and Frühwirth-Schnatter, Reference Bitto and Frühwirth-Schnatter2019; Huber et al., Reference Huber, Koop and Onorante2021, for recent papers that develop and apply different shrinkage techniques). All these priors, commonly referred to as global-local shrinkage priors (Polson and Scott, Reference Polson and Scott2010), can be written as:
 \begin{equation*} \pm \sqrt {v^2}_j \sim \mathcal {N}(0, \lambda \tau _j), \quad \tau _j \sim p_\tau (\tau _j), \quad \lambda \sim p_\lambda (\lambda ), \end{equation*}
where $\lambda$
is a so-called global shrinkage factor. Everything else equal, a value of
$\lambda$
is a so-called global shrinkage factor. Everything else equal, a value of $\lambda$
very close to zero implies that all regression coefficients in (1) are time invariant. To allow for time-varying coefficients if
$\lambda$
very close to zero implies that all regression coefficients in (1) are time invariant. To allow for time-varying coefficients if $\lambda$
is close to zero, the
$\lambda$
is close to zero, the $\tau _j'$
s are local shrinkage parameters that pull
$\tau _j'$
s are local shrinkage parameters that pull $\pm v_j$
away from zero, if supported by the data. Both the global and local shrinkage parameters feature their own priors, and by choosing them in a suitable manner, we end up with a wide variety of different shrinkage priors. In this paper, we use the triple Gamma shrinkage prior (Cadonna et al., Reference Cadonna, Frühwirth-Schnatter and Knaus2020) as implemented in the R package shrinkTVP (Knaus et al., Reference Knaus, Bitto-Nemling, Cadonna and Frühwirth-Schnatter2021). This choice nests many of the priors commonly used in the literature and has been shown to work well in Cadonna et al. (Reference Cadonna, Frühwirth-Schnatter and Knaus2020). More details on the priors and the posterior simulator are provided in Appendix A.Footnote 7
$\pm v_j$
away from zero, if supported by the data. Both the global and local shrinkage parameters feature their own priors, and by choosing them in a suitable manner, we end up with a wide variety of different shrinkage priors. In this paper, we use the triple Gamma shrinkage prior (Cadonna et al., Reference Cadonna, Frühwirth-Schnatter and Knaus2020) as implemented in the R package shrinkTVP (Knaus et al., Reference Knaus, Bitto-Nemling, Cadonna and Frühwirth-Schnatter2021). This choice nests many of the priors commonly used in the literature and has been shown to work well in Cadonna et al. (Reference Cadonna, Frühwirth-Schnatter and Knaus2020). More details on the priors and the posterior simulator are provided in Appendix A.Footnote 7
In this paper, we will take a forecasting stance and consider the predictive distribution of the model in (1). The predictive density is given by:
 \begin{equation} p(y_{T+h}|Data_{1:t}) = \int p(\boldsymbol y_{T+h}|\boldsymbol \Xi, Data_{1:T}) p(\boldsymbol \Xi |Data_{1:T}) d\boldsymbol \Xi, \end{equation}
where $Data_{1:T}$
denotes the available information up to time
$Data_{1:T}$
denotes the available information up to time $T$
and
$T$
and $\boldsymbol \Xi$
is a generic object that collects coefficients and latent states.
$\boldsymbol \Xi$
is a generic object that collects coefficients and latent states.
The predictive density is not available in closed form and obtained through simulation-based techniques using the output from the Markov chain Monte Carlo (MCMC) sampler. Notice that $p(\boldsymbol y_{T+h}|\boldsymbol \Xi, Data_{1:T})$
is a Gaussian distribution:
$p(\boldsymbol y_{T+h}|\boldsymbol \Xi, Data_{1:T})$
is a Gaussian distribution:
 \begin{equation*} y_{T+h}|\boldsymbol \Xi, Data_{1:T} \sim \mathcal {N}(\boldsymbol \beta '_{T+h} \boldsymbol x_T, \sigma ^2_{T+h}), \end{equation*}
and thus symmetric. To see how our model generates heavy tails, consider a simplified version that sets $\rho _\sigma =0$
. The resulting state evolution equation for
$\rho _\sigma =0$
. The resulting state evolution equation for $\log \sigma _t^2$
reduces to
$\log \sigma _t^2$
reduces to $\log \sigma _t^2 \sim \mathcal{N}(\mu _\sigma, \vartheta ^2)$
, and hence,
$\log \sigma _t^2 \sim \mathcal{N}(\mu _\sigma, \vartheta ^2)$
, and hence, $\varepsilon _{T+h}$
is a Gaussian term with a variance that follows a log-normal distribution. The kurtosis, in this case, will be given by
$\varepsilon _{T+h}$
is a Gaussian term with a variance that follows a log-normal distribution. The kurtosis, in this case, will be given by $3 \cdot \exp (\vartheta ^2)$
and is thus strictly larger than the kurtosis of a Gaussian distribution for
$3 \cdot \exp (\vartheta ^2)$
and is thus strictly larger than the kurtosis of a Gaussian distribution for $\vartheta \gt 0$
. In general, Carnero et al. (Reference Carnero, Peña and Ruiz2004) show that the kurtosis of
$\vartheta \gt 0$
. In general, Carnero et al. (Reference Carnero, Peña and Ruiz2004) show that the kurtosis of $\epsilon _{T+h}$
is given by
$\epsilon _{T+h}$
is given by $k_\varepsilon = 3 \cdot \exp \left (\vartheta ^2/(1-\rho _\vartheta ^2)\right )$
. This implies that if
$k_\varepsilon = 3 \cdot \exp \left (\vartheta ^2/(1-\rho _\vartheta ^2)\right )$
. This implies that if $\log \sigma _t^2$
is persistent,
$\log \sigma _t^2$
is persistent, $\rho _\vartheta$
would be large, and kurtosis would increase, making larger shocks more likely.
$\rho _\vartheta$
would be large, and kurtosis would increase, making larger shocks more likely.
It is worth stressing, however, that other features (such as asymmetries or multimodalities) can arise since, once we integrate over $\boldsymbol \Xi$
, the corresponding predictive distribution takes a nonstandard form and can accommodate features such as heavy tails or downside asymmetries as reported in, for example, Adrian et al. (Reference Adrian, Boyarchenko and Giannone2019). This is because (2) can be interpreted as a mixture of Gaussians with a highly complicated mixing distribution
$\boldsymbol \Xi$
, the corresponding predictive distribution takes a nonstandard form and can accommodate features such as heavy tails or downside asymmetries as reported in, for example, Adrian et al. (Reference Adrian, Boyarchenko and Giannone2019). This is because (2) can be interpreted as a mixture of Gaussians with a highly complicated mixing distribution $p(\boldsymbol \Xi |Data_{1:T})$
that takes no well known form either.
$p(\boldsymbol \Xi |Data_{1:T})$
that takes no well known form either.
One additional advantage of our TVP specification relative to a standard QR is that the parameters vary over time. This enables us to investigate whether different elements in $\boldsymbol x_t$
vary in importance for explaining growth at risk over time.
$\boldsymbol x_t$
vary in importance for explaining growth at risk over time.
3. Empirical findings
This section first demonstrates that our TVP-SV model outperforms quantile regression models in out-of-sample forecasting, underscoring its superior predictive capabilities. Subsequently, we shed light on the predictive densities over time and decompose both downside and upside risks to identify their driving factors, providing a comprehensive overview of how financial risk indicators have influenced tail risks to economic growth over the past 130 years. Finally, we conduct a comparative analysis of the two most significant economic crises in our sample: the Great Depression and the Great Recession. This comparison highlights the shifting drivers of downside risks before and during crises and is of particular interest for policymakers.
3.1. Model evaluation
In a first step, we evaluate the out-of-sample forecasting performance of different TVP and quantile regression models. For both the quantile regression and the TVP model, we estimate two specifications: (i) the baseline model including a constant, the financial stress indicator, and lagged GDP growth as predictors (we will use the abbreviation QR and TVP to refer to these models) and (ii) the extended model, which additionally includes credit growth and house price growth as regressors (hereafter referred to as QR + and TVP+).
We evaluate the accuracy of the predicted downside risks with the help of quantile scores (see, e.g., Giacomini and Komunjer, Reference Giacomini and Komunjer2005; Brownlees and Souza, Reference Brownlees and Souza2021). Our focus is on the performance in the left tail. Hence, we consider the quantile score at the 5% quantile.
Table 1 reports the quantile scores relative to the QR model for the pre- and post-World War II (WWII) subsample and the forecasting horizons $h=1$
and
$h=1$
and $h=4$
.Footnote 8 In general, we find that TVP models perform particularly well during the post-WWII period, especially at the one-step ahead horizon. For both periods and horizons considered, the TVP models produce quantile scores that are superior to those obtained from the extended quantile regression. However, it is worth noting that the small QR model produces slightly more precise tail forecasts during the pre-WWII period.
$h=4$
.Footnote 8 In general, we find that TVP models perform particularly well during the post-WWII period, especially at the one-step ahead horizon. For both periods and horizons considered, the TVP models produce quantile scores that are superior to those obtained from the extended quantile regression. However, it is worth noting that the small QR model produces slightly more precise tail forecasts during the pre-WWII period.
Out-of-sample model evaluation

Note: This table reports the out-of-sample model evaluation for the forecast horizon of one and four quarters. The quantile scores are reported relative to the QR model.
Once we focus on four-quarter ahead GDP growth forecasts, this pattern becomes slightly less pronounced. In this case, both quantile regressions (QR and QR+) improve upon the TVP models when the period prior to WWII is considered. When we focus on post-WWII data, the TVP regressions are again outperforming the simple quantile regression model by appreciable margins. The reason for this rather weak performance in the pre-WWII period is driven by the fact that the QRs produce predictive densities with wide credible intervals (see Figure A.7). This helps in periods characterized by sharp breaks in GDP growth but harms forecasting accuracy in tranquil times. Since the pre-WWII features several crises, a model which produces wide forecast intervals during that specific points in time yields favorable overall tail forecasts.
This brief discussion has shown that TVP models can outperform quantile regressions, especially at the one-quarter ahead horizon, but also for multistep ahead forecasts and post-WWII data. Since we focus on two variants of the models (i.e., the baseline and the extended versions), we can also analyze whether including credit and house price growth pays off for obtaining more precise tail forecasts. The results in Table 1 suggest that for one-quarter ahead tail forecasts, additional information does not translate into more precise predictions for the pre-WWII sample and only slightly improves the predictive fit over the post-WWII period. This pattern reverses if our interest is on four-step ahead forecasts. In that case, using more information yields more precise forecasts (which are still inferior to the QR benchmark predictions pre-WWII) for both holdout periods considered. This finding is most likely driven by the fact that one-quarter ahead predictions are dominated by high frequency shocks, which are notoriously difficult to predict, whereas for longer-run forecasts, short- and medium-lived trends become more important. Such short- and medium-lived trends include asset, credit, and house price cycles, as reported by Potjagailo and Wolters (Reference Potjagailo and Wolters2023), who analyze these cycles over a comparable historical sample.
In sum, our small forecasting exercise shows that TVP regressions are capable of producing competitive tail forecasts without explicitly focusing on the corresponding quantile under scrutiny. This indicates that the increased flexibility provided by TVP models (i.e. allowing for drifts in $\boldsymbol \beta _t$
and changing error variances in
$\boldsymbol \beta _t$
and changing error variances in $\sigma _t^2$
) enables us to adequately model the distribution of GDP growth over long samples. This conclusion is further supported by the additional model evaluations presented in Appendix B.
$\sigma _t^2$
) enables us to adequately model the distribution of GDP growth over long samples. This conclusion is further supported by the additional model evaluations presented in Appendix B.
3.2. Features of the predictive densities
Next, we examine the characteristics of the predictive densities. Figure 1 presents the annualized one- and four-quarter ahead GDP growth along with their predicted lower ( $5^{th}$
percentile) and upper (
$5^{th}$
percentile) and upper ( $95^{th}$
percentile) bounds. The results for the post-1970s period are consistent with previous research, which shows that lower bounds vary significantly over time while upper bounds are relatively stable (see, e.g., Adrian et al., Reference Adrian, Boyarchenko and Giannone2019; Aikman et al., Reference Aikman, Bridges, Hacioglu Hoke, O’Neill and Raja2019). However, this pattern appears to have emerged only since the start of the Great Moderation period in the 1980s. Prior to that, upper bounds were just as volatile as lower bounds. Table 2 supports this observation by showing the standard deviation of up- and downside risks over four different periods. The table also highlights the significant reduction in overall tail volatility after WWII and the even lower variation in the tails since the Great Moderation. This is not surprising, as the Great Depression led to a change in policymaking, with a greater focus on stabilizing the business cycle and reducing volatility.
$95^{th}$
percentile) bounds. The results for the post-1970s period are consistent with previous research, which shows that lower bounds vary significantly over time while upper bounds are relatively stable (see, e.g., Adrian et al., Reference Adrian, Boyarchenko and Giannone2019; Aikman et al., Reference Aikman, Bridges, Hacioglu Hoke, O’Neill and Raja2019). However, this pattern appears to have emerged only since the start of the Great Moderation period in the 1980s. Prior to that, upper bounds were just as volatile as lower bounds. Table 2 supports this observation by showing the standard deviation of up- and downside risks over four different periods. The table also highlights the significant reduction in overall tail volatility after WWII and the even lower variation in the tails since the Great Moderation. This is not surprising, as the Great Depression led to a change in policymaking, with a greater focus on stabilizing the business cycle and reducing volatility.
Time series evolution of the predicted tail risks.
Note: This figure shows the out-of-sample one-quarter ahead (Panel A) and four-quarter ahead (Panel B) forecast of the $5^{th}$
and
$5^{th}$
and $95^{th}$
percentile together with the realized growth rate.
$95^{th}$
percentile together with the realized growth rate.

3.3. Main results: decomposing up- and downside risks
Next, we focus on the drivers of tail risks over time. Our TVP model with stochastic volatility is able to handle asymmetries in up- and downside risks, which is a necessary feature for this type of analysis. The asymmetries in tail risks imply asymmetries in the unconditional distributions but do not necessarily require asymmetries in conditional predictive distributions (Carriero et al., Reference Carriero, Clark and Marcellino2024). Hence, only focusing on the time series evolution of the coefficients (see Figure A.3 and A.6) does not provide a complete picture of how tail risks occur. To shed light on which indicator drives the predictive quantiles of GDP growth, we rely on linear posterior summaries (see, e.g., Woody et al., Reference Woody, Carvalho and Murray2021). This is achieved as follows. Based on the $h$
-step ahead predictive distribution of the model (see Eq. (2)) we, compute a sequence of quantiles
$h$
-step ahead predictive distribution of the model (see Eq. (2)) we, compute a sequence of quantiles $\mathcal{Q}_{t+h, p}$
. Each of these estimated quantiles is then used as the dependent variable in the following linear regression model:
$\mathcal{Q}_{t+h, p}$
. Each of these estimated quantiles is then used as the dependent variable in the following linear regression model:
 \begin{equation} \mathcal{Q}_{t+h, p} = \boldsymbol \alpha '_p \boldsymbol x_t + e_t, \end{equation}
where $\boldsymbol \alpha _p$
is a quantile-specific set of linear coefficients and
$\boldsymbol \alpha _p$
is a quantile-specific set of linear coefficients and $e_t$
is a Gaussian shock with constant error variance. The ordinary least squares (OLS) estimator
$e_t$
is a Gaussian shock with constant error variance. The ordinary least squares (OLS) estimator $\hat{\boldsymbol \alpha _p}$
then provides a linear quantile-specific approximation to the predictive density of the flexible TVP regression. The key advantage of this approach is that it improves interpretability and allows for a straightforward decomposition of the driving forces of right and left-tail forecasts of GDP growth.
$\hat{\boldsymbol \alpha _p}$
then provides a linear quantile-specific approximation to the predictive density of the flexible TVP regression. The key advantage of this approach is that it improves interpretability and allows for a straightforward decomposition of the driving forces of right and left-tail forecasts of GDP growth.
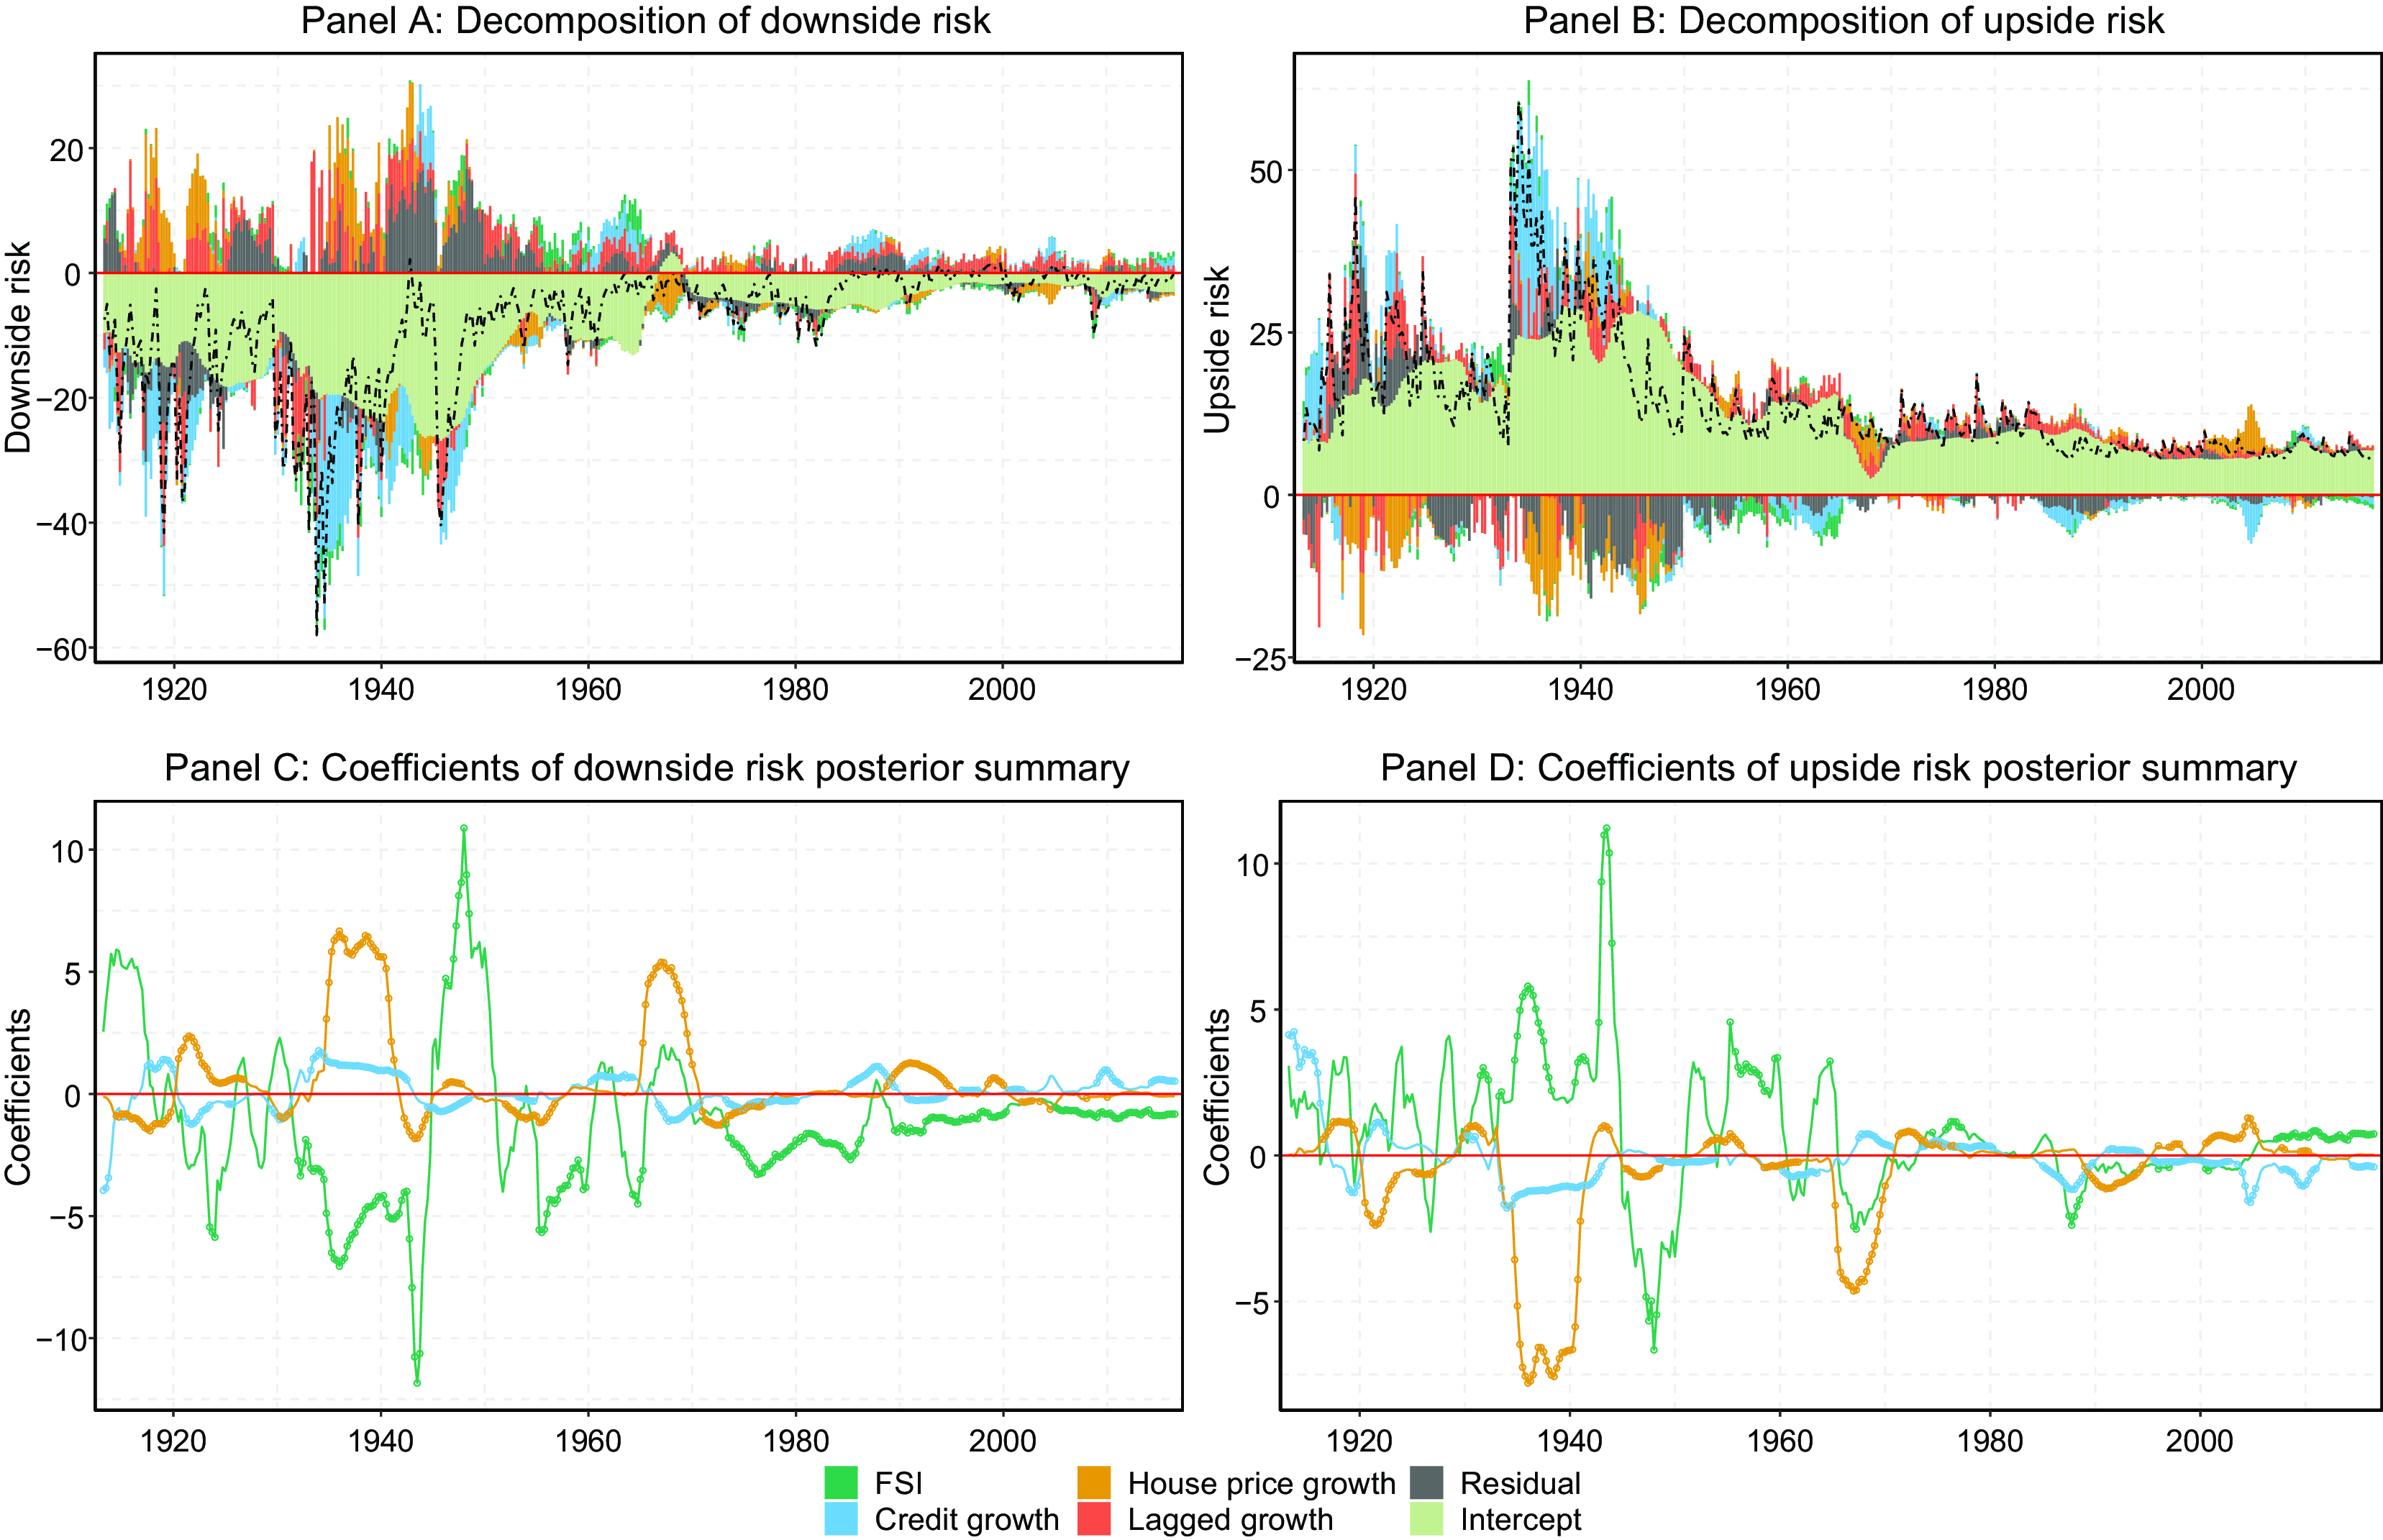
Figures 2 and 3 illustrate the decomposed tail risks in Panels A and B. The dashed black line shows the level of tail risks as predicted by our TVP model at the time of the prediction. The bars show the decomposition of the predicted $5^{th}$
and
$5^{th}$
and $95^{th}$
percentile approximated by the 10-year rolling linear regression. Panels C and D each show the linear posterior summary’s corresponding coefficients to assess the risk indicators’ marginal effect. A circle indicates whether a coefficient is significant at the 5% significance level. Subsequently, we do not discuss the tail risks around WWII because we cannot distinguish between the impact of macrofinancial variables and war time effects.
$95^{th}$
percentile approximated by the 10-year rolling linear regression. Panels C and D each show the linear posterior summary’s corresponding coefficients to assess the risk indicators’ marginal effect. A circle indicates whether a coefficient is significant at the 5% significance level. Subsequently, we do not discuss the tail risks around WWII because we cannot distinguish between the impact of macrofinancial variables and war time effects.
Standard deviation of up- and downside risks
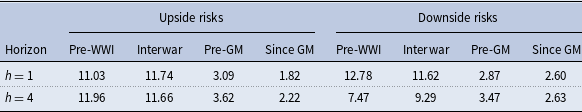
Note: This table reports the standard deviation of the predicted $5^{th}$
and
$5^{th}$
and $95^{th}$
percentile. The sample is split into four periods: pre-WWI, the interwar era, the time before the Great Moderation (pre-GM), and since the Great Moderation (since GM). After both world wars, 2 years are left out to not capture any wartime effects in the standard deviations.
$95^{th}$
percentile. The sample is split into four periods: pre-WWI, the interwar era, the time before the Great Moderation (pre-GM), and since the Great Moderation (since GM). After both world wars, 2 years are left out to not capture any wartime effects in the standard deviations.
Decomposition of tail risks one-quarter ahead.
Note: Panels A and B show the predictive variable relevance for the predicted $5^{th}$
and
$5^{th}$
and $95^{th}$
percentile over time. We approximate the predicted
$95^{th}$
percentile over time. We approximate the predicted $5^{th}$
and
$5^{th}$
and $95^{th}$
percentile using a 10-year rolling window linear regression model. Panels C and D show the coefficients of the linear approximation over time. A circle indicates a significant coefficient (5% significance level).
$95^{th}$
percentile using a 10-year rolling window linear regression model. Panels C and D show the coefficients of the linear approximation over time. A circle indicates a significant coefficient (5% significance level).
Subsequently, we present the results of this analysis by describing the stylized facts about the determinants of tail risks over the past 130 years, their implications for policymakers, and how they connect to the broader literature.
Conditional average. Starting with the intercept, we observe a staggering reduction of the intercept post-WWII (see Figures 2 and 3), which is the conditional average downside risk of the 10-year window of the rolling linear posterior summary. Therefore, the conditional average tail risks nowadays are significantly lower compared to the start of the sample. While this result is unsurprising since the overall tail volatility has substantially decreased since WW II, the sharp reduction in the conditional average growth risk is still eye-catching.
Financial stress. Adrian et al. (Reference Adrian, Grinberg, Liang, Malik and Yu2022) identify financial stress as the primary short-term predictor of left tail risks. This is particularly evident during significant historical events such as the oil crises, the dot-com bubble, and the Great Recession, where financial stress markedly contributes to downside risks. However, during the Great Recession, credit and house price growth emerged as the primary factors influencing downside risks in the four-quarter ahead forecast (see Figure 3, Panel A). Similarly, prior to WWII, these variables were crucial in forecasting growth at risk, notably during the early stages of the Great Depression. In fact, during the depths of the Great Depression, credit growth was the predominant contributor to downside risks.
Interestingly, while financial stress significantly affects the left tail of the predicted distribution, it has a negligible impact on the upper tail. This asymmetry is evident in the coefficients, which show a significant negative effect on left-tail risks but a less pronounced effect on upside risks, as depicted in Figures 2 and 3, Panels C and D. Specifically, financial stress exhibits a significant negative marginal effect on left tail risks (Panel C), whereas its marginal effect on upside risks is both economically and statistically insignificant.Footnote 9
Given these findings, policymakers should prioritize mitigating financial stress, as it has exacerbated growth risks for over a century without offering corresponding benefits to the upper tail of the distribution.
Decomposition of tail risks four quarter ahead.
Note: Panels A and B show the predictive variable relevance for the predicted $5^{th}$
and
$5^{th}$
and $95^{th}$
percentile over time. We approximate the predicted
$95^{th}$
percentile over time. We approximate the predicted $5^{th}$
and
$5^{th}$
and $95^{th}$
percentile using a 10-year rolling window linear regression model. Panels C and D show the coefficients of the linear approximation over time. A circle indicates a significant coefficient (5% significance level).
$95^{th}$
percentile using a 10-year rolling window linear regression model. Panels C and D show the coefficients of the linear approximation over time. A circle indicates a significant coefficient (5% significance level).

Credit growth. Credit growth typically affects downside risks negatively in the medium and long term but less so at shorter time horizons (Adrian et al., Reference Adrian, Grinberg, Liang, Malik and Yu2022; Galán, Reference Galán2024). While our findings broadly confirm this, we are also able to shed light on temporary and transitional effects over time. In our one-quarter ahead predictions, we find a negative impact of credit growth both after the Global Financial Crisis and the first oil shock, but for completely different reasons. While rapid credit expansion drives downside risks during the first oil crisis, a credit crunch—that is, too little credit-increased downside risks following the Global Financial Crisis (see Figure 2, Panel C). This stands in stark contrast to the effect of credit growth in the four-quarter ahead predictions, where the sharp decline in the coefficient in the mid-2000s results in a large negative overall effect.Footnote 10
Before WWII, credit growth was the most important driver of tail risks, contributing to the post-World War I recession, the Depression of 1920–1921, and the deterioration in growth risks during the Great Depression. Again, when looking at Panel C in Figures 2 and 3, we see the importance of using a flexible approach, as the coefficients vary substantially over time both in terms of sign and magnitude.
The stark difference between the Great Recession and the Great Depression lies in the duration and magnitude of the credit crunch, highlighting the effectiveness of central banks’ interventions in 2008 and the following years. Notably, while credit growth did not significantly increase downside risks in the latter half of the 20th century, it did so in the lead-up to the Global Financial Crisis, comparable to the Great Depression in both absolute and marginal effects. These findings align with the seminal work of Jordà et al. (Reference Jordà, Schularick and Taylor2015), which shows that credit boom-fueled stock bubbles are much costlier compared to noncredit boom bubbles. Additionally, Gorton and Ordonez (Reference Gorton and Ordonez2020) find that the average credit boom in a sample of 34 countries from 1960 to 2010 lasts 11 years and is not necessarily bad. Our analysis supports this perspective; for instance, the credit boom after WWII had a very desirable outcome by decreasing downside risks and increasing upside risks.
While financial stress has only a minimal impact on upside risks, credit growth significantly influences both upper and lower tails, depending on the respective time period. Therefore, policymakers should consider the role of credit and its impact on downside risks more nuancedly compared to financial stress.
House price growth. The effect of financial stress and credit growth on downside risks to economic growth since the 1970s aligns well with previous literature. For house price growth, prior studies suggest little to no effect on downside risks (Aikman et al., Reference Aikman, Bridges, Hacioglu Hoke, O’Neill and Raja2019; Galán, Reference Galán2024). However, our findings reveal a significant impact on short-term tail risks during the 1950s, 1960s, early 1990s, and 2000s. Figures 2 and 3, Panel C, illustrate these patterns. Fast-rising house prices in the 1950s, partly due to the GI Bill, and increasing subprime lending in the 2000s heightened economic growth risks by threatening a real estate bubble. Conversely, declining house prices in the early 1990s and late 1960s also negatively impacted downside risks. The most pronounced negative effect is observed in the mid-2000s four-quarter ahead prediction.
These findings contrast with previous studies that suggest house prices have little to no effect on short-term tail risks, highlighting our empirical model’s ability to capture time-varying effects. Notably, house price growth also impacts the upside risks of economic growth, consistent with the boom-bust pattern in financial cycle literature (Borio, Reference Borio2014).
In the pre-WWII period, the effect of house price growth on tail risks was relatively small, except for the house price crash after WWI. Our results align with literature on housing and financial cycles, which concludes that over the last century, increased mortgage lending and total credit to households have amplified feedback effects on the economy, influencing tail risks to economic growth. Since the 1970s, we observe an almost exclusively positive marginal effect of house prices on growth risks. This trend, linked to a rising home ownership ratio, suggests an increasing wealth effect on consumption when house prices collapse (Mian et al., Reference Mian, Rao and Sufi2013; Jordà et al., Reference Jordà, Schularick and Taylor2017; Graham and Makridis, Reference Graham and Makridis2023).
The correlation between house prices and credit growth has also increased significantly since the 1960s and has remained high since then. Consequently, house prices have become more relevant from a financial stability perspective, as financial imbalances have likely increased with rising leverage in recent decades compared to the pre-WWII period (see, for instance, Jordà et al., Reference Jordà, Schularick and Taylor2015, Reference Jordà, Schularick and Taylor2016; Mian et al., Reference Mian, Sufi and Verner2017). This mortgage-financed housing boom may explain why the effect of house price growth on tail risks was unprecedented during the Global Financial Crisis, aligning with broader financial cycle literature (Borio, Reference Borio2014).
TVP local projections.
Note: This figure shows TVP local projections of the linear approximation at different time points. A circle indicates a significant coefficient (5% significance level).

3.4. Common patterns in times of crises
To gain an in-depth understanding of our empirical results and go beyond the broader picture presented in the previous section, it is useful to explain the findings by referencing the two major economic crises in our sample. For this purpose, we illustrate the results on the basis of TVP local projections during the Great Depression on the one hand and the Global Financial Crisis on the other. These TVP local projections are derived from the posterior summary, as described in Subsection 3.3 and equation 3. Essentially, they provide a different representation of the coefficients shown in Figures 2 and 3. Hence, Figure 4 shows the effect of financial stress, credit growth, and house price growth on the predicted $5^{th}$
percentile of future GDP growth one to four quarters ahead at different points in time.
$5^{th}$
percentile of future GDP growth one to four quarters ahead at different points in time.
The results show significant fluctuations in coefficients during both crises, with an even more pronounced effect observed during the latter crisis. Interestingly, there are both similarities and differences in the impact of financial risk indicators on downside risks during the two crisis periods, with particularly strong differences in the effect of house prices.
Both during the Great Depression and the Global Financial Crisis, financial stress amplified downside growth risks at short time horizons, in the case of the Great Depression partly also at longer time horizons.Footnote 11 In contrast, the effect is somewhat different in the years preceding the crisis, as pre-crisis growth risks are only affected by financial stress prior to the Global Financial Crisis. In both cases, as the crisis unfolded, the effect on longer term horizons disappeared and the impact on short-term (one-quarter ahead) predictions intensified. Thus, financial stress elevated downside risks to economic growth in both crises; however, it only influenced pre-crisis growth risks before the Global Financial Crisis.
For credit growth, we observe comparable patterns in both crises, with higher credit growth being associated with heightened growth risks both prior to and during the crisis. During the Great Depression, the coefficients for all horizons shifted upward, suggesting that a credit crunch, rather than excessive credit, heightened growth risks in later years. On the contrary, this upward shift in coefficients was only observed for the one-quarter ahead horizons during the Global Financial Crisis, potentially indicating the success of central bank intervention in avoiding a credit crunch.
While the results are comparable for financial stress and credit growth, the relationship between house price growth and downside risks shows strong differences between the two crises. In the Great Depression, rising house prices had a negative impact on growth risks, whereas during the Global Financial Crisis, falling house prices had the same effect. These results for the Global Financial Crisis are well in line with recent findings on housing wealth effects (e.g., Mian et al., Reference Mian, Rao and Sufi2013). The literature finds that a decline in house prices can also reduce consumption, especially when housing wealth constitutes a large proportion of households’ overall wealth.
The fact that the relationship between tail risks and financial risk indicators varies not only over long time horizons but also during crises has significant implications for policymakers. When calibrating models for optimal macroprudential policy, such as the one proposed by Suarez (Reference Suarez2022), using non-TVPs (e.g., quantile regression estimates) can lead to misleading policy recommendations, especially during financial crises. Additionally, the effects of both risk indicators and macroprudential policies change over time (see, e.g., Jiménez et al., Reference Jiménez, Ongena, Peydró and Saurina2017; Cerutti et al., Reference Cerutti, Claessens and Laeven2017). Therefore, instead of attempting to model all interactions between risk indicators (and possibly macroprudential policies),Footnote 12 it is more effective to use a flexible empirical approach like the one proposed in this paper. This approach provides more reliable warning signals about potential sharp recessions and facilitates a more efficient use of macroprudential policies.
4. Conclusion
Predicting growth risks has become a critical aspect of policymaking since the Global Financial Crisis, and it is particularly important for macroprudential policymakers. While previous research has identified financial stress, credit growth, and house price growth as key indicators for predicting growth risks, these studies often rely on short time series and inflexible models. In contrast, our research uses a flexible empirical approach and a 130-year historical time series to improve forecasting accuracy and to gain a better understanding with respect to the changing relationships between tail risks and financial risk indicators over time.
Our findings suggest that certain risk indicators, such as credit growth, have a time-varying effect on tail risks but tend to follow similar patterns during financial crises. On the other hand, the impact of house prices on tail risks is time-varying for both upside and downside risks, and its impact on growth risks during the Global Financial Crisis was also exceptional compared to historical trends. Additionally, we find that financial stress is consistently associated with increased growth risks (i.e., lower values of GaR) over the entire sample period.
This paper also serves as a note of caution in drawing policy implications from short time series or single historical events, as the observed effects of risk indicators may be time dependent. In addition to financial risk indicators, policy variables may also have a time-varying impact on tail risks throughout the credit and business cycle. Further research is necessary to assess the effectiveness and importance of macroprudential policy in crisis situations and the potential trade-offs that may occur during normal times.
Supplementary material
The supplementary material for this article can be found at https://doi.org/10.1017/S1365100524000476.


 Open access