


Introduction
Breast cancer constitutes a major global health challenge, being one of the most prevalent malignancies among women worldwide. Reference Bese, Hendry and Jeremic1 Post-operative radiotherapy (RT) is a cornerstone in the multidisciplinary management of breast cancer, especially after breast-conserving surgery (BCS). It significantly reduces the risk of local recurrence and is associated with an improvement in overall survival. Reference Barton, Keane, Gadalla and Maki2,Reference Gaudio, Ammar and Gunturkun3 However, the efficacy of radiotherapy can be compromised by unplanned treatment interruptions, which may lead to tumour cell repopulation and diminished local control rates. Reference Barton, Keane, Gadalla and Maki2,Reference Gaudio, Ammar and Gunturkun3
Various factors contribute to interruptions in radiotherapy. According to a study by Macia et al., Reference Maciá, Garau and Solé Monné4 the most frequent causes include (1) public holidays (45%), (2) machine maintenance (31%), (3) machine breakdowns (13%), (4) treatment-related complications (2%), (5) toxicity reactions (2%) and (6) scheduling errors (2%). Other studies have reported similar findings, with public holidays being the predominant factor. Reference Terhaard, Karim and Hoogenraad5–Reference Robertson, Robertson and Hendry7 In breast cancer radiotherapy, issues such as skin toxicity reactions are a significant cause of treatment disruption. Reference Hendry, Bentzen and Dale8 Although the quantitative impact per day may be less than in rapidly proliferating tumours (e.g., a 1-1.4% loss per day in head and neck cancer Reference Jones and Dale9,Reference Mitra, Simson and Khurana10 ), unplanned interruptions in breast cancer radiotherapy nevertheless compromise local control and must be minimised. Reference Ellis11,Reference Kirk, Gray and Watson12 This underscores the critical need for effective compensatory strategies to preserve treatment efficacy.
Over the years, several mathematical models have been developed to estimate the biologically effective dose (BED) and guide compensatory dosing during radiotherapy interruptions. These include the Nominal Standard Dose (NSD), Cumulative Radiation Effect (CRE), Time-Dose Factor (TDF) and the more recent BED model based on the linear-quadratic (LQ) model. Reference Ellis11–Reference Dale16 The NSD, CRE and TDF models are rarely used in contemporary clinical practice due to their oversimplification and limited accuracy. Reference Orton and Ellis13–Reference Kroening and Deiterman15 In contrast, the BED model, rooted in the LQ model of cell survival, has emerged as a more accurate and versatile tool for calculating compensatory doses during treatment interruptions. The LQ model incorporates dose per fraction, total dose, treatment time and tissue-specific parameters such as the α/β ratio to estimate the biological effect of radiation. Reference Dale16 By accounting for the biological impact of radiation and the specific characteristics of both tumour and normal tissues, the BED model enables a more personalised approach to compensatory dosing. Reference Jones, Dale, Deehan, Hopkins and Morgan17
While the BED model helps maintain the intended biological dose to the tumour, it often results in an increase in dose to normal tissues. Reference Dale16 Ensuring radiotherapy safety therefore requires careful evaluation of whether organs at risk (OARs) exceed tolerance limits when compensatory dosing is applied. In current clinical practice for left-sided breast cancer, dose control for lung tissue is a primary concern. However, there is limited research on the dose effects on cardiac substructures. In recent years, radiation-induced heart disease has garnered increasing attention following breast cancer radiotherapy, Reference Darby, Cutter and Boerma18–Reference Sardaro, Petruzzelli and D’Errico20 with evidence suggesting that its risk is associated with the volume and/or dose of heart irradiation. Reference Gagliardi, Constine and Moiseenko19 In reality, radiation dose to the heart is not uniformly distributed during thoracic radiotherapy. For instance, the anterior portion of the heart often receives a higher dose during postoperative breast radiotherapy. To address this, Tan et al. Reference Tan, Wang and Qiu21,Reference Tan, Liu and Xue22 introduced the concept of the anterior myocardial territory (AMT), proposing that it should be considered as an independent OAR in intensity-modulated radiotherapy (IMRT) for left-sided breast cancer after breast-conserving surgery to improve cardiac protection. IMRT is an advanced technique that modulates the radiation beam intensity to create highly conformal dose distributions around the target. Reference Tan, Liu and Xue22 This capability is particularly advantageous in left-sided breast cancer, as it allows for superior dose shaping to maximise target coverage while minimising radiation dose to adjacent OARs, such as the heart and lungs. Reference Sardaro, Petruzzelli and D’Errico20,Reference Tan, Wang and Qiu21 In the study by Cai et al., Reference Cai, Li and Li23 the AMT was defined to include multiple cardiac substructures—such as the left and right main coronary arteries and their anterior branches, including the left anterior descending artery, right marginal branch and left circumflex artery.
Although the BED model is well-established for managing radiotherapy interruptions, most previous studies have primarily focused on tumour control and general OAR sparing, with limited detailed analysis of specific cardiac substructures. In left-sided breast cancer radiotherapy, the heart—particularly substructures such as the left anterior descending artery (LAD)—represents a critical OAR. The novelty of this study lies in its comprehensive dosimetric evaluation of multiple cardiac substructures under different BED-based compensation schemes, providing quantitative comparisons that have been under-represented in the existing literature. This approach enables a more granular understanding of the trade-offs involved in interruption compensation, thereby supporting individualised treatment planning in clinical practice.
Methods
Patient selection
This retrospective analysis included twenty consecutive females with left-sided early-stage breast cancer (T1-2N0-1M0) treated with radiotherapy alone after breast-conserving surgery between January 2024 and March 2025. The cohort had a mean age of 44.26 ± 9.79 years and comprised 7 (35%) stage I and 13 (65%) stage II patients. Individuals with prior thoracic radiotherapy, metastatic disease or significant cardiac comorbidities were excluded. The study was approved by the institutional Ethics Committee with a waiver of informed consent.
Treatment planning was based on CT simulation. All patients were positioned supine and scanned using a Philips Brilliance Big Bore CT scanner (Philips, Netherlands). A standard protocol was employed with the following parameters: 5 mm slice thickness, 120 kV tube voltage and a scanning range extending from the mandible to the thorax.
Cardiac substructure contouring
Based on the research from Morris ED, Reference Morris, Ghanem and Zhu24 we chose the whole heart and 8 cardiac substructures, including left/right ventricles (LV, RV), left/right atria (LA, RA), ascending aorta (AA), pulmonary veins (PV), LAD and right coronary artery (RCA) as the evaluated targets. All cardiac substructures were delineated by two experienced imaging specialists on the RayPlan9A treatment planning system (RaySearch Medical Systems Inc.). The PTV and simultaneous integrated boost (SIB) area, as well as other OARs, including lungs, spinal cord, oesophagus and thyroid, were included using the prior contouring results.
RT plans design
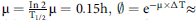
Each IMRT plan consisted of two primary tangential fields and four off-axis fields (10° or 20° external to the tangentials), with collimator and jaw settings optimised for lung sparing. Using the RayPlan 9A system with 6 MV X-rays, plans were optimised with the Dose-Volume Optimiser and calculated with the Anisotropic Analytical Algorithm (AAA). Reference Zhuang, Zhang, Chen, Lin, Li, Peng, Qiu and Wu25,Reference Bragg, Wingate and Conway26 All plans were normalised to cover 95% of the boost volume with 60 Gy, adhering to the dose constraints in Table 1. Reference Darby, Ewertz and McGale27,Reference Ting, Li, Ting, Rubo and Jing28 Delivery was performed on a Varian TrueBeam linac via dynamic sliding-window IMRT at 500 MU/min.
Dose targets and constraints for treatment planning

BED model
The BED model is a biological dose concept derived from the LQ model for radiation cell survival curves. Its expression is given by Reference Dale, Hendry, Jones, Robertson, Deehan and Sinclair29 :
 $${\rm{BED }} = n \times d \times \left( {1 + {d \over {{\raise0.7ex\hbox{$\alpha $} \!\mathord{\left/ {\vphantom {\alpha \beta }}\right.}\!\lower0.7ex\hbox{$\beta $}}}}} \right) - K \times \left( {T - {T_{{\rm{delay}}}}} \right)$$
where n is the number of fractions and d is the dose per fraction. ${\raise0.7ex\hbox{$\alpha $} \!\mathord{\left/ {\vphantom {\alpha \beta }}\right.}\!\lower0.7ex\hbox{$\beta $}}$
is the ratio of the linear and quadratic coefficients of the LQ model, which is tissue-specific; T is the total treatment time. T
delay is the time from the start of treatment until the onset of rapid repopulation. K (in Gy/day) is the biological dose required daily to compensate for ongoing tumour cell repopulation. The values of
${\raise0.7ex\hbox{$\alpha $} \!\mathord{\left/ {\vphantom {\alpha \beta }}\right.}\!\lower0.7ex\hbox{$\beta $}}$
is the ratio of the linear and quadratic coefficients of the LQ model, which is tissue-specific; T is the total treatment time. T
delay is the time from the start of treatment until the onset of rapid repopulation. K (in Gy/day) is the biological dose required daily to compensate for ongoing tumour cell repopulation. The values of
![]() and K are tissue-specific and need to be chosen appropriately for different tissues or tumours. K represents the daily BED dose required for repopulation. For most late-responding normal tissues, the value of K is usually very small, and in such cases, K can be neglected, i.e., K = 0.
and K are tissue-specific and need to be chosen appropriately for different tissues or tumours. K represents the daily BED dose required for repopulation. For most late-responding normal tissues, the value of K is usually very small, and in such cases, K can be neglected, i.e., K = 0.
Equation (1) applies to the situation where radiotherapy is administered once a day. However, when there are two or more fractions per day, there may be incomplete sublethal damage repair between fractions, leading to increased biological damage, which is especially important to consider for late-responding normal tissues. Reference Dale, Jones and Sinclair30 Therefore, Equation (1) transforms into Equation (2):
 $$BED = n \times d \times \left[ {1 + {{d \times \left( {1 + {H_m}} \right)} \over {{\raise0.7ex\hbox{$\alpha $} \!\mathord{\left/ {\vphantom {\alpha \beta }}\right.}\!\lower0.7ex\hbox{$\beta $}}}}} \right] - K \times \left( {T - {T_{delay}}} \right)$$
 $${H_m} = \left( {{2 \over m}} \right) \times \left( {{\emptyset \over {1 - \emptyset }}} \right) \times \left( {m - {{1 - {\emptyset ^m}} \over {1 - \emptyset }}} \right)$$
The expression for H
m
is given by Equation (3), where ${\Delta T}$
,
${\Delta T}$
, ${{T_{1/2}}}$
, m is the number of treatments per day,
${{T_{1/2}}}$
, m is the number of treatments per day,
![]() is the inter-fraction time interval, and
is the inter-fraction time interval, and $ {T}_{1/2}$
is the half-repair time.
Reference Jones, Dale and Deehan31
The BED model, based on the LQ cell survival model, has been widely validated and applied, and it has become a standard biological dose metric for evaluating radiotherapy fractionation schemes.
$ {T}_{1/2}$
is the half-repair time.
Reference Jones, Dale and Deehan31
The BED model, based on the LQ cell survival model, has been widely validated and applied, and it has become a standard biological dose metric for evaluating radiotherapy fractionation schemes.
Interrupted boost calculation based on the BED model
To address the challenge of unscheduled treatment interruptions, we defined and compared three BED-based compensatory schemes within a standardised clinical context. The reference regimen was a 33-day course of 50 Gy in 25 fractions to the whole breast with a simultaneous integrated boost of 60 Gy. An interruption of 1 to 10 days was simulated after the first week, and doses were recalculated for each scenario. The three schemes were selected to embody the core strategic options:
-
1) Accelerated Completion (Scheme A): Total time and fraction number are preserved by switching to twice-daily fractions after the interruption, exploiting hyperfractionation to avoid prolonging treatment. Reference Alzibdeh, Abuhijlih and Abuhijla32
-
2) Dose-Intensified Compensation (Scheme B): Total time is preserved by increasing the dose per fraction, accepting the radiobiological trade-off of hypofractionation for logistical simplicity.
-
3) Treatment Extension (Scheme C): Dose per fraction is preserved by extending the treatment calendar, representing the conventional, though radiobiologically least favoured, clinical compromise due to the risk of tumour repopulation.
This framework allows for a systematic evaluation of the dosimetric and practical implications of each strategy.
(1) Original Scheme: BED calculation
Calculate the physical dose for tumour tissue and OARs under normal treatment conditions and also compute their BED for all patients, as shown in Table 2. Assume the tumour tissue has an α/β ratio of 4.6, K = 0.6 Gy/day and T delay = 28 days Reference Dale, Hendry, Jones, Robertson, Deehan and Sinclair29,Reference Alzibdeh, Abuhijlih and Abuhijla32 ; for normal tissue, assume an α/β ratio of 3 and disregard cell proliferation. Use formula (1) to calculate the BED values for tumour tissue and OARs, denoted as BED T and BED N , respectively. Then, perform the following calculations for different schemes.
The physic dose (x ± s, Gy) of targets and OARs in IMRT plans of the original scheme
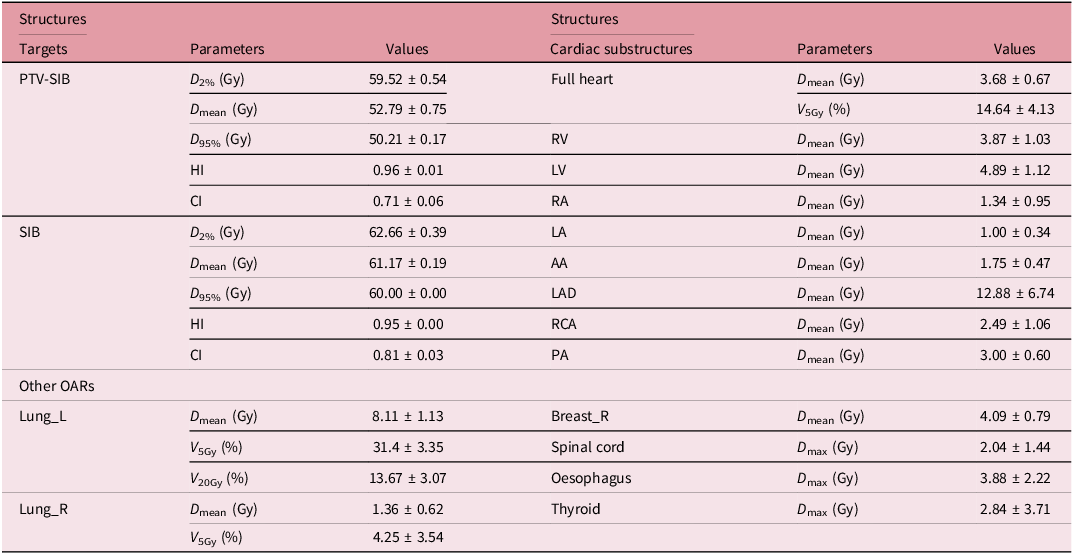
HI, homogeneity index; CI: conformity index.
(2) Scheme A: Maintain total treatment time ( T ) and actual number of treatment days ( n )
Based on the number of interruptions, increase the daily treatment from once to twice during the subsequent 1–10 days of radiotherapy. Keep the physical dose of the tumour tissue consistent. From formula (2), we can find the BED
T
will be increased if considering the incomplete sublethal damage repair, which is beneficial for killing tumour cells. For normal tissue, if the time interval between the two daily treatments is 6 hours, consider the increase in biological damage to normal tissue due to incomplete repair. Use equations (2) and (3) for the calculation. At this point, the daily treatment frequency is m = 2, and the inter-fraction time interval is ΔT = 6 hours. Assume the half-repair time of the normal tissue T1/2 = 4.5 hours,
Reference Dale, Jones and Sinclair30
then according to the formula ${\rm{\mu }} = {{{\rm{In\;}}2} \over {{{\rm{T}}_{1/2}}}}{\rm{\mu }} = 0.15{\rm{h,}}\,\,\emptyset = {{\rm{e}}^{ - {\rm{\mu }} \times \Delta {\rm{T}}}}$
≈ 0.41, substitute into equation (3) to get Hm = 0.41. Substitute the obtained Hm value into equation (2) to get the BEDNA of normal tissue.
${\rm{\mu }} = {{{\rm{In\;}}2} \over {{{\rm{T}}_{1/2}}}}{\rm{\mu }} = 0.15{\rm{h,}}\,\,\emptyset = {{\rm{e}}^{ - {\rm{\mu }} \times \Delta {\rm{T}}}}$
≈ 0.41, substitute into equation (3) to get Hm = 0.41. Substitute the obtained Hm value into equation (2) to get the BEDNA of normal tissue.
(3) Scheme B: Maintain total radiotherapy time and increase the single dose
Assuming the treatment interruptions occurred after five treatments and the number of interruptions is Ni. For tumour tissue, use formula (1) to calculate the single dose d TB , BED T = 5 × d × (1 + d/4.6) + (20-Ni) × d TB × (1 + d TB /4.6) - (33 - 28) × 0.6. For normal tissue, adjust the plan according to the single dose to obtain the corresponding physical dose. Similarly, use formula (1) to calculate the biological dose BED NB at the same time.
(4) Scheme C: Maintain a single dose d and postpone the date of treatment
Increase the number of treatments. Assume the number of treatments after the interruption is n, and the number of interruptions is Ni; then the total treatment time from treatment interruption to completion is ΔT = (n + Ni) × 7/5. Ensure that the BED T of the tumour tissue remains the same, BED T = 5 × d × (1 + d/4.6) + n × d × (1 + d/4.6) - 0.17 × (7 + ΔT - 28), to obtain the value of n. Therefore, the total treatment time is Tc = 7 + ΔT days. At this time, for normal tissue, BED NC = (5 + n) × d × (1 + d/3). According to different numbers of interruptions, the corresponding BED NC can be obtained.
Statistical analysis
All the parameters were calculated from the DVH. Statistical analyses were carried out using IBM SPSS Statistics version 22 (SPSS Inc., Armonk, NY). A paired t-test was performed to analyse the difference between the original and the three schemes, with a Bonferroni correction applied to account for multiple comparisons. An ANOVA test was used to analyse the difference among the three schemes. A p-value < 0.05 was considered to reveal statistical significance. Reference Costin and Marcu33–Reference Yarahmadi, Khani, Nasiri Zarandi, Amini and Yadollahi35
Results
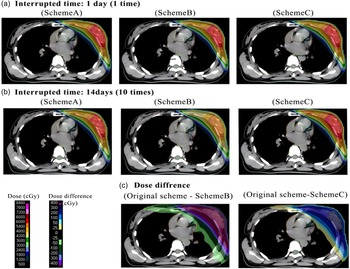
Figure 1 visualises the dose distributions and dose differences of three compensation schemes (Scheme A, Scheme B, Scheme C) under different radiotherapy interruption durations, as well as their dose discrepancies relative to the original scheme. Panel (c) illustrates the dose differences (original scheme − Scheme B, original scheme − Scheme C) for the 14-day interruption condition. The dose difference scale ranges from −400 to 300 cGy, where positive values indicate a higher dose in the original scheme, and negative values indicate a higher dose in the tested scheme.
Notably, Scheme B and Scheme C demonstrate distinct dose redistribution patterns compared to Scheme A, and the dose difference maps in (c) further quantify the dosimetric deviations of Scheme B and Scheme C from the original scheme.
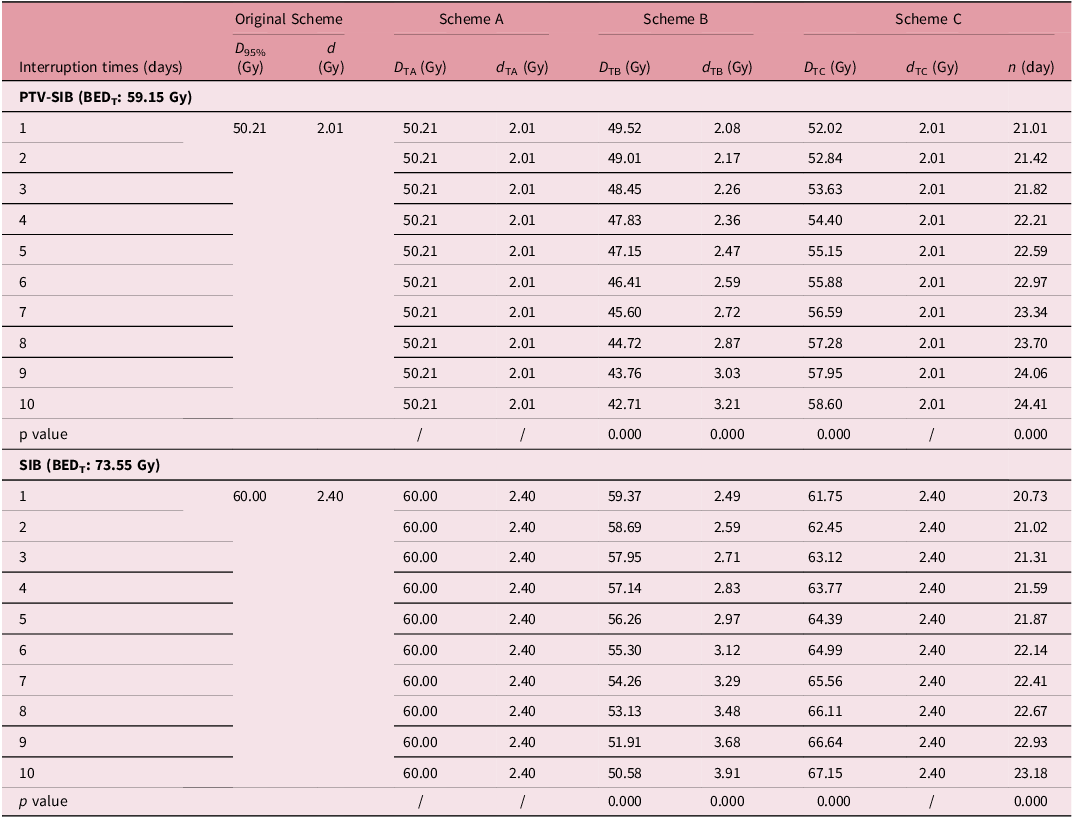
The physical dose in 95% volume (D95%) of targets among three interruption dose compensatory calculation strategies
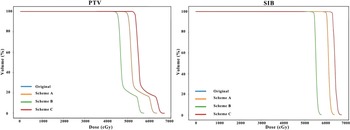
Figure 1 illustrated the variations in physical dose distribution across different schemes. Similarly, Figure 2 presented the alterations in the physical dose DVH for the target area under four schemes. The data indicated that the physical dose of scheme A in the target area was unchanged, whereas schemes B and C exhibited significant changes; notably, as the number of interruptions increased, the dose variations became more pronounced. Table 3 showed that Scheme A maintained the original treatment plan (including the same D95% and single dose for PTV-SIB and SIB as the original scheme) and total treatment duration and ensured the target biological effective dose (BEDT) required for tumour control (PTV-SIB: 68.74 Gy; SIB: 88.30 Gy) was maintained. However, this regimen led to a marked increase in BED within normal tissues. In contrast, scheme B maintains the BED of the tumour tissue by increasing the single dose of the treatment plan. Specifically, when the number of interruptions reached ten in conventional radiotherapy for breast cancer, the PTV-SIB single dose escalated from 2.01 Gy to 3.21 Gy, while the SIB increased from 2.40 Gy to 3.91 Gy. This approach resulted in a reduced BED in normal tissues.
The dose distribution of three schemes. (a) and (b) showed the dose distribution in one CT cross-scan of schemes A, B and C in the interrupted times of 1 day (1 time) and 10 days (10 times), respectively, while (c) showed the dose difference between the original scheme and Scheme B (interrupted times of 10), as well as the original scheme and Scheme C (interrupted times of 10).

The dose-volume histogram (DVH) of targets. It showed the PTV (left) and SIB (right) in the original and three schemes. The dose lines of the original and scheme A overlapped each other.

The mean D95% of targets and single dose (d) in different schemes for 20 patients (α/β = 10 Gy and K = 0.17 Gy/day)

Note: The normality of the dose difference distributions was verified using Shapiro-Wilk tests (FigureS1). Paired sample t-tests were performed for each interruption day (1–10 days) separately: for each target (PTV-SIB/SIB), the physical dose (D95%/single dose d) of Scheme A, Scheme B and Scheme C was compared with that of the original scheme, respectively (total of 10 days × 2 targets × 3 schemes = 60 paired t-tests). Bonferroni correction was applied for multiple comparisons, with the adjusted significance level α = 0.05/60 ≈ 0.0008.
For scheme C, extending the treatment duration—namely, increasing the number of treatment days—ensured that the BED of the tumour tissue remained stable. As indicated in Table 3, when the number of interruptions exceeds three, it is advisable that 1.21–4.41 days of treatment be added on the basis of the original treatment days (e.g., 4 days of interruption require 22.21 treatment days after interruption vs. 20 days originally).
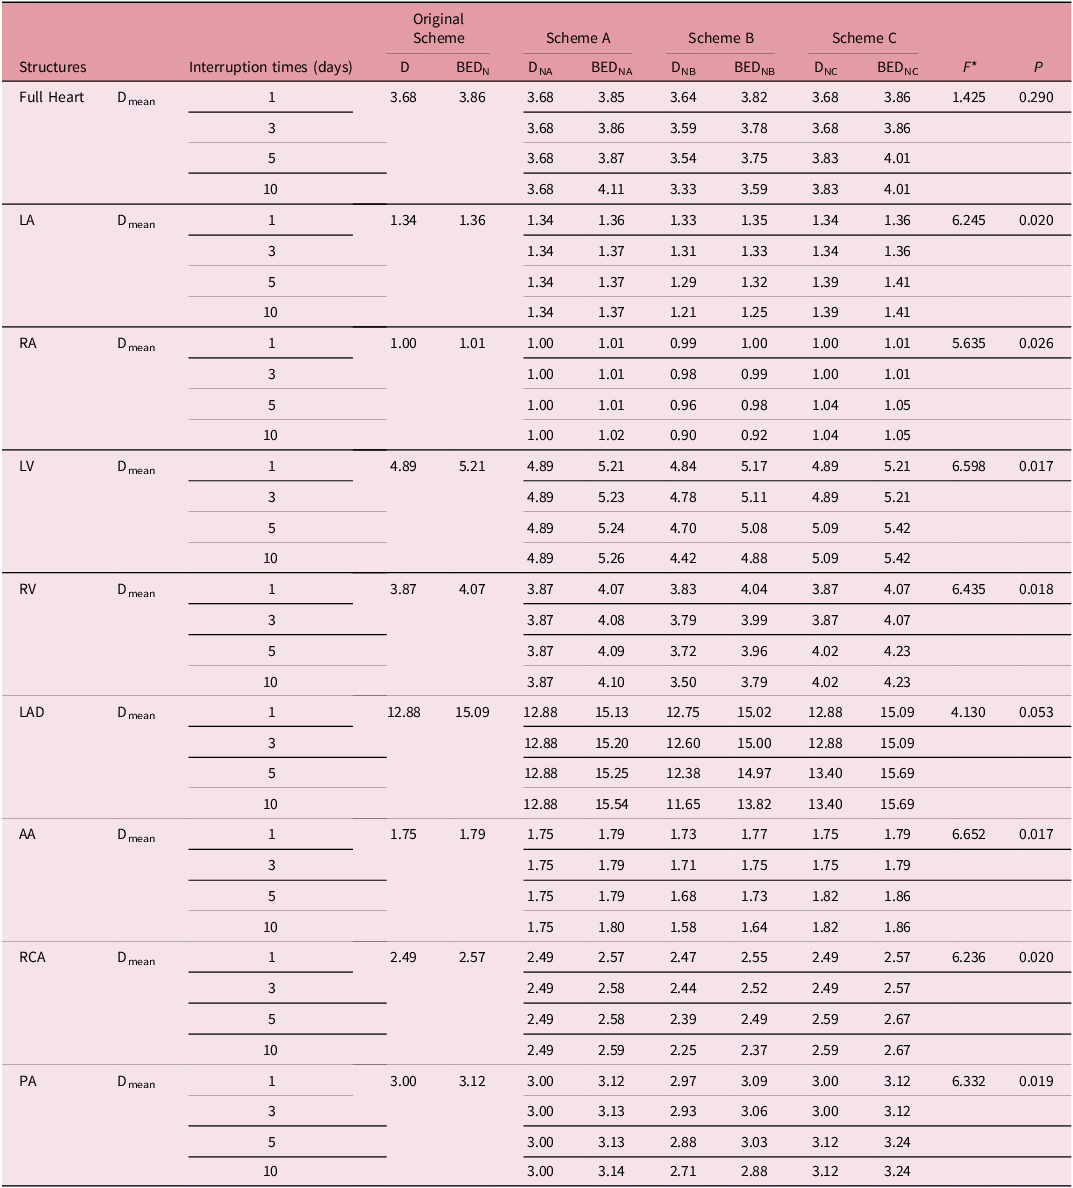
The BED and physical dose (D) of cardiac substructures among three interruption boost schemes
As illustrated in Table 4 and Figure 3, Scheme A exerts the most significant impact on cardiac substructures, particularly the LAD. When employing Scheme A for compensation, an increase in the number of interruptions correlates with a rise in the BED, which escalates from 15.13 to 15.45 Gy as the interruptions increase from 1 to 10. Conversely, when Scheme B is implemented for compensation, the BED of the heart and its substructures experiences a slight reduction, especially in the case of the LAD. At the maximum of 10 interruptions, the BED reaches a minimum of 14.82 Gy. In the case of Scheme C, which is also used for compensation, the trend mirrors that of Scheme A, with an increase in the BED of the heart and its substructures. Specifically, when the number of interruptions reaches 10, the LAD exhibits the most considerable increase, with a BED value of 15.69 Gy. In Figure 3, the DVHs quantify the proportion of each cardiac substructure receiving a specific dose, allowing a direct comparison of dosimetric distributions across the four schemes and facilitating the assessment of normal tissue dose-sparing performance for each interruption compensation strategy.
The BED and physical dose (D, DNA, DNB, DNC) of cardiac substructures in different schemes

* ANOVA, F and P values are for group comparisons of protocols A, B and C, respectively.
The DVH of the heart and cardiac substructures in different schemes. It displays the dose-volume histograms (DVHs) for the whole heart and its substructures, namely the left atrium (LA), right atrium (RA), left ventricle (LV), right ventricle (RV), left anterior descending artery (LAD), ascending aorta (AA), right coronary artery (RCA) and pulmonary artery (PA), under the original scheme, Scheme A, Scheme B and Scheme C.

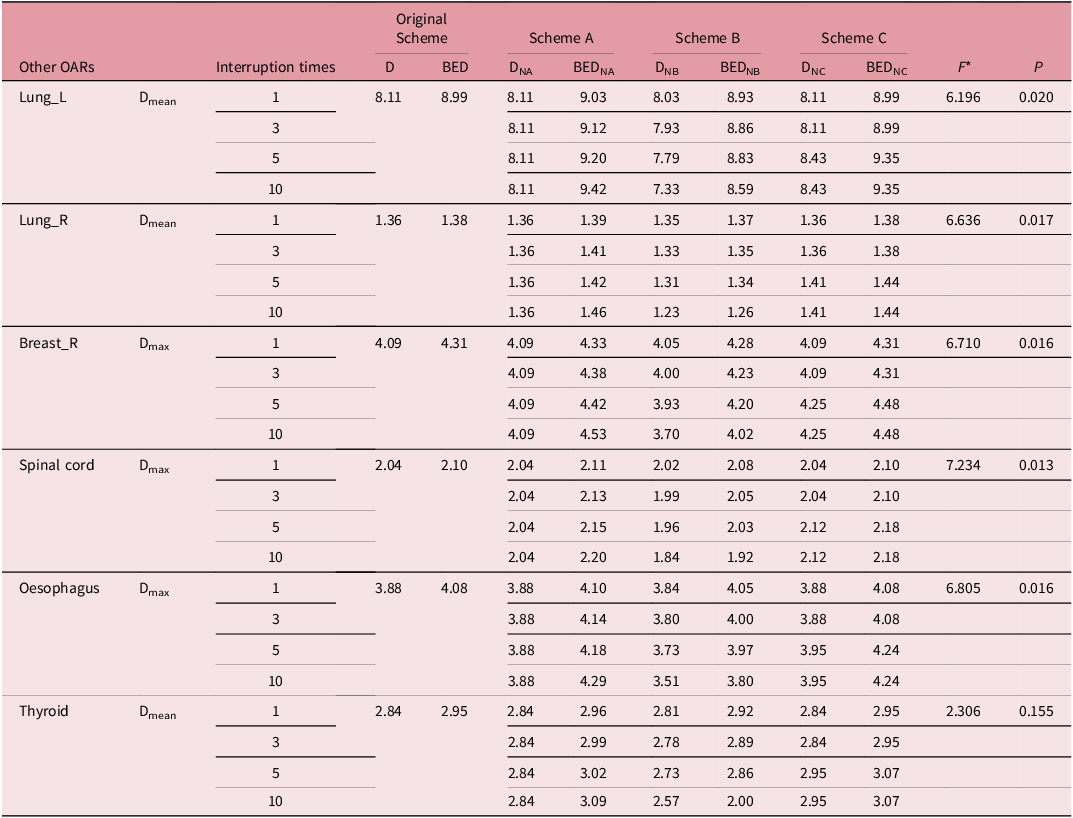
The BED and physical dose (D) of other OARs among three interruption boost schemes
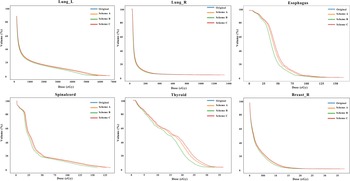
As illustrated in Table 5 and Figure 4, the application of scheme A for compensation results in a significant increase in the BED of other normal tissues, which continues to rise with the number of interruptions. The lung_L tissue exhibited the most pronounced effect; specifically, when the number of interruptions reached 10, the change in BED was calculated as ΔBED ↑ = 9.42 − 9.03 = 0.39 Gy. In contrast, employing scheme B for compensation led to a slight decrease in the BED of normal tissue. For 10 interruptions, this change was ΔBED↓ = 8.93 − 8.59 = 0.34 Gy. Meanwhile, scheme C for compensation maintained a stable BED for tumour tissue, while the BED of normal tissue increased. It was important to note that in conventional breast dose therapy, an increase in treatment days by 1 day was necessitated when the number of interruptions reached 4 (see Table 3). For lung_L, when the number of interruptions reached 10, the change in BED was ΔBED ↑ = 9.35 − 8.99 = 3.6 Gy.
The BED and physical dose (D) of other OARs in different schemes

* ANOVA, F and P values are for group comparisons of protocols A,B and C, respectively.
The DVH of other OARs in different schemes. This figure illustrates the dose-volume histograms (DVHs) for other organs at risk (OARs), encompassing the left lung (Lung_L), right lung (Lung_R), oesophagus, spinal cord, thyroid and right breast (Breast_R), under the original scheme, Scheme A, Scheme B and Scheme C. The x-axis indicates the dose in cGy, while the y-axis represents the volume percentage (%). Curves are colour-coded to distinguish schemes: blue for the original scheme, orange for Scheme A, green for Scheme B and red for Scheme C.

This analysis indicated that Plan B presented significant challenges in clinical operation and necessitates modifications to the follow-up plan, although it effectively reduced the dose to normal tissue. Conversely, schemes A and C were more straightforward to implement in a clinical setting. Scheme A did not prolong the total treatment time but did increase the BED of normal tissue. In contrast, scheme C may extend the total treatment time, particularly when interruptions exceeded four, resulting in the need for an additional treatment session. Therefore, careful selection was warranted, particularly when considering the BED of normal tissue.
Discussion
This study evaluated three BED-based compensation strategies for treatment interruptions in breast radiotherapy, revealing that Scheme B most effectively reduced the BED to OARs—particularly the LAD and left lung, which are critical structures in breast irradiation. Consistent with studies advocating dose escalation to mitigate interruptions, Reference Dale, Hendry, Jones, Robertson, Deehan and Sinclair29,Reference Pozo, Pérez-Escutia and Ruíz36 Scheme B also lowered physical doses to the PTV and SIB relative to the original scheme, whereas Scheme C led to dose escalation. These findings align with established radiobiological principles, where treatment intensification may enhance tumour control at the cost of increased OAR exposure. Reference Schulthess, Rottschäfer, Yates and van der Graaf37 Notably, Scheme B provided the most favourable OAR protection, with the LAD exhibiting the lowest ΔBED after 10 interruptions—indicating a distinct cardioprotective advantage—and the left lung showing a BED reduction suggestive of lower pneumonitis risk. Despite this advantage, the clinical implementation of Scheme B is hindered by the logistical challenge of replanning. In contrast, Schemes A and C, while more readily applicable, result in elevated BEDs to OARs. It is important to note that while the IMPORT HIGH trial Reference Coles, Haviland and Kirby38 established the safety of a planned concurrent boost, the toxicity profile of the additional compensatory dose required for unscheduled interruptions remains unquantified. Therefore, we advocate for a conservative strategy that minimises non-therapeutic dose to OARs, consistent with the fundamental objective of optimised treatment planning.
The protective effect of Scheme B stems from its compensatory design: increasing the dose per fraction preserves target BED despite fewer fractions delivered. This approach exerts a dual radiobiological impact. For the tumour, the raised fractional dose compensates for the reduced number of fractions, maintaining the biological intensity required for control. For OARs, the reduction in total fractions leads to substantial physical dose sparing. Although a higher dose per fraction enhances biological effectiveness in late-responding tissues (with low α/β ratios), the net effect is dominated by the pronounced physical dose reduction. Thus, through replanning, Scheme B achieves an overall decrease in OAR BED, enabling effective tumour control while mitigating normal tissue toxicity.
This mechanism is elucidated by the BED model and the distinct α/β ratios of tumour (α/β = 3.6) versus normal tissues (α/β = 3). The physical dose reduction to OARs in Scheme B outweighs the increased biological effect per fraction, resulting in net BED sparing. Quantitatively, after a ten-day interruption, the LAD BED under Scheme B was 1.72 Gy and 1.87 Gy lower than under Schemes A and C, respectively, confirming its protective advantage. Clinically, protecting the LAD is critical due to its association with radiation-induced heart disease, while sparing the left lung mitigates pneumonitis risk. Scheme B maintained stable BED values for these OARs across interruption scenarios, suggesting potential long-term benefits. The robustness of this protective effect, further supported by multivariate analysis, underscores the clinical relevance of Scheme B in adaptive radiotherapy.
This study demonstrates the applicability of the biologically effective dose (BED) model in evaluating radiotherapy interruptions through its incorporation of tissue-specific α/β ratios and repair mechanisms. This model offers a physiologically grounded framework for comparing compensatory strategies and represents a notable advance over earlier empirical approaches such as NSD and TDF, which lack the radiobiological parameters needed to accurately model differential tissue responses. Reference Orton and Ellis13–Reference Kroening and Deiterman15 The use of the BED model thus provides a mechanistic basis for personalised compensation strategies such as Scheme B and supports its integration into modern adaptive radiotherapy.
Clinically, these findings highlight the need for individualised strategy selection based on patient-specific factors, including tumour proliferation potential and dose sensitivity. Reference Cortés-Puch, Applefeld and Wang39 For instance, (1) Scheme B is prioritised for patients with high proliferation risk (e.g., HER2-positive, high Ki-67) or low α/β-like tumours, as it balances rapid tumour control (no prolonged treatment) and cardioprotection; (2) Scheme A may be considered for patients with low proliferation risk (e.g., elderly, low Ki-67) when replanning is unavailable, despite elevated OAR BED; (3) Scheme C is discouraged due to its substantial treatment prolongation (up to 24.41 days) and heightened repopulation risk under K = 0.6 Gy/day, even for patients with favourable OAR tolerance. Reference Cortés-Puch, Applefeld and Wang39–Reference Abdollahi, Fele-Paranj and Rahmim41
This study is subject to several important limitations that should be considered when interpreting the results. The relatively small sample size of 20 patients from a single institution may limit the generalisability of our findings across diverse patient populations and treatment practices. Furthermore, while the BED model provides a valuable framework for dose compensation, it relies on fixed radiobiological parameters (α/β and K values) and does not account for patient-specific factors such as individual comorbidities, genetic variations in radiosensitivity or concurrent systemic therapies. Additionally, the potential impact of intrafractional anatomical changes, including breathing motion and daily setup variations, was not incorporated into our dose calculations, which may affect the accuracy of the reported dose distributions.
It is also important to note that the dosimetric superiority of Scheme B is tempered by significant clinical implementation challenges. The necessity for comprehensive replanning may limit its feasibility in resource-constrained environments, where time, personnel and technical limitations often make the more convenient Schemes A or C the default choice, despite their dosimetric drawbacks.
Future research should therefore pursue several important directions. First, larger, multi-institutional studies are needed to validate our findings across diverse clinical settings and patient populations. Second, there is a need to develop more efficient replanning protocols, potentially incorporating artificial intelligence and automated planning systems to reduce the time and resources required for adaptive replanning. Third, future studies should aim to incorporate more personalised radiobiological parameters, possibly through biomarkers or imaging biomarkers, to better account for individual variations in treatment response. Finally, long-term clinical studies are warranted to correlate these dosimetric findings with actual clinical outcomes, including local control rates and normal tissue complication probabilities.
Conclusion
This analysis yields a clear hierarchy for compensating radiotherapy interruptions in breast cancer based on OAR protection. Scheme B (replanning with hypofractionation) emerges as the dosimetrically optimal strategy, achieving a substantial BED reduction of up to 1.20 Gy for the LAD. The conventional alternatives, Scheme A and C, which are logistically simpler, result in a dose penalty to the LAD (increases of 0.41 Gy and 0.60 Gy, respectively). The choice of strategy thus presents a direct trade-off between dosimetric benefit and clinical feasibility. For patients where cardiac sparing is paramount, the dosimetric advantages of Scheme B justify the additional effort of replanning. We recommend that these findings be validated in prospective clinical studies to translate this dosimetric benefit into improved long-term patient outcomes.
Data availability statement
Not applicable.
Acknowledgements
Not applicable.
Author contributions
All authors carried out the study. Huanzi Jiang and Rui Zhu draft the manuscript. Zhongya Li collected and analysed data, Xiaoxu Wang prepared all figures, and Suyan Bi and Xiaoxu Wang corrected the manuscript. All authors read and approved the final manuscript.
Financial support
This work has received no funding.
Competing interests
The authors have no conflicts of interest to declare.
Ethics standards
The study was approved by the institutional review board of our hospital and was conducted in accordance with the ethical standards of the Declaration of Helsinki.
Consent for publication
The consents for publication of data have been obtained from patients.


 Open access