





Introduction
Montmorillonite, a mineral of the smectite group, has a 2:1 layered structure where isomorphic substitutions within the octahedral sheet produce a layer charge. Interlayer cations bond with water molecules, resulting in swelling behavior (Grim, Reference Grim1968). On the other hand, zeolites have a three-dimensional framework in which each Si or Al atom is surrounded by four oxygen atoms in a tetrahedral configuration. This framework forms channels and cages that enable zeolites to have large cation-exchange and adsorption capacities (Marantos et al., Reference Marantos, Christidis, Ulmanu, Inglezakis and Zorpas2012; Favvas et al., Reference Favvas, Tsanaktsidis, Sapalidis, Tzilantonis, Papageorgiou and Mitropoulos2016). The structural differences between smectite and zeolites provide distinct physicochemical properties that are highly regarded for their functional significance in various industrial applications (Grim, Reference Grim1968; Grim and Güven, Reference Grim and Güven1978; Harben and Bates, Reference Harben and Bates1984). For example, bentonite, primarily composed of montmorillonite, is considered a buffer material in engineered barrier systems for the deep geological disposal of high-level radioactive wastes (van Olphen, Reference van Olphen1977; Klein and Dutrow, Reference Klein and Dutrow2008; Gupt et al., Reference Gupt, Bordoloi, Sekharan and Sarmah2020; Cui and Chen, Reference Cui and Chen2023; Lee et al., Reference Lee, Yoon and Cho2024; Yoon et al., Reference Yoon, Lee, Lee, Kim, Kim and Kim2024; Kim et al., Reference Kim, Kim, Lee, Kim, Um and Kang2025; Lee et al., Reference Lee, Yoon, Go and Lee2025).
The formation of smectites (e.g. montmorillonite, beidellite, nontronite, and saponite) and zeolites (e.g. clinoptilolite, heulandite, mordenite, phillipsite, and analcime) originates from the alteration of pyroclastic materials such as volcanic ash and volcanic glass (Grim and Güven, Reference Grim and Güven1978; Iijima, Reference Iijima, Chilingarian and Wolf1988). Smectite forms primarily through weathering, diagenesis, or hydrothermal alteration in aqueous environments following the deposition of pyroclastic materials (Grim and Güven, Reference Grim and Güven1978; Christidis et al., Reference Christidis, Scott and Marcopoulos1995; Christidis and Huff, Reference Christidis and Huff2009). It forms predominantly in low-salinity aqueous environments but can also undergo further transformation to zeolites under high-pH conditions, indicating a possible mineralogical transition during progressive alteration (Walton, Reference Walton1975). In contrast, zeolites form through interactions between pyroclastic materials and precursor materials (e.g. volcanic ash and glass, smectite, kaolinite, and feldspar) in saline-alkaline environments, either in open or closed systems (Sheppard and Gude, Reference Sheppard and Gude1973; Hay and Sheppard, Reference Hay and Sheppard2001; Karakaya et al., Reference Karakaya, Karakaya and Yavuz2015).
Zeolite formation generally follows a mineral zonation sequence, beginning with smectite formation and transitioning to zeolite-rich assemblages as geochemical conditions change (Noh and Boles, Reference Noh and Boles1989; Langella et al., Reference Langella, Cappelletti and Gennaro2001; Karakaya et al., Reference Karakaya, Karakaya and Yavuz2015). High Mg2+/H+ ratios favor smectite formation, whereas lower water-to-rock ratios and high Na+, K+, or Ca2+ concentrations promote zeolite crystallization (Christidis, Reference Christidis1998; Christidis and Huff, Reference Christidis and Huff2009). Initially, volcanic glass undergoes hydration and leaching, releasing silica and aluminum into solution. Under medium to high pH conditions (pH 7–9), smectites, especially montmorillonites, form due to their stability in low-alkalinity environments (Karakaya et al., Reference Karakaya, Karakaya and Yavuz2015). Smectite is typically precipitated in the upper alteration zone, where active groundwater flow enhances silica mobility. As the process progresses, the transformation from smectite to zeolite is facilitated by increasing alkalinity and cation availability (e.g. Na+, K+, and Ca2+) (Christidis, Reference Christidis1998).
The mineralogical patterns of zeolitized tuffs reflect a gradual transition from smectite-dominated zones to zeolite-rich facies. In open hydrological systems with continuous fluid exchange, smectite predominates due to the leaching of soluble elements. In contrast, closed systems with restricted fluid movement and increased silica saturation favor the gradual replacement of smectite by zeolites (Noh and Boles, Reference Noh and Boles1989; Karakaya et al., Reference Karakaya, Karakaya and Yavuz2015). In some cases, long-term diagenesis results in complete zeolitization, with almost all volcanic glass being replaced by zeolite minerals, often accompanied by minor calcite or opal-CT precipitation (Altaner and Grim, Reference Altaner and Grim1990). In marine deltaic systems, such as the Miocene deposits of the Pohang Basin, South Korea, zeolite (heulandite) occurs as a diagenetic cement that evolves from smectite in response to changes in burial temperature and pore-water chemistry (Noh, Reference Noh1998).
Despite extensive studies on bentonite and zeolite deposits, the relationships among their depositional environments, geochemical conditions, and mineral formation pathways remain incompletely constrained, particularly in settings where vertically contrasting smectite- and zeolite-dominated assemblages occur within the same volcanic sequence. The present study investigated the formation environments and diagenetic processes associated with smectite and zeolite in the Pohang region, South Korea, using depth-classified outcrop and core samples. Mineralogical, geochemical, and thermal datasets were integrated with bacterial community profiles to infer redox and salinity conditions during mineral formation. Microbial-community composition was used as an environmental indicator rather than as evidence for direct biological control on mineral formation. By combining microbial indicators with independent mineralogical and geochemical constraints, this study provides a robust framework for interpreting the depositional and diagenetic conditions associated with contrasting smectite and zeolite formation.
Geological settings
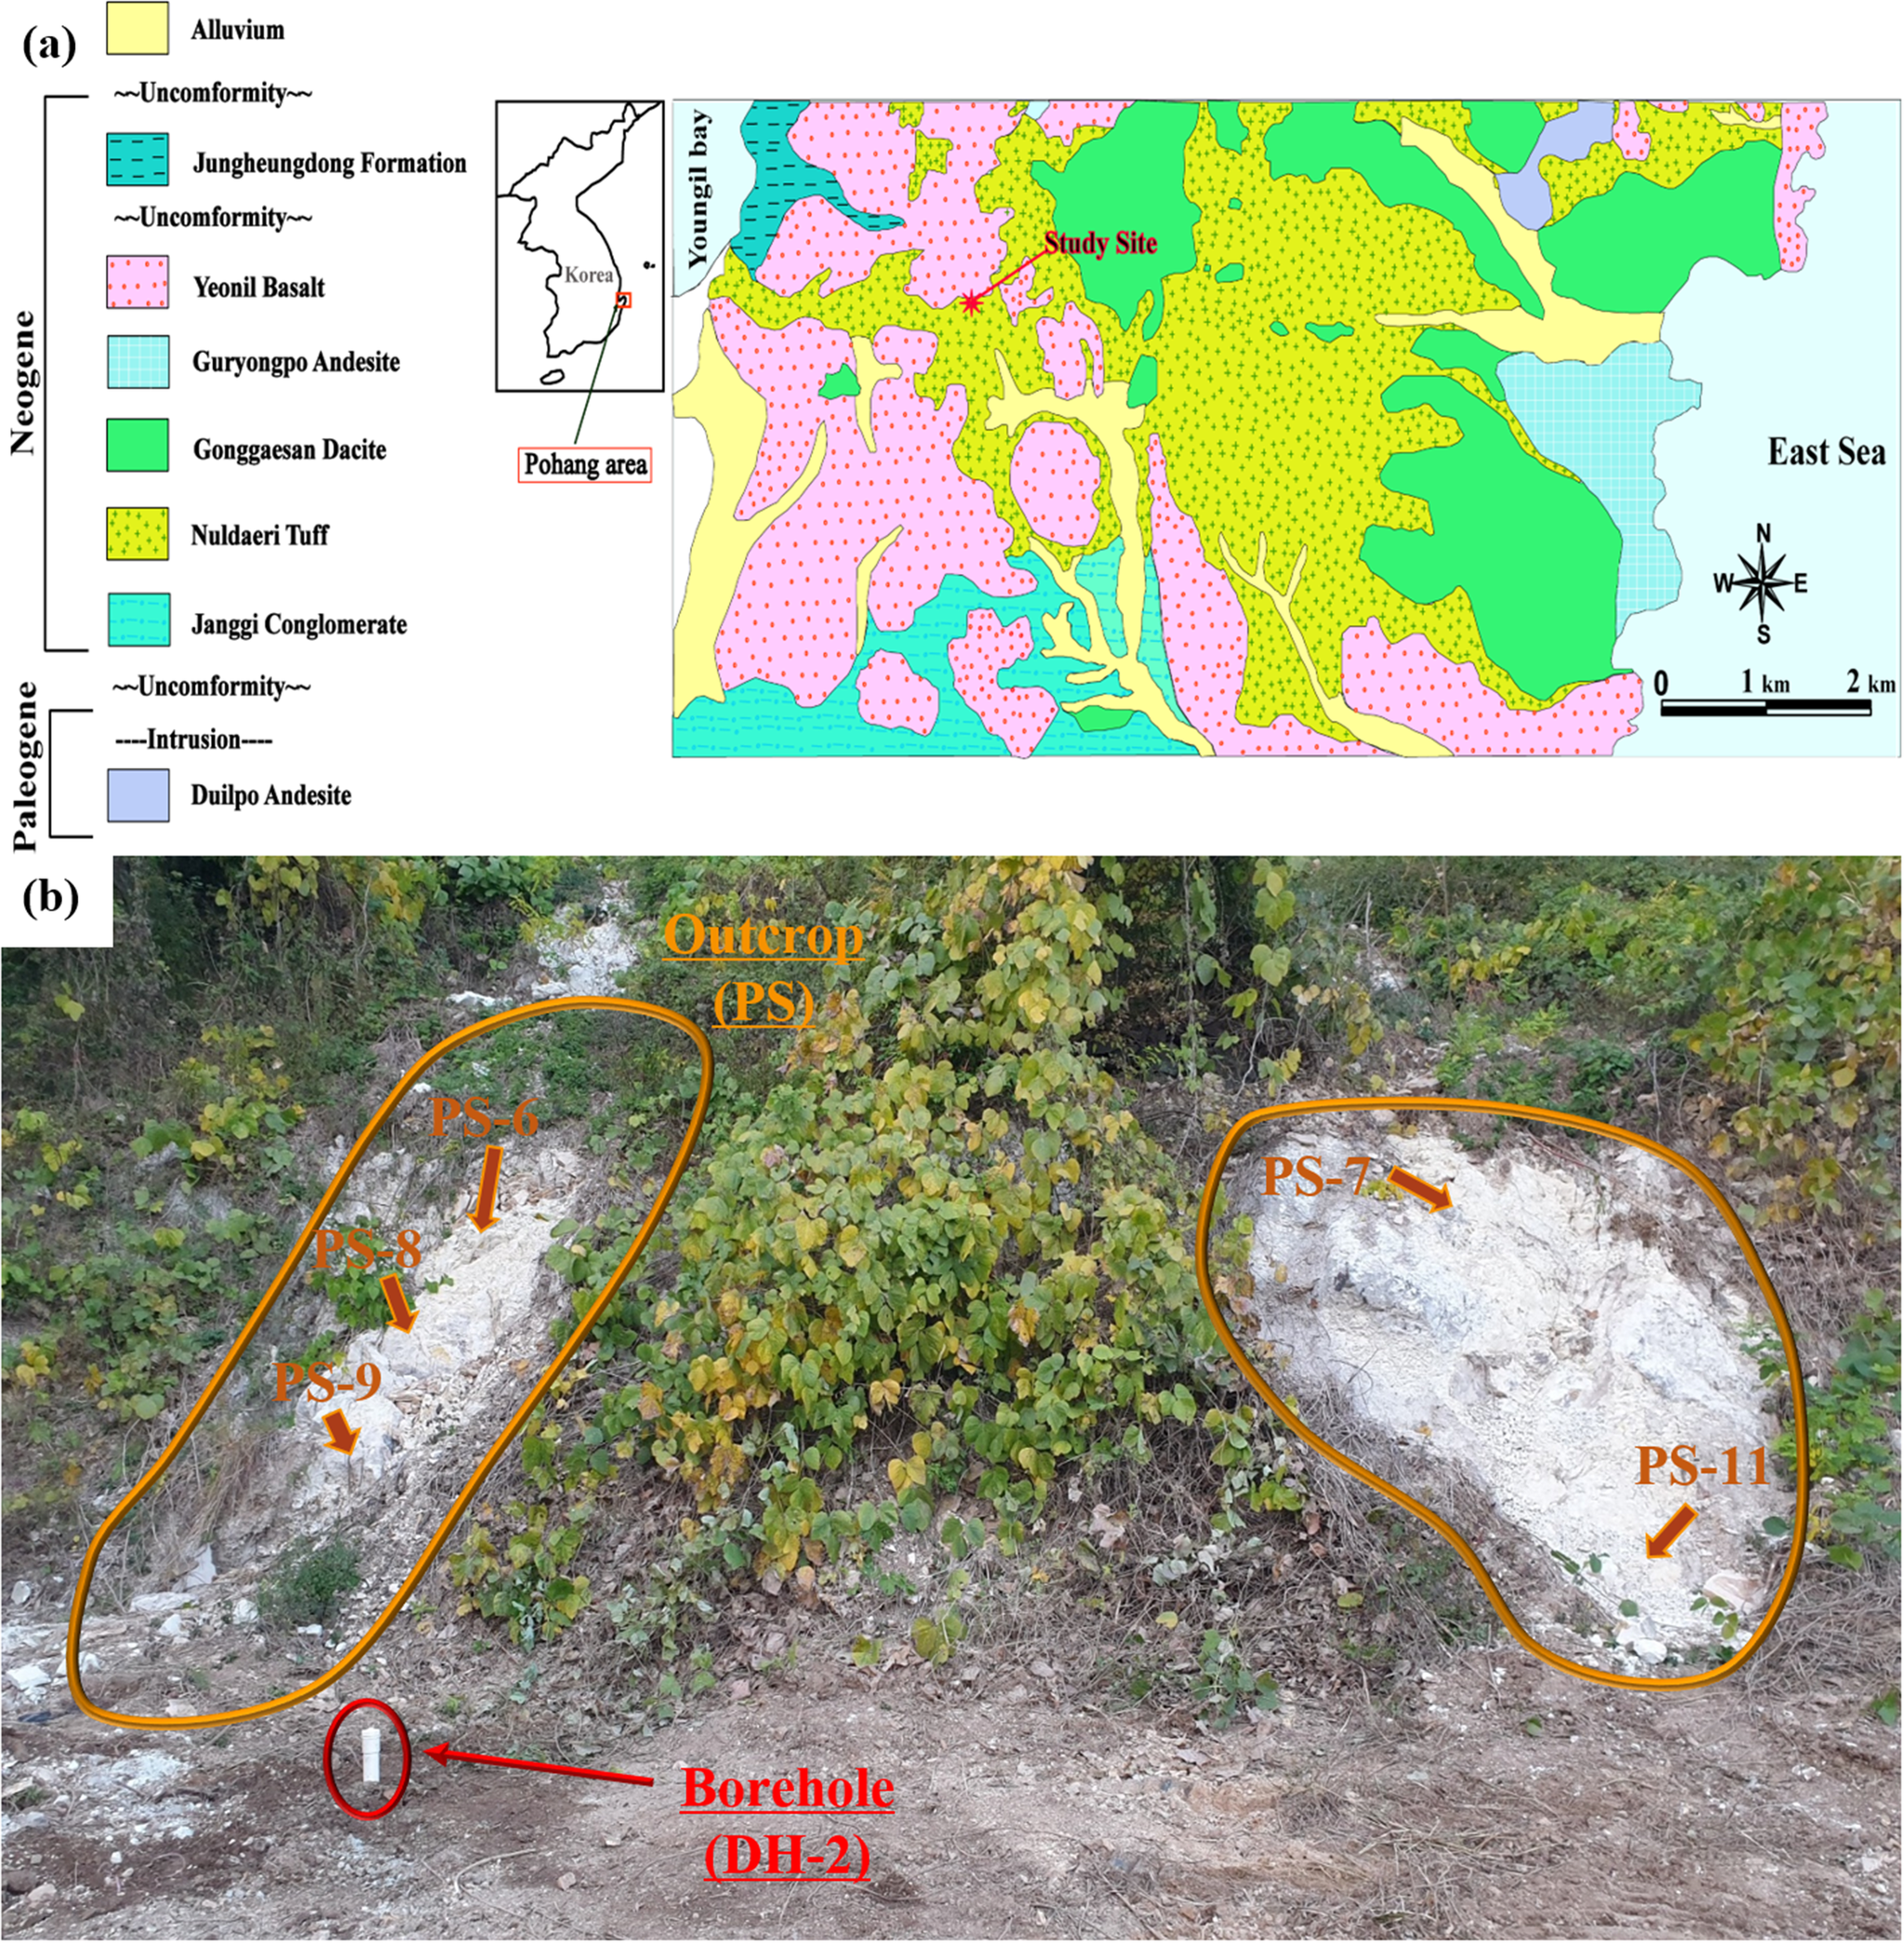
The study site is located in the Donghae-myeon area of Pohang-Si, situated in the southeastern part of the Korean Peninsula (Fig. 1a). The site was formed by volcanic activity during the Neogene period (Miocene–Pliocene: 23–2.6 Ma) and is predominantly composed of volcanic rocks, including clastic sedimentary and pyroclastic rocks (Bahk and Chough, Reference Bahk and Chough1996; Kwon et al., Reference Kwon, Jeong and Sohn2011; Sohn et al., Reference Sohn, Ki, Jun, Kim, Cho and Son2013). The Neogene period coincides with the opening of the East Sea, during which tectonic movements in the Circum-East Sea region, accompanied by volcanic activity, significantly influenced the Pohang area (Kim, Reference Kim1970; Yoon et al., Reference Yoon, Chang, You and Lee1991). During the Miocene, bimodal volcanic activity ranging from felsic to mafic compositions led to the formation of volcanic, pyroclastic, and sedimentary rocks in the southeastern sedimentary basins of the Korean Peninsula (Bahk and Chough, Reference Bahk and Chough1996). The Pohang Basin experienced rapid subsidence at a rate of ~700 m my–1 during the middle Miocene and was uplifted in the late Miocene (Chough and Barg, Reference Chough and Barg1987; Hwang and Chough, Reference Hwang, Chough, Deltas and Colella1990).
(a) Geological map of the study area (adapted from Lee and Kim, Reference Lee and Kim2012; Son, Reference Son2014); and (b) sampling locations of the outcrop and core samples.

The study site consists primarily of Miocene dacitic pyroclastic rocks, forming a stratigraphic succession from the bottom upward that includes dacitic breccia, volcanic tuff, welded tuff, dacite, tuffaceous sandstone, and tuffaceous mudstone (Yoon, Reference Yoon1989; Yoon, Reference Yoon1992; Yoon, Reference Yoon1997; Yoon, Reference Yoon2010). Similarly, Son (Reference Son2014) described the stratigraphy, from the bottom up, as consisting of conglomerate, tuff, dacite, andesite, and basalt (Fig. 1a), suggesting that tuff consists primarily of light gray or pale gray volcanic ash, which includes volcanic rock fragments, pumice fragments, lapilli tuff, and some tuffaceous breccia.
The study site was used previously for bentonite mining but has since been closed and restored, with ~9 m of overburden now covering the mined surface (Fig. 1b). The remaining outcrop is composed primarily of tuff, which was deposited extensively during the Miocene, with adjacent layers of dacite and basalt (Fig. 1a).
Materials and methods
Materials
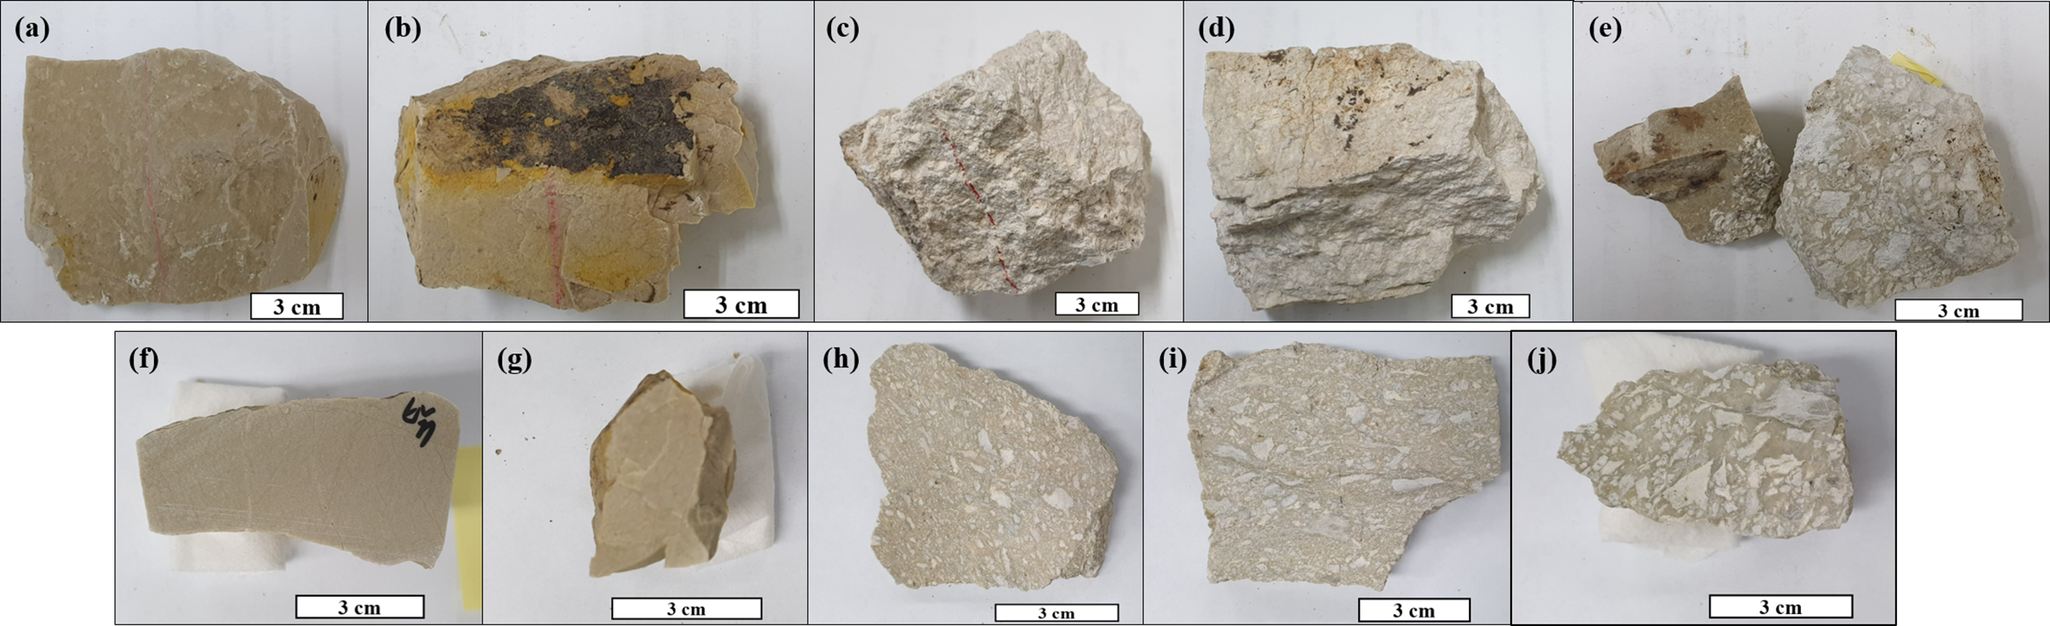
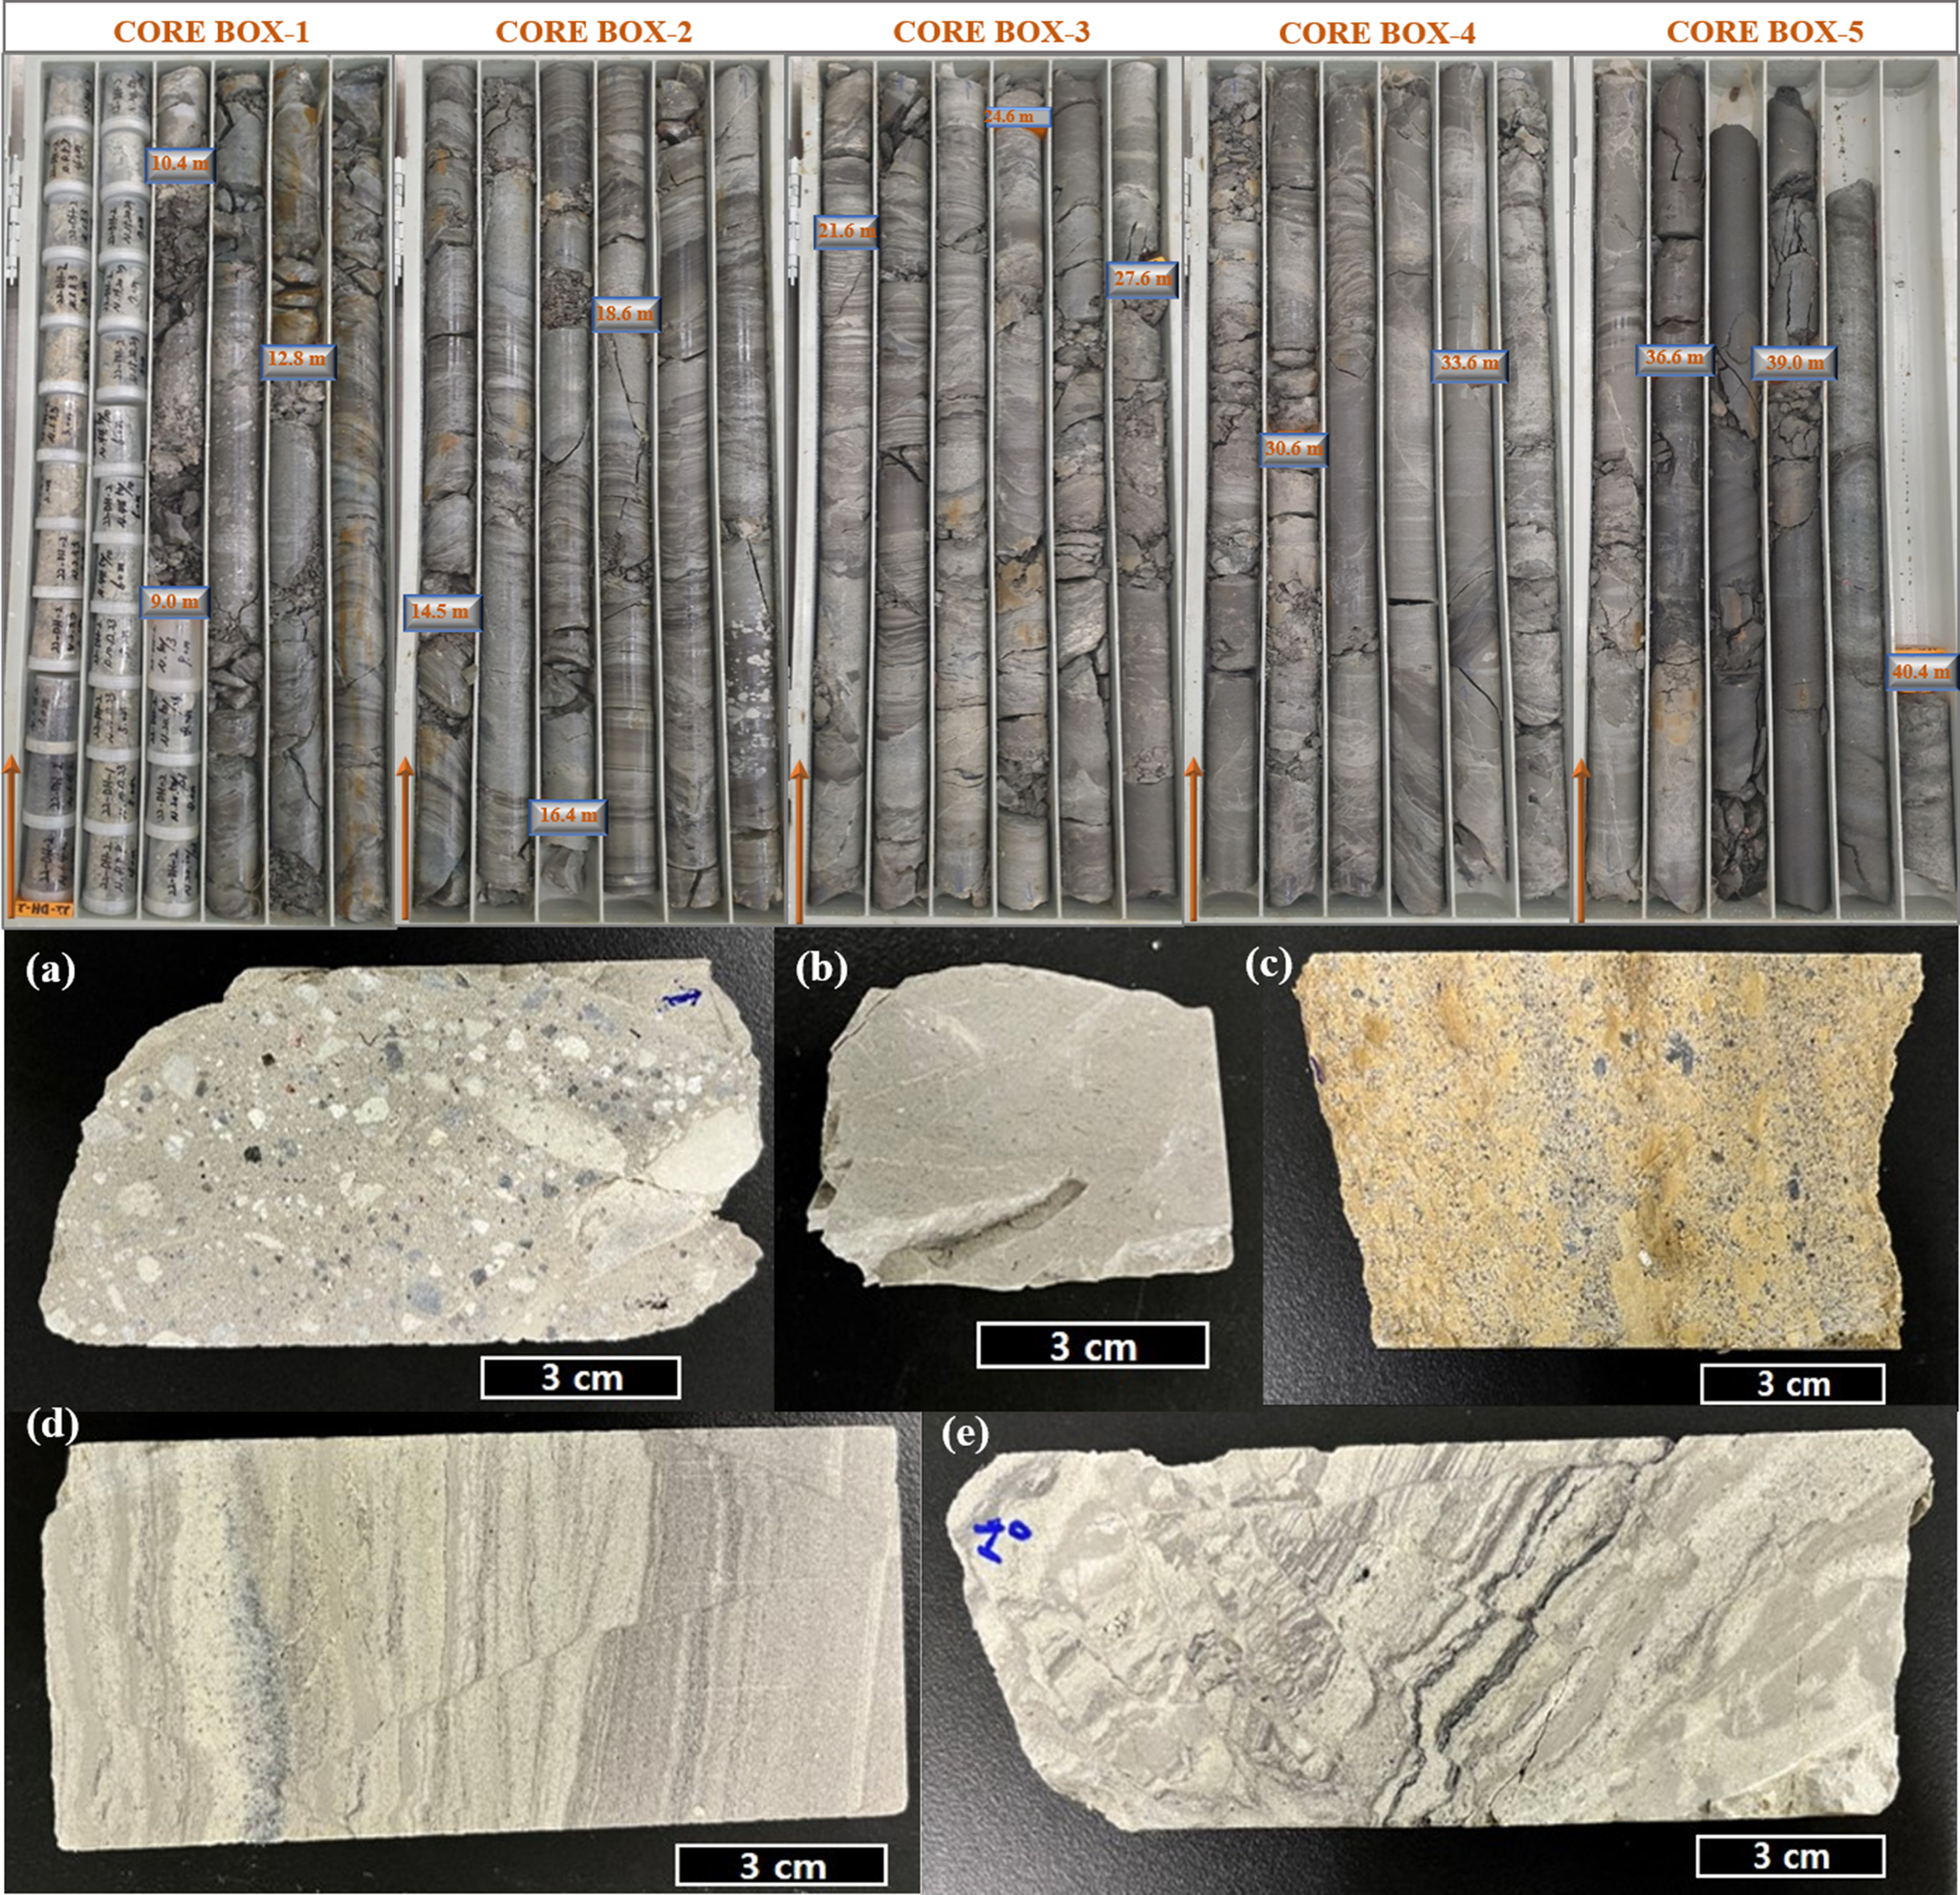
The samples were obtained from upper and lower parts of an outcrop (Fig. 2; PS) within the study site and from a core (Fig. 3, DH-2) extracted at a depth of ~40 m. The outcrop samples are composed of fine-grained volcanic ash tuff, exhibiting light gray to white and pale yellowish hues (Fig. 2a–e). Some of the samples contain visible phenocrysts such as feldspar, as well as translucent pumice and rock fragments (Fig. 2c–e). The core samples vary in color from light gray to dark gray (Fig. 3). The upper section of the DH-2 core contains mostly lapilli tuff, with some sections showing volcanic breccia (Fig. 3a). In deeper sections, alternating layers of fine-grained or sandy tuff form distinct stratifications (Fig. 3c–e) or appear as partially massive structures (Fig. 3b). Numerous fractures, joints, and small faults are observed, and thin fine-grained layers produce complex and repetitive layering structures (Fig. 3d,e).
Outcrop samples collected from the study site and their corresponding cross-sections: PS-6 (a, f), PS-7 (b, g), PS-8 (c, h), PS-9 (d, i), and PS-11 (e, j).

Core samples (DH-2, upper ~40 m) and cross-sections (lower panels: a–e): (a) lapilli tuff, (b) massive tuff, (c) alternating fine and sandy tuff layers, (d) alternating layers of variable grain sizes with fine faults, (e) fine faults and wavy laminated layers.

Five outcrop samples (PS-6, -7, -8, -9, -11) were collected separately from the upper and lower parts of the exposure (Figs 1 and 2). Each sample was ground and homogenized individually before analysis. The core samples (DH-2) were obtained from seven specific depths (10.9, 12.9, 19.7, 25.9, 33.3, 37.8, and 39.6 m) to account for variations in rock-layer characteristics with depth. Each core sample was ground (Fig. 3).
Methods
The mineral composition was analyzed using powder X-ray diffraction (XRD) (Bruker D2 Phaser). Both outcrop and core samples were ground, sieved to <75 μm, and air-dried before analysis. The analytical conditions for the random mounts (<75 μm) were as follows: CuKα radiation (λ=1.5418 Å), 30 kV, 10 mA, with a scan speed of 0.02°2θ s–1 in the range 2–65°2θ. For the outcrop and core samples in which smectite was identified, oriented and ethylene-glycol (EG)-treated mounts (<2 μm) were prepared and analyzed. The oriented mounts were prepared by mixing the dried random powder with deionized (DI) water (without adding a dispersion agent) to form a suspension. These suspensions were filtered under suction. The clay cake residue on the cellulose filters was transferred carefully onto a glass slide following the procedure of Newman (Reference Newman1987). The oriented mounts were equilibrated in a thermos-hygrostat chamber (Jeiotech model TH3-ME-100) at 30°C and 30% relative humidity for 24 h to ensure consistent moisture conditions prior to analysis. After XRD analysis, the oriented mounts were saturated with EG in an oven at 60°C for ~6 h. The XRD analyses of the oriented and EG-treated mounts were conducted over the range 2–30°2θ.
Fourier-transform infrared spectroscopy (FTIR; Cary 630 FTIR) analysis was performed to assess crystal-structure characteristics. Samples were mixed with KBr in a ratio of 1:200 (0.005 g of sample per 1.0 g of KBr), compressed into disks, and analyzed in the spectral range of 400 to 4000 cm–1.
Thermogravimetric analysis (TGA; TA Instruments/SDT650) was performed to characterize thermal properties based on mineral composition. Approximately 200 mg of each sample was heated from room temperature to 950°C at a rate of 10°C min–1, and the mass-loss characteristics were recorded to generate TGA-DTG (derivative thermogravimetry) curves.
27Al magic angle spinning nuclear magnetic resonance (MAS NMR) spectra for the outcrop samples (PS series) and selected core samples (<2 μm fraction) were obtained using a 500 MHz Bruker Avance III HD solid-state NMR spectrometer (Bruker, USA) at the National Center for Inter-University Research Facilities (NCIRF), Seoul National University, South Korea. A spinning speed of 5 kHz and a pulse repetition delay of 5 s were used for all measurements.
Major element compositions were determined using X-ray fluorescence (XRF; Shimadzu MXF-2400, Shimadzu XRF-1800). Samples (<75 μm) were mixed with Li2B4O7 flux in a fixed ratio to produce glass beads for analysis. Quantitative results were obtained by comparing measured values with standard reference material (OG-1). Loss on ignition (LOI) was measured by applying temperatures exceeding 995°C.
Rare earth elements (REEs), trace elements, and immobile elements were analyzed using high-resolution inductively coupled plasma mass spectrometry (HR-ICP-MS). For sample preparation, 0.1 g of each sample was mixed with ammonium hydrogen difluoride flux, heated, and decomposed using nitric acid (HNO3) and perchloric acid (HClO4). The decomposed samples were diluted with DI water to prepare solutions, which were then analyzed using HR-ICP-MS.
Three samples (one outcrop sample at PS-6 and two core samples at depths of 10.9 m and 37.8 m) were selected to investigate the bacterial community structure. Genomic DNA (gDNA) was extracted from 8.0 g of each sample using the DNeasy PowerMax Soil Kit (Qiagen, Germany). DNA libraries were prepared using the Illumina MiSeq platform (Illumina, USA) at Macrogen Corporation (Republic of Korea). The V3–V4 region of the 16S rRNA gene was amplified using universal bacterial primers: 341F (5′-CCTACGGGNGGCWGCAG-3′) and 805R (5′-GACTACHVGGGTATCTAATCC-3′). The thermocycler conditions for amplifying the 16S rRNA gene were as follows: initial heat activation at 95°C for 3 min, 25 cycles of 95°C for 30 s, 55°C for 30 s, and 72°C for 30 s and final elongation at 72°C for 5 min. Adapter and primer sequences were removed using Cutadapt (version 3.2). Quality filtering, sequence trimming, merging, and chimera removal were conducted using DADA2 (version 1.18.0), resulting in amplicon sequence variants (ASVs). A total of 133,941 qualified sequences were generated and assigned to 120 ASVs. The sequence data were deposited in the NCBI Sequence Read Archive (Bioproject: PRJNA1153632). Alpha diversity indices for species richness and evenness (Chao 1 and Shannon) were calculated using QIIME software (version 1.9.0).
Mössbauer spectra were obtained from outcrop and core samples at ~25°C using a transmissive constant-acceleration Mössbauer spectrometer (M96, RCPTM, Czech Republic). A 57Co source with an activity of 50 mCi was used for the measurement. An Fe foil was used as the reference material for energy calibration. Approximately 20–30 mg of each sample was used for the analysis. The spectra were processed using the MossWinn program (Klencsár et al., Reference Klencsár, Kuzmann and Vértes1996).
Results and Discussion
XRD analysis
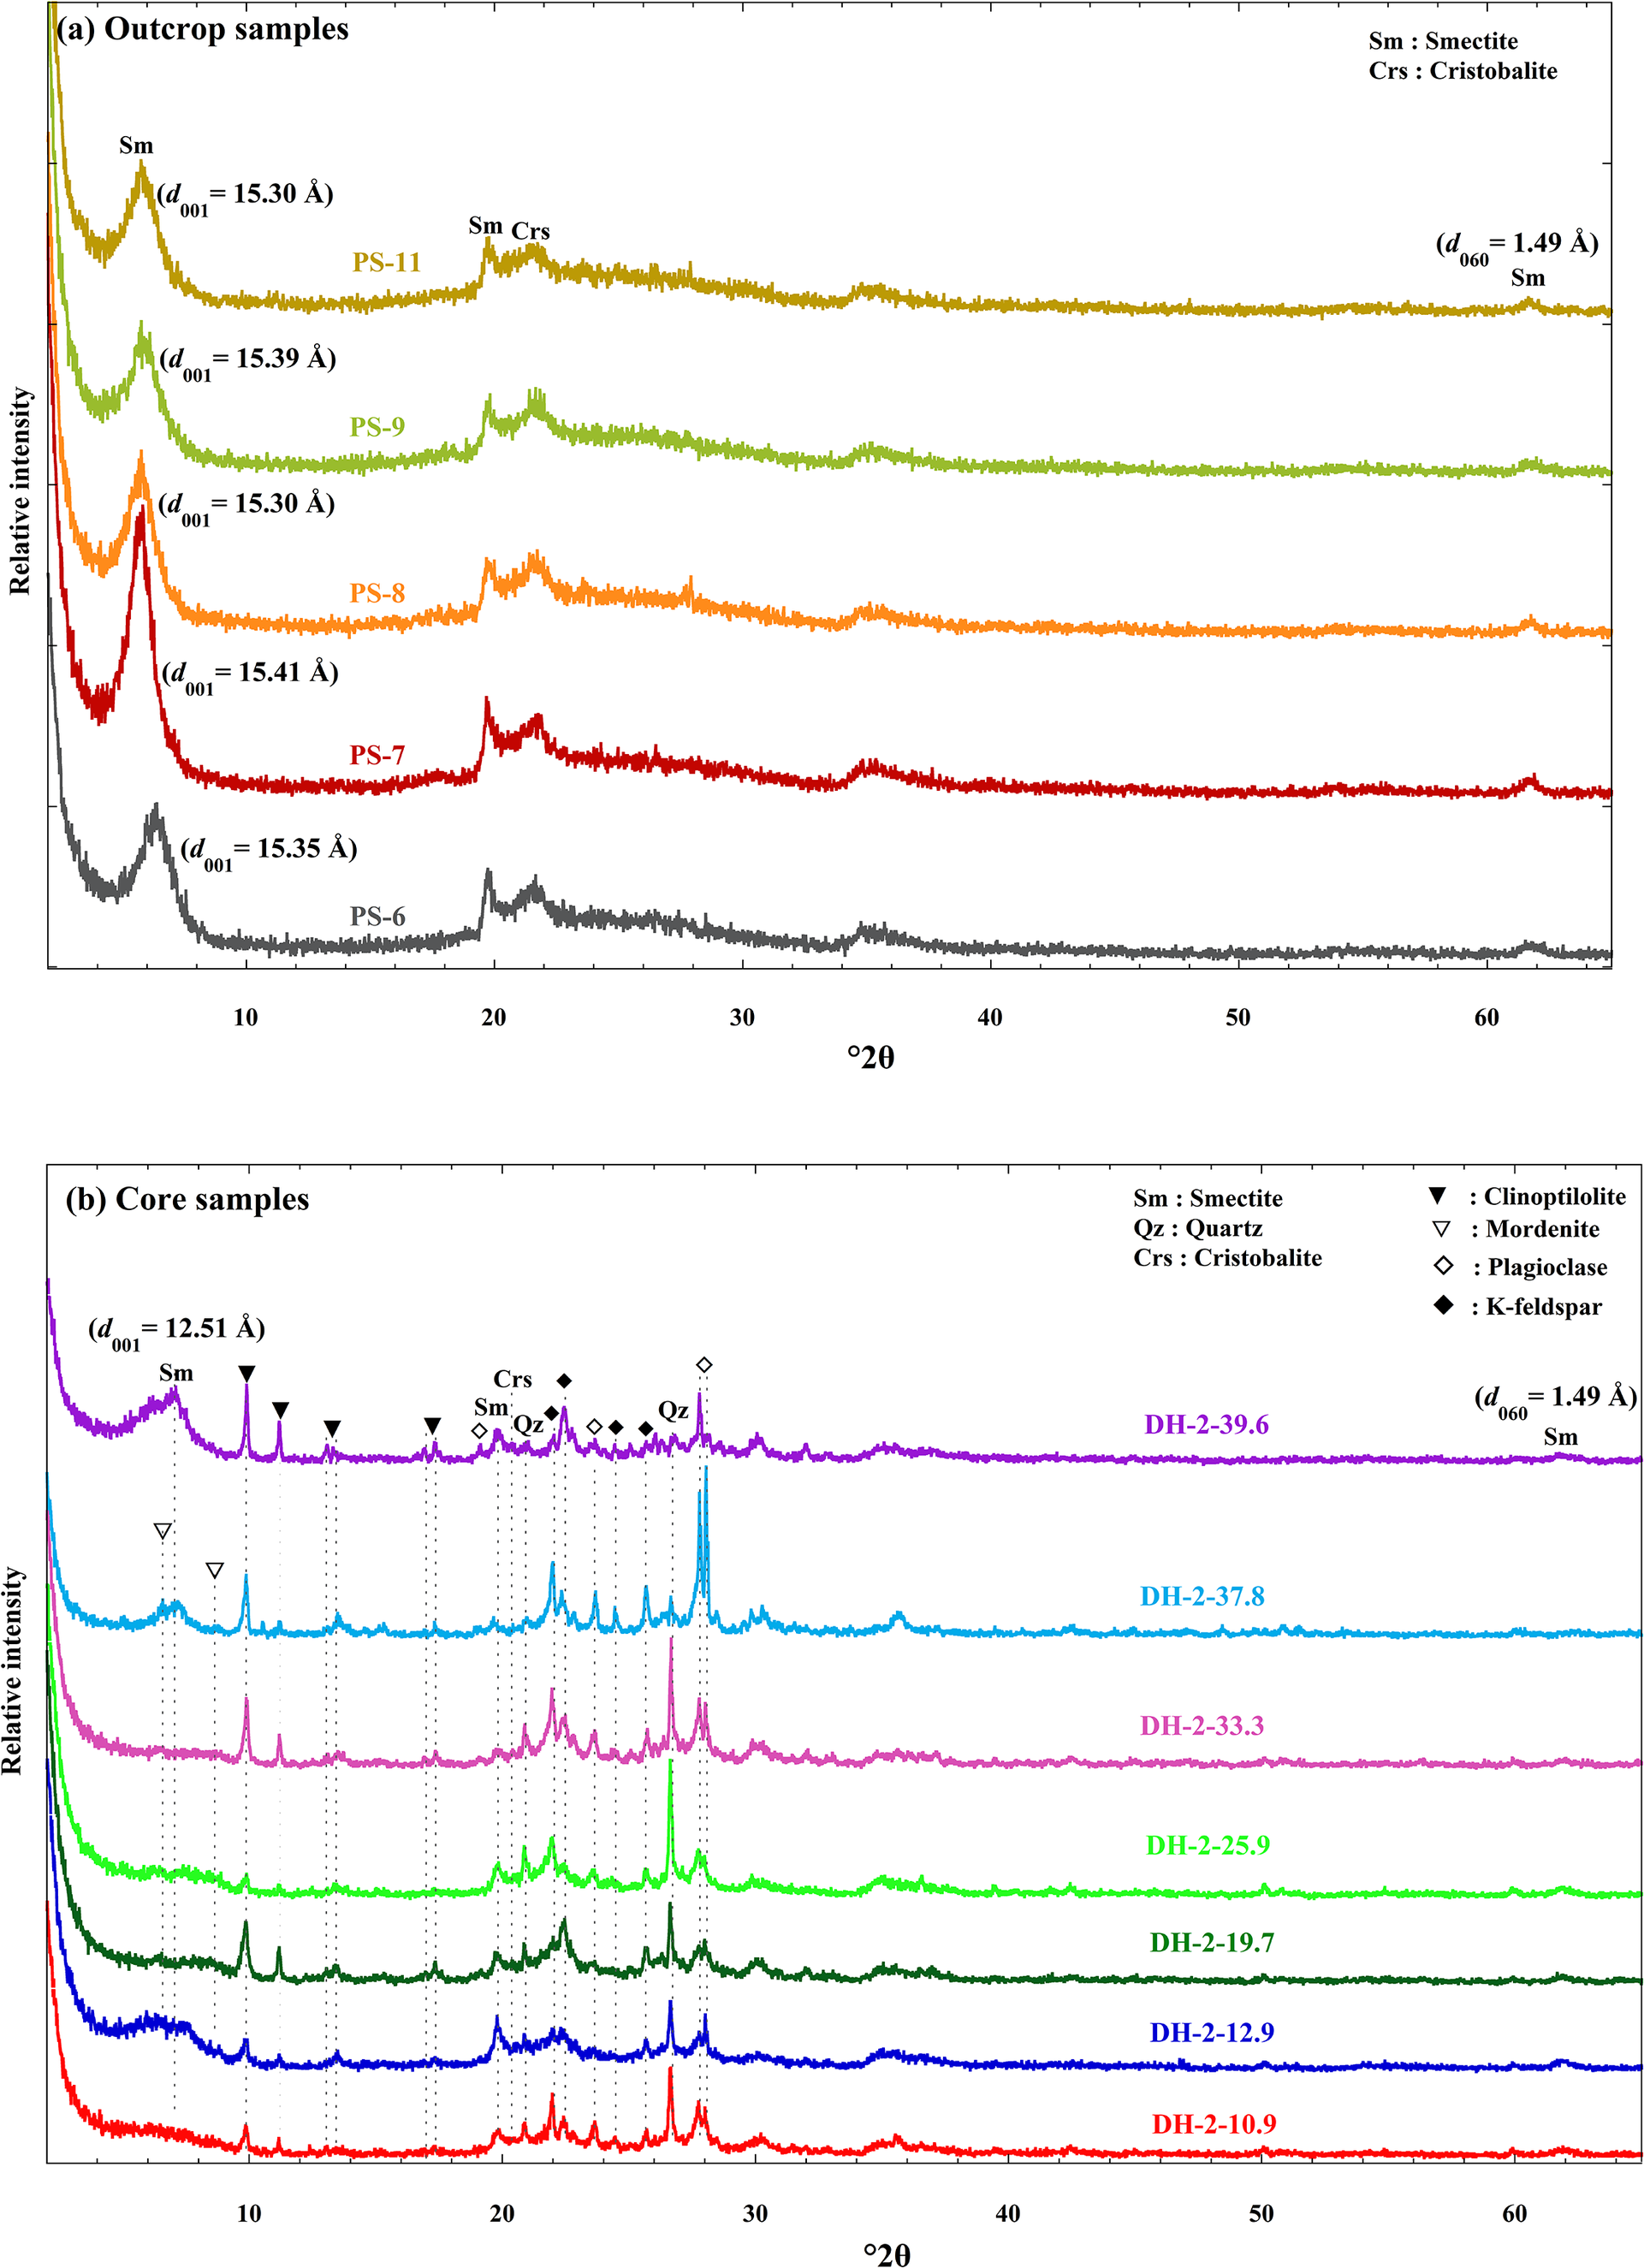
The XRD analysis results of the random mounts of the outcrop samples (PS) show that they consist primarily of smectite, with cristobalite and traces of quartz and plagioclase (Fig. 4a). The XRD patterns showed distinct broad humps between 16 and 30°2θ, indicating the presence of amorphous minerals. Amorphous minerals typically exhibit a broad hump pattern between 15° and 30°2θ due to diffuse scattering, indicating their non-crystalline nature (Singh and Subramanian, Reference Singh and Subramanian2016). Amorphous alumino-silicate minerals such as allophane [Al2O3(SiO2)1.3-2·2.5–3H2O] and imogolite [Al2SiO3(OH)4] often form from volcanic ash and glass during volcanic eruptions (Cruz and Real, Reference Cruz and Real1991). The presence of the hump pattern suggests amorphous alumino-silicate minerals at the study site, consistent with its volcanic origin.
Powder XRD patterns of: (a) outcrop samples (PS); and (b) core samples (DH-2).

The smectite (PS, <75 μm) shows nearly identical (001) peaks with °2θ and d-spacing values of 5.73–5.77°2θ and 15.30–15.41 Å, respectively, and a (060) peak with a d-spacing value of 1.49 Å (Fig. 4a). The d-spacing of the smectite (001) peak indicates the presence of interlayer bound water that remains after drying (Środoń and McCarty, Reference Środoń and McCarty2008). In the oriented and EG-treated outcrop samples (<2 μm), the smectite (001) peak occurs at 15.14–15.55 Å, and 18.07–18.22 Å, respectively (see Fig. S1a–e in the Supplementary material). The expansion in d-spacing upon EG-treatment is attributed to the formation and variable thickness of the EG solvation layer (Moore and Reynolds, Reference Moore and Reynolds1997) and/or differences in the layer charge density of smectite particles (Christidis and Eberl, Reference Christidis and Eberl2003). These d-spacing values indicate typical dioctahedral Ca-smectite, where Ca2+ in the interlayer is typically hydrated with two water layers (Moore and Reynolds, Reference Moore and Reynolds1997; Ferrage et al., Reference Ferrage, Lanson, Sakharov and Drits2005; Dafalla and Mutaz, Reference Dafalla and Mutaz2012; Sun et al., Reference Sun, Tanskanen, Hirvi, Kasa, Schatz and Pakkanen2015).
In the core samples, although slight variations in mineral composition occur with depth, most samples contain quartz, cristobalite, plagioclase, and K-feldspar (Fig. 4b). Distinct peaks for smectite were observed mainly in the sample from a depth of 39.6 m (DH-2-39.6). The XRD analysis results showed that the d-spacing values for the (001) and (060) peaks of smectite in random mounts of DH-2-39.6 (<75 μm) were ~12.51 Å and 1.49 Å, respectively (Fig. 4b). The XRD patterns of oriented and EG-treated mounts for sample DH-2-39.6 (<2 μm) are shown in Fig. S1f (Supplementary material). The d-spacing values of the oriented and EG-treated sample are 12.93 Å and 18.09 Å, respectively, which are consistent with those typical of Na-dominant smectite, where Na+ in the interlayer cation typically forms a single hydration layer prior to EG-treatment. These results indicate the coexistence of Na and Ca-smectite in the sample, with Na+ being slightly more dominant in the interlayer than Ca2+ (Dafalla and Mutaz, Reference Dafalla and Mutaz2012; Sun et al., Reference Sun, Tanskanen, Hirvi, Kasa, Schatz and Pakkanen2015). The identified plagioclase was predominantly albite (Ab90–An10), with minor peaks corresponding to labradorite (Ab50–30–An50–70). The K-feldspar was identified as orthoclase (Fig. 4b).
In contrast to the outcrop samples, clinoptilolite, a zeolite group mineral, was present in the core samples at all depths, and mordenite, a zeolite mineral, was also identified in samples from certain depths (Fig. 4b). Clinoptilolite, which commonly forms solid solutions with heulandite, is one of the most abundant natural zeolites (Gottardi and Galli, Reference Gottardi and Galli1985; Satokawa and Itabashi, Reference Satokawa and Itabashi1997). Zeolites form through complex dissolution-precipitation processes involving volcanic ash and glass (Noh and Boles, Reference Noh and Boles1989; Hay and Sheppard, Reference Hay and Sheppard2001). The overlap of clinoptilolite and heulandite peaks in some samples indicates their co-existence. Additionally, mordenite, was weakly detected in the XRD analysis (Fig. 4b). The occurrence of mordenite, typically associated with clinoptilolite, indicates that clinoptilolite is more abundant than heulandite at the study site (Mormone and Piochi, Reference Mormone and Piochi2020). This further suggests that Na is probably the dominant cation in the chemical composition of minerals.
SEM analysis
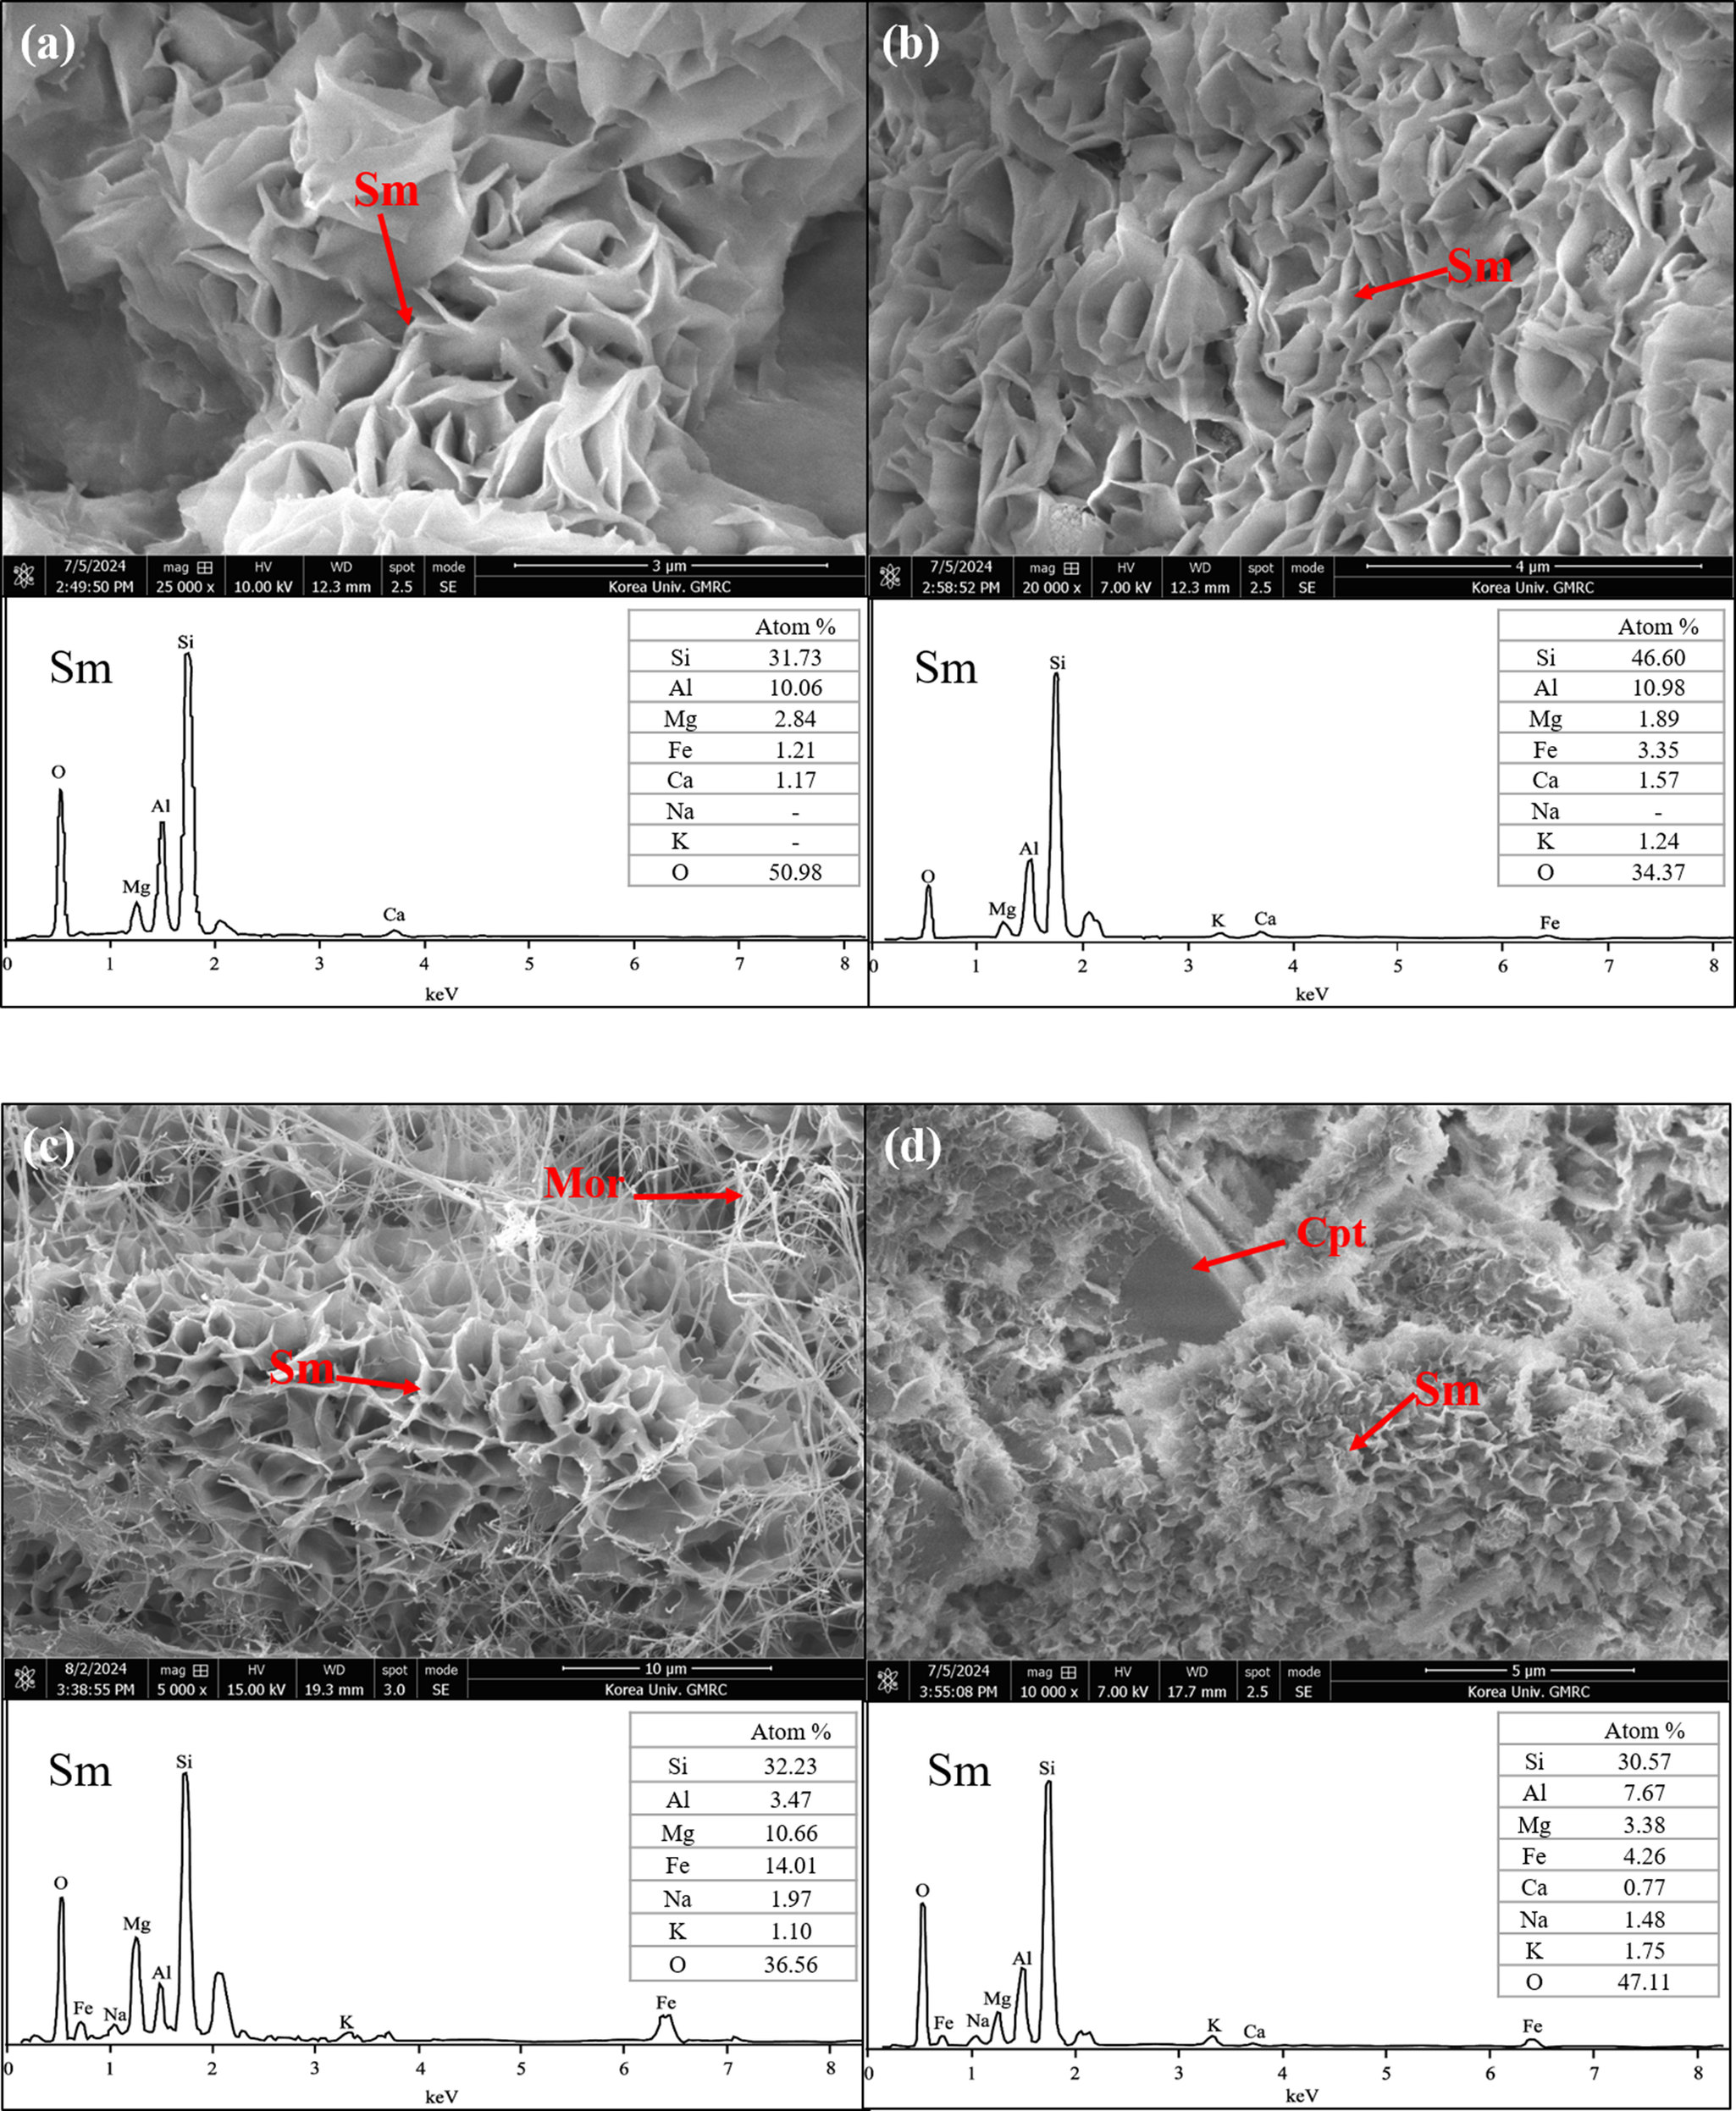
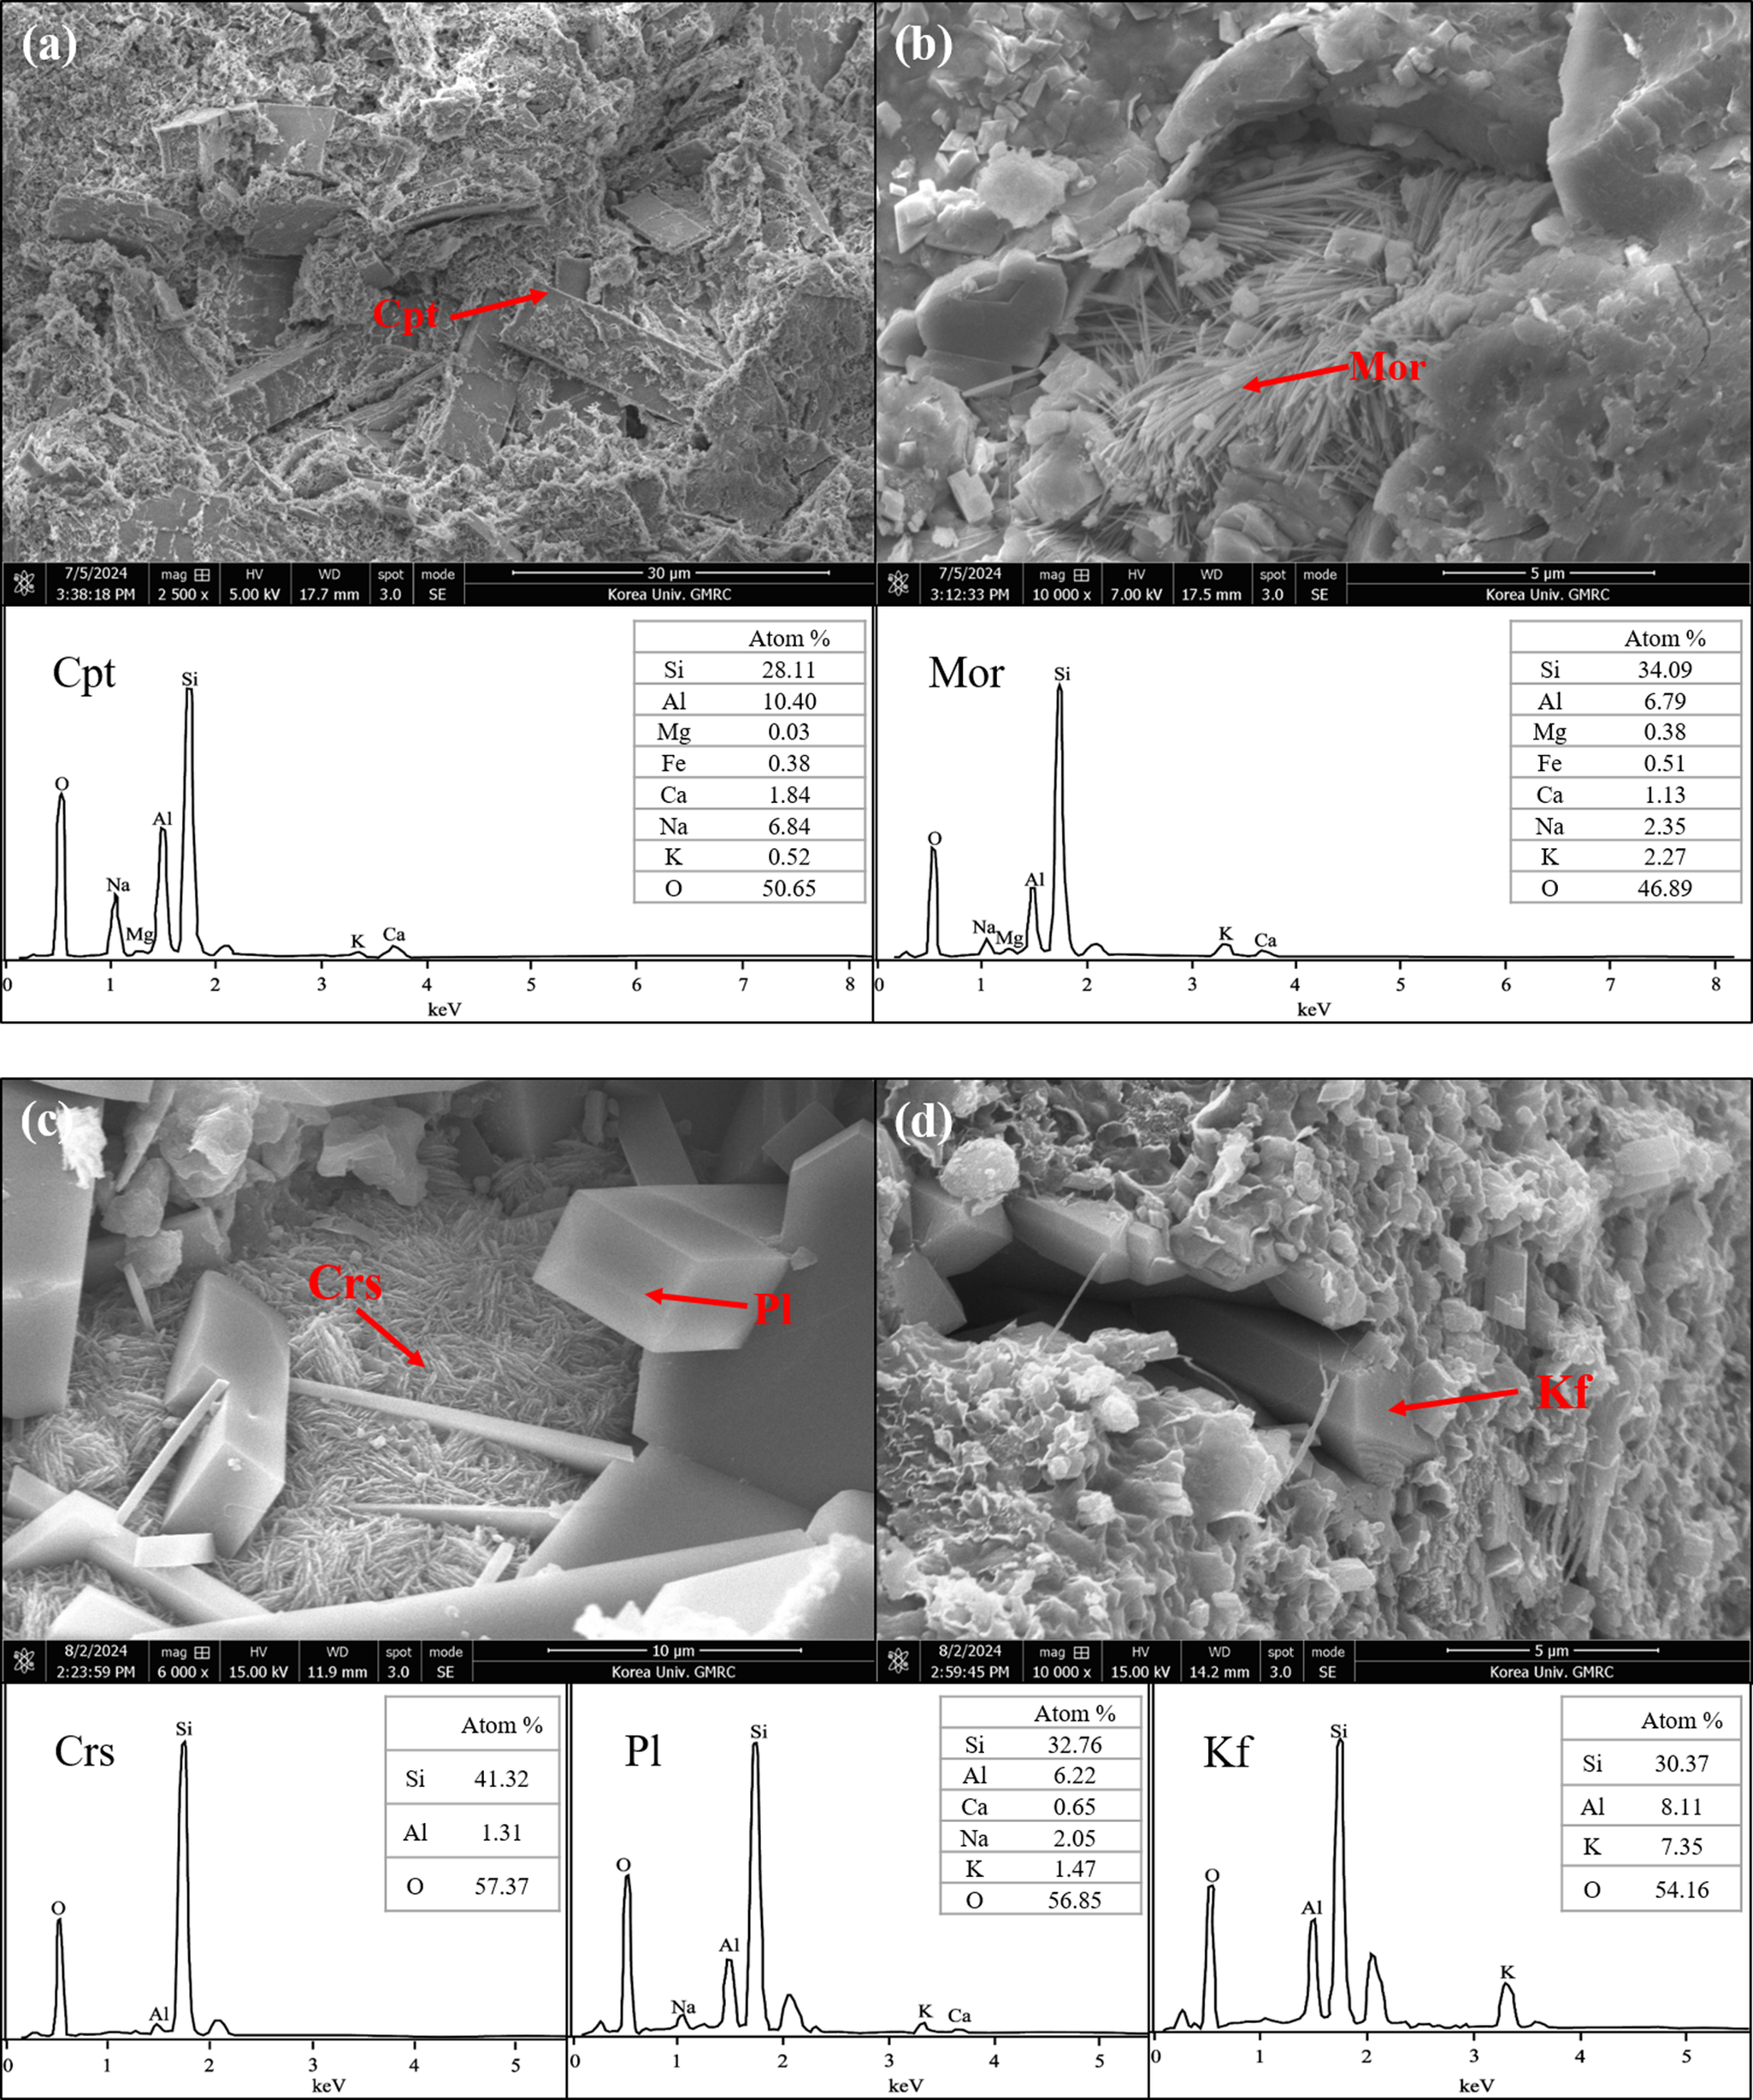
Smectite observed in the outcrop samples (PS) exhibited a honeycomb structure. The SEM analysis confirmed this morphology (Pelayo et al., Reference Pelayo, García-Romero, Labajo and del Villar2016), consistent with the characteristic irregularly curled lamellar morphology. The accompanying energy-dispersive X-ray spectroscopy (EDS) spectrum indicated that the smectite was relatively Al-rich, with Ca as the dominant interlayer cation, consistent with the XRD results (Fig. 5a,b). In contrast, smectite observed in the core samples (DH-2-39.6) also displayed the curled lamellar honeycomb structure, but the EDS spectrum showed Na as the slightly dominant interlayer cation in the core samples. Additionally, some smectite from the core samples was relatively Mg-rich and Fe-rich in relation to Al from the EDS spectrum (Fig. 5c). The XRD analysis results further indicated the co-occurrence of clinoptilolite and smectite, with mordenite exhibiting a thin fibrous structure (Fig. 5c,d). The EDS spectra for clinoptilolite and mordenite showed that Na was the predominant constituent cation, compared with Ca and K (Fig. 6a,b). Furthermore, typical forms of plagioclase, K-feldspar, and cristobalite (opal-CT) were identified (Fig. 6c,d). The SEM-EDS results suggest a distinct difference in chemical composition between the outcrop and core samples, with the core samples showing greater Na dominance.
SEM images and EDS patterns of: (a, b) smectite (Sm) from the outcrop samples (PS); (c) smectite with mordenite (Mor); and (d) smectite with clinoptilolite (Cpt) from the core samples (DH-2).

SEM images and EDS patterns of: (a) clinoptilolite (Cpt), (b) mordenite (Mor), (c) cristobalite (Crs) with plagioclase (Pl), and (d) K-feldspar (Kf) from the core samples (DH-2).

FTIR analysis
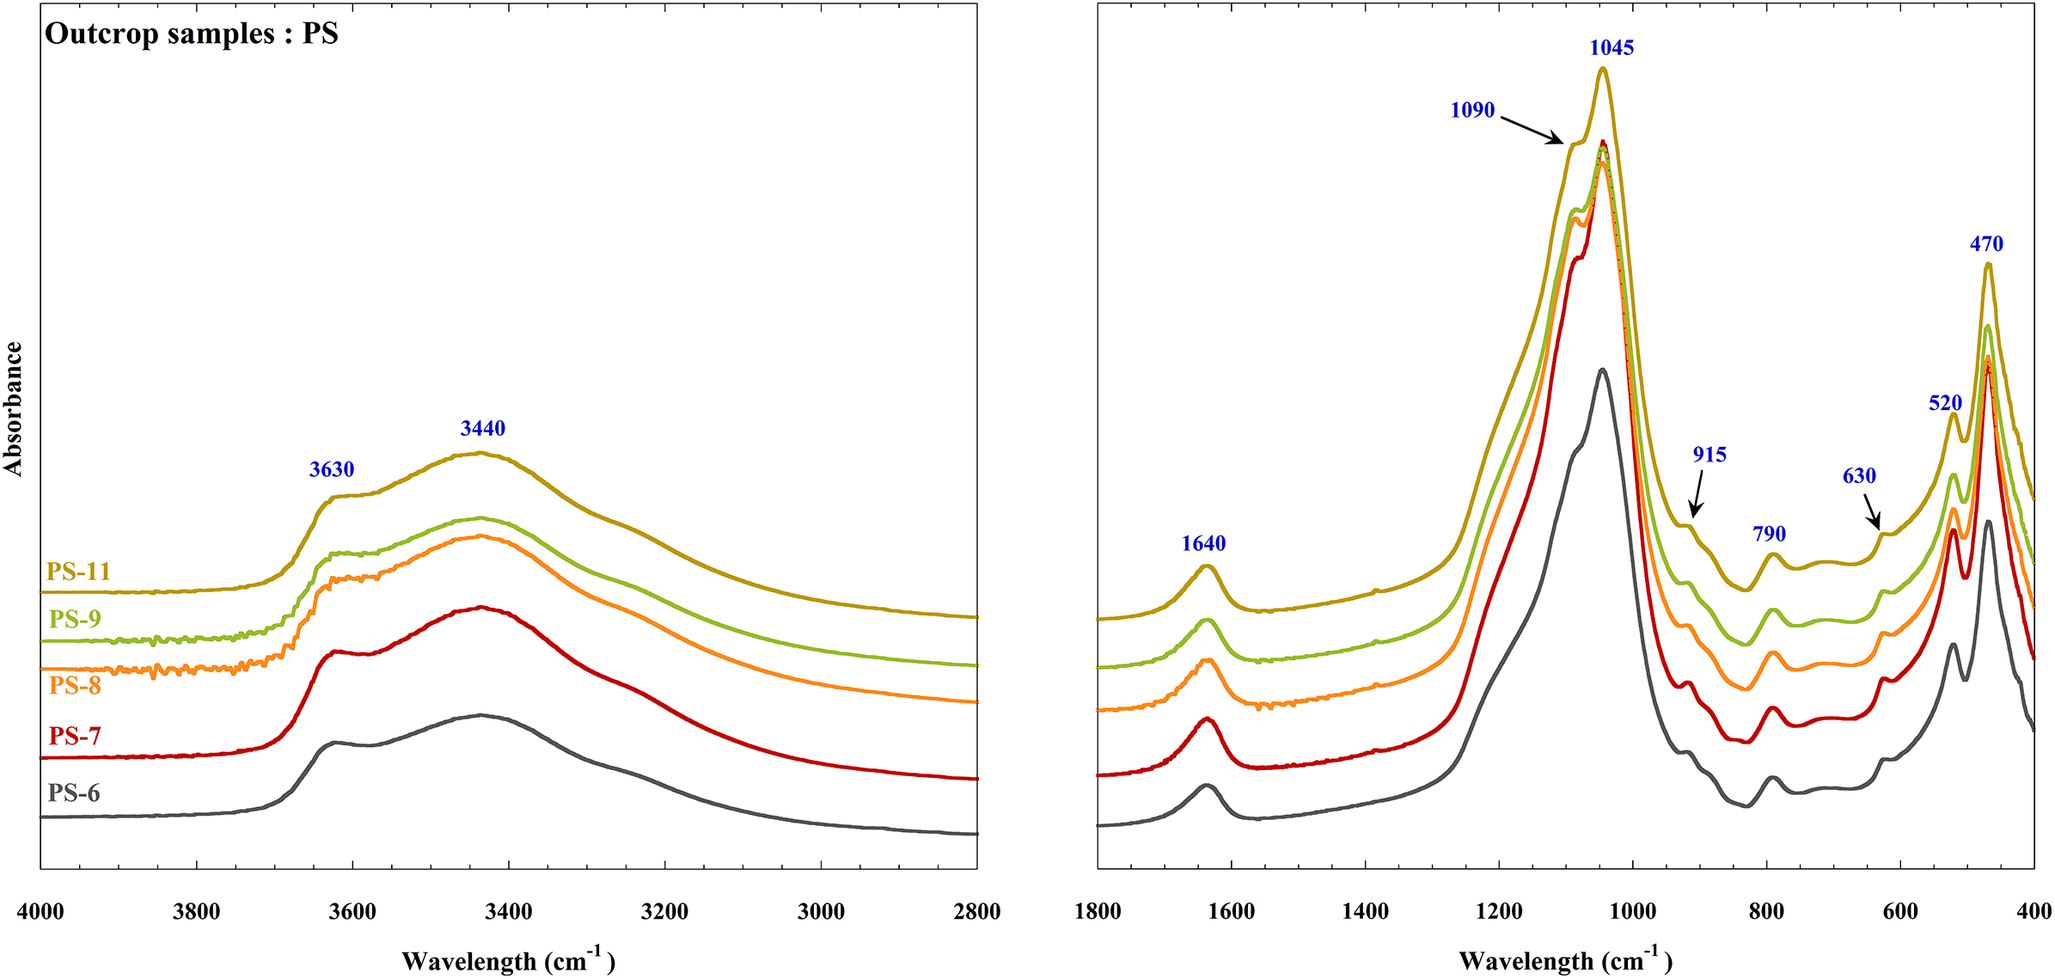
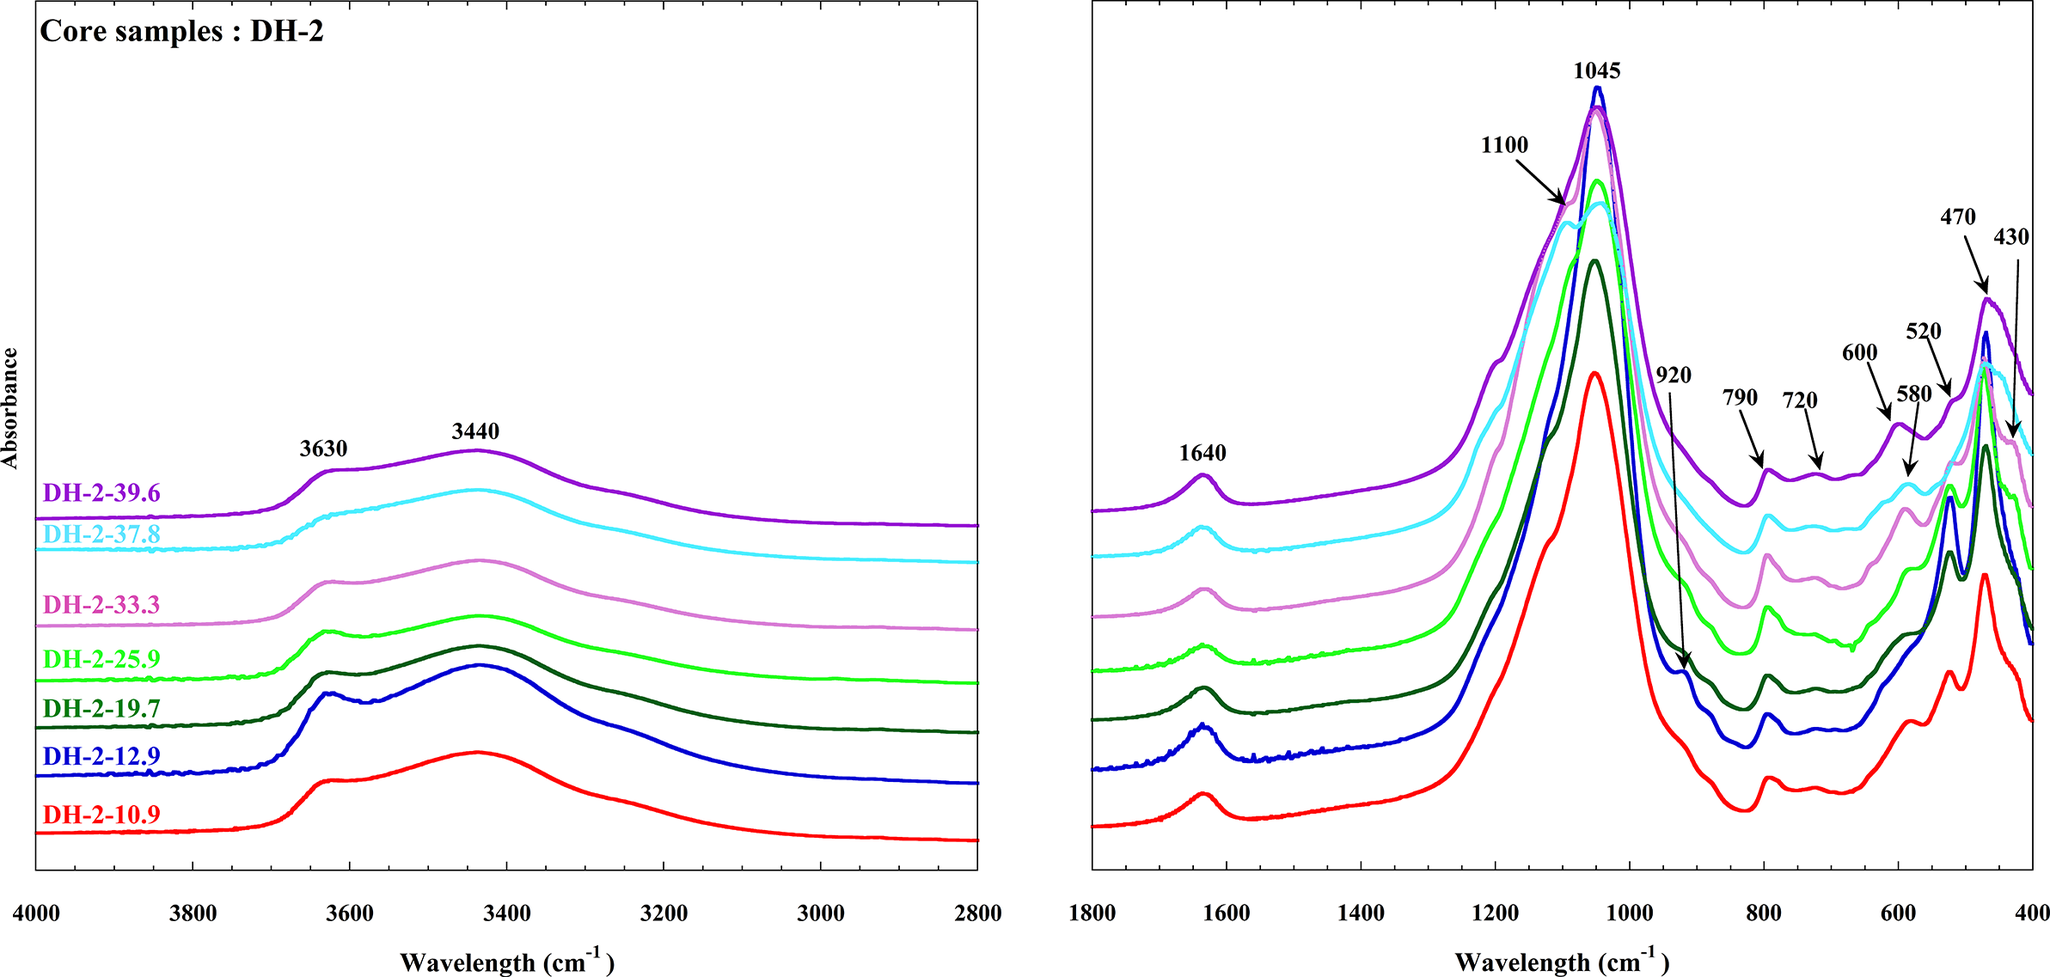
Several shared absorption bands were identified in both the outcrop samples (Fig. 7; PS) and core samples (Fig. 8; DH-2). The band near 3635 cm–1 corresponds to the stretching vibration of structural hydroxyl groups (OH) coordinated to cations (i.e. Al or Mg) in the octahedral sheet (Madejová et al., Reference Madejová, Gates, Petit, Gates, Kloprogge, Madejová and Bergaya2017). Bands at 3435 cm–1 and 1640 cm–1 are attributed to the OH-stretching vibration of water molecules (Gates et al., Reference Gates, Anderson, Raven and Churchman2002; Dziedzicka et al., Reference Dziedzicka, Sulikowski and Ruggiero-Mikołajczyk2016). The band at 1045 cm–1 represents Si–O stretching vibrations, and the 790 cm–1 band indicates Si-O stretching vibrations associated with quartz (Madejová et al., Reference Madejová, Gates, Petit, Gates, Kloprogge, Madejová and Bergaya2017). Bands near 520 cm–1 and 470 cm–1 correspond to Al-O-Si and Si-O-Si bending vibrations within the tetrahedral sheet, respectively (Madejová and Komadel, Reference Madejová and Komadel2001). Additionally, a weak band near 1100 cm–1, observed in both samples, suggests Si–O stretching vibrations associated with cristobalite or quartz.
FTIR spectra of the outcrop samples (PS).

FTIR spectra of the core samples (DH-2).

In the outcrop samples, a unique band near 620 cm–1, attributed to combined Al-O out-of-plane and Si-O vibrations, was observed. A weak band near 915 cm–1 was also present, representing a typical Al-Al-OH bending vibration associated with octahedral sheet-coordinated Al in structural hydroxyl groups (Farmer, Reference Farmer and Farmer1974; Madejová et al., Reference Madejová, Gates, Petit, Gates, Kloprogge, Madejová and Bergaya2017), a characteristic feature of smectite (Fig. 7). In contrast, the core sample showed distinct bands near 430 cm–1 and 600 cm–1 (Fig. 8). The weak band near 430 cm–1 corresponds to O-T-O (T = Al and Si) bending vibrations, indicating a porous structure. The band around 600 cm–1 is associated with asymmetric stretching vibrations between tetrahedral sheets, indicative of double ring vibrations typical of the zeolite framework (Miądlichi et al., Reference Miądlichi, Wroblewaska, Kielbasa, Koren and Michalkiewicz2021).
Thermal properties
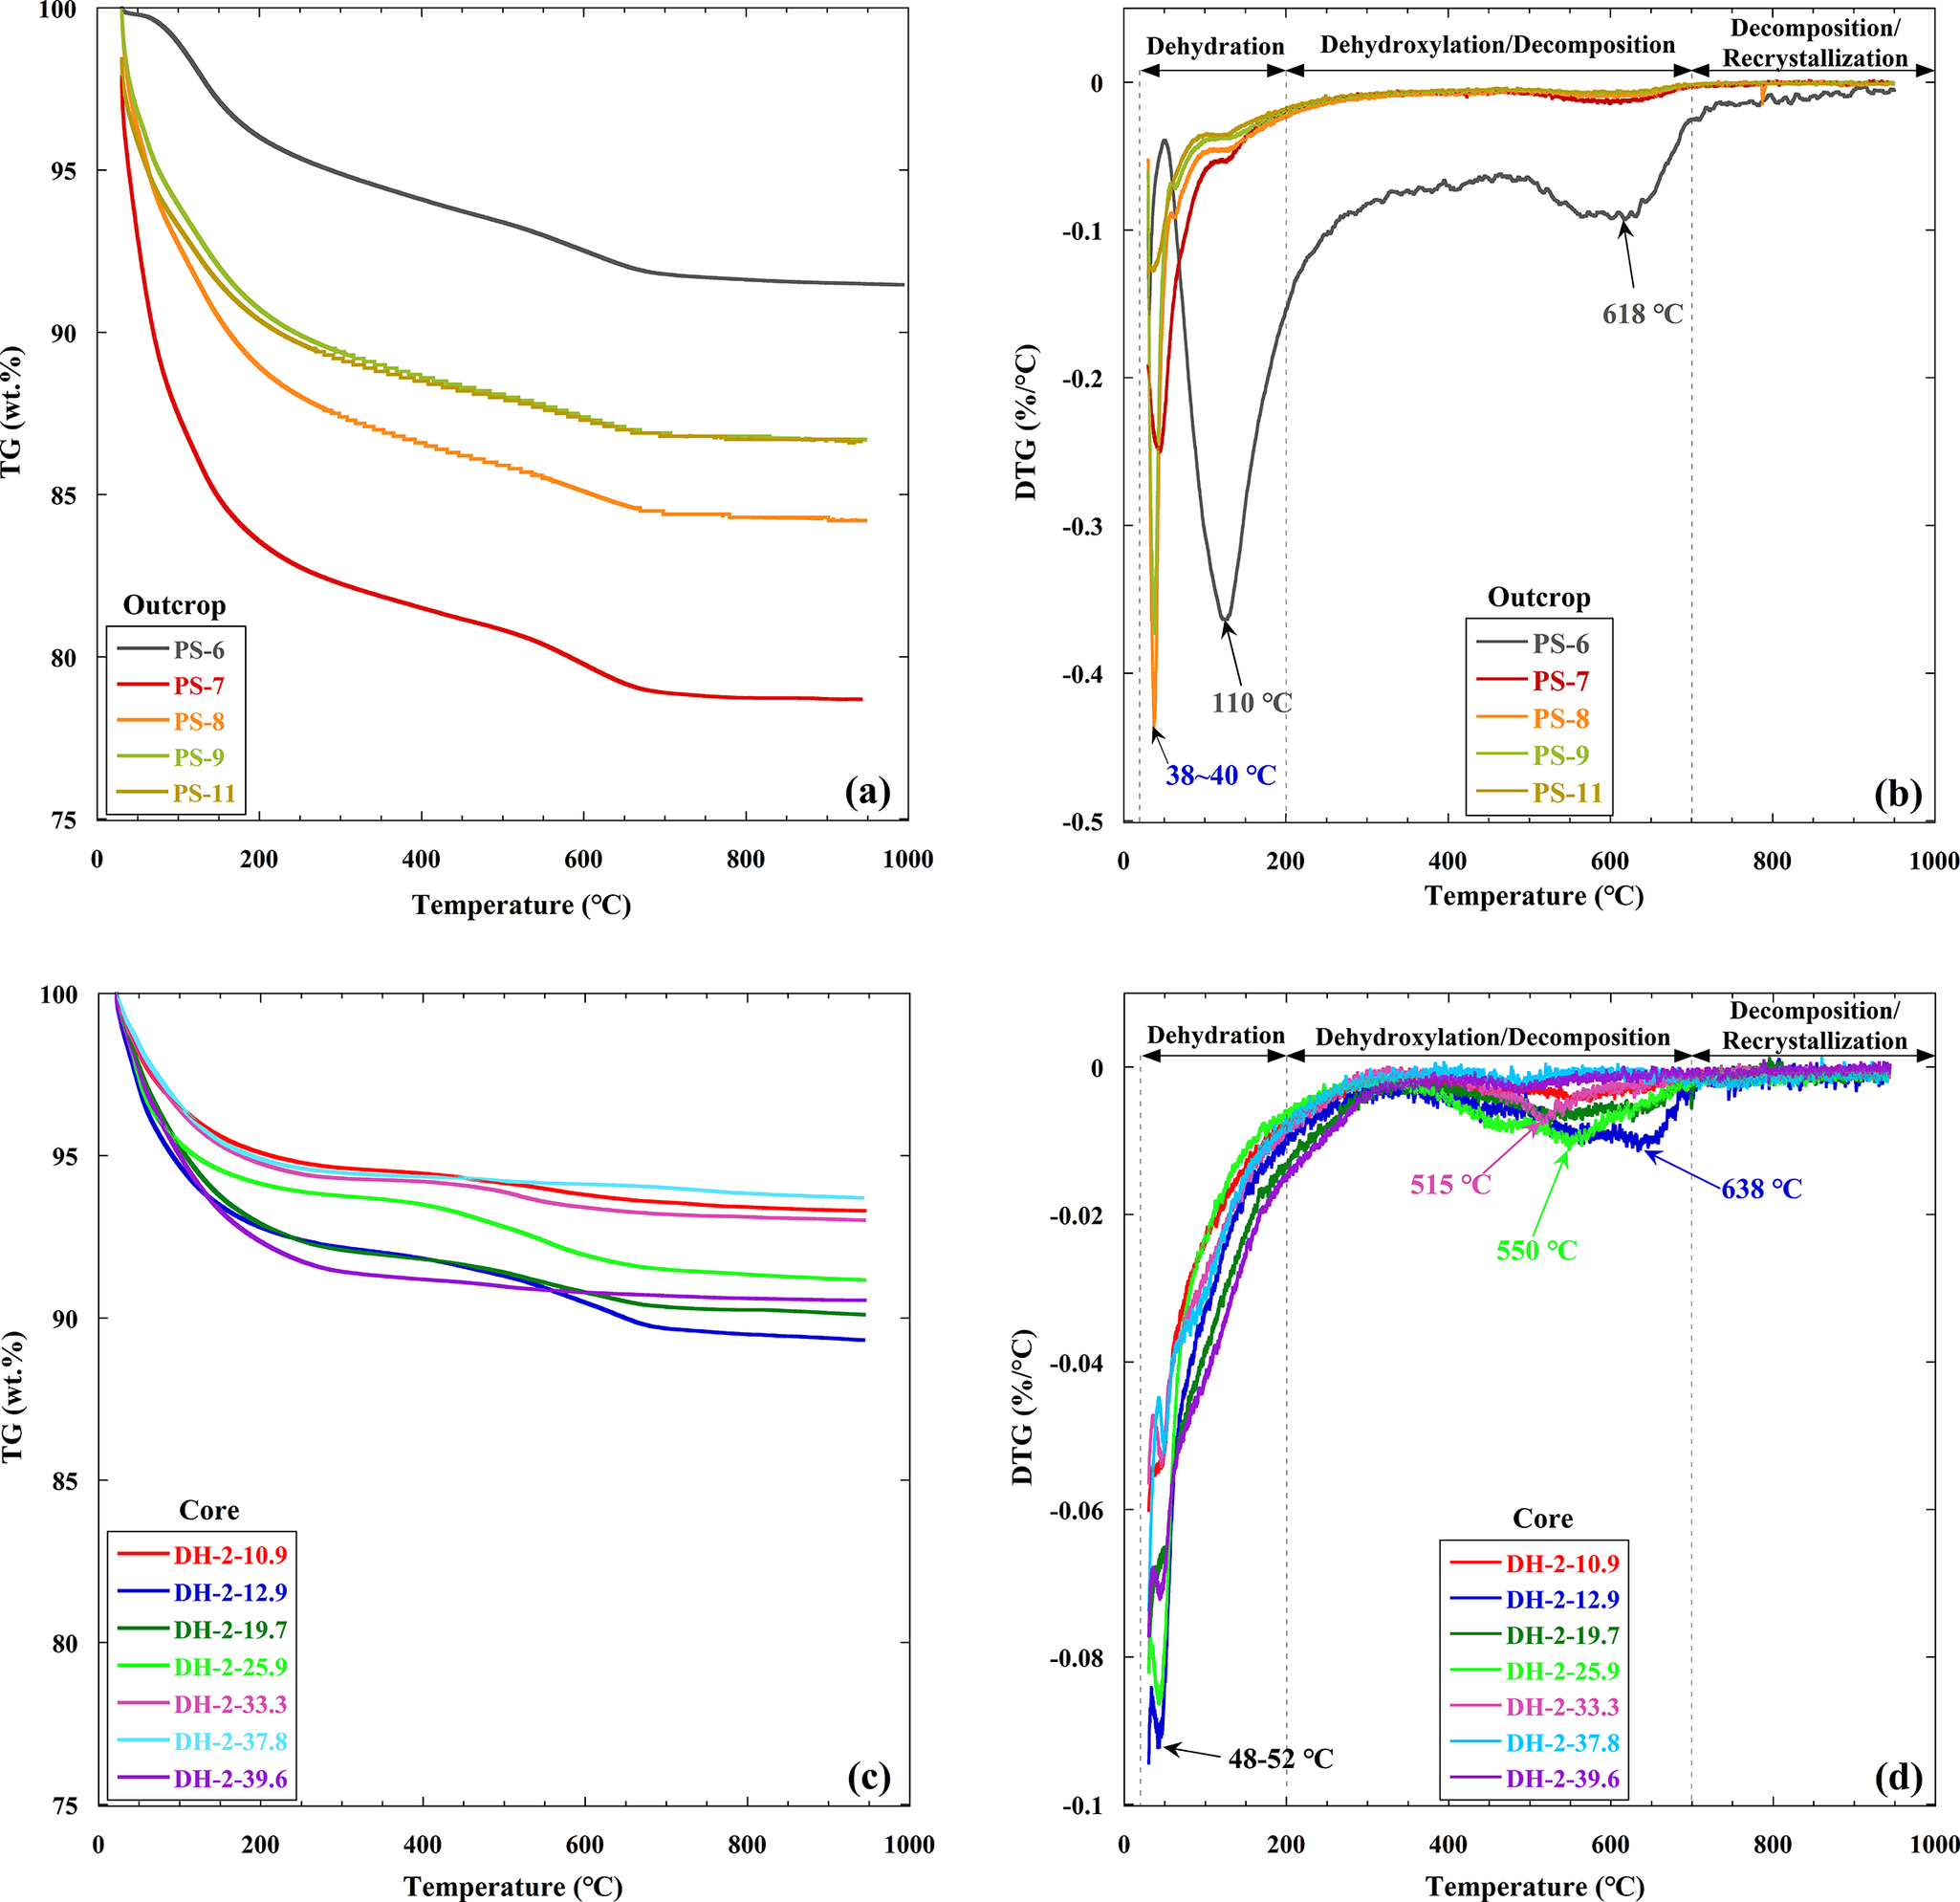
The thermal behavior and interactions between adsorbed water molecules and ions, influenced by mineral characteristics, can be assessed using TG and DTG analyses (Alver et al., Reference Alver, Sakizci and Yörűkoğullari2010). For the outcrop samples (PS), mass losses of 4.0–16.5 wt.% and 3.6–4.6 wt.% were observed in the dehydration region (30–200°C) and dehydroxylation/decomposition region (200–700°C), respectively (Fig. 9a). These losses correspond to the removal of weakly adsorbed water molecules from the surface and pores, as well as interlayer water molecules, followed by loss of chemically bound structural water molecules undergoing dehydration and dehydroxylation as temperature increases. The DTG curve for the outcrop samples shows that two dehydration peaks appeared at ~38°C to 40°C and 110°C (Fig. 9b), indicating a two-step water-loss process. This behavior results from the release of smectite-bound water molecules that remain stable above 100°C, generating two distinct dehydration peaks (Kuligiewicz and Derkowski, Reference Kuligiewicz and Derkowski2017). The dehydroxylation temperature depends on the type of octahedral cation, bond strength, and the nature of octahedral sheet (cis-vacant or trans-vacant). In general, the order of increasing dehydroxylation temperature with respect to bond strength is Fe-OH < Al-OH < Mg-OH. This implies that greater substitution of octahedral Al by Fe results in lower dehydroxylation temperatures. cis-Vacant smectite exhibits the highest dehydroxylation peak at ~650–700°C, whereas trans-vacant smectite shows the maximum at ~500–550°C (Drits et al., Reference Drits, Lindgreen, Salyn, Ylagan and McCarty1998; Emmerich et al., Reference Emmerich, Plötze and Kahr2001; Wolters et al., Reference Wolters, Lagaly, Nueesch and Emmerich2009). In the outcrop samples, a distinct dehydroxylation peak was observed at ~618°C, indicating partial substitution of octahedral Al by Fe and classification as cis-vacant smectite.
Thermogravimetric (TG) and derivative thermogravimetry (DTG) results of (a, b) outcrop samples (PS) and (c, d) core samples (DH-2).

In contrast, the core samples (DH-2) exhibited distinct thermal characteristics. Mass losses in the dehydration region (30–200°C) ranged from ~4.8 to 7.6 wt.%, with overall mass loss in the dehydroxylation/decomposition region exhibiting negligibly small values (Fig. 9c). These trends reflect a gradual dehydration process extending up to ~600°C, characteristic of clinoptilolite (Satokawa and Itabashi, Reference Satokawa and Itabashi1997; Alver et al., Reference Alver, Sakizci and Yörűkoğullari2010), consistent with XRD-identified mineral composition. Additionally, a single dehydration peak was observed (Fig. 9d). Unlike smectite, zeolites such as clinoptilolite are not layered but have a ring-chain (channel) structure. Water molecules bound to exchangeable cations within the channels formed by the ring-chain structure contribute to the observed mass loss. Moreover, when the exchangeable cation is divalent, the water mass loss is greater than when the cation is monovalent (Merkle and Slaughter, Reference Merkle and Slaughter1968; Boles, Reference Boles1972; Armbruster and Gunter, Reference Armbruster and Gunter1991; Castaldi et al., Reference Castaldi, Santona, Cozza, Giuliano, Abbruzzese, Nastro and Melis2005). This explains depth-related variations in mass loss within the core samples. The samples DH-2-12.9, DH-2-19.7, and DH-2-39.6 showed greater mass losses, suggesting the presence of a mixture of monovalent cations and a greater proportion of divalent cations within the channels.
Nuclear magnetic resonance (NMR) spectroscopy analysis
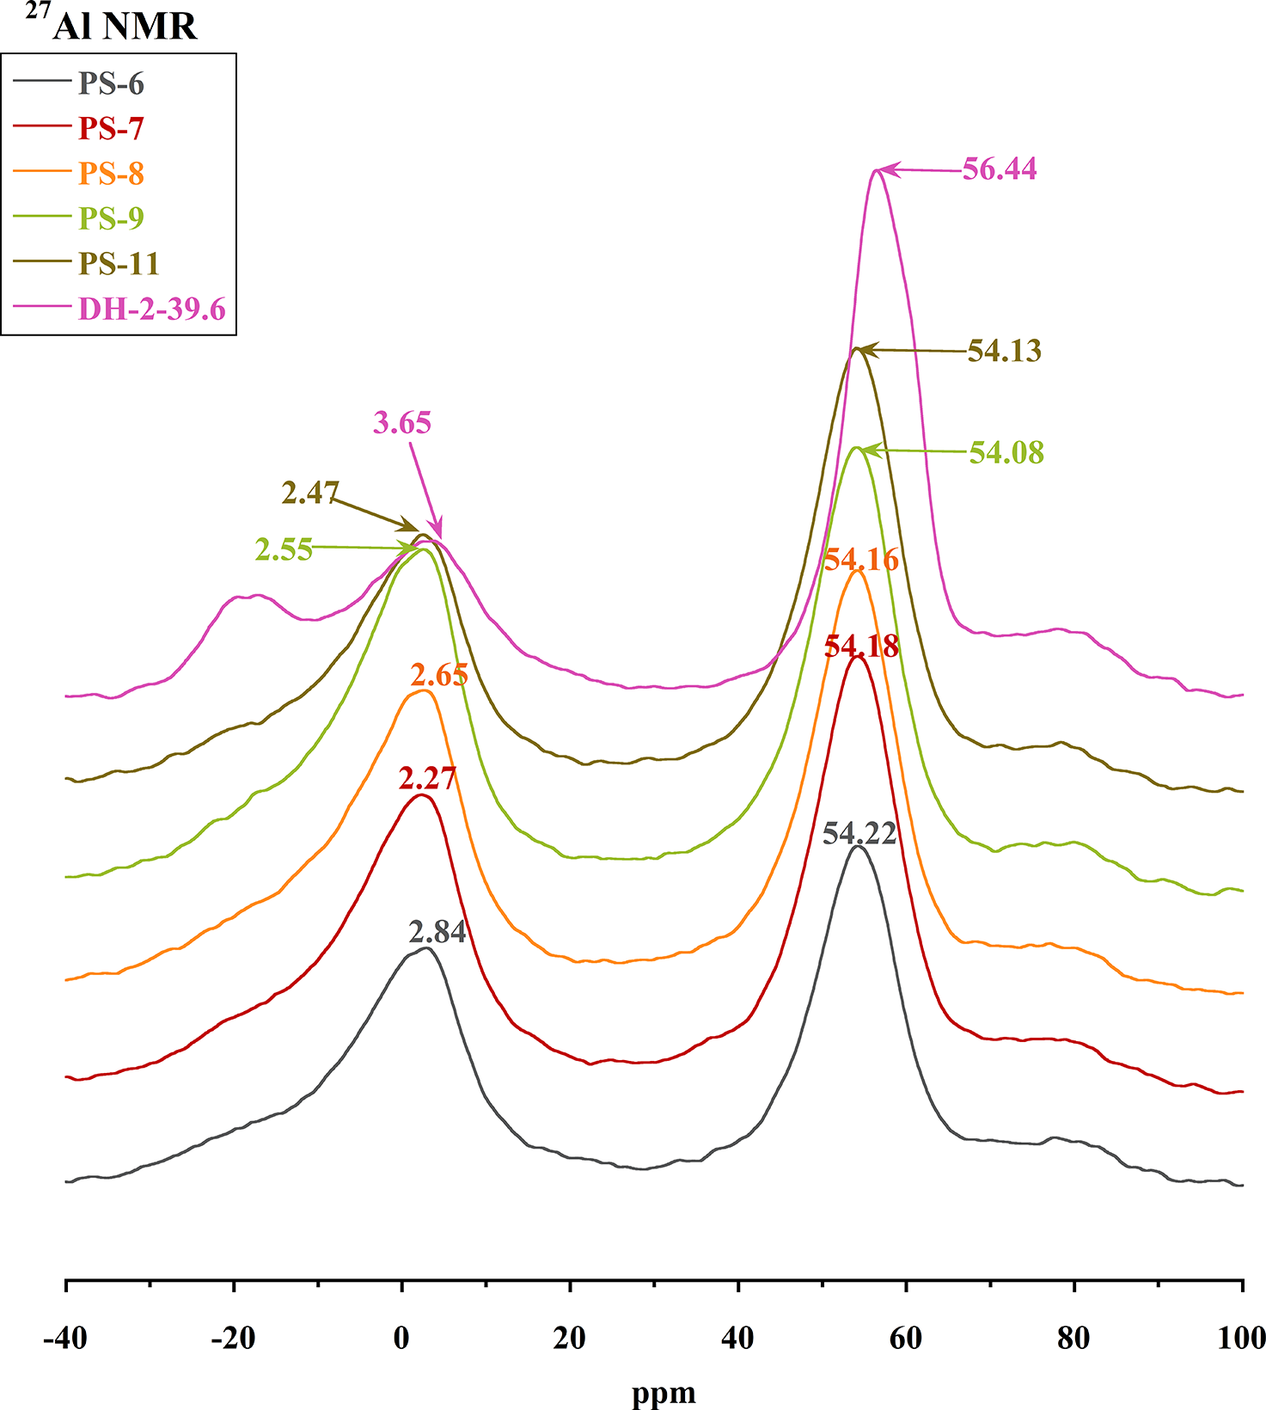
The 27Al MAS NMR spectra exhibit peaks at 2.27–2.84 ppm and 54.08–54.22 ppm for the outcrop samples (PS series), and at 3.65 ppm and 56.44 ppm for the core sample (DH-2-39.6) (Fig. 10). Peaks near 2–3 ppm correspond to octahedrally coordinated Al (AlVI), whereas those near 54–56 ppm correspond to tetrahedrally coordinated Al (AlIV). The PS samples show a dominant tetrahedral Al peak while retaining a measurable octahedral Al component, a distribution consistent with dioctahedral smectite (Ejeckam and Sherriff, Reference Ejeckam and Sherriff2005). In contrast, the DH-2-39.6 sample shows a pronounced tetrahedral Al peak and a significantly small octahedral Al peak, which may be attributed to the presence of zeolite phases characterized by frameworks composed of ring-like tetrahedral units.
Solid-state 27Al MAS NMR spectra of the outcrop samples (PS) and the core sample (DH-2-39.6).

Geochemical properties
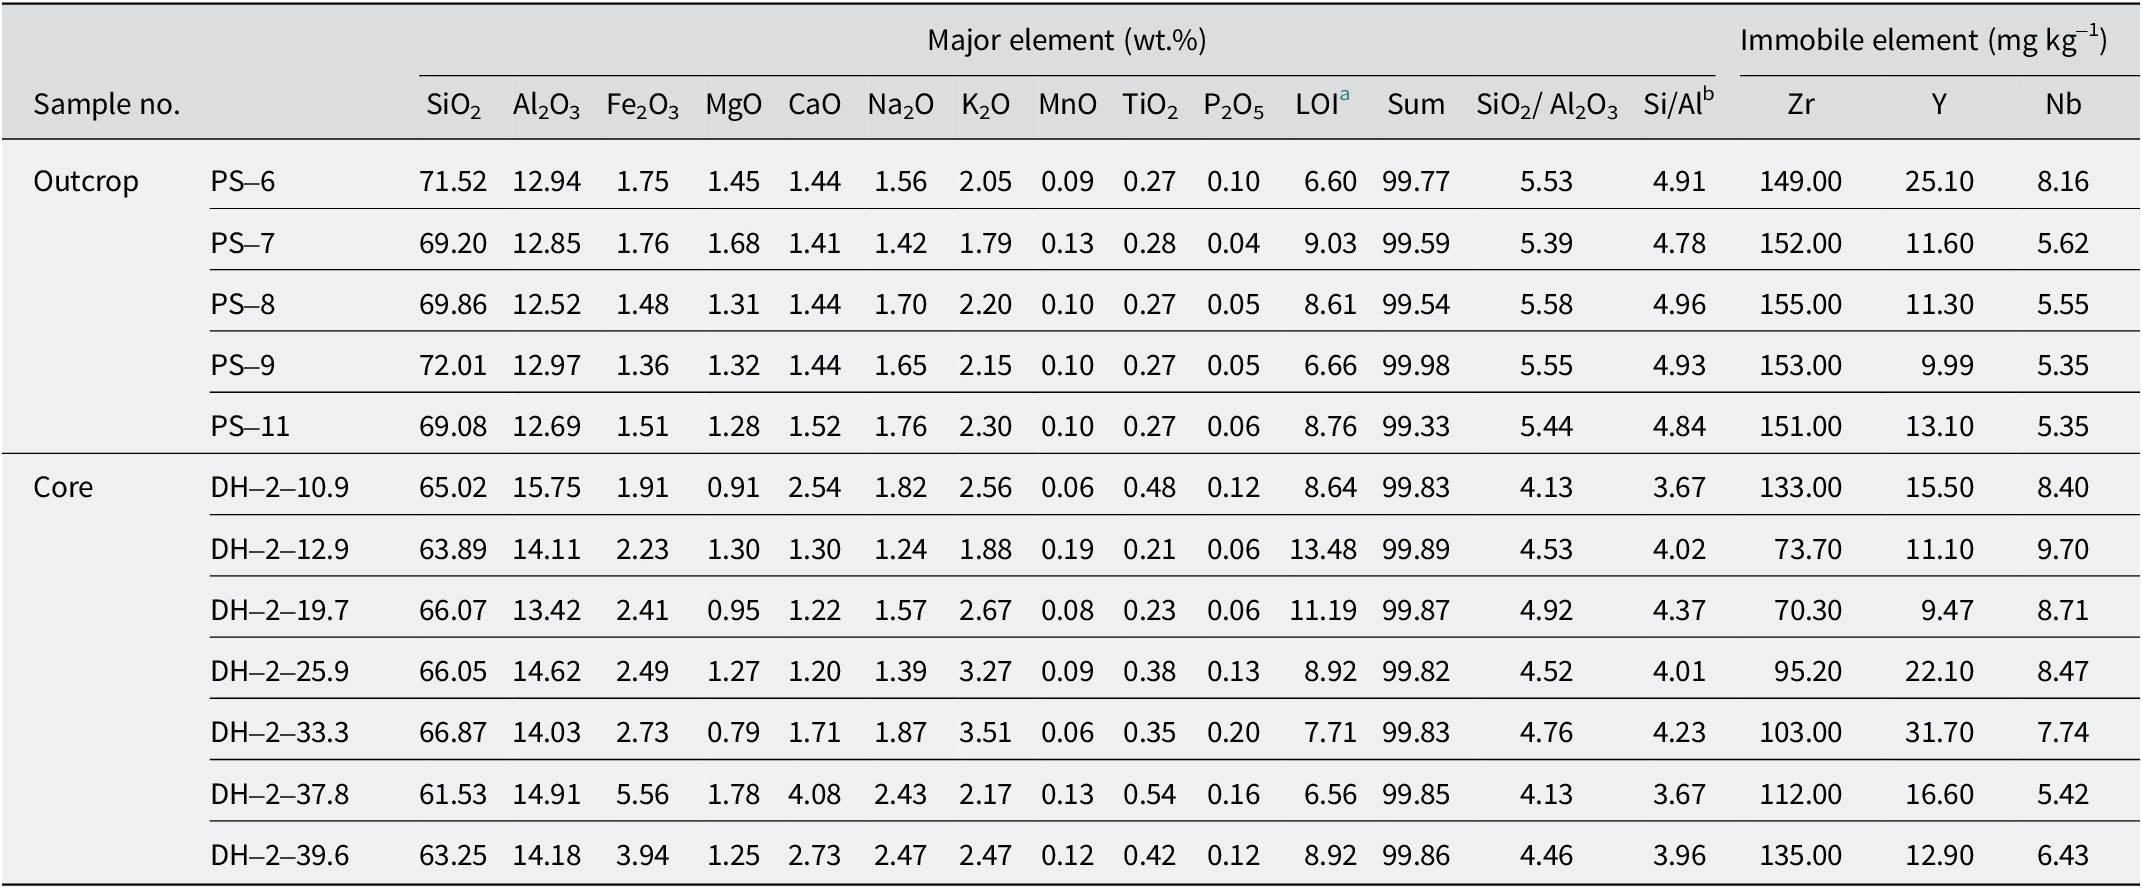
The LOI values were moderately high for both the outcrop samples (PS: 6.60–9.03 wt.%) and the core samples (DH-2: 6.56–13.48 wt.%), reflecting the presence of clay minerals (Hong et al., Reference Hong, Fang, Zhao, Schoepfer, Wang, Gong, Li and Chen2017). The outcrop samples contained more SiO2 (69.08–72.01 wt.%) than the core sample, whereas the Al2O3 content was smaller (12.69–12.97 wt.% in the outcrop sample versus 13.42–15.75 wt.% in the core samples) (Table 1). A high SiO2/Al2O3 ratio and alkali content typically favor the formation of opal-CT and zeolites (Christidis and Huff, Reference Christidis and Huff2009). However, the outcrop samples, which showed no zeolites, had larger SiO2/Al2O3 (5.39–5.58) ratios than the core samples (4.13–4.92) (Table 1). These results suggest that the differences in mineral composition were probably influenced by depositional environments, including chemical weathering, diagenesis, and water–rock interactions following the deposition of volcanic ash and glass (Hong et al., Reference Hong, Algeo, Fang, Zhao, Ji, Yin, Wang and Cheng2019). The larger cations contents (CaO, Na2O, and K2O) in the core samples are consistent with the presence of plagioclase, K-feldspar, and zeolites.
Major and immobile element compositions of the outcrop and core samples

a LOI = loss on ignition; bSi/Al ratio: molar ratio of Si to Al based on the bulk rocks.
To investigate the precursor characteristics of the outcrop and core samples, the total alkali versus silica (TAS) ratio of Na2O+K2O/SiO2 was used for classification (Le Maitre, Reference Le Maitre1984). Variations in key components, such as alkali and SiO2, can influence the enrichment of other chemical elements. To minimize the influence of alteration, the immobile element ratios Zr/TiO2 versus Nb/Y, as proposed by Winchester and Floyd (Reference Winchester and Floyd1977), were applied (Table 1). On the TAS diagram, the outcrop and core samples plotted near rhyolite-dacite and andesite-dacite fields, respectively (see Fig. S2 in the Supplementary material). In the Zr/TiO2 versus Nb/Y diagram, the outcrop samples remained in the rhyolite/dacite field, whereas the core samples spread across the andesite and trachyandesite fields (Fig. S3, Supplementary material). The DH-2-37.8 sample, which had the largest Fe2O3 content, was consistently classified as andesite in both diagrams. Other samples with relatively large Fe2O3 contents were likewise associated with andesitic precursor characteristics, consistent with the presence of clay minerals derived from relatively mafic parent rocks. Despite some classification differences between the TAS and Zr/TiO2 versus Nb/Y diagrams, the overall geochemical trends were consistent. These findings suggest that the outcrop and core samples originated from chemically distinct sources (felsic for the outcrop and slightly more mafic for the core).
The Chemical Index of Alteration (CIA) and Mineralogical Index of Alteration (MIA) are used widely to assess the degree of chemical weathering and mineralogical alteration in rocks by quantifying the intensity of chemical weathering and estimating changes in mineral composition (Nesbitt and Young, Reference Nesbitt and Young1982; Nesbitt and Young, Reference Nesbitt and Young1984; Nesbitt and Young, Reference Nesbitt and Young1989; McLennan, Reference McLennan1993; Voicu and Bardoux, Reference Voicu and Bardoux2002; Hong et al., Reference Hong, Fang, Zhao, Schoepfer, Wang, Gong, Li and Chen2017; Yusoff et al., Reference Yusoff, Ngwenya and Parsons2013). The CIA and MIA values were calculated using Eqns (1) and (2) based on the chemical composition of the outcrop and core samples (Nesbitt and Young, Reference Nesbitt and Young1982; Voicu and Bardoux, Reference Voicu and Bardoux2002). A CIA value between 45 and 55 indicates minimal chemical weathering, while values approaching 100 indicate intense chemical weathering associated with the removal of alkali and alkaline earth elements (McLennan, Reference McLennan1993). For reference, typical CIA values include: 46 for andesite in land arcs, 47 for the upper crust, 50 for feldspar, 61 for sediments, 65–70 for shale, and 80–100 for illite and kaolinite (Nesbitt and Young, Reference Nesbitt and Young1982; Taylor and McLennan, Reference Taylor and McLennan1985; McLennan, Reference McLennan1993). MIA values of 20 indicate the initial stage of alteration, 20–40 for weak, 40–60 for moderate, and 60–100 for strong to extreme alteration (Voicu and Bardoux, Reference Voicu and Bardoux2002):
 $$ \mathrm{CIA}=\left(\;\frac{{\mathrm{Al}}_2{\mathrm{O}}_3}{{\mathrm{Al}}_2{\mathrm{O}}_3+\mathrm{Ca}{\mathrm{O}}^{\ast }+{\mathrm{Na}}_2\mathrm{O}+{\mathrm{K}}_2\mathrm{O}\;}\right)\times 100 $$
 $$ \mathrm{MIA}=2\times \left(\left(\;\frac{{\mathrm{Al}}_2{\mathrm{O}}_3\times 100}{{\mathrm{Al}}_2{\mathrm{O}}_3+\mathrm{CaO}+{\mathrm{Na}}_2\mathrm{O}+{\mathrm{K}}_2\mathrm{O}\;}\right)-50\right) $$
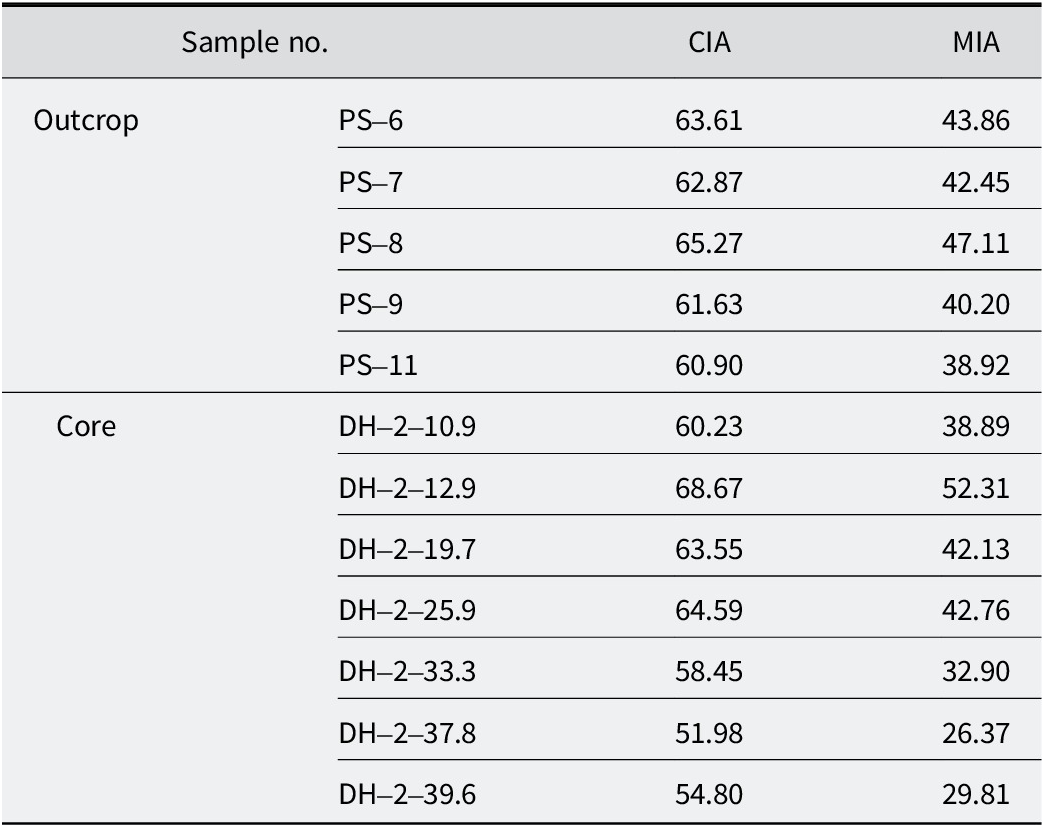
The CIA and MIA values for the outcrop samples ranged from 60.90 to 65.27 and from 38.92 to 47.11, respectively. In the core samples, CIA and MIA values ranged from 51.98 to 68.67 and from 26.37 to 52.31, respectively (Table 2). The CIA values for the outcrop and shallow core samples (~60–65) were similar to those of feldspar and sediment, indicating moderate chemical weathering. However, the deeper core samples (DH-2-33.3, 37.8, and 39.6) had CIA values of <60, suggesting weaker chemical weathering. The MIA values further support this, with moderate alteration (39–47) in the outcrop and shallow core samples, and weak alteration (26–33) in the deeper core samples (Table 2).
Chemical Index of Alteration (CIA) and Mineralogical Index of Alteration (MIA) values for the outcrop and core samples

Amorphous silicate minerals generally require substantial weathering or alteration to transform into crystalline silicates, a process that involves extensive leaching of mobile elements and thereby modifies the chemical composition of the precursor (Hints et al., Reference Hints, Kirsimäe, Somelar, Kallaste and Kiipli2008; Arslan et al., Reference Arslan, Abdioglu and Kadir2010; Obst et al., Reference Obst, Ansorge, Matting and Huneke2015). Conversely, weathering and alteration can also generate amorphous phases; e.g. dissolution of silicate minerals during weathering commonly produces amorphous silica layers (Hellmann et al., Reference Hellmann, Penisson, Hervig, Thomassin and Abrioux2003; Hellmann et al., Reference Hellmann, Wirth, Daval, Barnes, Penisson, Tisserand, Epicier, Florin and Hervig2012; Daval et al., Reference Daval, Hellmann, Saldi, Wirth and Knauss2013). However, secondary minerals such as gibbsite, which is typically formed during intense weathering and alteration processes (e.g. desilication) (Green and Eden, Reference Green and Eden1971; Herrmann et al., Reference Herrmann, Anongrak, Zarei, Schuler and Spohrer2007) are absent from mineral assemblages associated with the amorphous phases in this study. Consequently, the co-existence of primary minerals, including amorphous aluminosilicates, smectite, and feldspars, together with the CIA and MIA results, indicates that the degree of weathering and alteration is relatively weak and insufficient to significantly transform either primary crystalline minerals into amorphous phases or amorphous precursors into crystalline products. Furthermore, REE fractionation patterns allow a more precise evaluation of the precursor composition (Christidis, Reference Christidis1998; Kiipli et al., Reference Kiipli, Hints, Kallaste, Verš and Voolma2017; Hong et al., Reference Hong, Algeo, Fang, Zhao, Ji, Yin, Wang and Cheng2019) and help to constrain the environmental conditions associated with the mineralogical and geochemical alteration of volcanic ash and glass (Bau, Reference Bau1991; MacRae et al., Reference MacRae, Nesbitt and Kronberg1992; Nath et al., Reference Nath, Bau, Rao and Rao1997; Chen et al., Reference Chen, Algeo, Zhao, Chen, Cao, Zhang and Li2015; Liao et al., Reference Liao, Hu, Cao, Wang, Yao, Wu and Wan2016).
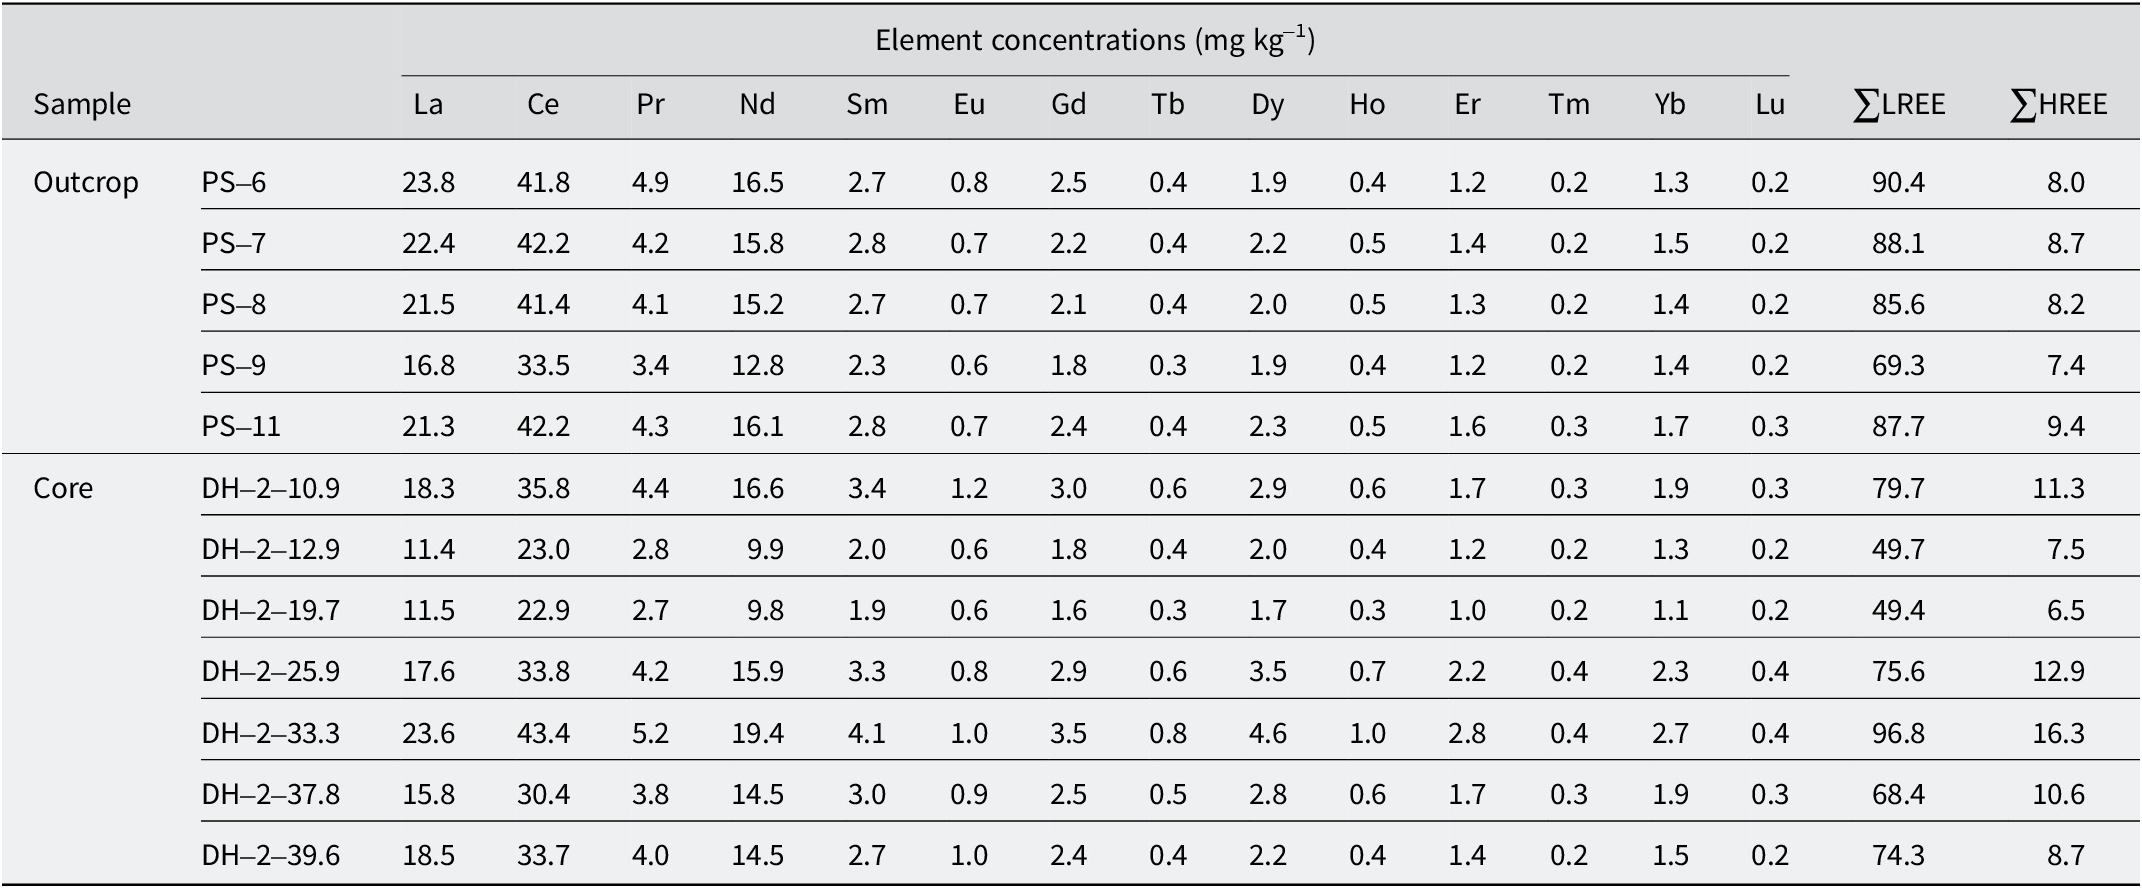
The outcrop samples (PS) had concentrations of total light REE (∑LREE) and heavy REE (∑HREE) ranging from 69.3 to 90.4 and from 7.4 to 7.4 mg kg–1, respectively, resulting in ∑LREE/∑HREE ratios ranging from 9.3 to 11.3. In contrast, the core sample DH-2 had ∑LREE concentrations ranging from 49.4 to 96.8 mg kg–1 and ∑HREE ranging from 6.5 to 16.3 mg kg–1, with ∑LREE/∑HREE ratios ranging from 5.9 to 8.5 (Table 3). Both the outcrop and core samples are enriched in LREE relative to HREE, as indicated by their REE/chondrite-normalized patterns (see Fig. S4 in the Supplementary material). Previous studies have shown that the composition of the parent magma strongly affects LREE concentrations: felsic, silica-rich magma have greater LREE concentrations than intermediate or surface magma (Modabberi et al., Reference Modabberi, Namayandeh, Setti and López-Galindo2019; Namayandeh et al., Reference Namayandeh, Modabberi and Lopez-Galindo2020). This relationship is consistent with the results of the present study. The outcrop samples, which originated from a more felsic (rhyolitic) parent material, contain greater SiO2 contents and correspondingly higher LREE concentrations, whereas the core samples, which originated from more intermediate volcanic sources (trachyandesitic-andesitic) contain less SiO2 and lower LREE concentrations.
Concentrations of rare earth elements (REEs) and trace elements in the outcrop and core samples
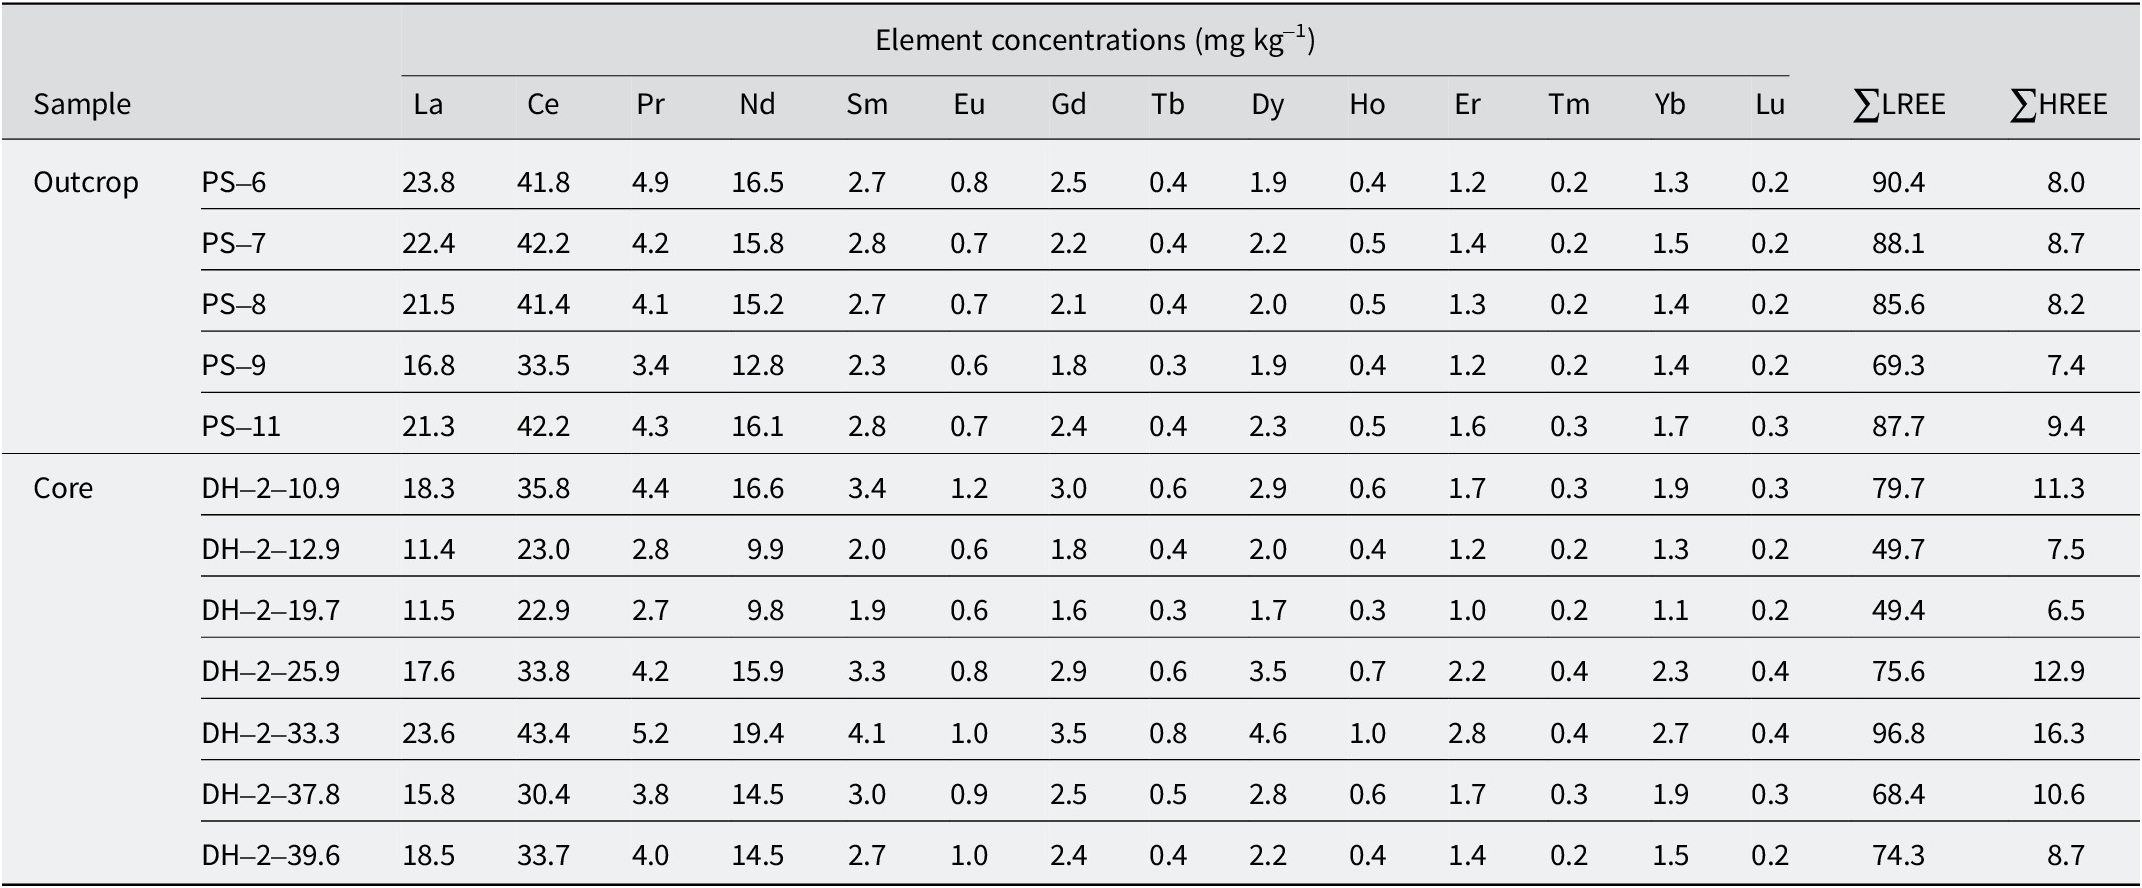
Hydrothermal fluids are typically enriched in LREEs and commonly show a strong positive Eu anomaly when normalized to chondrite (Nakada et al., Reference Nakada, Shibuya, Suzuki and Takahashi2017). Depletion of LREEs (e.g. Ce) in chondrite-normalized patterns can also result from hydrothermal alteration processes (Gao and Wedepohl, Reference Gao and Wedepohl1995). However, Namayandeh et al. (Reference Namayandeh, Modabberi and Lopez-Galindo2020) reported no significant REE depletion or enrichment during the diagenetic alteration of volcanic ash and glass. In the present study, both the outcrop and core samples displayed a consistent REE pattern, without significant LREE depletion or enrichment (Fig. S4, Supplementary material), suggesting that the observed characteristics were primarily influenced by post-depositional diagenetic alteration, rather than hydrothermal processes.
Bacterial community properties
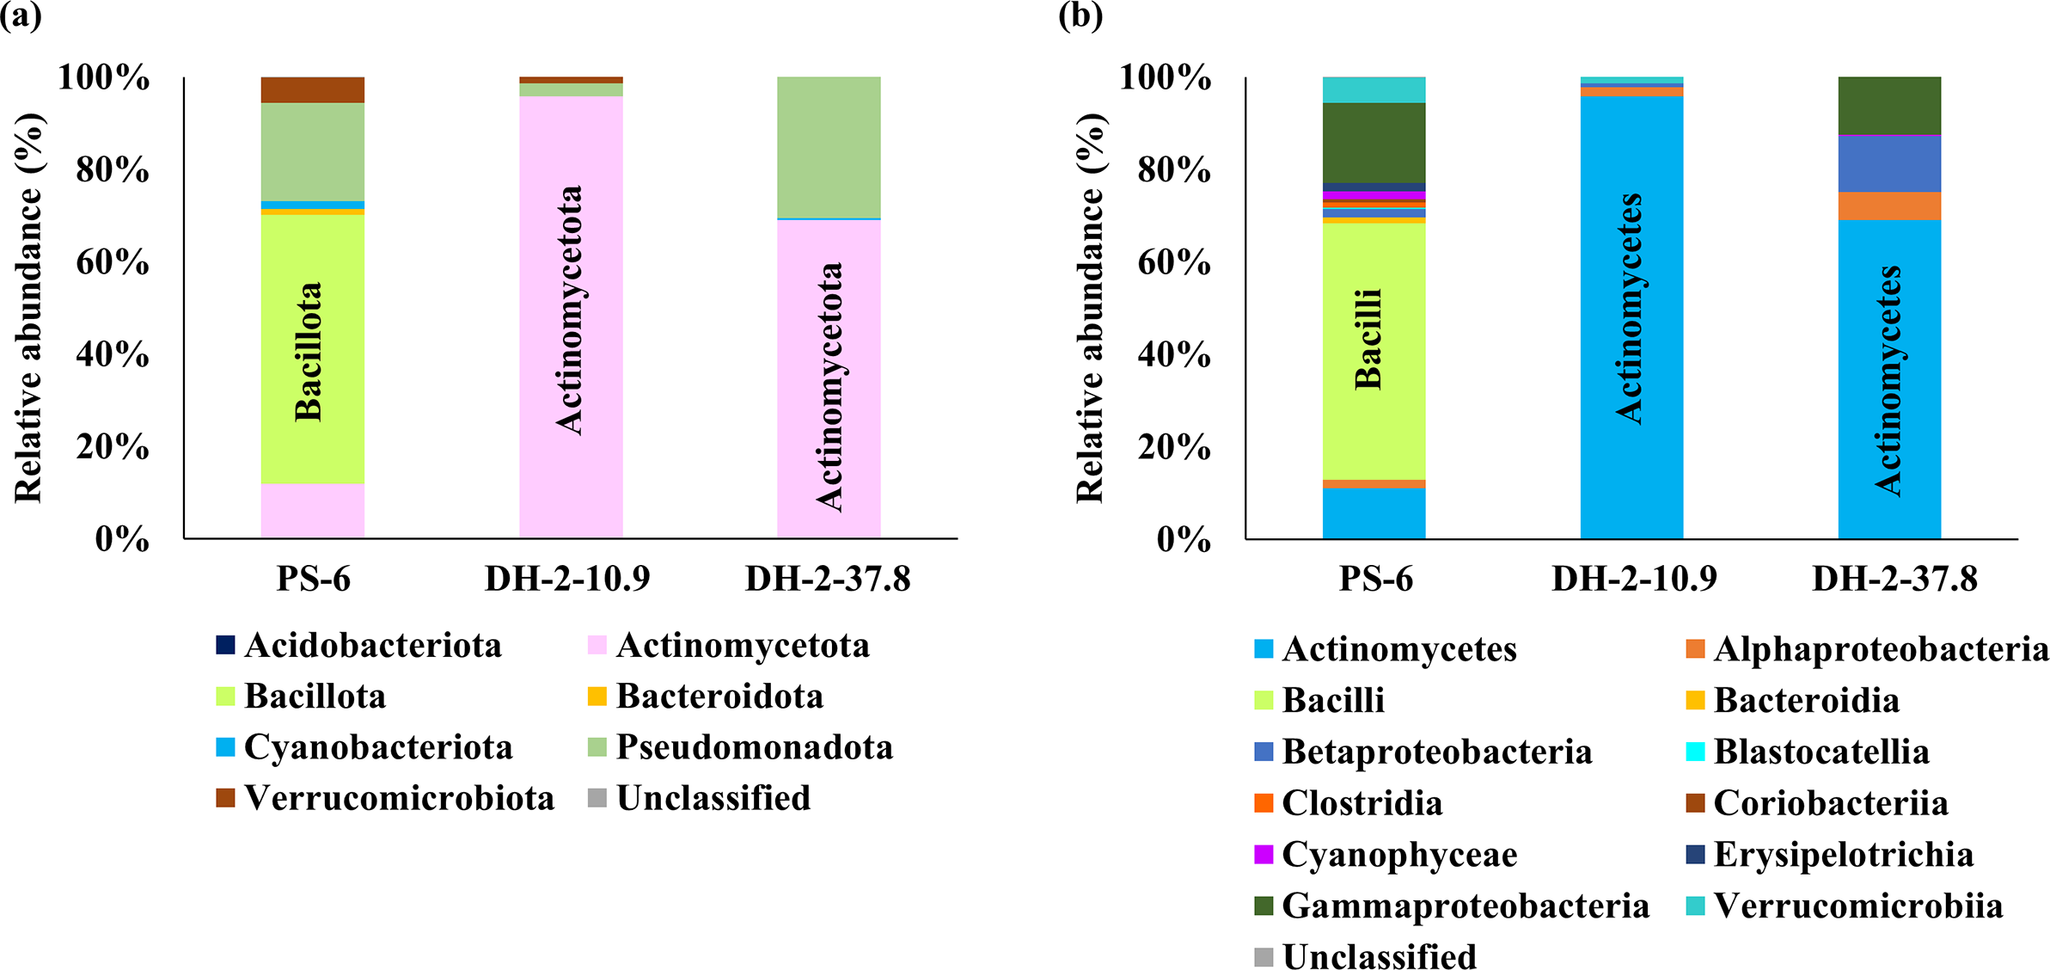
All qualified sequences were classified into seven phyla and 12 classes (Fig. 11). Chao 1 indices for PS-6, DH-2-10.9, and DH-2-37.8 were 82, 28, and 18, respectively, whereas their Shannon indices were 5.173, 2.231, and 2.881, respectively. These results indicate that the outcrop sample (PS-6) hosted a more diverse bacterial community than the core samples. In the outcrop sample (PS-6), Bacillota was the most abundant phylum (58.3%), followed by Pseudomonadota (21.3%), Actinomycetota (11.7%), and Verrucomicrobiota (5.5%) (Fig. 11a). The core sample DH-2-10.9 was dominated by Actinomycetota (95.8%), whereas DH-2-37.8 consisted of both Actinomycetota (69.0%) and Pseudomonadota (30.6%). At the class level, Bacilli (55.4%) was the dominant class in the outcrop sample (PS-6), followed by γ-proteobacteria (17.4%), Actinomycetes (11.0%), and Verrucomicrobiia (5.5%) (Fig. 11b). Actinomycetes comprised 95.8% of DH-2-10.9 and 69.0% of DH-2-37.8. Lower relative abundances of γ-proteobacteria (12.5%), β-proteobacteria (12.1%), and α-proteobacteria (6.1%) were also observed in DH-2-37.8 (Fig. 11b).
Bacterial community structure of the outcrop sample (PS-6) and the core samples (DH-2-10.9, DH-2-37.8) at the (a) phylum and (b) class levels.

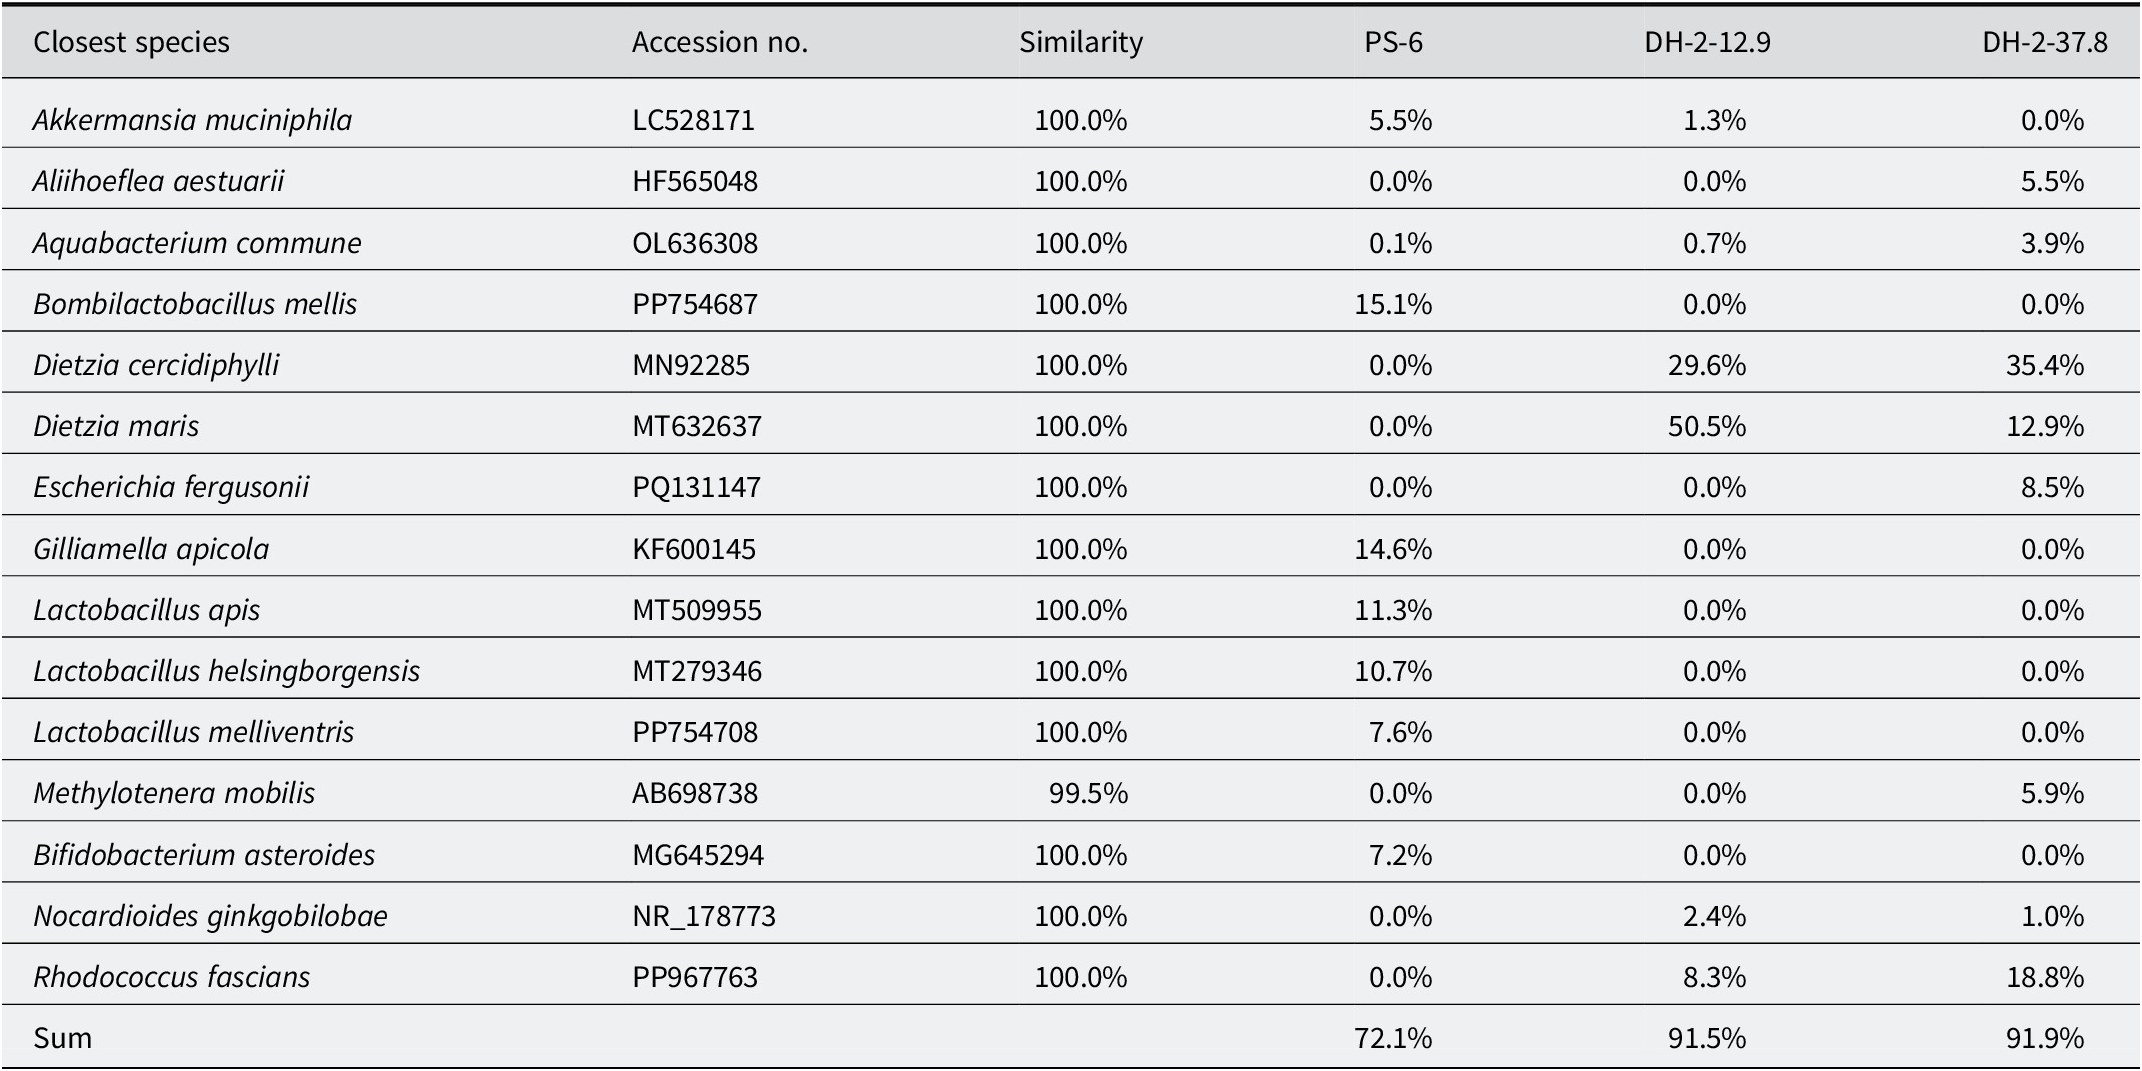
The bacterial community was further analyzed at the species level to identify core bacterial species. The six most abundant species in each sample were defined as core bacterial species in this study. Bacteria capable of growing under high-salinity conditions were predominantly found in DH-2-10.9 (82.5%) and DH-2-37.8 (54.8%). For example, Dietzia maris, isolated from deep sea hydrothermal fields, and Dietzia cercidiphylli, which can tolerate NaCl concentrations up to 10%, were mainly found in the core samples (Table 4; Li et al., Reference Li, Zhao, Zhang, Klenk, Pukall, Qin, Xu and Li2008; Wang et al., Reference Wang, Cai and Shao2014). Other salt-tolerant bacteria, such as Aliihoeflea aestuarii and Nocardioides ginkgobilobae, which can grow at ~8% and ~6% NaCl, respectively, were also detected in the core samples (Table 4; Roh et al., Reference Roh, Kim, Nam, Chang, Kim, Shin, Yoon, Oh and Bae2008; Xu et al., Reference Xu, Zhang, Cheng, Asem, Zhang, Manikprabhu, Zhang, Wu, Li and Zhang2016). In contrast, marine bacteria were not detected in the outcrop sample (PS-6). These findings suggest that the depositional environment in the core samples is related to saline conditions.
Taxonomic classification of bacterial communities identified in the outcrop and core samples
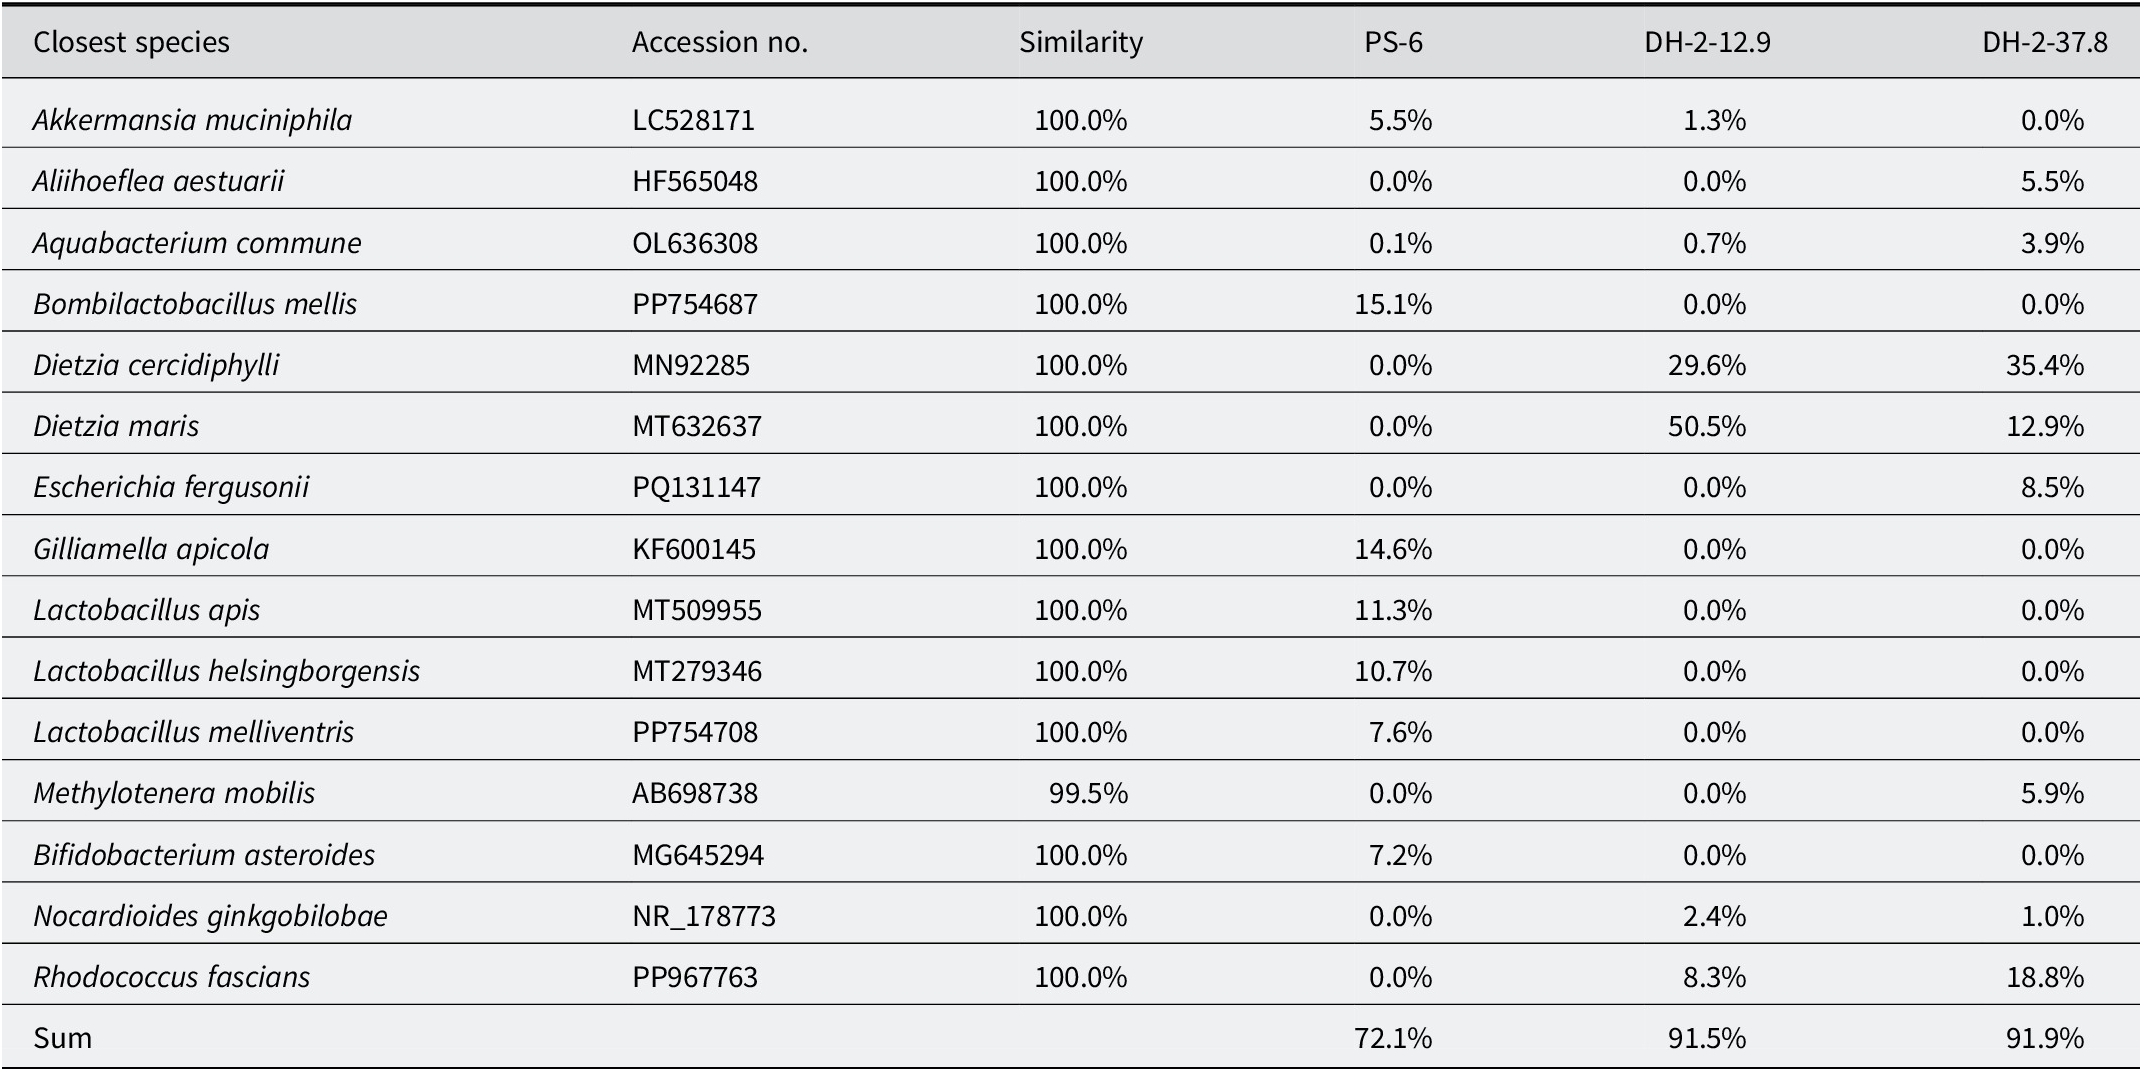
Anaerobic bacteria dominated in the outcrop sample (PS-6), whereas aerobic bacteria were more prevalent in the core samples (DH-2-10.9 and DH-2-37.8) (Table 4). Representative anaerobic bacteria in PS-6, accounting for 72.2% of the bacterial community, included Akkermansia muciniphila, Bombilactobacillus mellis, Gilliamella apicola, Lactobacillus apis, Lactobacillus helsingborgensis, Lactobacillus melliventris, and Bifidobacterium asteroids (Derrien et al., Reference Derrien, Vaughan, Plugge and de Vos2004; Olofsson et al., Reference Olofsson, Alsterfjord, Nilson, Butler and Vásquez2014; Kwong and Moran, Reference Kwong and Moran2013; Killer et al., Reference Killer, Dubná, Sedláček and Švec2014; Pino et al., Reference Pino, Benkaddour, Inturri, Amico, Vaccaro, Russo and Randazzo2022). On the other hand, the core samples included numerous aerobic bacteria, such as Aquabacterium commune, Dietzia cercidiphylli, Dietzia maris, Methylotenera mobilis, and Nocardioides ginkgobilobae, which accounted for 83.3% of the bacterial community in DH-2-10.9 and 59.1% in DH-2-37.8 (Kalmbach et al., Reference Kalmbach, Manz, Wecke and Szewzyk1999; Kalyuzhnaya et al., Reference Kalyuzhnaya, Bowerman, Lara, Lidstrom and Chistoserdova2006; Li et al., Reference Li, Zhao, Zhang, Klenk, Pukall, Qin, Xu and Li2008; Wang et al., Reference Wang, Cai and Shao2014; Xu et al., Reference Xu, Zhang, Cheng, Asem, Zhang, Manikprabhu, Zhang, Wu, Li and Zhang2016). These results suggest that the outcrop sample was exposed to anaerobic conditions, while the core samples were exposed to aerobic conditions.
Mössbauer analysis
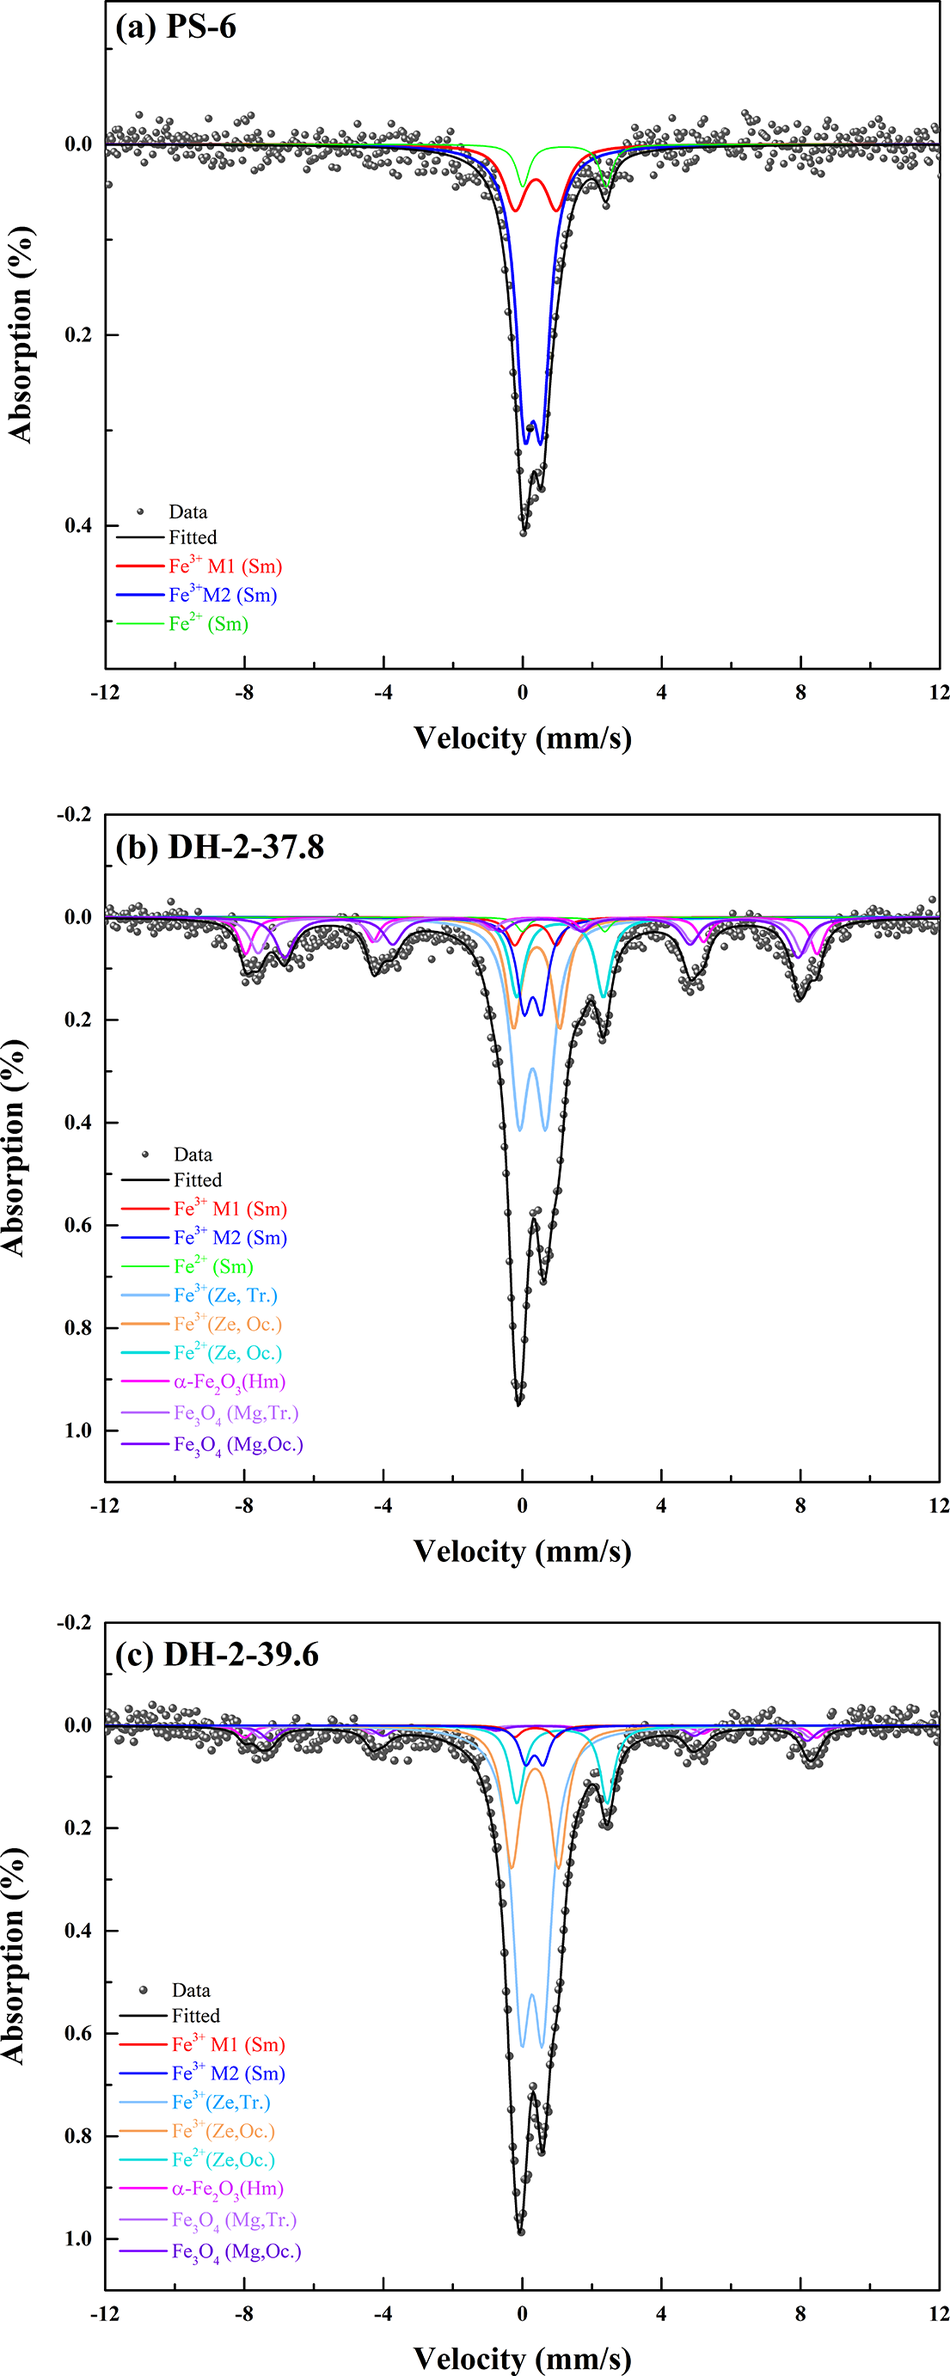
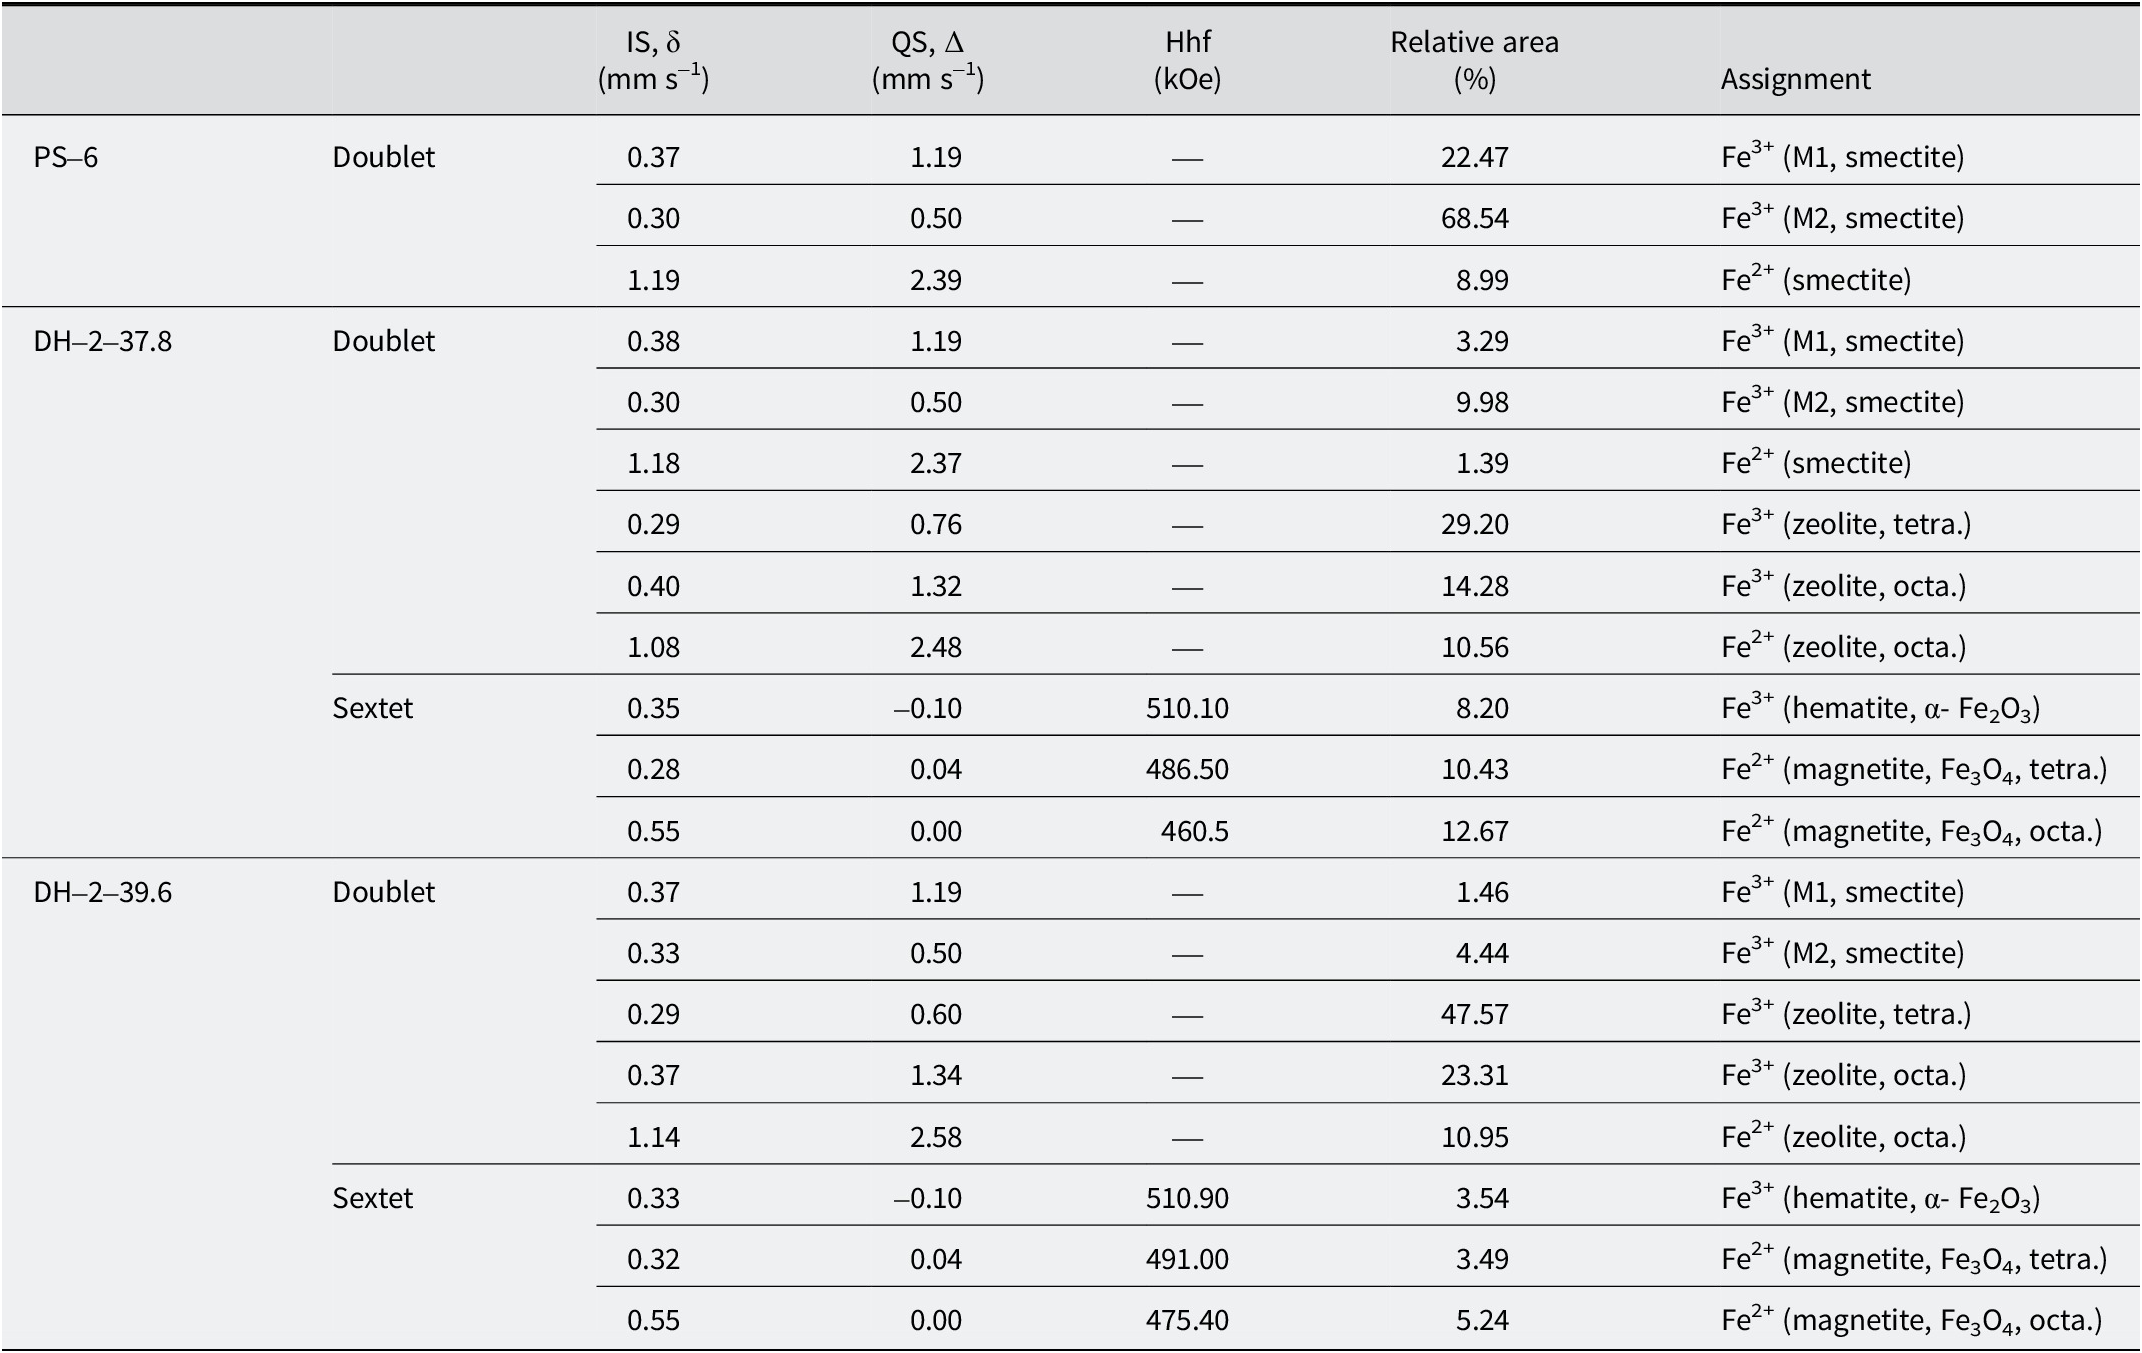
Mössbauer spectroscopy was conducted to characterize the oxidation and coordination states of Fe in the samples. The spectra and corresponding fitting are presented in Fig. 12 and Table 5. The spectrum of outcrop sample (PS-6) contains three doublets (Fig. 12a). The dominant doublet, characterized by a narrow quadrupole splitting (QS = 0.50 mm s–1), indicates that ~69% of the total Fe is present as Fe3+ in the smectite structure (Table 5). This Fe3+ occupies the octahedral M2 (cis-OH) site, which is typical of Fe3+ in dioctahedral smectite (Sheta, Reference Sheta1994). No magnetic sextets are observed in this sample, indicating that Fe3+ remains structurally bound and has not formed discrete iron oxide minerals. The retention of Fe3+ in the smectite lattice suggests a relatively small degree of weathering in the outcrop samples.
Mössbauer spectra of (a) the outcrop sample and (b, c) the core samples. M1 and M2 denote trans- and cis- octahedral sites, respectively, in the smectite structure.

Mössbauer parameters derived from fits to the spectra shown in Fig. 12

The core samples DH-2-37.8 and DH-2-39.6 contain six doublets and three sextets (Fig. 12b,c). The doublets with QS values of 0.76 and 0.60 mm s–1 represent the largest relative areas (Table 5), corresponding to the tetrahedrally co-ordinated Fe3+ within the zeolite framework (Marco et al., Reference Marco, Gracia and Gancedo1995). Additional doublets correspond to octahedrally coordinated Fe3+ in smectite. Fe3+ associated with zeolite and smectite accounts for ~57% of the total spectral area in DH-2-37.8 and 77% in DH-2-39.6.
In contrast to the outcrop sample (PS-6), distinct magnetic sextets occur in both core samples (DH-2-37.8 and DH-2-39.6). The sextets result from hyperfine magnetic splitting, which divides the excited 57Fe nuclear state (I = 3/2) into 2I + 1 sublevels and produces six transitions (Dyar et al., Reference Dyar, Agresti, Schaefer, Grant and Sklute2006). Two sextets correspond to α-Fe₂O₃ (hematite, Hhf ≈ 510 kOe) and Fe3O4 (magnetite, Hhf ≈ 460–491 kOe), with the Fe oxide content slightly less in DH-2-39.6 than in DH-2-37.8. Hematite reflects oxidizing conditions, whereas magnetite indicates partially reducing environments (Dyar et al., Reference Dyar, Agresti, Schaefer, Grant and Sklute2006). The simultaneous presence of both minerals indicates that the oxidation of Fe2+-bearing magnetite to Fe3+-rich hematite is ongoing but incomplete.
The Mössbauer spectroscopy results indicate that both the outcrop and core samples experienced relatively limited weathering: Fe is largely incorporated within smectite and zeolite structures and the partial transformation from magnetite to hematite in the core samples reflects only moderate diagenetic oxidation rather than intense weathering. This interpretation is consistent with trends inferred from the CIA and MIA values.
Differential environmental influences on outcrop and core-sample formation
The alteration of volcanic ash and glass in sedimentary environments is governed by the chemical composition of precursor materials and physicochemical conditions such as pH, salinity, and dissolved silica mobility (Christidis, Reference Christidis1998; Ddani et al., Reference Ddani, Meunier, Zahraoui, Beaufort, El Wartiti, Fontaine, Boukili and El Mahi2005; Kiipli et al., Reference Kiipli, Kiipli, Kallaste, Hints, Somelar and Kirsimae2007; Hints et al., Reference Hints, Kirsimäe, Somelar, Kallaste and Kiipli2008; Arslan et al., Reference Arslan, Abdioglu and Kadir2010; Huff, Reference Huff2016). At the study site, past tectonic activity and bimodal volcanism produced volcanic precursors with distinct chemical compositions, from which the outcrop and core samples may have originated.
Differences in precursor composition and depositional conditions are reflected in contrasting mineral assemblages. Elevated pH enhances the mobility of dissolved silica (H4SiO4), which favors zeolite formation (Dibble and Tiller, Reference Dibble and Tiller1981; Noh and Boles, Reference Noh and Boles1989). Despite greater SiO2 contents in the rhyolite/dacite-derived outcrop samples, zeolites are absent, indicating that fluid pH and salinity were insufficient to maintain silicic acid concentrations required for zeolitization. Conversely, the presence of zeolites (e.g. clinoptilolite) in the core samples is consistent with formation under higher pH and saline conditions that supported sustained silicic acid availability.
The XRD, FTIR, and SEM analyses of the outcrop samples show mineralogical features characteristic of montmorillonite. However, the low MgO contents from XRF data and the substantial tetrahedral Al identified by 27Al MAS NMR suggests a structural contribution from beidellite. Montmorillonite and beidellite are both dioctahedral smectites but differ in terms of the origin of the layer charge: in montmorillonite, the charge develops from isomorphic substitution of Mg or Fe for Al in octahedral sheets, whereas in beidellite, the charge results from substitution of Al for Si in tetrahedral sheets. Ross and Hendricks (Reference Ross and Hendricks1945) reported that mixed-layer and compositionally intermediate phases are common within the montmorillonite–beidellite series and that transitions between end-members are gradual rather than discrete. Accordingly, smectite in the outcrop samples is interpreted as a mixed assemblage of montmorillonite and beidellite, representing an intermediate composition within the smectite group.
Hydrothermal alteration commonly produces distinctive REE signatures and secondary minerals (Robb, Reference Robb2013). However, at this study site, REE-chondrite normalization results show no significant enrichment or depletion patterns, and mineralogical indicators of hydrothermal alterations are absent. The CIA and MIA values further indicate limited chemical weathering. These results suggest that the mineralogical and geochemical changes observed at the study site were driven primarily by diagenetic alteration rather than hydrothermal processes.
The bacterial community compositions in the outcrop and core samples provide independent constraints on depositional environments during mineral formation. The core samples are associated with bacterial communities reflecting more saline and oxidizing conditions, whereas the outcrop samples reflect lower salinity and more reducing conditions. Consistent with this interpretation, the fractionations and concentration of REEs are strongly influenced by aqueous pH and salinity (Dagg et al., Reference Dagg, Benner, Lohrenz and Lawrence2004; Quinn et al., Reference Quinn, Byrne and Schijf2006; Krickov et al., Reference Krickov, Lim, Manasypov, Loiko, Vorobyev, Shevchenko, Dara, Gordeev and Pokrovsky2020). Greater salinity reduces REE solubility and enhances anionic complexation, thereby increasing competition with major cations for incorporation into mineral structures (Elderfield et al., Reference Elderfield, Upstill-Goddard and Sholkovitz1990; Nozaki et al., Reference Nozaki, Lerche, Alibo and Snidvongs2000). Accordingly, lower REE concentrations in the core samples relative to the outcrop samples are consistent with formation under saline conditions.
Redox conditions inferred from Mössbauer analyses further support this interpretation. In the outcrop samples, Fe remains structurally incorporated within the crystal lattice, implying limited oxidative alteration. In contrast, the co-existence of magnetite and hematite in the core samples reflects post-depositional oxidation in which Fe2+-bearing magnetite was progressively transformed to Fe3+-rich hematite. This interpretation corroborates the results of the microbial community analysis, which indicates more oxidizing conditions in the core samples relative to the outcrop samples.
Bacterial communities commonly reflect persistent depositional environments (Inagaki et al., Reference Inagaki, Suzuki, Takai, Oida, Sakamoto, Aoki, Nealson and Horikoshi2003). The anaerobic, freshwater-associated bacteria identified in the outcrop samples indicate persistently reduced, freshwater conditions that probably limited silicic acid mobility and inhibited zeolite formation. Conversely, aerobic and halotolerant bacteria identified in the core samples reflect persistently oxidizing and saline conditions that favored silicic acid mobilization and zeolite formation. Although interpretations of redox and salinity conditions are based on indirect evidence and direct effects of bacterial activity on mineral alteration were not quantified, the consistent correspondence among mineralogical, geochemical, and microbial characteristics indicates that depositional conditions were closely associated with the contrasting formation of smectite and zeolite in the study area.
Conclusions
Mineralogical, geochemical, thermal, and bacterial community analyses indicate that the outcrop (PS) and core (DH-2) samples formed under contrasting diagenetic environments. The outcrop samples contain Ca-smectite (montmorillonite–beidellite series), cristobalite, and amorphous aluminosilicates, whereas the core samples contain zeolites (clinoptilolite and mordenite), quartz, cristobalite, and feldspar. Smectite in the core samples, found at specific depths, is classified as (Na,Ca)-smectite, with a slight predominance of Na in the interlayer.
The outcrop and core samples originated from rhyolitic and andesitic precursors, respectively. Mössbauer spectra indicate that Fe in the outcrop sample is retained within the smectite structure, whereas the presence of magnetite and hematite in the core samples indicate post-depositional oxidation. These redox differences are consistent with the bacterial community results: the outcrop samples are associated with anaerobic, freshwater conditions, whereas the core samples correspond to aerobic and high-salinity environments. These contrasting formation environments explain the mineralogical and geochemical variations.
Environmental conditions, particularly pH, salinity, and redox state, played a key role in mineral-formation pathways. Saline and oxidizing conditions in the core samples probably increased fluid pH and silicic acid availability, promoting zeolite formation. In contrast, lower salinity and reducing conditions in the outcrop samples favored smectite formation but did not support zeolitization.
Supplementary material
The supplementary material for this article can be found at http://doi.org/10.1017/cmn.2026.10024.
Author contribution
Wan Hyoung Cho: Methodology, Formal analysis, Investigation, Writing – original draft, Visualization. Dawoon Jeong: Investigation, Formal analysis, Writing – original draft (Bacterial community part). Yoonah Bang: Formal analysis. Geon Young Kim: Formal analysis. Ji-Hun Ryu: Conceptualization, Resources, Investigation, Writing – review & editing, Project administration, Funding acquisition. Ho Young Jo: Conceptualization, Resources, Investigation, Writing – Review & editing.
Acknowledgments
Mössbauer spectral analysis was performed at the Korea Atomic Energy Research Institute (KAERI).
Financial support
This research was supported by the Institute for Korea Spent Nuclear Fuel and National Research Foundation of Korea grant funded by the Korea government (Ministry of science and ICT, MIST) (No. 2021M2E1A1085186).
Competing interests
The authors declare that they have no known competing financial interests or personal relationships that could have appeared to influence the work reported in this paper.
Data availability statement
All data generated or analyzed during this study are included in this published article and its supplementary information files. Additional data are available from the corresponding author upon reasonable request.


 Open access

