

Introduction
Conservation science should integrate both ecological and evolutionary principles into priority setting exercises to ensure that populations can continue responding to environmental changes (Groom et al. Reference Groom, Meffe and Carroll2006) and to focus conservation actions on any endangered population, regardless of its taxonomic level (Pimm and Jenkins Reference Remsen, Cadena, Jaramillo, Nores, Pacheco, Pérez-Emán, Robbins, Stiles, Stotz and Zimmer2010). Although the criteria of the IUCN Red List can be applied to any taxonomic unit, including taxa below the species level or forms not formally described (IUCN Reference Joseph2011), threat categorisation is seldom applied at this level (see IUCN 2010). This may in part be due to the arbitrary definition of many subspecies or that the criteria used to establish them lack evolutionary support (Zink Reference Zink2004). Consequently, with conservation priorities largely focusing on well-established taxa, some cryptic species facing a critical situation may have been ignored (see Rusello et al. Reference Rusello, Glaberman, Gibbs, Marquez, Powell and Caccone2005a).
Detection of cryptic diversity has acquired an important role in conservation because cryptic species or unidentified independent evolutionary units may be subject to different threats to the nominal species and if the latter does not have threatened status, these threats may go unaddressed (Rusello et al. Reference Rusello, Glaberman, Gibbs, Marquez, Powell and Caccone2005a, Reference Rusello, Lin, Amato and Caccone2005b, Reference Rusello, Stahala, Lalonde, Schmidt and Amato2010). This has been observed in Amazona leucocephala bahamensis, an otherwise extended species of the Bahamas, now with two isolated populations restricted to the largest islands of the archipelago, each one facing a different set of pressures and requiring different conservation actions (Rusello et al. Reference Rusello, Stahala, Lalonde, Schmidt and Amato2010). A similar situation may arise where populations are fragmented and taxonomic uncertainty exists, as is the case for the Pyrrhura parakeets of northern South America (Collar Reference Collar, del Hoyo, Elliott and Sargatal1997, Joseph Reference Joseph and Stockwell2002, Ribas et al. Reference Ribas, Joseph and Miyaki2006).
Currently, there are five formally recognised species of Pyrrhura in Colombia (Remsen et al. Reference Harris and Froufe2012) and two of them, Santa Marta Parakeet Pyrrhura viridicata and Flame-winged Parakeet P. calliptera, are endemic and threatened with extinction (IUCN 2010). The remaining three are Maroon-tailed Parakeet P. melanura, Painted Parakeet P. picta and the recently recognised Bonaparte’s Parakeet P. lucianii (Remsen et al. Reference Harris and Froufe2012). Both P. melanura and P. picta have Andean or trans-Andean subspecies, with a restricted and isolated geographic range, and which have presumably experienced a high percentage of habitat loss (Rodríguez-Mahecha and Hernández-Camacho Reference Rodríguez-Mahecha and Hernández-Camacho2002, Botero-Delgadillo and Páez Reference Botero-Delgadillo and Páez2011a). Although some biogeographic and morphological studies argue that these geographic races merit the status of species (Joseph and Stockwell Reference Morrone2002, Arndt Reference Arndt2008), this remains to be confirmed and has diverted attention away from the population status of each geographic unit (Botero-Delgadillo and Páez Reference Botero-Delgadillo and Páez2011a). Worryingly, it has been suggested that these isolated populations are subject to diverse pressures and their status could be critical or in some cases they may even be extinct (Rodríguez-Mahecha and Hernández-Camacho Reference Rodríguez-Mahecha and Hernández-Camacho2002, Botero-Delgadillo and Páez Reference Botero-Delgadillo and Páez2011a).
Here, as part of research on the biogeographic history and biogeographic patterns of the genus Pyrrhura, we use climate envelope models (CEMs) to make a first approach to the geographic distribution and conservation status of Andean and trans-Andean populations in Colombia. CEMs are recognised not only as an important exploratory technique to answer evolutionary and biogeographic questions (Nogués-Bravo Reference Ortega-Huerta and Peterson2009, Graham et al. Reference Graham, Silva and Velásquez-Tibatá2010) but as a valuable tool to infer habitat loss, potential threats and the conservation status of many species (Elith and Leathwick Reference Elith, Leathwick, Moilanen, Wilson and Possingham2009, Freile et al. Reference Freile, Parra and Grahamn2010). Given the presumed situation and potential threats to the range-restricted populations of Pyrrhura parakeets in Colombia (see Botero-Delgadillo and Páez Reference Botero-Delgadillo and Páez2011a, Reference Botero-Delgadillo and Páez2011b), this study uses CEMs to predict their present geographic distributions with three main aims: to identify biogeographic patterns among Andean and trans-Andean populations; to demonstrate that under predictions based on CEMs, most if not all subspecies are completely isolated and therefore can be proposed as independent conservation units; and to make a first assessment of their conservation status based on a gap analysis and estimations of habitat transformation and remaining habitat.
Methods
Study taxa
In this study we considered one full species and four subspecies of Colombian Pyrrhura as conservation units. The only taxon at species level was P. calliptera, which is distributed along the central part of the eastern Andes and is listed as “Vulnerable” by IUCN (2010) and the Red List of Colombian birds (Renjifo et al. Reference Renjifo, Franco, Amaya, Kattán and López-Lanús2002). P. viridicata was not included because its distribution and conservation status will be considered elsewhere (Botero-Delgadillo et al. unpubl. data). At the subspecies level, we included the geographically isolated Andean and trans-Andean subspecies of P. melanura: P. m. chapmani and P. m. pacifica. The former is apparently restricted to the upper Magdalena valley, while the latter is known from a restricted portion of the Chocó region in Colombia and Ecuador (Forshaw Reference Forshaw2010). We also considered two subspecies of P. picta: P. p. caeruleiceps from the northernmost part of the eastern Andes, which includes the formerly recognised P. picta pantchenkoi from the Perija mountains (see Joseph and Stockwell Reference Morrone2002), and P. p. subandina, a presumed extinct subspecies from the Sinú valley in the northern foothills of the western and central Andes (see Collar Reference Collar, del Hoyo, Elliott and Sargatal1997).
Data collection, cleaning and selection
We used point locality data for the study taxa from three public databases including Project BioMap (http://www.biomap.net/), DATAves (2006) and eBird (http://ebird.org/content/colombia). Additionally, we compiled historic records from the literature (Rodríguez-Mahecha and Hernández-Camacho Reference Rodríguez-Mahecha and Hernández-Camacho2002, Joseph and Stockwell Reference Morrone2002, Renjifo et al. Reference Renjifo, Franco, Amaya, Kattán and López-Lanús2002) and unpublished records (see acknowledgements). Data cleaning and selection followed Chapman (Reference Chapman2005): firstly finding and removing spatial outliers using ArcGIS 9.3 (ESRI 2008) and secondly, using DIVA-GIS (Hijmans et al. Reference Holdridge2006) to identify environmental outliers employing cumulative frequency curves for five climatic variables (annual mean temperature, isothermality, annual precipitation, temperature annual range, precipitation of coldest quarter) and a multivariate bioclimatic envelope. Only some spatial outliers were removed prior to modelling and none of the remaining points were classed as environmental outliers in DIVA-GIS, such that the following sample sizes were used for each taxon: P. calliptera (n = 42); P. m. pacifica (n = 31); P. m. chapmani (n = 20); P. p. caeruleiceps (n = 17); P. p. subandina (n = 7).
Potential distribution modelling
Given the small sample sizes for the majority of populations, we chose maximum entropy to predict climatic niches using the software MaxEnt 3.3.3 (Phillips Reference Phillips, Anderson and Schapire2010). Maximum entropy performs well compared to other methods based on presence and background data (Elith et al. Reference Elith, Graham and Anderson2006, Ortega-Huerta and Peterson Reference Pearson and Dawson2008), especially when sample sizes are limited (Hernández et al. Reference Hijmans, Cruz and Guarino2006, Pearson et al. Reference Phillimore and Owens2007). The inputs for models were point locality data and the same 15 environmental variables recommended by Graham et al. (Reference Graham, Silva and Velásquez-Tibatá2010) from the WorldClim database at 1 km2 resolution (http://www.worldclim.org/).
Because re-sampling techniques have been proposed as a valid method to assess model reliability with small sample sizes (Pearson et al. Reference Phillimore and Owens2007), bootstrapping with 1,000 replicates was used in order to gain a better approximation of the predicted distribution of each population (see Dormann Reference Dormann2007). To determine whether the number of replicates was appropriate, we modelled the relationship between the standard deviations of entropy and prevalence (see Elith et al. Reference Elith, Phillips, Hastie, Dudík, Chee and Yates2011) and the number of replicates for each taxon. Models revealed that in all taxa, standard deviations had stabilised between 150 and 500 replicates, indicating that when distributions are built with more than 500 replicates, the predicted distribution area will be similar, regardless of the sample size used (Botero-Delgadillo unpubl. data).
The model tuning parameters in bootstraps varied for each population according to data availability, with betamultipliers ranging from 0.35 to 1.30 (Table 1). For model testing in all bootstrap runs, we fixed a random set of 30% of the locality data, and according to our sample sizes, we set linear and/or quadratic features to obtain smoothed predictions (Phillips and Dudik Reference Pimm, Jenkins, Sodhi and Ehrlich2008, Elith et al. Reference Elith, Phillips, Hastie, Dudík, Chee and Yates2011). For all replicates, we selected a 10,000 point background for north-west South America and the logistic model output, which shows the probability of occurrence within each 1 km2 cell with a value ranging from 0 to 1 (see Elith et al. Reference Elith, Phillips, Hastie, Dudík, Chee and Yates2011 for details). Subsequently, to create a consensus model for each subspecies, we selected the lower 95% confidence limit for the mean of all replicates to represent distributions. Following Graham et al. (Reference Graham, Silva and Velásquez-Tibatá2010), we used the 20thpercentile training presence threshold to transform the consensus model to a presence-absence prediction. Finally, we used jackknife replicates from bootstraps to estimate the contribution of the 15 environmental variables to the resulting models.
Values for some modelling parameters and for tests of model performance in determining the distribution of five Pyrrhura parakeets.
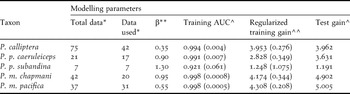
* Total: point locality data available in public databases; used: point locality data used for modelling after cleaning and selection.
** Betamultiplier.
^ Mean value from 1,000 bootstrap replicates (Standard Deviation).
^^ Mean value from 1,000 bootstrap replicates only.
To test model fit, we used MaxEnt’s analysis of omission/commission on the training presence and test records, and the mean values for the area under the Receiver Operating Characteristic (ROC) curves for the same data (AUC; Phillips et al. Reference Phillips and Dudik2006, Phillips and Dudik Reference Pimm, Jenkins, Sodhi and Ehrlich2008). We also used the training omission rates and test omission rates for the threshold employed to obtain the presence-absence models, and binomial probability tests were conducted to confirm the null hypothesis that test points were predicted no better than by a random prediction (see Phillips et al. Reference Phillips and Dudik2006). The standard deviation of the mean AUC value from all replicates was taken as an estimate of uncertainty around a models’ performance.
Given that cell size for predictions was c.1 km2, cell counts for distribution models allowed us to estimate the geographical range for all populations.
Biogeographic patterns and geographic isolation
We conducted a three-step method in order to describe the biogeographic patterns of the taxa involved. First, we identified and compared the extent of different biomes within the potential distributions of Colombian populations. Secondly, we constructed individual tracks and baselines (Morrone Reference Nogués-Bravo2009) for the subspecies of P. melanura and P. picta to propose potential causes of their range limits at a regional scale (Graham et al. Reference Graham, Silva and Velásquez-Tibatá2010). Individual tracks are the basic unit of pan-biogeographic analysis, widely used to determine potential distributions and the historical barriers affecting them (see Morrone Reference Nogués-Bravo2009). Our tracks connected all known subspecies of P. melanura and P. picta in north-west South America through point locality data separated by more than 50 km, and any baseline (i.e. a distribution discontinuity) coinciding with a geographical (e.g. mountains and rivers) or environmental (e.g. dry valleys) barrier was proposed as a potential limit to dispersal. For this purpose, we combined our dataset with point localities for all other subspecies compiled in Ridgely et al. (Reference Ridgely, Allnutt, Brooks, McNicol, Mehlman, Young and Zook2007), and superimposed on them a 1 km2 digital elevation model from the CGIAR Consortium for Spatial Information (http://srtm.csi.cgiar.org/) and vector data of the Holdridge Life-Zones Digital Map (http://www.fao.org/geonetwork/srv/). Lastly, we searched for environmental discontinuities around distributions, to determine which climatic factors may be limiting geographic ranges at a local scale (Graham et al. Reference Graham, Silva and Velásquez-Tibatá2010). We achieved this by overlapping distributions with classified annual mean temperature and annual precipitation Gridfiles, and subsequently identifying the WorldClim parameters which contributed most to the definition of distribution models.
To evaluate the degree of geographic isolation between the subspecies P. p. caeruleiceps/subandina and P. m. chapmani/pacifica (see Forshaw Reference Forshaw2010), we first estimated the overlap in potential distribution between subspecies using a distribution based on optimum environmental conditions (see consensus models above) and secondly with the maximum possible distribution (maximum prediction of all bootstrap replicates). Both estimates were used to obtain a ‘sympatry probability interval’, which we defined as the percentage overlap between a consensus model (lower limit) and the maximum prediction (higher limit). Regardless of dispersal probabilities, we defined geographic isolation when the upper limit of the ‘sympatry probability interval’ was ≤ 0.25 or when the sum of the lower limit and the upper limit was ≤ 0.3. These minimum values were arbitrarily chosen to avoid a type I error (i.e. assume that populations are not connected when climatic niches are continuous). Any taxon defined as isolated under these conditions was also proposed as a valid conservation unit.
Preliminary assessment of conservation status
To make a preliminary assessment of the conservation status of each taxon in Colombia we estimated their area of occupancy according to IUCN guidelines (IUCN Reference Joseph2011). The area of occupancy for each taxon was taken as the extent of its potential habitat, which in turn was defined in accordance with described habitat requirements following Botero-Delgadillo and Páez (Reference Botero-Delgadillo and Páez2011a). Potential habitat could therefore include fragmented forests or secondary vegetation as Pyrrhura Parakeets are known to use this type of cover (Botero-Delgadillo and Páez Reference Botero-Delgadillo and Páez2011a). To estimate potential habitat, we summed the number of cells where each taxon was predicted to occur and where its habitat requirements were met (see IUCN Reference Joseph2011), by overlapping potential distributions with rasterized land-cover and ecosystem layers in ArcGIS 9.3, using layers from the 2008 Land-use Planning Geographic Information System (SIG-OT) of the “Agustín Codazzi” Geographic Institute of Colombia (http://sigotn.igac.gov.co/sigotn/). Finally, we compared our estimates of area of occupancy with the threshold values given under the IUCN’s criterion B2 (IUCN Reference Joseph2011), since this was the only criteria compatible with the information generated here. This allowed us to make a preliminary inference of the threat category for populations in Colombia but not elsewhere as no geographic layers were available to estimate potential habitat and habitat transformation.
Gap analysis and conservation priorities
The first step in the gap analysis was to generate an estimate of the current state of habitat transformation (i.e. current area without original cover) inside each population’s potential distribution within Colombia. This was carried out by overlapping our distribution models with a rasterized land-use layer and two additional layers of original ecosystems and biomes (see above). Since we were able to estimate the representation of all ecosystems within distributions, we calculated a habitat transformation percentage by subtracting all cells lying within converted areas (i.e. different from original cover). Because we only measured the current extension of transformed areas relative to the extension of original vegetation, our estimations do not imply any temporal context. Next, we estimated the percentage representation of the area of occupancy within protected areas by superimposing each taxon’s potential habitat with a layer for the National Protected Areas System (SINAP; Vásquez-V. and Serrano-G. Reference Vásquez-V. and Serrano-G.2009). Finally, we identified areas of potential habitat lacking protection to suggest where further research and conservation efforts should focus.
Results
Modelling results
All our models performed well based on the theoretical parameters for testing model fit. When plotting omission rates as a function of the cumulative threshold, omission rates on training and test samples were close to the predicted omission on most replicates of all taxa. The receiver operating characteristic (ROC) curves for the same data revealed high sensitivity as the fractional predicted area increased, such that the mean AUC values for training data for all taxa were always higher than 0.90 (Table 1). Mean values for regularised training gain ranged between 1.25 and 4.31 while mean values for test gain ranged between 1.20 and 5.00 (Table 1). The mean P-values of the binomial probability tests for the threshold used and its corresponding training and test omission rates were < 0.01 in all species/subspecies. Finally, standard deviations around the mean AUC values for training data (see Table 1) indicated that uncertainty surrounding each model’s performance was very low.
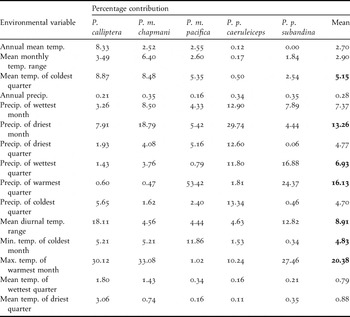
Although jackknife tests of the importance of climatic variables showed some differences among taxa, a group of 4-6 variables contributed the most to model construction. Jackknife tests of regularised training gain and test gain showed that precipitation in the warmest month, maximum temperature of the warmest month, precipitation of the wettest quarter and minimum temperature of the coldest month showed the highest gain when used in isolation. We also noted a greater decrease in gain when any of the following variables were excluded: mean temperature of the coldest quarter, precipitation of the wettest quarter and maximum temperature of the warmest month. A similar pattern was observed when analysing the heuristic estimates of the relative contribution of the environmental variables to each model (Table 2).
Heuristic estimates of the relative contribution of individual environmental variables to the definition of distribution models for the five Pyrrhura parakeets studied. Bold numbers indicate the highest mean values. Temp. = temperature; Precip. = precipitation; Min. = minimum; Max. = maximum, quarter = three month periods of the year.
Biogeographic patterns and geographic isolation
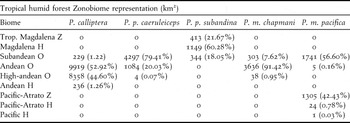
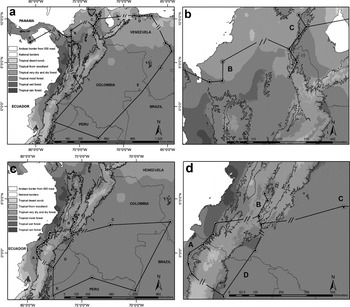
Excluding P. p. subandina, our models showed that Pyrrhura populations in north-western South America are largely restricted to montane areas and/or the Andean foothills (Figure 1). Apart from P. calliptera which is only predicted to occur above 1,800 m asl, the remaining taxa are present from low (400 m) to high elevations (2,000 m) (Figure 1). The climatic niches of Pyrrhura parakeets were restricted to the Tropical humid forest Zonobiome (Table 3) and predicted distributions were located almost exclusively in areas with precipitation values > 2,000 mm/year (Figure 1). Andean orobiomes were the most represented biomes in potential distributions, although zonobiomes and helobiomes were also important for populations from the Chocó-Magdalena region (P. m. pacifica and P. p. subandina) (Table 3). In the case of P. p. subandina, almost 60% of its distribution occurred in the Caribbean-Magdalena Helobiome, a humid zone that extends along the Sinú River and limits with the dry zones of the peri-Caribbean belt.
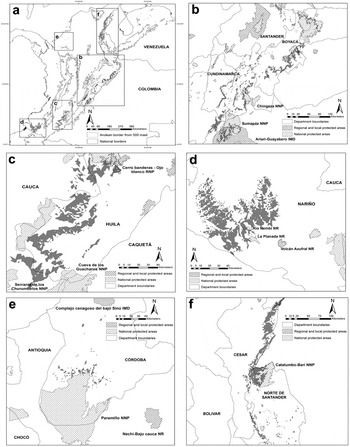
Potential distribution of the five Pyrrhura parakeets studied and their relation to annual precipitation. a. Precipitation zonation of the study area and location of each species predicted distribution; b. Potential distribution of P. calliptera; c. Potential distribution of P. m. chapmani; d. Potential distribution of P. m. pacifica; e. Potential distribution of P. p. subandina; f. Potential distribution of P. p. caeruleiceps.

Representation estimates and their corresponding percentages of different biomes within the potential distributions of the five Pyrrhura parakeets studied. All biomes are sub-categories of the Tropical humid forest Zonobiome. Z = Zonobiome; H = Helobiome; O = Orobiome.
Individual tracks showed that both geographical and environmental barriers coincided with baselines between localities inhabited by the subspecies of P. melanura and P. picta (Figure 2). In the case of P. melanura, the Andes coincided with all baselines separating Andean and trans-Andean populations (P. m. pacifica and P. m. chapmani) from the cis-Andean races (P. m. melanura and P. m. souancei), suggesting that geographical barriers strongly influence distributions. In the case of the P. picta complex, the baselines separating trans-Andean races (P. p. einsenmanni, P. subandina and P. caeruleiceps) from cis-Andean populations (P. p. emma and related taxa) coincided with the Andes, while at a local scale, baselines between localities of trans-Andean subspecies coincided with extensive areas of low precipitation, dominated by dry forests and savannas.
Individual tracks connecting point locality data for the subspecies of P. picta and P. melanura in north-west South America and Panamá. Each track was overlapped with the two major potential barriers to dispersal: Andean border from 500 m asl as a potential geographical barrier, and plant formations (sensu Holdridge 1963) as a potential environmental barrier. Small parallel lines are baselines; long and continuous lines correspond to extensions without barriers, whereas baselines represent discontinuities in environmental and/or topographical conditions. a. Individual track for subspecies of P. picta: A = P. p. einsenmanni, B = P. p. subandina, C = P. p. caeruleiceps, D = P. p. emma, E = cis-Andean forms of P. picta; b. Zoom to region occupied by the two subspecies of P. picta studied. c. Individual track for subspecies of P. melanura: A = P. m. pacifica, B = P. p. chapmani, C = P. m. melanura, D = P. m. souancei, E = P. m. berlepschi; d. Zoom to the region occupied by the two subspecies of P. picta studied and the nearest subspecies (C and D).
The overlapping of distributions with climate gridfiles and the relative contributions of environmental variables (see Modelling results) suggest that an interaction between annual precipitation and seasonality of precipitation and temperature could be shaping the climatic niches of the study taxa. Distribution limits coincide with precipitation zonation, with areas with abrupt decreases in rainfall causing discontinuities. Although the climatic niche of P. calliptera included areas with precipitation values of 1,000 mm/year (Figure 1), this ‘tolerance’ to relatively low rainfall only occurred above 2,000 m, where precipitation seasonality is less pronounced. The other taxa, aside P. p. subandina, seem to be more sensitive to abrupt changes in rainfall and tend to be absent where precipitation values are below 1,500 or 2,000 mm/year (Figure 1).
Both the upper limits of ‘Sympatry probability intervals’ and the sum of the lower and upper limits were < 0.25 in all cases, revealing that the climatic niches of the races of P. picta and P. melanura are unconnected, even under an over-prediction scenario (Figure 3), and that following our criteria they should be treated as independent conservation units. Interval values in order of magnitude were 0.02, 0.09, 0.13 and 0.19 for P. p. subandina, P. m. chapmani, P. m. pacifica and P. p. caeruleiceps respectively.
Spatial representation of ‘Sympatry probability intervals’ for the subspecies of P. picta and P. melanura. a and c-Climatic niche predictions based on optimum environmental conditions (the lower 95% confidence limit for the mean of all replicates) for both groups; b and d-Climatic niche over-predictions based on the maximum possible distribution (maximum prediction of all bootstrap replicates) for both groups.
Conservation assessment and gap analysis
The predicted geographical ranges for all populations were below 20,000 km2 and areas of occupancy varied from c.130 to nearly 5,500 km2 (Table 4). Considering that the ranges are severely fragmented and have been declining continuously, our models suggest that four of the study taxa could be considered threatened with extinction at the national level, if thresholds for criterion B2 were applicable (see Table 4).
Area of occupancy estimates for the five Pyrrhura parakeets studied and their likely threat categorisations based on threshold values for the IUCN criterion B2.
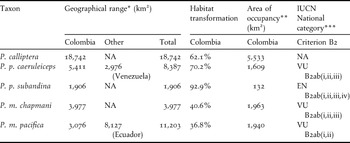
* Estimated potential distribution.
** Estimated potential habitat (including secondary forests).
*** According to established IUCN thresholds (2011).
Current transformation of habitat in Colombia for the populations studied varied from 36% to 92%, being most critical for the two subspecies of P. picta (Table 4). Almost all original vegetation cover along the climatic niche of P. p. subandina has been transformed, although it must be considered that the small sample of point locality data for this taxon may have caused an under-prediction of its range. In the case of P. p. caeruleiceps, much of its distribution consists of successional areas and small fragments of secondary forest.
The gap analysis revealed that in all taxa, less than 30% of their area of occupancy within Colombia is included within protected areas (Figure 4). For P. calliptera, P. p. caeruleiceps and P. m. chapmani the National Protected Areas System includes nearly 30% (1,547 km2), 20% (726 km2) and 10% (343 km2) of their potential habitat respectively, while less than 1% of potential habitat is included for P. p. subandina and P. m. pacifica. Although less numerous than local or regional protected areas, national parks contained the highest percentage of potential habitat (Figure 4).
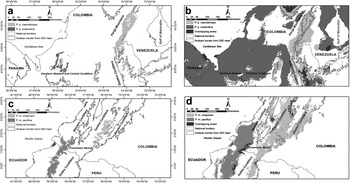
Remaining habitat (area of occupancy) of the five Pyrrhura parakeets studied and their representation in the National Protected Areas System of Colombia. Words in capital letters represent department names (see text for descriptions), while remaining names refer to protected areas. NNP = National Natural Park, IMD = Integrated Management District, RNP = Regional Natural Park, NR = Natural Reserve. a. location of remaining habitat for each taxa in Colombia; b. remaining habitat of P. calliptera; c. remaining habitat of P. m. chapmani; d. remaining habitat of P. m. pacifica; e. remaining habitat of P. p. subandina; f. remaining habitat of P. p. caeruleiceps.
Discussion
The climatic niches predicted by our models indicate that Andean and trans-Andean taxa of Pyrrhura may be restricted to relatively humid regions of the Andes cordillera and the Andean foothills, as previously proposed distributions have suggested (Collar Reference Collar, del Hoyo, Elliott and Sargatal1997, Forshaw Reference Forshaw2010). Furthermore, predictions also confirm that these populations are not only geographically isolated, but that their climatic niches are discontinuous. This discontinuity appears to be a result of physical and environmental barriers acting at a regional and local scale respectively, and might be enhanced through the fragmentation of their potential habitat by intensive deforestation throughout the Andes. The long-term effects of habitat fragmentation may not only be the isolation of small, previously connected populations, but also reduced potential for dispersal and seasonal migration in response to resource shortages (Botero-Delgadillo and Páez Reference Botero-Delgadillo and Páez2011a). Moreover, our estimates show that none of the taxa have more than a third of their potential habitat within protected areas, so fragmentation of their ranges is likely to increase.
Modelling considerations
In most of the taxa studied, more than 80% of point locality data used for modelling were predicted to be within their climatic niche, indicating that consensus models represented potential distributions well (see Freile et al. Reference Freile, Parra and Grahamn2010 for comparison with Ecuadorian Grallaria and Grallaricula). This conclusion was supported by the gain values, the AUCs for the ROC curves, the limited uncertainty around model fit and the low variability in predicted distribution area among the bootstrap replicates. However, model fit was not well supported for P. p. subandina (Table 1), presumably as a direct consequence of the reduced dataset available for this subspecies. Indeed, 58% of point locality data for P. p. subandina was not covered by the predicted distribution, indicating that neither the model nor the available point locality data were the best indicators of the species’s climatic requirements (see Pearson and Dawson Reference Pearson, Raxworthy, Nakamura and Peterson2003). Nevertheless, point locality data for P. p. subandina were distributed within a highly restricted area and therefore we expect our predicted distribution to be a reasonable approximation - though we must accept that subsequent conclusions regarding P. p. subandina should be treated cautiously.
Distribution and biogeographic patterns
Predicted distributions were restricted to the Tropical humid forest Zonobiome in all the taxa studied, revealing an environmental pattern of restriction to humid areas with low temperature seasonality. This climatic restriction caused a marked association of distributions with premontane and montane areas. Despite having a similar climatic niche, all Andean and trans-Andean Pyrrhura showed allopatric and restricted distributions, a pattern previously suggested for the entire genus (Collar Reference Collar, del Hoyo, Elliott and Sargatal1997, Ribas et al. Reference Ribas, Joseph and Miyaki2006).
While most parrots have a large dispersal capability and can travel significant distances in a day (Collar Reference Collar, del Hoyo, Elliott and Sargatal1997, Gilardi and Munn Reference Gilardi and Munn1998), Pyrrhura parakeets fly very close to the forest canopy and appear to depend on landscape cover and its continuity for long flights (Botero-Delgadillo and Páez Reference Botero-Delgadillo and Páez2011a, Botero-Delgadillo and Verhelst Reference Botero-Delgadillo and Verheslt2011). This ecological limitation would be consistent with the fact that some parts of their climatic niches are fragmented (Figures 1c, 1e, 1f), especially in areas where marked variations in seasonal temperature favour the interruption of the humid forest continuity by dry forest enclaves. This would also explain why environmental factors could be as important as geographical barriers in shaping distributions, as our results suggests. At a broad scale, geographic barriers and biotic interactions could therefore be the most important forces shaping distributions, while changes in landscape cover mediated by abrupt variations in precipitation and temperature seasonality could be an important local factor. The latter, alongside other factors, could be responsible for the restricted and discontinuous ranges predicted here. Graham et al. (Reference Graham, Silva and Velásquez-Tibatá2010) analysed 70 range-restricted bird species from the Colombian Andes, and concluded that dispersal limitation may influence range limits at a broad scale, whereas strong environmental gradients would shape limits at a local scale.
Our results indicated allopatry between the subspecies of P. melanura and P. picta considered, but we cannot dismiss the possibility that dispersal and genetic flow occur. The diversification of the Pyrrhura during short periods in the Pleistocene associated with the contraction of humid forests (Ribas et al. Reference Ribas, Joseph and Miyaki2006), suggests that historically their dispersal ability has been limited by discontinuities in humid forest cover and supports the idea that discontinuity continues to act as a barrier today. Taking this apparent sensitivity to landscape structure into account, our range predictions and over-predictions suggest that humid conditions cannot maintain a connection between P. p. caeruleiceps and subandina or P. m. chapmani and pacifica. Joseph and Stockwell (Reference Morrone2002) used GARP to model the distributions of P. p. caeruleiceps/subandina and also concluded that there was no overlap in distribution, and there have been repeated calls to treat P. p. subandina and P. p. caeruleiceps as valid species (Joseph Reference Joseph2000, Joseph and Stockwell Reference Morrone2002, Arndt Reference Arndt2008, Forshaw Reference Forshaw2010). Considering their separation by a geographic/environmental gap and their morphological differences (Collar Reference Collar, del Hoyo, Elliott and Sargatal1997, Forshaw Reference Forshaw2010), we conclude that these four races should be considered independent units, especially for conservation purposes.
Conservation status and concluding remarks
Our models and current estimates of area of occupancy indicate that the subspecies of P. picta and P. melanura studied here could be considered threatened with extinction based only on the thresholds for the IUCN criterion B2 (IUCN Reference Joseph2011). In addition to the direct impacts of deforestation such as habitat loss, Pyrrhura parakeets seem to be particularly sensitive to fragmentation both at a habitat and landscape level (see Botero-Delgadillo and Páez Reference Botero-Delgadillo and Páez2011a). Their apparent dependence on a forest-dominated landscape matrix, coupled with restricted geographical ranges and extensive habitat loss make them prone to geographic and genetic isolation and more vulnerable to demographic and environmental stochasticity (see Botero-Delgadillo and Páez Reference Botero-Delgadillo and Páez2011a, Reference Botero-Delgadillo and Páez2011b).
Based on the distribution patterns and morphological differences mentioned above, we suggest that the four subspecies treated here should be considered for management planning and future regional and local conservation actions. Such recognition may represent a risk for some stakeholders and conservation organisations, since subspecies represent ambiguous taxonomic units and their inclusion in conservation planning is a debated subject (Zink Reference Zink2004, Harris and Froufe Reference Hernández, Graham, Master and Albert2005). However, a recent review on subspecies validity at a global level, revealed that more than a third of these taxa have received taxonomic support based on molecular and phylogenetic data (Phillimore and Owens Reference Phillips2006), supporting their inclusion. Indeed, both the IUCN Red List (IUCN Reference Joseph2011) and the U.S. Endangered Species Act (USFWS and NMFS 1996) have set a precedent by allowing the listing of subspecies. Nevertheless, in the case of the subspecies studied here, a deeper evaluation of their conservation status is necessary in order to submit a solid proposal to IUCN for regional or global categorisation. At a national level, the publication of a Threatened Parrot Conservation Action Plan including both full species and subspecies (Botero-Delgadillo and Páez Reference Botero-Delgadillo and Páez2011a, Reference Botero-Delgadillo and Páez2011b), is a first step towards recognising the conservation needs of these taxa but it does not guarantee their inclusion in decision making or local and regional management plans.
We are aware that many knowledge gaps remain before we can accurately assess the needs of the populations studied here; even so our results allow us to make recommendations for research and/or conservation actions for each taxon. Although our estimates of area of occupancy apparently indicated that P. calliptera should not be considered threatened with extinction under criterion B2, our distribution model suggests that its geographical range is small enough that it can be considered “Vulnerable” (VU) if only criterion B1 is applied (Table 4). This is in complete accordance with the species’s current situation (BirdLife International 2012). The major threat for this species continues to be forest clearance, primarily for cattle pastures but also for other agricultural uses (see Botero-Delgadillo and Páez Reference Botero-Delgadillo and Páez2011a). Sumapáz and Chingaza National Parks, the Ariari-Guayabero Integrated Management District and a network of regional reserves are the main protected areas covering its potential habitat, and future conservation activities should focus on increasing the connectivity between forest fragments within its area of occupancy, especially unprotected areas in northern Cundinamarca and southern Boyacá (Figure 4b). Research needs include confirming this species presence on the eastern slope of the Eastern Cordillera in the department of Boyacá and in the southernmost part of its range in southern Cundinamarca (Figs. 1b and 4b), as well as more detailed studies of habitat use and the impact of deforestation and fragmentation on dispersal ability and reproductive biology.
P. m. chapmani and P. m. pacifica are little known populations of Pyrrhura and areas with high probability of occurrence require further study. While these populations are poorly represented within protected areas, they also have the lowest estimates of current habitat transformation (Table 4). Our preliminary evaluation suggests that P. m. chapmani meets the threshold established for criterion B2 to be considered “Vulnerable”, but further research is necessary. Firstly, confirmation of its presence in the western and southern parts of its range and along the eastern Cordillera north of the Acevedo municipality is required (Figure 1c) and secondly, basic information on ecology and reproductive biology is needed to assess the impact of deforestation on its range, especially below 1,800 m. If P. m. chapmani is confirmed as a valid taxon, it will be essential to increase the presence of protected areas within its range (Figure 4c). In the case of P. m. pacifica, its estimated area of occupancy also meets the threshold to be considered regionally “Vulnerable” under criterion B2, but its situation may vary between countries. While its range in Ecuador is relatively large and it is considered abundant, its distribution in Colombia is restricted and few records exist. Although its habitat transformation percentage is comparatively low (Table 4), the poor representation of its range in the Colombian national protected areas system (see Figure 4d) could be critical since deforestation is still occurring and hunting and the pet trade are additional threats (Botero-Delgadillo and Páez Reference Botero-Delgadillo and Páez2011a, Reference Botero-Delgadillo and Páez2011b).
The two subspecies of P. picta are the most critical of the populations treated here, having the most restricted ranges and highest levels of habitat transformation (Table 4). Presence of P. p. caeruleiceps must be confirmed in the Catatumbo-Barí NNP, one of the two protected areas within its distribution (Figure 4f). Though its situation in Venezuela is probably better and the Sierra de Perijá NNP covers most of its range there, protection of part of its Colombian distribution in the northern reaches of the eastern Cordillera and the Perijá Mountains is a priority (Figs. 1f and 4f). Also, studies of habitat requirements, reproductive biology and population status are required to design management tools that combat the negative effects of extensive forest degradation (see Tovar-Martínez Reference Tovar-Martínez2010, Botero-Delgadillo and Páez Reference Botero-Delgadillo and Páez2011a, Reference Botero-Delgadillo and Páez2011b).
Future research on P. p. subandina should undoubtedly focus on confirming if extant populations remain in any part of its potential distribution. No confirmed records have been made in the last 60 years and successive explorations between 2004 and 2006 at more than 10 potential localities failed to find this parakeet (CVS and Universidad Nacional 2004, A. Mayorquín in litt. 2011). We highly recommend that explorations are launched immediately to confirm its continued existence in Paramillo National Park (see Figure 4e), the San Jerónimo and Ayapel Mountains, and El Mocho ridge in southern Cordoba. Future records will not only confirm its current status, but also facilitate the production of more realistic climatic niche models and improve the precision of geographical distribution and potential habitat estimates.
Acknowledgements
We thank Zoologische Gesellchaft für Arten- und Populationsschutz e.V. and Fonds für bedrohte Papageien for funding, and to René Wüst for his advice and ideas for the entire project. We especially want to thank Miguel Lentino, Maria Isabel Moreno and Adriana Mayorquín for the valuable information they provided. Also, to the following curators of collections, ornithologists and birdwatchers that kindly provided us access or data: F. G. Stiles Juan Pablo López, Rocío Espinosa, Luis Fernando Caceres, Cristobal Navarro, Yurgen Vega, Cristian Flórez Paí, Yuri Rosero Mora and Luis Guillermo Linares. An anonymous referee made valuable comments on an earlier version of this manuscript.


