

Introduction
Records of past atmospheric deposition can be preserved in the firn and ice of non-temperate glaciers. These records provide insight into changes in the chemical composition of the atmosphere (Reference Neftel, Beer, Oeschger, Zürcher and FinkelNeftel and others, 1985; Reference MayewskiMayewski and others, 1986; Reference Legrand, Lorius, Barkov and PetrovLegrand and others, 1988) and into the nature and intensity of the atmospheric circulation systems which deliver aerosol to the site of deposition. Such records may be particularly valuable for reconstructing past climates (Reference MayewskiMayewski and others, 1993, Reference Mayewski1994) and the history of air pollution (Reference Barrie, Fisher and KoernerBarrie and others, 1985; Reference Wagenbach, Münnich, Schotterer and OeschgerWagenbach and others, 1988; Reference BoutronBoutron, 1995).Where atmospheric chemistry varies on subannual time-scales, annual cycles of solute deposition may be preserved in glacier ice, providing stratigraphic markers which allow dating of ice cores and reconstruction of changes in accumulation rate (Reference Mayewski, Spencer, Lyons and TwicklerMayewski and others, 1987; Reference SteffensenSteffensen, 1988; Reference Davidson, Harrington, Stephenson, Small, Boscoe and GandleyDavidson and others, 1989; Reference WakeWake, 1989; Reference Jonsson and HanssonJonsson and Hansson, 1990).
Long ice-core records have been recovered from Devon, Agassiz, Meighen and Penny Ice Caps in the Canadian Arctic (Reference Koerner and PatersonKoerner and Paterson, 1974; Reference KoernerKoerner, 1977; Reference Fisher, Koerner and ReehFisher and others, 1995; Reference Grumet, Wake, Zielinski, Fisher, Koerner and JacobsGrumet and others, 1998). However, until recently there have been few detailed studies of snow chemistry in this region (Reference Koerner and FisherKoerner and Fisher, 1982; Reference Goto-Azuma, Koerner, Nakawo and KudoGoto-Azuma and others, 1997). Such studies are needed to define the seasonal cycle of atmospheric deposition to ice caps, and to provide information about spatial variations in snow chemistry that allow assessment of how spatially representative are ice-core sites, and how significant are temporal changes in chemistry recorded in ice cores. Here we present the results of a detailed study of the seasonal and spatial variations in the chemistry of the snow cover of a large polythermal glacier on eastern Ellesmere Island. The study was undertaken as part of an effort to reconstruct the recent accumulation history of the glacier from measurements on shallow ice cores. These demanded knowledge of the seasonal cycle in snowpack chemistry to assist dating of the ice cores by identification of annual layers defined by variations in ice chemistry.
The specific objectives of this study were to:
-
(i) describe the physical characteristics of the snowpack and their variation with elevation;
-
(ii) establish the seasonal pattern of snow accumulation, its variation with elevation, and its relationship to the physical characteristics of the snowpack;
-
(iii) characterize the seasonal and spatial variability in the major-ion chemistry of the snowpack and its relationship to the physical characteristics of the snowpack;
-
(iv) compare seasonal changes in snow chemistry with seasonal changes in the chemistry of the atmospheric aerosol as determined from a 15 year time series of measurements at Alert, on the northern tip of Ellesmere Island (Reference Sirois and BarrieSirois and Barrie, 1999); and
-
(v) investigate the influence of surface elevation and snow accumulation on the mean water-weighted (MWW) concentrations of major ions within the snowpack, and on atmospheric deposition of major ions.
Field Site
John Evans Glacier is located at the head of Allman Bay, on the eastern coast of Ellesmere Island, Nunavut, Canada (79°40′ N, 74°23′ W; Fig. 1). It has an area of 165 km2 and spans an elevation range of 100–1500 m. The maximum ice thickness approaches 400 m near the equilibrium line, which is located at 750–800 m a.s.l. For the period June 1996–June 1997, the mean annual air temperature at an automatic weather station located at an elevation of 250 m on the glacier was −14.7°C. Fifteen-metre ice temperatures in the accumulation area range from −10° to −15°G. The glacier is composed primarily of ice at sub-freezing temperatures, but the melting point is reached at the bed over much of the ablation area and there is a thin (<40 m) basal layer of temperate ice in the lower ablation area (Reference Copland and SharpCopland and Sharp, 2001). Catchment geology is dominated by limestones, dolostones and anhydrite/gypsum of Cambrian, Ordovician and Silurian age (Reference KerrKerr, 1972).
(a) July 2000 Landsat 7 image of John Evans Glacier. Locations of the three weather stations (LWS, MWS and UWS) are shown. Snow-pit sites are numbered according to their elevation (in hundreds of metres). (b) Map showing the location of the glacier on Ellesmere Island.

Field Methods
Sampling was conducted in May 1995. Snow pits were excavated at 100 m elevation intervals between 100 and 1100 m a.s.l. (Fig. 1). Pits were dug to the level of the 1994 summer surface with a Teflon-coated aluminium shovel. The physical stratigraphy of the snowpack was described prior to sampling. Snow density was measured on non-continuous samples (normally 0.0001 m3, but 0.00001 m3 where layers were <0.06 m thick) collected from each distinct layer. Crystal size and shape were described after viewing under a hand lens. Snow temperature was measured at 10% depth intervals using dial thermometers. Water equivalent accumulation at each site was determined by summing the products of density and layer thickness for all layers in the snowpack.
For chemical sampling, a second face immediately adjacent to that used for description of the physical stratigraphy was cleaned by removing at least 0.1 m of snow with a plastic scoop. A worker wearing clean plastic gloves conducted vertically continuous sampling on a layer-by-layer basis. Samples were transferred to clean plastic bags using the plastic scoop and double wrapped.
At the field camp, samples were melted inside the sealed sample bags. pH and electrical conductivity of unfiltered samples were measured immediately after melting. pH was measured with a Ross Sure-flow electrode and Orion 290 A pH meter, using Orion low-ionic-strength buffers of pH 4.10 and 7.01. Prior to analysis, samples were treated with pH ionic-strength adjuster solution. Accuracy is ±0.1 pH units. Electrical conductivity was measured with a Cole Palmer model 1500–32 conductivity meter, calibrated with standards of 1 and 10.4 μS cm−1. Accuracy is ±0.4 μS cm−1. The remainder of each sample was filtered under vacuum through 0.45 μm cellulose nitrate filter papers. Filtration equipment and sample bottles were triple rinsed with sample water before the final sample was collected. Separate 30 mL aliquots were collected for anion (Cl−, NO3 −, SO4 2−) and cation (Na+, K+, Ca2+, Mg2+ and NH4 +) analysis. The latter aliquot was acidified with 0.75 m L 1M methanesulphonic acid.
To determine the seasonal pattern of snow accumulation on the glacier, three automatic weather stations were established at elevations of 250 m (LWS), 850 m (MWS) and 1180 m (UWS) above sea level (Fig. 1). These stations operated continuously from May 1996 to May 2000. Changes in the thickness of the snowpack were monitored daily (at midnight) with a Campbell Scientific Ultrasonic Depth Gauge (UDG) attached to a CR-10 data logger.
Laboratory Analysis
Samples were stored at 4°C prior to analysis. Concentrations of major cations and anions were measured by ion chromatography on a Dionex DX-500 instrument. Detection limits (μeq L−1) were: Cl− = 0.7, NO3 − = 0.3, SO4 2− = 0.5, Na+ = 0.4, NH4 + = 0.6, K+ = 0.25, Mg2+ = 0.75 and Ca2+ = 1.5. For anions, both precision and accuracy were better than ±6% at concentrations of >3 μeq L−1, but > ±10% at lower concentrations. For cations, both precision and accuracy were better than ±8% at concentrations of >2 μeq L−1, but > ±10% at lower concentrations.
Average charge balance errors ((∑+ − ∑−)/(∑+ + ∑−) = +31.8% ± 1 SD of 32.5%) revealed a consistent excess of cations over anions, suggesting that the imbalance was due primarily to the presence of an unanalyzed species rather than to analytical error. There was a strong correlation between the cation excess (∑+ − ∑−; μeqL−1) and the Ca2+ concentration:
(r 2 = 0.84, p < 0.001). This suggests that much of the error is attributable to HCO3 −, which is commonly the counter-ion to the crustally derived fractions of cations such as Ca2+ and Mg2+. Given the magnitude of the imbalance, especially in the more concentrated samples, it is much less likely that this is due to failure to analyze organic anions such as formate or acetate, although this could be a contributory factor. The charge imbalance (∑+ − ∑−) was therefore taken as a measure of the HCO3 − concentration in each sample. We refer to this value as HCO3 * to indicate that it was not measured directly.
For each site sampled, MWW concentrations and deposition fluxes of each species analyzed were determined for the snowpack as a whole and for each of three layers within it. The physical and chemical basis for definition of these layers is outlined below. Deposition fluxes (μeq m−2) were determined as the product of layer thickness (m), layer density (kg m−3) and measured solute concentration (μeq kg−1). Fluxes are expressed in terms of deposition, rather than deposition rate, because of the uncertainty about the period over which the snowpack accumulated. MWW concentrations (μeq kg−1) were determined by dividing the deposition flux of solute associated with a given layer (μeq m−2) by the water accumulation in that layer (kg m−2).
Accumulation Pattern and Physical Stratigraphy of the Snow Cover
Snow temperatures ranged from −3° to −21°C, with the warmest temperatures at the top of the snowpack. There was no evidence of melting prior to sampling. Snow depths ranged from 0.43 to 0.81 m (mean = 0.67 ± 0.11 m), and the mean of all snow density measurements was 240 ± 70 kg m−3. There was a clear correlation (r 2 = 0.60, p = 0.0005; Fig. 2a) between snow accumulation (m snow water equivalent (SWE)) and elevation (m):
The snowpack had a consistent physical stratigraphy that could be traced across the entire glacier (Fig. 2b). A basal layer of coarse-grained depth hoar (containing crystals up to 35 mm in diameter) was overlain by a loose layer of finer- grained (<4 mm) angular crystals, and then by a hard- packed layer of fine-grained (<1 mm), rounded crystals. In some places, a layer of new snow <0.13 m thick, in which original crystal forms could still be recognized, capped the snowpack.
(a) Snow accumulation (m w.e.) as a function of elevation on John Evans Glacier, May 1995. Best-fit linear regression is also shown. (b) Physical stratigraphy of the John Evans Glacier snowpack in May 1995. Snow depth, plotted on the y axis, is given in terms of fractional SWE to facilitate comparison between sites. Here zero represents the base of the snowpack. For description of layer characteristics, see text.

At most sites, the depth-hoar layer was 0.19–0.32 m thick and there was no consistent relationship between thickness and elevation. The overlying loose, fine-grained layer thickened with increasing elevation from 0.08 m at 100 m to 0.32 m at 900 m. It was absent at 1100 m, however, where the hard-packed layer rested directly on the depth hoar. The thickness of the hard-packed layer was consistently around 0.04 m at elevations of <600 m, but it ranged from 0.025 m (at 800 m) to a maximum of 0.16 m (at 1000 m) at higher elevations, where it was generally better developed.
Seasonal Pattern of Snow Accumulation
Snow-thickness measurements from the automatic weather stations were used to characterize the seasonal pattern of snow accumulation. Monthly changes in snowpack thickness were determined from UDG readings for the last day of each month. From the 4 years of record, four values were obtained for each month of the year. These were averaged, and the averages were summed over a 12 month period to generate a mean annual cycle of snowpack thickness change for each site (Fig. 3). To facilitate comparison of the three records, each thickness record was expressed as a fraction of the maximum snowpack thickness calculated for that site.
Synthetic annual cycles of snow thickness at the three weather stations on John Evans Glacier based on 4 years of ultrasonic depth-gauge measurements, May 1996–May 2000. Cycles were generated by summing the mean monthly change in snow thickness at each site. Results are expressed as a fraction of the maximum mean snow thickness recorded at each site.

All three records show two main periods of snow accumulation (in fall and late winter/spring), separated by the summer melt season and by a period of reduced accumulation or snowpack thinning in winter. Most fall accumulation occurs in September and, to a lesser extent, October, but at UWS accumulation also occurs in August. Most spring accumulation occurs in April and May, with some accumulation in March at LWS. During the winter (November-March), changes in snowpack thickness at MWS and UWS are small. At UWS, thinning by a combination of compaction and wind scour occurs throughout the winter. At MWS, there is limited accumulation from October through December, followed by thinning in January and February. At LWS, accumulation continues throughout the winter, but at a lower rate than in fall and spring. Nevertheless, winter snowfall makes a significant contribution to the accumulation at LWS, while this contribution seems to be small at higher elevations. The main melt season occurs in June and July at all stations, but it can continue into August at LWS and, to a much lesser extent, at MWS.
Chemistry of the Snow Cover
Major-ion chemistry
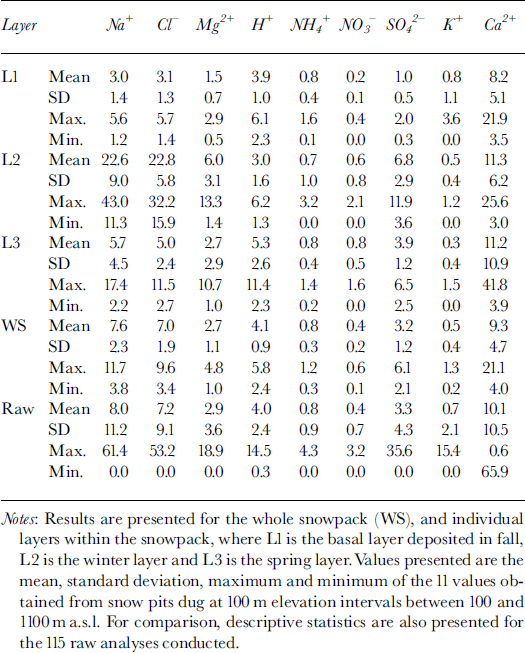
The major ions in the snow were Ca2+, Na+, HCO3* and Cl−. Mean concentrations of K+, Mg2+, NH4 +, H+, NO3 and SO4 2− were typically one to two orders of magnitude lower than mean concentrations of these four major ions (Table 1). However, variability in ion concentrations was large, with standard deviations often >100% of the mean concentration. Minimum measured concentrations of all species were near or below detection limits, while maximum measured concentrations were usually an order of magnitude higher than the mean.
MWW concentrations (μeq L−1) of major ions in snow at John Evans Glacier, May 1995
To elucidate associations between species, a Varimax rotated principal-components analysis (PCA) was performed on the 115 observations of 12 variables. This identified three components with eigenvalues of >1, which explained 67% of the variance in the original dataset.
PC1 had loadings of >0.7 on Na+, Cl−, Mg2+ and SO4 2−, and appears to represent a mixture of sea salt and sulphate aerosol.
PC2 had loadings of >0.9 on Ca2+ and HCO3*, and appears to represent soil dust of predominantly carbonate composition.
PC3 had loadings of >0.7 on H+ and NO3 −, and of 0.39 on SO4 2−, and seems to represent an acid aerosol component that has not been neutralized.
NH4 + and K+ did not load strongly on any of these factors.
Seasonal variations in snow chemistry
The variation in concentration of Na+, Cl−, H+, SO4 2−, NO3 − and Ca2+ with depth in the snowpack is shown for sites at 500 and 1000 m (Fig. 4). These species are plotted, because they characterize the three main components of the solute load identified by PCA. The major features of the records are:
-
(i) A well-defined peak in the concentration of Na+, Cl and SO4 2− at mid-depths within the snowpack splits it into three distinct layers. Below this peak, concentrations of these three species are generally low, though somewhat variable. Above it, they are also low, but more uniform. At 500 m, concentrations in the upper layer are higher than in the basal layer, whereas at 1000 m they are similar to, or lower than, concentrations in the basal layer (Fig. 4a–c and g–i).
-
(ii) H+ displays a sawtooth concentration profile, with highest concentrations at the base of the snowpack and near the surface, separated by a broad minimum at mid-depths. In general terms, the H+ concentration minimum coincides with the peak in concentrations of Na+, Cl− and SO4 2− (Fig. 4d and j), perhaps suggesting that acid sulphate aerosol has been neutralized by reaction with sea-salt aerosol (see Equation (4) below).
-
(iii) NO3 − concentration profiles are erratic, with many samples producing concentrations below the detection limit. At 500 m, a peak in NO3 − concentration at the surface of the snowpack coincides with the upper peak in H+ concentration. At 1000 m, however, the highest levels are associated with the peak in concentrations of Na+, Cl and SO4 2− (Fig. 4e and k). The erratic nature of the NO3 − profiles, and the large number of analyses below detection limit may be evidence of NO3 − loss by remobilization from ageing surface strata that were exposed to the atmosphere for long periods of time without significant fresh snow cover (Reference Wolff and DelmasWolff, 1995). This is most likely to have occurred during the winter at higher elevations on the glacier, where UDG records suggest that snowfall is very limited.
-
(iv) Ca2+ concentrations show a series of peaks superimposed on a relatively high background, but no clear seasonal cycle (Fig. 4f and l).
Plots of the variation in concentration of major ions with depth in the snowpack at sites at 500 m (a–f) and 1000 m (g–l) on John Evans Glacier, May 1995. For site locations, see Figure 1.

Contour maps showing the concentration of individual ionic species as a function of elevation and depth within the snowpack were produced using the software package Surfer 7 (Fig. 5). Maps were also produced for the scores on each of the three leading principal components of the solute load. Raw data were gridded using triangulation and linear interpolation, and the grid was subjected to matrix smoothing prior to contouring. To facilitate comparison between sites, snow depth (plotted on the y axis) is expressed as a fraction of the SWE accumulated at each site at the time of sampling. Values range from 0.0 at the base of the snowpack to 1.0 at the surface.
Contour maps showing the variation in the concentration (μeq L−1) of major ions and in scores for the three leading principal components of the solute load as a function of elevation and fractional water equivalent snow depth, John Evans Glacier, May 1995. On the y axis, 0 represents the base of the snowpack and 1 the snow surface at the time of sampling. Maps of component scores are plotted next to maps of concentrations of ions that load most heavily on that component, but see text for interpretation of components.

The main features identified in the concentration profiles for sites at 500 and 1000 m elevation can be traced across the whole glacier. Maps for Na+, Cl−, Mg2+ and SO4 2− (Fig. 5a-c and e) show a distinct layer with high solute concentrations that occurs progressively deeper in the snowpack at higher elevations on the glacier. This layer clearly splits the snowpack into three distinct horizons, and is also the major feature of the map for PC1 (Fig. 5d). Below it, concentrations of all four species decrease sharply. Above it, Na+, Cl− and Mg2+ show a similarly strong reduction in concentrations, but the drop in SO4 2− concentration is less marked (Fig. 5e). Within the layer underlying the solute-rich layer, concentrations of Na+ and Cl− and scores for PC1 tend to be higher at sites below 500 m elevation. Within the surface layer, however, concentrations of these species tend to be higher at sites above 600 m (Fig. 5a, b and d).
Clear seasonality is also apparent in the maps for H+, NO3 − and PC3 (Fig. 5f-h), which show a well-defined peak in the surface layers of the snowpack. This peak occurs above the layer rich in Na+, Cl−, Mg2+ and SO4 2−. Concentrations of H and NO3 − are very low within the latter layer, but increase again towards the base of the snowpack. Concentrations of SO4 2− remain relatively high within the layer rich in H+ and NO3 −, which likely accounts for the weak loading of PC3 on SO4 2−.
As with concentration profiles for individual sites (Fig. 4f and l), the maps for Ca2+ and PC2 show no clear seasonal variation (Fig. 5i and k). Instead, they depict a series of Ca2+ -rich layers within the snowpack and a clear tendency for Ca2+ concentrations to be higher throughout the thickness of the snowpack at sites above 700 m elevation. Whether the individual layers can be correlated across the glacier is not clear.
Chemical stratigraphy of the snowpack
The concentration profiles and contour maps suggest a simple, three-fold chemo-stratigraphic subdivision of the snowpack. The three layers are readily separated on the basis of the scores for each sample on PC1. Only the intermediate layer has scores of > +0.5 (Fig. 5d).
Layer 1, the basal layer, constitutes progressively less of the snowpack at higher elevations on the glacier. At 100 m it makes up ∼70% of the snowpack water equivalent, but this drops to ∼40% at 900 m. It is characterized by very low MWW concentrations of major ions and moderate acidity (typically 2–7 μeq L−1 of H+).
Layer 2 occurs at mid-depths within the snowpack, and its fractional thickness is relatively uniform. Because the fractional thickness of layer 1 decreases with increasing elevation, layer 2 occurs progressively closer to the base of the snowpack at higher elevations. It is characterized by high MWW concentrations of Na+, Cl−, Mg2+ and SO4 2− (13–40 μeq L−1 of Na+ and Cl−, 3–12 μeq L−1 of SO4 2−) and, except at 100 and 200 m, by low MWW concentrations of H+ (1–6 μeq L−1) and NO3 − (0–2 μeq L−1).
Layer 3 occurs at the top of the snowpack and is proportionally thicker at higher elevations. It is characterized by high MWW concentrations of H+ and NO3 − (up to 11 μeq L−1 of H+and1.6 μeq L−1 of NO3 −), and by intermediate MWW concentrations of SO4 2− (2–12 μeq L−1).
Influence of accumulation and surface elevation on solute concentration
Analyses of spatial variability in snowpack chemistry can shed light on the large-scale controls on atmospheric deposition. Potential controls include glacio-meteorological parameters such as snow accumulation, air temperature and wind speed. Snow accumulation affects the potential for post-depositional remobilization of species such as NO3 −, and the concentration of species deposited by dry deposition. Temperature can affect the efficiency of wet deposition, and the occurrence of riming. This is important because SO4 2− concentrations in rime may be enhanced 5–7 times relative to typical fresh-snow values (Reference BerginBergin and others, 1995). Wind speed determines the extent of reworking of the original depositional stratigraphy, ventilation of the snowpack, the occurrence of scavenging and sublimation from drifting snow, and the mobilization of soil dust from local extra-glacial sources.
Surface elevation may also be an important influence. A surface-based temperature inversion is a characteristic feature of Arctic areas, especially during the polar night (Reference Bradley, Keimig and DiazBradley and others, 1992; Reference Kahl, Serreze and SchnellKahl and others, 1992), and is a major influence on the distribution of pollutants within the lower troposphere (Reference Bridgman, Schnell, Kahl, Herbert and JorangerBridgman and others, 1989). Inversions tend to break down during the passage of frontal systems that bring precipitation to the High Arctic, and inversion thickness and frequency tend to decrease in the period April-September (Reference Bradley, Keimig and DiazBradley and others, 1992; Reference Kahl, Serreze and SchnellKahl and others, 1992). This may result in both seasonal and shorter-term changes in the concentration and composition of the aerosol in the atmosphere overlying the glacier.
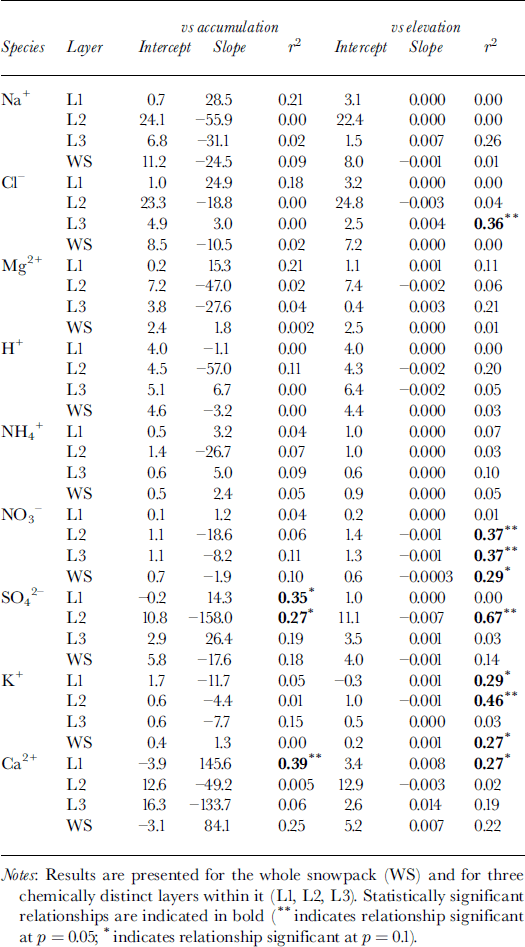
To evaluate the potential impact of such controls on the chemistry of the snowpack, the relationships between MWW solute concentration, accumulation and surface elevation were investigated. Although total SWE increases systematically with increasing elevation (Fig. 2a), the bulk of this variation occurs within layer 3. Linear regression indicates that, both in the snowpack as a whole and in its three constituent layers, the MWW concentration of almost all species is independent of the accumulation rate (Table 2). Exceptions to this are SO4 2−, for which solute concentration is inversely related to the accumulation rate in layer 2 and positively correlated with it in layer 1, and Ca2+, for which solute concentration and accumulation rate are positively correlated in layer 1 and probably also in the whole snowpack.
Results of linear regression of the MWW concentration of major ions (μeq L−1) on snow accumulation (m w.e.) and elevation (m) for 11 sites on John Evans Glacier, May 1995
A simple model, proposed by Reference Fischer and WagenbachFischer and Wagenbach (1996), was used to analyze these relationships between MWW solute concentration and accumulation:
Here C s is the solute concentration in snow, C P is the concentration in precipitation, C a is the concentration in air, Cr is the concentration in rime, V d is the dry-deposition velocity, A is the snow-accumulation rate, and ΔA is the surface rime-accumulation rate.
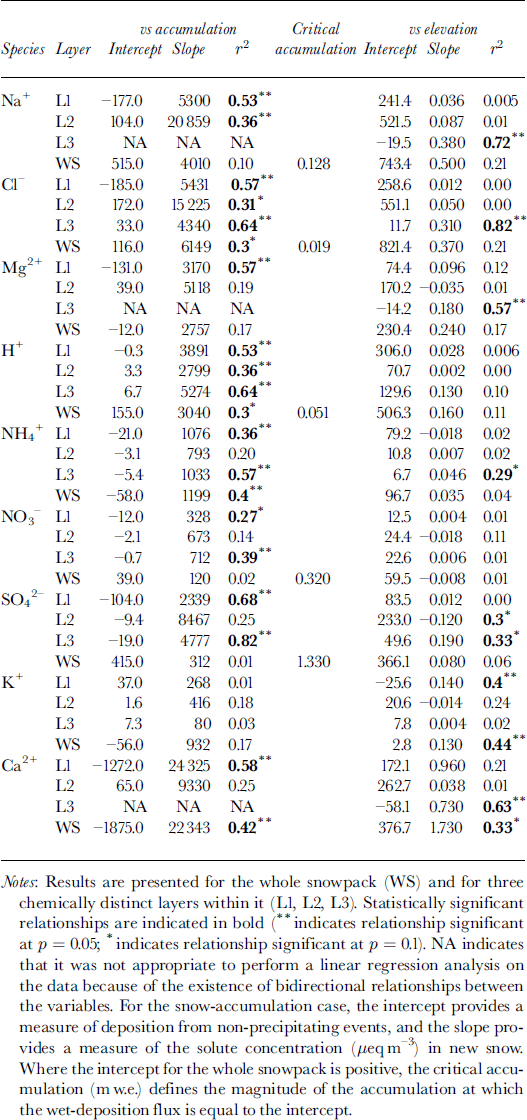
To make use of this model, it is first necessary to determine whether non-precipitating events (e.g. dry deposition or riming) contribute significantly to solute deposition. Reference Fischer and WagenbachFischer and Wagenbach (1996) suggested that the contribution of these processes to solute deposition could be defined by the intercept of a linear regression of the deposition flux of a given solute species on the snow-accumulation rate (Table 3). For the whole snowpack, positive intercepts were found for Na+, Cl−, H+, SO4 2− and NO3 −.This suggests that dry deposition and/or riming may contribute to the deposition of these species. For other species, wet deposition likely dominates solute deposition on the glacier. For species with positive intercepts, the regression relationships listed in Table 3 were used to estimate the critical accumulation rate, at which wet deposition and deposition from non-precipitating events are equal. For H+ and Cl−, values of critical accumulation were substantially less than ambient accumulation rates (∼0.15 m), indicating that deposition by non-precipitating events is relatively minor. For Na+, however, the two values were similar, and for SO4 − and NO3 − the critical accumulation rate was higher than ambient accumulation rates. Thus, deposition by non-precipitating events is probably significant for SO4 2−, NO3 − and Na+.
Results of linear regression of the atmospheric deposition of major ions (μeq m−2) on snow accumulation (m w.e.) and elevation (m) for 11 sites on John Evans Glacier, May 1995
According to the model presented above, the inverse relationship between MWW SO4 2− concentration and accumulation in layer 2 is most simply explained as a product of dilution of spatially uniform deposition by non-precipitating events by spatially variable accumulation. Given that deposition by non-precipitating events also seems to be significant for Na+ and NO3 −, however, the MWW concentration of these species should also be inversely related to the accumulation rate. This is in fact the case for layers 2 and 3, and for the whole snowpack, but none of the relationships are statistically significant (Table 2).
For those species for which the regression intercepts are negative, wet deposition is apparently the dominant deposition process, and for most of these species there is no significant correlation between MWW solute concentrations and the accumulation rate. According to Equation (3), this implies that, for these species, C p is essentially uniform across the glacier. For Ca2+ in layer 1, however, the MWW solute concentration increases with the accumulation rate. This suggests that, for this species, either C p varies positively with snow accumulation, or deposition from non-precipitating events is significant only in areas of high accumulation. Concentrations of Ca2+ are clearly much higher at sites above 800 m elevation than at sites lower on the glacier (Fig. 5), suggesting that this pattern may be explained by localized dry deposition of soil dust at high elevations, where wind speeds are relatively high. This would be maximized in the fall, when local rock surfaces are not yet fully covered by snow.
Since accumulation and elevation are positively correlated, relationships between the MWW concentrations of most species and elevation are similar to those between concentration and accumulation (Table 2). However, there are significant inverse relationships between the concentration of NO3 − and elevation in layers 2 and 3 and in the whole snowpack. As discussed above, this is probably due to dilution of nitrate deposited by dry deposition and/or riming by snowfall that increases with elevation (note that nitrate deposition is independent of elevation in these layers; Table 3). There are also significant positive relationships between K+ and elevation for layer 1 and the whole snowpack, and a significant inverse relationship for layer 2. For layer 1 and the whole snowpack, these relationships are best explained as the result of localized inputs of soil dust at high elevations in the fall, when potential source areas are not yet fully snow-covered. For layer 2, the inverse relationship reflects variable dilution of a more uniform dust deposition (Table 3) within a snow layer that thickens as elevation increases. Finally, there is a significant positive correlation between the concentration of Cl− and elevation in layer 3. This is a result of unusually high Cl− concentrations in snow at the sample sites at 800 and 1000 m elevation, which result in very high Cl− deposition at these elevations (Table 3).
Influence of snow accumulation and elevation on atmospheric deposition to the snowpack
Atmospheric deposition of almost all species tends to increase with snow accumulation (Table 3). In the snowpack as a whole, this tendency is statistically significant for species for which wet deposition dominates (H+, NH4 + and Cl−) and for Ca2+, for which locally high rates of deposition from non-precipitating events may occur at high elevations where accumulation is also high. It is not significant for those species for which deposition from non-precipitating events is believed to be significant at all elevations (Na+, NO3 − and SO4 2−) (Table 3). However, statistically significant relationships do exist for these species (and Mg2+) within individual layers. In general, these results indicate that wet deposition is an important means of deposition of most species to the snow- pack throughout the accumulation period. In layer 2, however, deposition of SO4 2− and NO3 − is independent of the accumulation rate, consistent with the suggestion that deposition by non-precipitating events may be important for these species in winter (Table 3).
Although accumulation increases with elevation, Ca2+ and K+ are the only species for which deposition is positively related to elevation in the snowpack as a whole. This seems to reflect localized inputs of soil dust at high elevations. Within layer 3, which thickens rapidly with increasing elevation, however, deposition of Na+, Cl−, Mg2+, NH4 +, SO4 2− and Ca2+ is significantly positively correlated with elevation, presumably because wet deposition of these species increases with accumulation in late winter and spring.
Comparisons between seasonal trends in snow chemistry and air chemistry at Alert
The consistent glacier-wide chemical stratigraphy of the snowpack likely reflects a seasonal cycle in the chemistry of the atmosphere overlying the glacier. Although there are no local measurements of aerosol chemistry, measurements have been made continuously since 1980 at Alert (82.5° N, 62.3° W) on the northern tip of Ellesmere Island (Reference Sirois and BarrieSirois and Barrie, 1999). These measurements define the seasonal variation in weekly concentrations of individual aerosol constituents, and of aerosol components derived by positive matrix factorization (Reference NormanNorman and others, 1999; Reference Sirois and BarrieSirois and Barrie, 1999). They can therefore be used to assist interpretation of the seasonal cycle in snowpack chemistry at John Evans Glacier.
SO4 2−, NO3 −, H+, NH4 +, K+, Na+ and Cl− show a distinct seasonal cycle in atmospheric concentration, while Ca2+ does not. For Mg2+, the cycle is rather weak (Reference Sirois and BarrieSirois and Barrie, 1999). However, the form and timing of the concentration peaks and intervening troughs vary between species. Chloride peaks in January, while Na+ displays a broad peak from January through March. Sulphate, H+ and NH4 + peak in late March and April, while NO3 − and K+ have broad peaks lasting from January through April or May. All these species reach minimum concentrations in the atmosphere during the summer months (June–September), though for Cl− the seasonal minimum begins as early as April or May. These seasonal cycles result from a sharp seasonal variation in the atmospheric residence time of aerosols, which is on the order of 3–7 weeks in winter and 3–7 days in summer. This variation results from seasonal changes in atmospheric circulation and in the efficiency with which precipitation removes aerosols from the atmosphere (Reference BarrieBarrie, 1986; Reference Sirois and BarrieSirois and Barrie, 1999).
By combining knowledge of the seasonal variation in aerosol chemistry at Alert and of the seasonal pattern ofsnow accumulation on the glacier, it is possible to offer an interpretation of the chemical stratigraphy of the snowpack at John Evans Glacier. The fall accumulation period occurs from August through October, when atmospheric concentrations of most aerosol constituents are at their seasonal minimum. It thus seems likely that layer 1, which occurs at the base of the snowpack and which contains very low concentrations of most solute species, represents snow that accumulated during the fall. Especially at higher elevations, this layer does contain significant amounts of Ca2+, which is probably associated with soil-derived dust. This is consistent with the observation that atmospheric Ca2+ concentrations at Alert show minimal seasonal variation, with perhaps a weak peak associated with locally derived dust in September/October when extra-glacial surfaces are not yet fully snow-covered (Reference Sirois and BarrieSirois and Barrie, 1999).
Layer 2 is characterized by high concentrations of Na+, Cl−, Mg2+ and SO4 2−, all of which reach peak atmospheric concentrations during the period January-April. However, aerosol Cl− peaks earlier and more sharply than the other species, and its atmospheric concentration falls from January onwards (Reference Sirois and BarrieSirois and Barrie, 1999). In the snowpack too, the Cl− concentration peak is narrower than the Na+ and SO4 2− peaks, and it tends to be located at the base of layer 2, while the peaks for the other species are often displaced towards the top of the layer (Fig. 5a, b and e). The similarity between the seasonal patterns of variation in the concentration of these species in the atmosphere and the snowpack strongly suggests that layer 2 represents snow accumulated during the winter and early spring, probably up until about early April.
Layer 3 is distinctly more acid than layer 2 and it is characterized by peaks in the concentration of H+ and NO3 −, and by relatively high levels of SO4 2− and low concentrations of Na+ and Cl−. This change in snowpack chemistry is consistent with interpretations of changes in the provenance of SO4 2− in the atmospheric aerosol between late winter and spring (Reference NormanNorman and others, 1999). In February and March, 60–90% of the SO4 2− is associated with aerosol components designated as sea salt, mixed photo-S/sea salt, and anthropogenic S. By mid-April, these components account for only about 20% of the atmospheric SO4 2−, most of which is then associated with an aerosol component designated as photo-S (Reference NormanNorman and others, 1999; Reference Sirois and BarrieSirois and Barrie, 1999).
Photo-S is predominantly sulphuric acid formed by in situ gas-to-particle conversion of anthropogenic SO2 − at polar sunrise. It peaks in April. Anthro-S consists of non- acidic salts of SO4 2−, with NH4 + as the dominant cation. It peaks from January to March. Mixed photo-S/sea salt consists of non-acidic SO4 2−, with Na+, Mg2+ and NH4 + as the dominant cations (Reference Sirois and BarrieSirois and Barrie, 1999).The lack of Cl− in this component likely results from reactions between sulphuric acid and sea salt that displace H+ and Cl− as HCl gas (Reference Brimblecombe and CleggBrimblecombe and Clegg, 1988):
The mixed photo-S/sea-salt component has a broad seasonal peak that reflects the variation in the photo-S and sea- salt components of the aerosol. The sea-salt component that is unmodified by Reaction (4) peaks from December to February (Reference Sirois and BarrieSirois and Barrie, 1999). It seems likely that Reaction (4) explains the association between SO4 2− and sea-salt species in layer 2 of the snowpack, and the generally low concentrations of H+ in that layer.
Comparison of the chemistry of layer 2 with the aerosol chemistry at Alert is consistent with its containing SO4 2−derived from a mixture of sources including the sea-salt, anthro-S and mixed photo-S/sea-salt components of the atmospheric aerosol. This would suggest that layer 2 was deposited between December and March. By contrast, the chemistry of layer 3 suggests that photo-S is likely the dominant source of SO4 2− in this layer, and that it was therefore deposited in April and May. If these inferences about the timing of layer deposition are correct, the difference in NO3 − concentrations between layers 2 and 3 is not readily explained in terms of the seasonal cycle in the composition of the atmospheric aerosol at Alert, because NO3 − is present in the atmosphere throughout the winter. Instead it seems more likely to be due to differences in the extent of post- depositional remobilization of NO3 − from the snowpack. This is likely to be enhanced in winter, when accumulation rates are low and snow surfaces may be exposed to the atmosphere for prolonged periods of time (Reference Wolff and DelmasWolff, 1995). High concentrations of NO3 − in surface snow may thus reflect both the recent occurrence of deposition and higher rates of accumulation that limit the duration of surface exposure to the atmosphere.
Interpretation of the physico-chemical stratigraphy of the snowpack
Comparison of the physical (Fig. 2b) and chemical stratigraphy of the snowpack (layers 1–3; Fig. 5) suggests that the two are closely associated. To a first approximation, layer 1 is coincident with the depth-hoar layer, layer 2 with the loose, fine-grained layer, and layer 3 with the hard-packed layer and overlying fresh snow. However, there are exceptions to this generalization. For instance, at 100 and 200 m, the boundary between layers 1 and 2 follows the top of the loose, fine-grained layer, while above 700 m it occurs within the lower part of this layer. While at most sites the boundary between layers 2 and 3 lies near or at the top of the loose, fine-grained layer, at 100 and 200 m it coincides with the top of the hard-packed layer, making layer 2 coincident with the hard-packed layer. At 1000 m, it lies within the hard- packed layer.
Given the chemistry of the depth-hoar layer and its occurrence at the base of the snowpack, it almost certainly represents initially coarse-grained snow that fell during the fall accumulation period. This snow would then have experienced temperature-gradient metamorphism during the intense and prolonged cold of the polar night (when air temperatures on the glacier drop to −40°C or lower). However, one problem with this interpretation is that whilst the fractional thickness of the depth-hoar layer decreases with increasing elevation, the UDG results suggest that the relative importance of fall accumulation is greater at higher elevations. For example, the snowpack thickness at the end of September represents 35% of the maximum thickness at the LWS, 47% at the MWS and 61% at the UWS (Fig. 3). By contrast, the depth hoar represents 50% of the water equivalent thickness at 100 m elevation and only 23% at 1000 m (Fig. 2b). This apparent inconsistency can be explained if the upper part of the fall snow accumulation was extensively reworked by the wind during the winter months and incorporated into the overlying loose, fine-grained layer. The observation that the upper boundary of layer 1 is sometimes located within or at the top of the loose, fine-grained layer strongly suggests that snow with a chemistry typical of the depth-hoar layer has been incorporated into the base of the loose, fine-grained layer.
This implies that the loose, fine-grained layer is likely a mixture of snow that fell during the winter months and snow that was reworked by wind from the underlying depth-hoar layer. Both the fractional thinning of the depth-hoar layer at higher elevations and the UDG measurements (which show thinning of the snowpack over winter at the upper and middle weather stations) suggest that the input from wind reworking was likely maximized at these elevations.
The hard-packed layer normally occurs entirely within layer 3. However, at 100 and 200 m it is found entirely within layer 2. This likely reflects the incorporation of solute-rich snow from layer 2 into the hard-packed layer by wind reworking. Layer 3 and the hard-packed layer plus overlying new snow show elevation-dependent patterns of thickness variation similar to the spring snow accumulation measured by UDG. The fractional change in snowpack thickness between the end of March and the end of May is 15% of the annual maximum thickness at LWS, 54% at MWS and 40% at UWS. At elevations of 200–400 m, the hard-packed layer plus new snow represents 8–16% of the snowpack water equivalent. Above 700 m, it represents 20–36%. Layer 3 constitutes 11% of the snowpack water equivalent at 100 m, but as much as 40% at 700 and 900 m. This supports the idea that these layers represent predominantly spring snowfall that, at some sites, has been mixed by the wind with snow from the underlying loose, fine-grained layer. The hard-packed nature of the layer may result from wind packing and/or radiation-induced metamorphism following polar sunrise (which occurs in mid-March at this site).
Conclusions
The John Evans Glacier snowpack has a tripartite physical structure that can be traced across the entire glacier, and that is closely matched by a tripartite chemical stratigraphy. A basal layer of solute-poor depth hoar represents snow that accumulated in the fall and resisted wind reworking in the winter. It is overlain by a layer of loose, fine-grained snow that contains relatively high concentrations of solute species derived from the sea-salt, anthro-S and mixed photo-S/sea- salt components of the atmospheric aerosol. Nitrate concentrations in this layer are generally low, probably due to the effects of post-depositional remobilization. This layer is interpreted to be a mixture of winter snowfall and snow reworked by wind from the underlying depth hoar. The wind contribution is likely greatest at higher elevations on the glacier.
A hard-packed layer that is overlain by new snow caps the snowpack. It contains relatively high concentrations of H+ and SO4 2−, probably derived from the photo-S component of the atmospheric aerosol that is produced by gas-particle conversion of SO2 to sulphuric acid after polar sunrise. It thus represents the spring accumulation on the glacier. It also contains high concentrations of NO3 −, probably because the young age of the snow and enhanced rates of accumulation in spring reduce the extent of post-depositional remobilization relative to the winter layer.
For most solute species, atmospheric deposition increases with snow accumulation, and solute concentration is largely independent of accumulation and elevation. For these species, deposition occurs primarily by wet deposition. Exceptions to this pattern include Ca2+ and K+, for which there is evidence for locally high inputs from dry deposition of soil dust at higher elevations where wind speeds are probably higher than lower on the glacier. These inputs are most marked in the fall, when local source areas are still not fully snow-covered. Concentrations of SO4 2− are inversely associated with accumulation, implying a significant input from non-precipitating events (such as dry deposition and riming) that is differentially diluted by snow accumulation. This behaviour is most marked in the winter layer of the snowpack. Non-precipitating events may also contribute significantly to the deposition of NO3 −, but concentrations of this species are not inversely related to accumulation. This may be a result of post-depositional remobilization from the snow surface, the extent of which is inversely related to the accumulation rate. For SO4 2− and NO3 −, rates of deposition to the snowpack as a whole are independent of the rate of snow accumulation, largely because of the importance of deposition from nonprecipitating events in winter.
Acknowledgements
Supported by the Natural Sciences and Engineering Research Council of Canada, the University of Alberta Central Research Fund, and a C-BAR grant to Skidmore. Logistic support was provided by Polar Continental Shelf Project, Natural Resources Canada (PCSP/EPCP Contribution 02997). Research permission was kindly granted by the Nunavut Research Institute and by the peoples of Grise Fjord and Resolute Bay. J. Woodward and the late P. M. Wolfe, to whose memory this paper is dedicated, provided field assistance. A. Arendt established the weather stations on the glacier. We thank M. Tranter, R. M. Koerner, D. Wagenbach and an anonymous referee for comments on an earlier draft, and M. A. Lange for his editorial work on the paper.


