

INTRODUCTION
Rubella is a directly transmitted childhood infection that induces lifelong immunity. Infection in children is rarely severe. However, maternal rubella infection during the first trimester of pregnancy can lead to infection of the fetus, causing hearing impairment, cataracts and congenital heart disease which form the classical triad of congenital rubella syndrome (CRS) [Reference Gregg1]. Other manifestations can include microcephaly, low birth weight, and mental retardation. Consequently, those with CRS often require lifelong care. Thus in high- and middle-income countries, economic benefits from elimination of CRS are estimated to be high [Reference Hinman2].
Rubella vaccine has been licensed for nearly 50 years, is highly efficacious and available as combined measles-rubella (MR) or measles-mumps-rubella (MMR) vaccine. However, the challenge of preventing CRS by rubella-containing vaccine (RCV) is complex, because feedbacks between incidence and rate of infection mean that routine infant vaccination (‘universal vaccination’) will tend to increase the average age of infection, although if vaccine coverage is high enough, the age-specific incidence of rubella decreases at all ages [3]. Thus, an intervention that is not implemented optimally may actually worsen the situation.
Epidemiological models are useful tools for assessing the risks and benefits of immunization [Reference Anderson and May4]. Because of the complexity of serious disease risk as a function of age and nonlinear epidemic dynamics, there is a long history of modelling rubella vaccination, especially in high-income, low birth-rate contexts [Reference Anderson and May5–Reference van der Heilden8]. However, these analyses do not consider a range of factors known to strongly impact nonlinear epidemic dynamics. Specifically, we do not know how a wider range of birth rates (which can strongly affect periodicity of immunizing infections [Reference Bjørnstad, Finkenstadt and Grenfell9]) will affect the relationship between infection and disease risk in rubella. Further, the impact of seasonal forcing of infection, spatial dynamics and demographic stochasticity (all of which can be profound for infections in general and rubella in particular [Reference Keeling, Rohani and Grenfell10, Reference Bauch and Earn11]) have not been considered.
Current proposals to roll out rubella vaccination globally require us to address these dynamical gaps, and explore rubella infection and disease dynamics across a range of contexts that are globally representative. Here, we explore minimum coverage required to prevent a CRS increase after introduction of universal rubella vaccination, rooting our analysis in the current public health context, and ranging over the plausible extent of demographic contexts and remaining uncertainties in rubella transmission. The results of this analysis are also more generally relevant to any infection with a complex relationship between infection and disease risk as a function of age.
To prevent CRS, two approaches have been used. The first aims to provide direct protection to women before they reach childbearing age by selectively vaccinating girls and young women [Reference Anderson and May5, Reference Knox12]. This approach has little effect on population-wide rubella transmission and has been recommended by WHO for countries aiming to reduce CRS incidence only [13, 14]. The second approach aims to reduce or eliminate rubella transmission by universal vaccination of male and female infants and young children, sometimes combined with supplementary catch-up campaigns in older age groups [3, 14]. Previous mathematical models indicate that if vaccination of infants and young children is to be the sole strategy, coverage of at least around 80% is required [Reference Anderson and May5, Reference Gay7, Reference van der Heilden8] to avoid a potential increase in the burden of CRS [Reference Anderson and May5, Reference Knox12, Reference Vynnycky, Gay and Cutts15] and this is the recommendation of WHO [3, 13, 14]. With sufficient immunization, control of rubella without increased CRS does appear to be tractable: the region of the Americas has sustained high infant RCV coverage and conducted mass campaigns of adolescents and adults, and reported elimination of endemic rubella transmission in 2010 [3]. However, it is not clear, that these targets can be met in all countries: in 2009, WHO-UNICEF estimates for global routine measles vaccine coverage of infants and young children were 82%, with just 69% for the African region (http://apps.who.int/immunization_monitoring/en/globalsummary/timeseries/tswucoveragedtp3.htm; accessed 23 December 2010; note some countries in each region have attained the goal). Mass measles campaigns, known as supplementary immunization activities (SIAs), are regularly conducted in high measles-mortality countries and many countries with elimination goals [16], and will partly compensate for lower routine coverage. However, there are concerns that there is inadequate funding to support follow-up SIAs [16]. How the presence and absence of these varied types of measles immunization activities affect the safe minimum level of added rubella vaccination is a focus of our investigation (note that while rubella elimination may be a key long-term goal, this was not addressed here).
We focus our analyses on low-income countries, where rubella vaccination is rare [3] but estimates of CRS incidence (up to 246/100 000 live births in Africa [Reference Cutts and Vynnycky17]) suggest high rewards of a successful vaccination programme. Modelling has so far focused mainly on high-income countries (e.g. [Reference Anderson and May5, Reference van der Heilden8], although see [Reference Vynnycky, Gay and Cutts15]), but several factors suggest that patterns may differ in low-income contexts [Reference Vynnycky, Gay and Cutts15]. First, higher birth rates will entail a lower average age of infection in the absence of vaccination. Second, rubella transmission intensity may be greater (estimates of the basic reproduction number, R 0, or the number of secondary infectious persons caused by a single infectious individual in a completely susceptible population range from 6·9 to 11·8 in Addis Ababa, Ethiopia [Reference Cutts18] compared to 2·4–7·8 in Europe [Reference Edmunds6, Reference Farrington, Kanaan and Gay19]). This will decrease the average age of infection and make it more difficult to interrupt transmission. Third, vaccination coverage may be more heterogeneous in low-income countries due to isolation of communities or inequitable access to care (including access to private sector vaccination [Reference Vynnycky, Gay and Cutts15]). Evidence suggests that rubella has a large critical community size or population size above which stochastic extinction does not occur [Reference Rios-Doria and Chowell20, Reference Metcalf21], and this may combine with spatially heterogeneous vaccination uptake to allow build-up of susceptible individuals, altering CRS burdens in ways not yet explored [Reference Metcalf22]. Fourth, seasonality in transmission is little known for rubella (see [Reference Metcalf21, Reference Metcalf22]), but is high in some low-income countries for measles, another directly transmitted airborne childhood infection. Large seasonal fluctuations in transmission can affect dynamics [Reference Ferrari23] and incidence over age [Reference Ferrari24], warranting attention in the context of CRS. Relatively low-amplitude seasonality might also matter, since rubella is thought to have lower transmission than measles, which might lead to multi-annual dynamics via an interaction between seasonality and transient dynamics due to demographic stochasticity [Reference Bauch and Earn11, Reference Metcalf21]. Finally, the age pattern of transmission may differ from industrialized countries, particularly as transmission in industrialized countries is shaped by school terms [Reference Bjørnstad, Finkenstadt and Grenfell9], whereas school-attendance may be lower in low-income countries.
We developed a strategic model to explore CRS dynamics after introduction of vaccination across globally representative scenarios, specifically asking: (i) when is 80% vaccine coverage of infants and young children sufficient to prevent increases in CRS incidence, and how sensitive is this to R 0, seasonality, and birth rate? (ii) how is this 80% requirement altered by the addition of typical measles control immunization strategies [regular SIA (‘follow-up’) campaigns or a starting (‘catch-up’) campaign], or vaccination of women of childbearing age? and (iii) how will stochastic dynamics affect these conclusions, and what spatial scenarios are of particular concern?
MATERIALS AND METHODS
We developed an age-structured model to quantify the effects of rubella vaccination in settings with different birth rates, basic reproduction numbers, and magnitudes of seasonal variation in transmission. The key element of the model is a matrix that at every time-step defines transition from every possible epidemiological stage (e.g. infected, susceptible, recovered) and age combination to every other epidemiological stage and age combination, following methods developed previously [Reference Klepac and Caswell25–Reference Metcalf27]. The population was stratified into 80 age groups (monthly strata up to age 4 years; yearly thereafter). We assumed that mortality was constant over age (i.e. a type II pattern, similar to that in many developing countries; altering this does not affect our qualitative results), and that the probability of survival at each age was such that the population size was constant over time (at 750 000, similar to that of Niamey, Niger) given the chosen birth rate. Each age stratum was subdivided into epidemiological groups [‘maternally immune’ M (relevant only for the first few age groups); ‘susceptible’ S; ‘infected’ I; ‘recovered’ R; and ‘vaccinated’ V; taken to indicate successful vaccination] [Reference Klepac and Caswell25]. The time-step of the model was set to approximate the generation time for rubella [Reference Bjørnstad, Finkenstadt and Grenfell9] at 2 weeks, i.e. there are 24 infection generations per year (see Supplementary Information S1, available online). We assumed constant rates of movement between age strata, i.e. for age stratum a, the rate of ageing into the next age stratum is u a = 1/[(length of age group a in years) × 24]; u could also be set to capture a situation of cohort ageing [Reference Vynnycky, Gay and Cutts15, Reference Schenzle28], but given the absence of evidence for term-time forcing in many contexts of interest [Reference Ferrari23], we retained the simpler formulation. Maternal immunity for rubella is estimated to last 3–9 months [Reference Anderson and May5, Reference Cutts18]; accordingly, we modelled the probability of remaining in the maternal immunity group over age as an exponential decay function with a constant rate of 0·95 per month (Fig. S1a). The magnitude of R 0 combined with the population size N sets the intensity of transmission with  $R_{\setnum{0}} \equals \bar{\beta }N$, where $\bar{\beta }$ is average transmission. To explore seasonal forcing effects, the intensity of transmission was varied over the year by setting $\beta _{t} \equals \bar{\beta } \lpar 1 \plus \alpha \cos \lpar 2\pi t\sol 24\rpar \rpar $ for each time step t (Fig. S1b); α reflects the factor by which the peak and lowest value of R 0 differ from the average, and t is divided by 24, as there are 24 discrete time-steps in a year. We assumed here that seasonality affects all age groups in the same way. The probability of becoming infected is defined as
 $$\phi_{a} \lpar {\bf n}\lpar t\rpar \rpar \equals 1 \minus \exp \left[ { \minus \sum\nolimits_{j} {\beta _{a\comma j\comma t} I_{j\comma t}^{\gamma } } } \right] \comma \hfill$$
where βa,j,t is the rate of transmission between individuals in age groups a and j at time t, and γ captures heterogeneities in mixing not directly modelled [Reference Bjørnstad, Finkenstadt and Grenfell9, Reference Finkenstadt and Grenfell29] and the effects of discretization of the underlying continuous time process [Reference Glass, Xia and Grenfell30]. The probability of becoming infected can be used for both deterministic and stochastic simulations (see Supplementary Information S1 for details). Figure S2 illustrates resulting deterministic dynamics, as well as sensitivity to the chosen generation time. Supplementary Information S2 and Figure S3 provide model validation. To realistically capture routine infant and young child vaccination, we parameterized our model to reflect access to measles vaccination in Zambia (Fig. S1c) according to Lessler et al. [Reference Lessler31]. Different levels of coverage were modelled by scaling this estimated density of vaccination over age such that total coverage achieved at age 3 years reflected the desired levels of coverage. Through interference from maternal antibodies successful vaccination is less common in the very young, hence, we further multiplied the probability of receiving vaccination by an age-specific probability of vaccination success (Fig. S1d) parameterized from Boulianne et al. [Reference Boulianne32]; their results indicate that vaccine efficacy maximally attains 0·97. We modelled vaccination of women of childbearing age assuming that access to vaccination increased gradually from age 15 years (Fig. S1e) and that coverage attained was equivalent to half the coverage attained in the routine infant and young children vaccination part of the programme, scaling appropriately, as above. There is little information from which to parameterize this part of the model, as currently routine vaccination of women, other than tetanus toxoid vaccination of pregnant women, is rare in low-income countries. For both types of vaccination, continuous probability distribution functions were converted to bi-weekly transition probabilities by the appropriate integration. We modelled starting vaccination campaigns and SIAs as campaigns lasting 2 weeks, and accessing a high proportion of the targeted age range (90%), regardless of the degree of coverage attained by routine vaccination, i.e. SIA vaccination uptake being assumed to be independent of routine vaccination uptake.
We set transmission to be constant over age. Since there is evidence that the force of infection is lower in adults than in children in both high- [Reference Grenfell and Anderson33] and low-income [Reference Ferrari24] contexts, the assumption that transmission does not vary with age leads to an overestimate in the average age of infection, and the burden of CRS. Overall, given both paucity of information, and issues of numerical tractability, the model necessarily makes a number of assumptions. These are addressed in detail in the Discussion.
Exploring different vaccination strategies
We considered the outcome of different immunization strategies set to reflect current measles immunization activities including (i) universal vaccination of infants and young children only (a method that would rarely be used alone, but serves as a baseline to be combined with other strategies); (ii) universal vaccination of infants and young children and regular SIAs (‘follow-up campaigns’) targeting all children aged between 1 and 4 at 4-year intervals, starting in the fourth year after initiation of vaccination; (iii) universal vaccination of infants and young children, regular SIAs of 1- to 4-year-olds, and a starting (‘catch-up’) campaign in the first year of vaccination targeting 1- to 4-year-olds; (iv) the same, but with the starting campaign targeting 1- to 14-year-olds; and (v) the same, but with additionally a campaign targeting women of childbearing age. For the latter, we expanded the model to incorporate both sexes to allow for vaccination of women only (see Supplementary Information S1). For all immunization strategies, pre-vaccination equilibrium numbers of individuals in each epidemiological and age stratum were identified numerically, and the chosen immunization strategy was implemented into a population defined by this structure.
To calculate the CRS burden, we used a pattern of fertility over age to define the risk group, i.e. pregnant women in the first 16 weeks of pregnancy (Fig. S1f, set to reflect fertility in Niger) and assumed that the probability of CRS following infection during the first 16 weeks is c = 0·65 [Reference Vynnycky, Gay and Cutts15]. Combining this value, c, with the numerically estimated cumulative risk of infection over the past 16 weeks, denoted Φt, with fertility in each age group, f a, we used our model output to calculate the number of CRS cases expected in the presence or absence of vaccination at each time-step. Their ratio defines the risk ratio [Reference Anderson and May5]; values >1 indicate more cases in the presence than in the absence of vaccination. The exact temporal pattern of the risk ratio will depend on the balance of different key epidemiological drivers (demography, seasonality, coverage). We assessed these effects taking yearly values of the risk ratio following the start of vaccination, i.e.
 $$\rho _{y} \equals {{\sum\limits_{t \in y} {\sum\nolimits_{a} {c\rmPhi _{t}{\hskip1pt} f_{a} S_{a\comma t}^{\ast } } } } \over {\sum\limits_{t \in y} {\sum\nolimits_{a} {c\rmPhi _{t} {\hskip1pt}f_{a} S_{a\comma t} } } }} \comma \hfill$$
where * indicates the situation where the population has been vaccinated. We also tracked predicted CRS incidence (Supplementary Information S1).
The range of demographic and epidemiological contexts
We explored outcomes for birth rates ranging from 12/1000 per year (e.g. European countries, China) to 50/1000 per year (Niger, at the upper end of the scale; many African countries have lower birth rates); and for R 0 = 6 (the average reported for rubella in Europe), R 0 = 8 (at the high end of the scale reported for Europe) and R 0 = 12 (reflecting the high end of the scale for estimates in Africa and Mexico [Reference Cutts18, Reference Metcalf21]). For seasonality, we explored results across a range of α from 0 (no seasonality) to 0·6 (high, as estimated in Niger for measles [Reference Ferrari23]).
RESULTS
CRS burden in a deterministic setting
Changes through time of the relative CRS burden
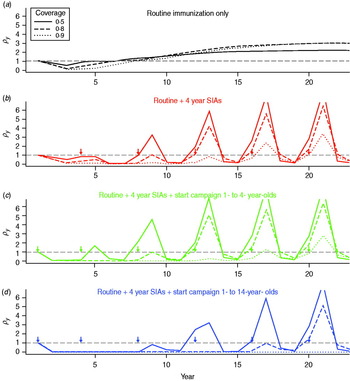
For each vaccination strategy, we projected the population forwards through time according to demographic and epidemiological transitions, calculated the number of CRS cases expected with or without vaccination, and took their yearly ratios for different coverage levels. For all immunization strategies, first, the relative burden of CRS decreases. Then, if coverage is low and SIAs are not undertaken, the relative burden can rise, potentially reaching values >1 (Fig. 1a); i.e. more CRS cases occurring in that particular year than would have in the absence of vaccination. Implementing regular SIAs leads to sporadic increases in the average age of infection (by immunizing young individuals) leading to spikes in the relative burden (Fig. 1b–d); but, overall, for equivalent routine coverage, implementing SIAs results in fewer years where the relative burden is >1, via more effective control of the infection. Outcomes depend on birth rate and magnitude of R 0: for lower levels of R 0 or birth rate, low vaccination coverage levels can maintain the relative burden at <1 even without SIAs (Fig. S4). Results are not sensitive to the exact pattern of routine immunization.
Dynamics of the relative congenital rubella syndrome (CRS) burden for R 0 = 12, and 40 births/1000 per year for three different levels of routine vaccination coverage (see key) for four different immunization strategies (arrows indicate timing of SIAs, or starting campaigns). The x-axis shows time in years, and the y-axis indicates ρy, the ratio of yearly summed CRS cases in the presence and absence of vaccination. (b–d) Lines corresponding to coverage higher than 50% lie close to the bottom of the plot where ρy = 0.
Long-term effects of vaccination on CRS burden
Next we estimated the number of CRS cases/1000 live births after 30 years across possible coverage levels (Fig. 2, showing only routine immunization). If birth rates or R 0 are low, the burden decreases relative to the pre-vaccination burden (horizontal lines) for even small increases in coverage (Fig. 2a). However, for higher birth rates or R 0, cases/1000 live births first increase, representing an increase in average age insufficiently offset by a decrease in transmission, then decrease (Fig. 2b, c). The main goal of our analysis is to identify the minimum level of coverage that is sufficient to avoid an increase in the relative CRS burden, indicated by an arrow for each curve (Fig. 2); implementing further immunization strategies reduces this necessary coverage level. In all situations, the minimum coverage level increases with the time-horizon considered, as the average age of infection continues to increase gradually over a sustained routine vaccination programme (Fig. S5). Effects of even low vaccination coverage are most beneficial where the birth rate or R 0 are lowest, which correspond to situations where the burden of CRS is greatest in the absence of vaccination (Fig. 2).
Effect of routine vaccination coverage levels on congenital rubella syndrome (CRS) burden over 30 years, for different levels of routine infant and young children vaccination coverage only, total number of CRS cases/1000 live births for a population of 750 000 across different birth rates for (a) 12 births/1000, (b) 30 births/1000 and (c) 40 births/1000). Three levels of R 0 are shown (in colour) under weak seasonality in transmission (α = 0·2; higher seasonality does not alter results). Horizontal lines indicate the number of CRS cases/1000 live births occurring in the absence of vaccination; points on each curve above the corresponding line correspond to negative outcomes of vaccination; arrows indicate the level of coverage required to avoid this. Note that the exact numbers on the y-axis in any particular context will depend on the precise pattern of the fertility curve, which may itself vary with birth rate. Here, it is assumed that the pattern over age follows that for Niger.

Minimum required levels of coverage
To show effects of varying birth rates and R 0 we plotted the minimum required level of coverage (indicated by the arrow, Fig. 2) as a function of birth rate for three levels of R 0. The minimum level of coverage increases with birth rate (Fig. 3, x-axis) and R 0 (Fig. 3a–c, respectively), and is reduced by implementation of SIAs (Fig. 3, coloured lines) or vaccination of women of childbearing age (Fig. 3, gold line). Seasonality had little effect (Fig. S5).
Minimum level of vaccination required to retain ρ, the ratio of cumulative congenital rubella syndrome incidence before and after vaccination <1 over 30 years (y-axis), across births/1000 per year (x-axis) and levels of R 0 (panels) for five different immunization strategies, (i) routine vaccination only, (ii) routine + supplementary immunization activities (SIAs) of 1- to 4-year-olds every 4 years, (iii) routine + SIAs of 1- to 4-year-olds every 4 years + a starting campaign in 1- to 4-year-olds, (iv) routine + SIAs of 1- to 4-year-olds every 4 years + a starting campaign in 1- to 14-year-olds, and (v) routine + SIAs of 1- to 4-year-olds every 4 years + a starting campaign in 1- to 14-year-olds + vaccination of women of childbearing age (WCB). The level currently recommended by WHO (80%) is shown (grey line).

Requirements for implementing infant and young children immunization only
If R 0 = 6, the yearly risk ratio ρy remains <1 even for low vaccination coverage (Fig. S4a), and thus coverage levels required to retain total CRS cases below pre-vaccination levels are low (Fig. 3a). If R 0 = 12, after an initial ‘honeymoon’ period [Reference Mclean and Anderson34] during which the risk ratio ρy drops (Fig. 1a), for insufficient coverage, the risk ratio may increase, i.e. more CRS cases are obtained under the vaccination programme than in the absence of vaccination; consequently, for birth rates >20/1000, coverage levels of >80% (and nearing 100% for birth rates of 30/1000 or higher) are required (Fig. 3c).
Requirements for implementing measles-like SIAs
Regular SIAs reduce routine coverage needed to see reductions in CRS relative to the pre-vaccination burden, since children missed by routine services may be vaccinated in the SIA (Fig. 2a vs. Fig. 2b; Fig. 3, black vs. red lines). However, for high birth (>35/1000 per year) and reproductive (R 0 ⩾ 12) rates, even with regular SIAs with coverage of 90%, at least 80% routine vaccination coverage is required (and more if SIA coverage is lower, Fig. S6). Augmenting routine SIAs with a starting campaign extends the length of the honeymoon period [Reference Mclean and Anderson34], i.e. the time after the start of routine infant and young children vaccination before the susceptible population reaches the critical size for an epidemic (Fig. 1b–c). A greater age range in the starting campaign extends the reach of this effect (Fig. 1c–d), e.g. vaccinating children up to age 14 years vs. up to age 4 years means that it takes 16 years rather than only 8 years before a new birth cohort can build-up sufficiently to cause an outbreak in older children. Over time, the benefits of the starting vaccination campaign disappear as new susceptibles born after the starting vaccination campaign enter the at-risk age groups (Fig. 1b, c). Accordingly, the reduction of the minimum necessary level of vaccination to retain the burden below levels obtained in the absence of vaccination over 30 years is slight (Fig. 3, green vs. red line). Vaccinating women of childbearing age reduces the relative burden of CRS and the minimum level of coverage required in routine programmes (Fig. 3).
Spatial dynamics in a stochastic environment
The CRS burden per 1000 live births predicted by a stochastic model that allows for local extinction/re-introduction is higher than in identically parameterized deterministic models (Fig. 4b), because local extinction of rubella leads to susceptible build-up in older age groups, increasing CRS numbers when rubella is re-introduced. Reducing imports of infected individuals, which occurs when a neighbouring location (city, or country) is vaccinated, can further substantially increase the total CRS burden (Fig. 4b), due to a greater time interval between epidemics (Fig. 4a; qualitative results are retained over a range of birth rates). This outcome is variable: in some simulations, rubella becomes locally extinct, and by chance, the population never experiences the arrival of an infected immigrant, so that the total CRS burden can be lower than that obtained in the absence of vaccination of the neighboring location (city or country).
The effect of reduced infected immigration on the burden of CRS in a stochastic situation. Stochastic simulations showing bi-weekly rubella incidence in the presence of some immigration of infected individuals [(a) left panel, on average three infected immigrants per year] or reduced immigration of infected individuals [(a) right panel, on average 0·3 infected immigrants per year]. Panel (b) shows the numbers of CRS cases/1000 live births [medians (inner horizontal bar), 25% and 75% quantiles (box) and 0·975 and 0·025 quantiles (outer lines) across 10 simulations], and corresponding levels in the deterministic situation (red asterisks). All simulations had a birth rate of 12/1000 and R 0 = 6 (set since the effect is expected to be strongest in communities with low transmission and/or birth rate) and population size of 50 000; burdens were assessed across 40 years.

DISCUSSION
Rubella is perhaps the infection for which mathematical modelling holds the greatest promise for improving public health interventions. The epidemiology is straightforward, and thus tractable to model development, but the effect of vaccination on the burden of disease is rooted in the nonlinearities of infectious disease dynamics. These dynamics are much studied, but here we explore them in a broader demographic and spatial context than previously. Across a global spectrum of demographic and epidemiological contexts, we show that the nonlinear epidemic dynamics of rubella can interact in complex ways with both birth rates and spatial heterogeneity to influence the consequences of vaccination.
To be useful, models must be rooted a realistic public health context, and deciding whether to introduce RCVs into the routine infant immunization schedule, and what additional vaccination strategies to use requires consideration of the financial and logistical feasibility of achieving and sustaining identified minimum coverage levels in all areas of the country, and indeed in neighbouring countries. Although the burden of CRS is small compared to the overall disease burden in children in certain regions, the low cost of the rubella vaccine and the ability to deliver it as a MR combination vaccine mean that it may be one of the diseases most effectively tackled. This is particularly true where regular measles SIAs continue with high campaign coverage. Switching from the measles vaccine to the MR vaccine entails an increase in cost – in 2010 the UNICEF discounted price per dose was US$0.8–1.50 for MMR and US$0.53 for MR, compared to US$0.22 for measles (http://www.unicef.org/supply/) – but no additional resources would be required for distribution: the combined vaccine would simply be substituted for the monovalent vaccine. Furthermore, a Global Alliance for Vaccines and Immunizations (GAVI) support window for the rubella vaccine is in preparation for 2012 [14].
However, rubella vaccine is also the only common vaccination whose use has the potential to lead to a negative outcome, i.e. increased incidence of CRS. We found that in the simplest analysis, where population sizes are large enough that stochastic effects can be ignored, introduction of routine infant and young children rubella vaccination once coverage is sustainable at ⩾80% is conservative under many demographic and transmission conditions, particularly when birth rates are <30/1000 (Fig. 3), in line with previous work [Reference Anderson and May5, Reference Gay7, Reference van der Heilden8, 13, 14, Reference Cutts18]. However, necessary vaccination coverage increases strongly with birth rate, and this coverage level is insufficient for routine vaccination alone in countries where the birth rate is >30/1000 and the basic reproductive rate of rubella is >8. Starting (‘catch-up’) campaigns followed by regular high-quality SIAs (Fig. 3) lowers the requirement for coverage across birth rates, as long as SIAs reach children who were missed by the routine programme and in the absence of stochastic effects (see below). Results are conservative relative to mixing assumptions (Fig. S5) and robust to the assumption of stable populations (Fig. S7).
Vaccination of women of childbearing age is the one strategy that will always improve the CRS situation. While such targeted campaigns should play an important role in a rubella control strategy, they face several logistical hurdles. Significantly, such a campaign could not be paired with existing measles control programmes, and thus would require a major investment in a vaccination programme aimed solely at the control of rubella. Additionally, identifying women in need of vaccination may be difficult. Overall, whether the benefits of pursuing rubella vaccination of women of childbearing age outweighs the costs will depend on coverage and the age profile of access to vaccination. In our analyses, we set a gradually increasing pattern of access to vaccination with age (Fig. S1e), and coverage equivalent to half that achieved in routine vaccination. This may be conservative: WHO reports 75% coverage for tetanus toxoid immunization, a vaccination targeted at pregnant women via routine programmes. However, vaccination of pregnant women is unlikely to be implemented for rubella and it is unclear if similar rates of success could be reached across populations.
The effect of seasonal forcing on CRS burden has not previously been addressed. Motivated by recent results highlighting both its amplitude and importance for measles dynamics in a Sahelian context [Reference Ferrari23], we explored seasonal forcing in detail here. Our results suggest that seasonality is rather negligible relative to effects of birth rate (Fig. S5). Rubella does frequently display multi-annual cycles [Reference Edmunds35], which could affect the age profile of infection [Reference Ferrari24]. Transient dynamics interacting with seasonal forcing has been proposed as the mechanism [Reference Bauch and Earn11], rather than strong seasonal forcing per se [Reference Keeling, Rohani and Grenfell10, Reference Earn36]. Such effects may only shift the age of infection up by a small amount [Reference Metcalf21], and are thereby unlikely to affect the burden of CRS, but their existence (e.g. [Reference Bauch and Earn11, Reference Metcalf21]) implies that stochasticity is an important element of the dynamics of rubella.
If stochasticity is important, the generally positive situation for vaccination depicted by the deterministic analysis here and elsewhere [Reference Anderson and May5, Reference Edmunds35] needs to be interpreted cautiously in a world of heterogeneous vaccination rates. Local extinction might dominate rubella dynamics (e.g. see data from Peru [Reference Metcalf22] and early data from The Gambia [Reference Clarke37]). This will allow build-up of susceptible individuals in older age groups (demonstrated for remote areas in Peru [Reference Metcalf22]) increasing the burden of CRS and potentially altering the outcomes of vaccination. Our stochastic analysis highlights that risks are high if vaccination is introduced in one location (country or community) and there is substantial cross-migration with unvaccinated communities where rubella circulation is maintained by imports. These results echo those of Vynnycky et al. [Reference Vynnycky, Gay and Cutts15] in that inequality in access to private-sector rubella vaccination when it is not available in the public sector may affect the CRS burden. Note that these results will also be sensitive to the assumptions of the exact generation time of the infection, as well as the value of the exponent γ (since values closer to 1 lead to more violent dynamics more prone to extinction) and for quantitative predictions these should be carefully estimated.
Our model makes several assumptions. We assumed that a person's chance of being vaccinated in an SIA is independent of their probability of routine vaccination and vaccination in previous SIAs. However, those children not covered by routine vaccination may have been missed for some reason that increases their likelihood of being missed by SIAs, leading to a systematically unvaccinated population. Recent work has shown that this group may represent as much as 20% of the population in some countries [Reference Lessler38]. The existence of such a group will cause us to overestimate the benefit of SIAs; hence we urge caution in the interpretation of our results and suggest that the estimated coverage of SIAs be ‘discounted’ and accordingly considered to be up to 20% lower if such an unreachable population is believed to exist. This is a key area for future work on specific contexts. We assumed that seasonal forcing followed a sinusoidal pattern (Fig. S1b). More realistic patterns may alter the range of multi-annual cycles [Reference Keeling, Rohani and Grenfell10] and could influence our conclusions on the weak effect of the magnitude of seasonal forcing on vaccination outcomes; time-series data at sub-annual time-scales would be required to investigate this. Our model is likely to be robust towards biases from other assumptions; and where biases exist, the model will tend to be conservative, overestimating rather than underestimating the minimum required coverage. For example, we assumed approximately 24 rubella generations per year; in fact there may be slightly fewer, since rubella has a generation time of about 18 days [Reference Anderson and May5], implying that our model slightly overestimates yearly transmission rates, thus over-predicting minimum required levels of vaccination; sensitivity analyses suggest that this will have little impact over much of the range of vaccination (Fig. S2), but should be borne in mind for highest coverage levels. We assumed constant survival rates over age, which will result in an exponential distribution of the population over age, and may underestimate the relative proportion of women of childbearing age, and thus the CRS burden, particularly in populations where birth rates are lower (e.g. Europe). However, repeating the analysis with empirically based age trajectories of survival reflecting the likely range of age trajectories of survival which results in non-stationary populations (either growing or shrinking, depending on the balance of mortality and birth rate) does not much alter required minimum vaccination coverage (Fig. S7). Finally, we assumed that transmission is constant over age. If transmission is more clustered in younger age groups, as has been reported from surveys of contact patterns over age in European countries (Fig. S2b) the necessary vaccination coverage is higher (Fig. S8), particularly at lower birth and transmission rates (albeit retaining general patterns relative to the 80% threshold); however, the absolute number of CRS cases will be much smaller than is estimated with constant transmission over age (Fig. S9), as will be the increase driven by insufficient vaccination. Specific data needs for improved predictions relative to the various assumptions are detailed in Supplementary Information S3.
Overall, our results have several implications for introduction of RCV. First, declining birth rates in low- and middle-income countries raise the priority for rubella vaccination because; (i) falling birth rates increase the average age at infection, thus increasing the burden of CRS in the absence of vaccination, and (ii) the critical vaccination coverage required to reduce CRS incidence will be lower at lower birth rates, increasing the chances of a successful vaccination programme [Reference Earn36]. Second, given the current global range of birth rates, in all regions except Africa, if routine infant and young children measles vaccination coverage is ⩾80% it is likely to be safe to switch to MR combined vaccines, in the absence of major heterogeneities in coverage, particularly as birth rates fall. Substantial programmatic efforts would be needed in large countries such as India; however, to avoid potential increases in CRS that could occur through spatial dynamic effects on transmission if the substantial heterogeneity in coverage that has been seen for measles vaccine (with up to fourfold differences in coverage between states) continued. Third, private-sector vaccination against rubella should be monitored as much as possible, to assess whether private-sector coverage has reached levels sufficient to increase CRS burdens (Fig. 2), and if so, national introduction policies should be considered. Fourth, in the African region, where birth rates remain >40/1000 in many countries and estimates of R 0 are >6 [Reference Cutts18], infant and children vaccination alone should be considered with caution and SIAs would be essential as long as birth rates remain high. Even with SIAs, the potential for spikes in CRS incidence to occur in the short term implies the need for effective communication to avoid public mistrust of the programme. Fifth, the addition of vaccination of women of childbearing age has the potential to greatly enhance programme effectiveness and reduce risks of increases in CRS. Finally, the potential for local extinction and delayed outbreaks should be a factor when considering implementing any of the above recommendations. In the WHO African and South-East Asian regions, the only regions where universal rubella vaccination is currently uncommon [3], it would be prudent for changes in rubella vaccine policy to be taken at regional level rather than by individual countries, and for introduction of RCVs to be accompanied by intensified efforts to reduce heterogeneities in routine vaccination and SIA coverage.
The public health recommendations above are developed in the context of rubella, but the results of our analysis also provide a global overview of the degree to which complex feedback between key drivers inherent in infectious disease dynamics shape infection, and are therefore important to consider for successful control. Our broad analysis of the effects of seasonality, spatial coupling, and stochastic effects on both incidence and the age profile of incidence provide a global scale overview of the landscape of the dynamics of such infections, key for assessing safe and effective implementation of control strategies.
CONCLUSIONS
Once immunization against rubella is introduced there is no going back, so costs and benefits must be carefully weighed. For low-to-average birth-rate contexts, benefits of immunization are likely to be high across a range of levels of routine coverage, especially in the presence of additional immunization activities. For countries with high birth rates, 80% coverage of routine infant vaccination alone may not remove all risks of adverse events, and funding will need to be guaranteed for high-quality SIAs to continue in addition to routine infant and young children immunization. It is also important that policy decisions be based on not only national levels of coverage, but also their variability both sub-nationally and across regions.
NOTE
Supplementary material accompanies this paper on the Journal's website (http://journals.cambridge.org/hyg).
ACKNOWLEDGEMENTS
S. Reef suggested analyses and provided feedback; W. J. Moss and S. A. Lowther contributed data for vaccination age profiles; E. Vynnycky gave detailed comments; the WHO Rubella Working Group provided helpful discussion. This work was funded by the Royal Society (C. J. E. M.), the Bill and Melinda Gates Foundation (C. J. E. M., B. G., J. L., P. K.), the RAPIDD program of the Science & Technology Directorate of the Department of Homeland Security, and the Fogarty International Center National Institute of Health (B.G.) and NIH grant NIH/GM R01-GM083983-01 (C. J. E. M., B. G.).
DECLARATION OF INTEREST
None.


 Open access