


1. Introduction
Buying a bull can be a complicated decision that has major implications for a cattle operation’s long-term profitability (Clary, Jordan, and Thompson, Reference Clary, Jordan and Thompson1984; Worley, Dorfman, and Russell, Reference Worley, Dorfman and Russell2021). The ideal bull will vary across operations depending on breed composition, marketing plan, average herd cow age, number of heifers, and other factors. Typically, bull buyers have information about the animal’s expected progeny differences (EPDs), performance, and physical traits. EPDs are estimates of the expected performance of future progeny of an animal relative to the progeny of other animals within the same breed for given traits. EPD measures can be a valuable tool for producers to compare the predicted genetic merit of bulls within a breed to produce progeny with desired traits. Bull EPD values are calculated based on the performance data of the individual bull, its offspring, and its relatives. When using EPDs, producers are able to make more accurate selection decisions and accelerate genetic progress.
Numerous studies have utilized auction sale data to provide an analysis of the information utilized by producers when selecting a bull for breeding, albeit with mixed evidence regarding the extent to which producers incorporate EPD measures into their cattle market operations (Bekkerman, Brester, and McDonald, Reference Bekkerman, Brester and McDonald2013; Boyer et al., Reference Boyer, Campbell, Griffith, DeLong, Rhinehart and Kirkpatrick2019; Brimlow and Doyle, Reference Brimlow and Doyle2014; Chvosta, Rucker, and Watts, Reference Chvosta, Rucker and Watts2001; Dhuyvetter et al., Reference Dhuyvetter, Schroeder, Simms, Bolze and Geske1996; Irsik et al., Reference Irsik, House, Shuffitt and Shearer2008; Jones et al., Reference Jones, Turner, Dhuyvetter and Marsh2008; Kessler, Pendell, and Enns, Reference Kessler, Pendell and Enns2017; McDonald et al., Reference McDonald, Brester, Bekkerman and Paterson2010; Tang et al., Reference Tang, Thompson, Boyer, Widmar, Stewart, Lofgren and Minton2020; Vanek et al., Reference Vanek, Watts and Brester2008; Vestal et al., Reference Vestal, Lusk, DeVuyst and Kropp2013). The literature shows that producers placed low importance on EPD values in bull selection decisions when EPD measures were first introduced (Chvosta, Rucker, and Watts, Reference Chvosta, Rucker and Watts2001; Dhuyvetter et al., Reference Dhuyvetter, Schroeder, Simms, Bolze and Geske1996; Irsik et al., Reference Irsik, House, Shuffitt and Shearer2008). That is, EPDs were not found to significantly impact the price of a bull in a sale. However, more recent research reveals that EPD impacts the market price of bulls (Boyer et al., Reference Boyer, Campbell, Griffith, DeLong, Rhinehart and Kirkpatrick2019; Brimlow and Doyle, Reference Brimlow and Doyle2014; Jones et al., Reference Jones, Turner, Dhuyvetter and Marsh2008; Kessler, Pendell, and Enns, Reference Kessler, Pendell and Enns2017; McDonald et al., Reference McDonald, Brester, Bekkerman and Paterson2010; Tang et al., Reference Tang, Thompson, Boyer, Widmar, Stewart, Lofgren and Minton2020; Vanek et al., Reference Vanek, Watts and Brester2008; Vestal et al., Reference Vestal, Lusk, DeVuyst and Kropp2013).
Recently, EPDs have evolved to also include genomic data, or DNA information, in the calculation of EPDs, referred to as genomically enhanced EPDs (GE-EPDs) (Matukumalli et al., Reference Matukumalli, Lawley, Schnabel, Taylor, Allan, Heaton and Van Tassell2009; Meuwissen et al., Reference Meuwissen, Hayes and Goddard2001). These new GE-EPD indicators provide a more reliable prediction of a bull’s genetic merit relative to standard EPDs, due to measuring actual genetic relatedness as opposed to a pedigree estimate (Van Eenennaam and Drake, Reference Van Eenennaam and Drake2012; Rolf et al., Reference Rolf, Decker, McKay, Tizioto, Branham, Whitacre, Hoff, Regitano and Taylor2014). This information is especially valuable for the evaluation of young, unproven animals that have yet to sire many calves in the genetic evaluation. GE-EPDs allow bulls without progeny to receive substantial boosts in accuracy at a young age.
The utilization of GE-EPDs in the process of bull selection in commercial operations is low (Smith, Reference Smith2021; Vestal et al., Reference Vestal, Lusk, DeVuyst and Kropp2013). Vestal et al. (Reference Vestal, Lusk, DeVuyst and Kropp2013) used data from three Oklahoma Beef Inc. Performance-Tested bull sales in 2009–2010 in a revealed preference study and found that genomic data had no relation with buyers’ preferences. Smith (Reference Smith2021) employed a survey of bull buyers in Tennessee and determined that producers do not significantly value GE-EPD measurements when evaluating bulls for purchase. As previously stated, GE-EPDs are intended to serve as a more accurate source of genetic information for producers, but no study has found these values to impact the sale price of a bull. This might suggest a lack of understanding from producers regarding the purpose and value of this relatively new selection tool. Smith (Reference Smith2021) also reports that the education level of bull buyers does not statistically explain the variation in elicited WTP values, indicating that the lack of incorporating EPD measures in buying decisions might stem from behavioral biases.
If carefully utilizing the available information is the best profit-maximizing strategy, why do producers suboptimally behave when buying or selling cattle? Since education does not appear to be a good predictor of WTP values, can behavioral biases better explain the documented inefficiencies in the cattle market? Recent findings in the behavioral economics literature show that buying and selling decisions are prone to optimism bias triggered by the endowment effect (Ericson and Fuster, Reference Ericson and Fuster2014; Drouvelis and Sonnemans, Reference Drouvelis and Sonnemans2017). Optimism bias leads to unreasonably high (low) price expectation if economic agents are selling (buying) goods in the market. It has also been shown that optimism bias and attention are causally related and can mutually enforce each other (Kress and Aue, Reference Kress and Aue2017). Studies have tried to measure optimism bias— sometimes referred to as self-serving bias, cognitive dissonance, over-confidence, or over-optimism—using various experiments (Mayraz, Reference Mayraz2011). This bias is displayed when decision makers underestimate the probability of negative events or overestimate the likelihood of positive events simply due to the impact of these events on their utility (Bénabou and Tirole, Reference Bénabou and Tirole2016). Mayraz (Reference Mayraz2011) presented an experiment to test wishful thinking, or optimism bias, using the wheat market as an example. Participants who were randomly assigned the role of Farmer (i.e., seller) displayed higher average price expectations relative to participants assigned the role of Baker (i.e., buyer). The presence of this bias also has implications for decision making that could lead to the sellers or buyers increasing their risk exposure or returns (Deaton and Laroque, Reference Deaton and Laroque1996; Woolverton and Sykuta, Reference Woolverton and Sykut“2009). That is, making a wrong decision in the short-term because of bias could lead to unintentional long-term issues. For instance, holding unrealistic price expectations can also lead to substantial financial losses and bankruptcies. Recent decision theory models link upward price expectations to optimism bias when the decision-maker has a relevant stake (Bénabou and Tirole, Reference Bénabou and Tirole2016). However, the optimism bias and its potential negative consequences have not been studied in the cattle market. Attempting to measure if optimism exists would be a unique contribution to the bull-buying literature and would give insights if educational programs need to address this bias in making a bull purchase.
Therefore, the primary objectives of this study are to provide an analysis of variables influencing price prediction accuracy in seedstock bull markets, determine if optimism bias exists, and examine factors affecting producers’ valuation of various information, like EPDs when predicting bull prices. We develop a novel preference elicitation experimental procedure for the seedstock bull market by building on Mayraz’s (Reference Mayraz2011). Additionally, most of the literature on this topic is using hedonic pricing models on actual bull sales data and two studies have used survey data to elicit stated values for bulls (Smith, Reference Smith2021; Vestal et al., Reference Vestal, Lusk, DeVuyst and Kropp2013). No study, to our knowledge, has used a field experiment setting with actual producers to study the determinants of price expectations in the cattle market and to identify behavioral biases affecting price formation. Our study enriches the existing literature with a new perspective on price formation channels and will be useful in developing debiasing tools and methods in helping cattle buyers and seedstock bull producers avoid overvaluations and properly estimate bulls’ market values.
1.1. Data
The data utilized in our study were collected through incentivized lab-in-the-field experiments conducted at the 2022 annual cattlemen conventions in Tennessee and Alabama during the months of January and March, respectively. We invited 69 participants in Tennessee and 95 participants in Alabama to participate in our experiment on voluntary basis. Every respondent was compensated with $15 for participating in our study and was informed of the potential to earn an additional $10 reward for accurately predicting the bull’s price in a randomly selected experimental task. This potential additional payoff serves as an incentive for accuracy by the participants in our study. At the beginning of the experiment, each participant was randomly assigned a role as either a seller or buyer in the seedstock bull market. Assigned roles were intended to create a market framing mimicking real cattle markets. Moreover, the role assignment allowed us to trigger different decision-making channels sellers and buyers utilize when operating in an actual market. Following the role assignment, each participant underwent three training exercises (one for each breed used in the experiment). Then, participants were asked to predict the market price of bulls in 18 tasks.
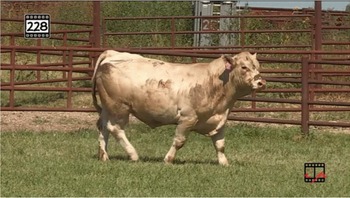
We prepared 18 price prediction tasks based on past real cattle market transactions including bulls from three breeds: Angus, Charolais, and Simmental. Angus, Charolais, and Simmental bulls sold during 2021 at seedstock bull sales in Tennessee, Kansas, and Alabama, respectively, were selected for use in our study. These are three commonly utilized breeds in the herds of Tennessee and Alabama cattle producers. Six bulls from each breed were selected to form the 18 incentivized tasks in our experiment. The six bulls from each breed were strategically selected such that a balanced number of bulls with high, average, and low EPD values were presented. In each task, participants were provided with a scenario and EPD information of the bull before they were asked to predict its market price. The scenarios were intended to establish a common baseline for all participants in their evaluations, as the bulls’ value might otherwise be affected by the characteristics of the respondent’s herd. In addition, participants were provided with a brief five to seven-second looping video of the bull walking from left to right in each task to provide opportunity for visual examination (Figure 1).
Screenshot from a bull video provided to participants.

When asked to predict the market value of the bull in each task, participants were made aware that an accurate price prediction had to be within the range of $500 above to $500 below the true market price. Participants were also asked to indicate their confidence level in their price prediction on a slider scale of one to 100 at the end of each task before they concluded their price predictions. Finally, at the conclusion of the experiment, participants completed a survey composed of herd composition, risk-taking, and demographic characteristic questions related to their own cattle operations.
2. Methods
We employ multiple Probit regression analyses to model the probability of accurate price predictions in the entire sample of our data and in subsamples separated by breed and risk preference for a total of 10 equations. Equations (1)–(4) model the probability for the full sample. Equations (5) and (6) model the probability for the three breeds in our experiment and risk preference groups, respectively. The equations are written as follows:
 $$\Pr (Y=1|X)=\Phi (\beta _{0}+\beta _{1}S)$$
 $$\Pr (Y=1|X)=\Phi (\beta _{0}+\beta _{2}TN)$$
 $$\Pr (Y=1|X)=\Phi (\beta _{0}+\beta _{1}S+\beta _{2}TN+\beta _{3}STN)$$
 $$\Pr (Y=1|X)=\Phi (\beta _{0}+\beta _{1}S+\beta _{2}TN+\beta _{3}STN+\beta _{4}C)$$
 $$\matrix{ {\Pr (Y = 1|X) = \Phi ({\beta _0} + {\beta _1}S + {\beta _2}TN + {\beta _3}C + {\beta _4}RP + {\beta _5}E + {\beta _6}GE + {\beta _7}ER + {\beta _8}P + {\beta _9}A} \hfill \cr {\quad + {\beta _{10}}C + {\beta _{11}}SM + {\beta _{12}}STN + {\beta _{13}}EDU + {\beta _{14}}FarmIncome)} \hfill \cr } $$
 $$\matrix{ {\Pr (Y = 1|X) = \Phi ({\beta _0} + {\beta _1}S + {\beta _2}TN + {\beta _3}C + {\beta _5}E + {\beta _6}GE + {\beta _7}ER + {\beta _8}P + {\beta _9}A + {\beta _{10}}C} \hfill \cr {\quad + {\beta _{11}}SM + {\beta _{12}}STN + {\beta _{13}}EDU + {\beta _{14}}FarmIncome)} \hfill \cr } $$
where Y is the probability of an accurate price prediction with one being the case where the participant’s price prediction was within the accurate price range and zero otherwise; Φ is the standard normal cumulative distribution function; S is a binary variable indicating if a participant was assigned the Seller role in the study; TN is a binary variable for participants in the Tennessee sample; C the is indicated confidence level in price predictions; RP denotes the subject’s risk tolerance level measured with a slider scale of 0 to 10 indicating the decision-maker’s risk-tolerance level (Falk et al., Reference Falk, Becker, Dohmen, Enke, Huffman and Sunde2018)Footnote 1 ; EPD is a binary variable showing if EPDs are utilized by participants; E is a binary variable for participants utilizing EPDs; GE is a binary variable for participants utilizing GE-EPDs; ER is a binary variable for participants utilizing EPD percentile rank; P is a binary variable for participants utilizing physical characteristics; A is a binary variable for participants with Angus cattle in their operation; C is a binary variable for participants with Charolais cattle in their operation; SM is a binary variable for participants with Simmental cattle in their operation; STN is a binary interaction variable for participants assigned the Seller role and if they are in the Tennessee; EDU is a categorical variable indicating the highest education level achieved by participants; and Farm Income shows the percentage of household income coming from participants’ cattle operations. Table 1 provides the definitions of dependent and independent variables examined.
Definitions of dependent and independent variables examined

2.1. Hypothesized Variable Signs
Based on previous studies and experimental results, we expect to observe behavioral differences in price predictions between sellers and buyers in lab-in-the field experiments (Mayraz, Reference Mayraz2011). The existing research shows that decision-makers usually are prone to optimism bias and they form their price expectations aligning with their stakes. In our study design, this means sellers will be more likely to overpredict bull prices in 18 tasks compared to the true market prices. Contrarily, optimism bias predicts that buyers will be more likely to underpredict cattle prices in the experiment.
Moreover, we also expect that price expectations and accurate price predictions are the function of producer characteristics. Producers are more likely to accurately predict cattle prices when they are more informed about EPD and/or GE-EPD measures. In that regard, we expect producers to demonstrate a higher degree of prediction accuracy if they apply greater utilization of EPDs, GE-EPDs, and physical characteristics in the process of bull evaluation. Additionally, location could impact accuracy, but we are unsure of the hypothesized sign. That is, is one state better than the other in price accuracy?
We expect that participants’ confidence in their price predictions will have an impact on the price prediction accuracy. There is evidence that decision-makers with increased confidence are more biased, increasingly inclined to overpredict, and therefore they are less likely to achieve accurate predictions (Mayraz, Reference Mayraz2011).
However, we are uncertain regarding the impact producer utilization of certain breeds in their operation will have on prediction accuracy. It seems logical to expect participants to be more confident and accurate in tasks involving breeds they are most familiar with. However, it is established that confidence is associated with bias, and breed familiarity may not translate to accurate price predictions.
Previous studies reveal that EPD measures and physical characteristics are primary determinants of the market value of bulls (Boyer et al., Reference Boyer, Campbell, Griffith, DeLong, Rhinehart and Kirkpatrick2019; Brimlow and Doyle, Reference Brimlow and Doyle2014; Jones et al., Reference Jones, Turner, Dhuyvetter and Marsh2008; Kessler, Pendell, and Enns, Reference Kessler, Pendell and Enns2017; McDonald et al., Reference McDonald, Brester, Bekkerman and Paterson2010; Tang et al., Reference Tang, Thompson, Boyer, Widmar, Stewart, Lofgren and Minton2020; Vanek et al., Reference Vanek, Watts and Brester2008; Vestal et al., Reference Vestal, Lusk, DeVuyst and Kropp2013). Accordingly, we anticipate that the utilization of EPD, EPD percentage rank, and phenotype information in our experiment will result in an increased proportion of accurate price predictions. Additionally, the literature supports an expectation that consideration of GE-EPDs will result in increased accuracy because of more complete and reliable bull evaluations (Van Eenennaam and Drake, Reference Van Eenennaam and Drake2012; Rolf et al., Reference Rolf, Decker, McKay, Tizioto, Branham, Whitacre, Hoff, Regitano and Taylor2014). Furthermore, risk tolerance is expected to have a negative relationship with prediction accuracy.
3. Results
Table 2 provides the summary statistics for our experimental study sample across the two states. We also conduct statistical mean comparisons of Tennessee and Alabama samples over key behavioral and demographic variables. We implement multiple hypotheses testing p-value adjustments to prevent false positive in our tests.
Sample summary statistics for Alabama and Tennessee participants

1 n (%).
2 Mean (SD).
3 Pearson’s Chi-squared test; Wilcoxon rank sum test.
In both Tennessee and Alabama, the producers in our study were far more likely to have Angus cattle in the herd than Charolais or Simmental. Approximately 80% of all producers in our sample utilize Angus cattle in their herd, while approximately 30% utilize Simmental. Producers in Tennessee indicated that only 22% utilized Charolais, while Alabama producers indicated that 29% utilized Charolais. An additional question in our survey asked participants to indicate whether they use certain information in their evaluation and valuation of cattle. Participants in Tennessee indicated that 78% utilized EPDs and 51% utilized GE-EPDs, which are 13 and 16% higher rates than those in Alabama, respectively. Our discussion on general producer characteristics of our sample yields results consistent with previous studies and indicates a knowledge gap among our participants regarding the value and availability of GE-EPDs for the evaluation of bulls (Smith, Reference Smith2021). Most participants in both states primarily utilize physical characteristics in their examination of bulls. Surprisingly, 9% more producers in Tennessee utilized physical characteristics in their evaluations of bulls than Alabama producers. Interestingly, the only information used at a higher rate by Alabama producers relative to Tennessee producers is EPD percentile rank values of bulls within the breed. We also do not detect significant difference between Alabama and Tennessee cattle producers over educational achievement. The survey results also find the average producer in both states to be slightly risk seeking.
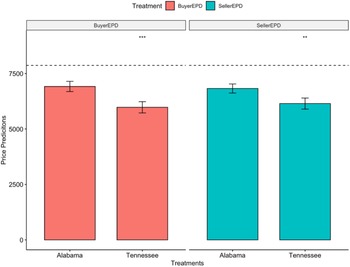
The mean price predictions made by Buyers and Sellers in Alabama and Tennessee are displayed in Figure 2. When EPD information is provided, we find no significant difference between the average price prediction made by Buyers and Sellers within either sample. However, when comparing Buyers and Seller groups across states, we find a significant difference in average price predictions for both treatments (Figure 3). The mean price prediction made by both Buyers and Sellers in Alabama was significantly higher than the mean prediction made by Tennessee producers with the same market roles in our experiment.
Mean price predictions across states. Note: The dashed line is the average of true, NS represents not significant.

Mean price predictions across treatments. Note: The dashed line is the average of true prices. *** and ** represent significance at the 1 and 5% level, respectively.

However, the mean price prediction in both states was lower than the $7867 average of true prices for the 18 bulls used in our study. This is likely explained, in part, by the prevalence of small cow-calf enterprises in both Alabama and Tennessee that do not normally purchase expensive seedstock bulls. Many of the participants in our sample are likely not accustomed to paying or receiving this much for bulls used in their operations. Although the Alabama sample has a mean price prediction closer to the true average of prices in both treatment groups, this does not directly translate to increased price prediction accuracy across treatments for the Alabama sample. Figure 4 reveals that Sellers in Tennessee had a significantly higher proportion of correct price predictions than Sellers in Alabama.
Proportion of accurate price predictions across treatments by sample. Note: ** represent significance at the 5% level and NS represents not significant.

Figure 5 shows the average price prediction accuracy of all participants in Alabama and Tennessee. There is no significant difference between the proportion of accurate predictions by the participants in the two states. Figure 6 compares the proportion of accurate price predictions by all Buyers and Sellers in our experiment. The role assigned to participants is not found to have a significant impact on price prediction accuracy in the full sample, which confirms that the optimism bias disappear when decision-makers are provided with more information.
Proportion of accurate price predictions across states. Note: NS represents not significant.

Proportion of accurate price predictions across market roles. Note: NS represents not significant.

3.1. Probit Regression Results
The results from our Probit analyses of accurate price prediction probabilities of all participants in our experiment (equations (1)–(6)) are displayed in Table 3. We find that participants, assigned the role of Seller in seedstock bull markets, were less likely to make accurate price predictions relative to those assigned the role of buyer when we control for other variables. Only equation 5 results reveal that participants in Tennessee were less probable to make accurate price predictions relative to those in Alabama. However, when we control for education and farm income variables, the negative effect of Tennessee on prediction accuracy becomes insignificant. But, equations (3)–(6) show that Tennessee sellers have an increased likelihood of successfully predicting the market price. Recall, our hypothesis was that increased accuracy would occur as more information is used by producers. Given that Tennessee producers signaled higher usage of information (Table 1), we find that only participants utilizing GE-EPDs and EPD percentage rank measurements were significantly more likely to make successful predictions. This finding supports our hypothesis that participants using advanced selection tools would be more likely to provide accurate valuations for the bulls in our experiment.
Probit results of successful prediction probabilities for all participants

Note: Standard errors are clustered at subject level. ***, **, and * represent significance at the 1, 5, and 10% level, respectively.
Table 4 shows the results of three separate probit regression models utilized to provide an analysis of successful price prediction probabilities for each breed of bull included in our experiment (Eq. (6). In the Charolais and Simmental tasks, we again find that sellers were less probable to make accurate price predictions relative to buyers. We also find that confidence has a significantly negative impact on the probability of accurate price predictions in our Angus tasks, yet no significant impact in tasks involving the other two breeds. This may be a result of a much higher proportion of producers in our experiment utilizing Angus cattle in their operation relative to other breeds. Participants being more familiar with the Angus breed may have led to overconfidence when making price predictions in these tasks. Again, only utilization of GE-EPDs and EPD percentile ranks were shown to significantly impact the probability of successful price predictions. Utilization of GE-EPDs and EPD percentile ranks increased the probability of accurate price predictions in Simmental tasks and Angus tasks, respectively. Interestingly, participants utilizing a cattle breed in their operation did not significantly impact the probability of successful predictions in the tasks in our experiment focusing on this same breed of bull. Sellers in Tennessee were found to be more likely to make an accurate price prediction in Angus and Simmental tasks but not in tasks with Charolais bulls. This may be a result of Charolais cattle being the least utilized breed in our Tennessee sample.
Probit results of successful prediction probabilities across breeds

Note: Standard errors are clustered at subject level. ***, **, and * represent significance at the 1, 5, and 10% level, respectively.
We performed additional analyses of accurate price predictions among low- and high-risk participants (Eq. (6)). The results are displayed in Table 5. The demographic survey in our experiment reveals the median risk preference of participants to be 6.8. Consequently, we classified all participants with a risk preference higher than 6.8 as high-risk and all participants with a selected risk preference below or equal to 6.8 as low risk. The analysis of these subgroups reveals that high-risk participants assigned the role of Seller in the market were significantly less likely to make an accurate price prediction than Buyers with a similar risk preference. However, the assignment of market roles among relatively low-risk participants did not significantly impact the probability of successful predictions. This indicates that Sellers with a high-risk tolerance are more likely to display optimism bias in price expectations and overshoot the true market price of bulls. Among relatively low-risk participants, the Tennessee sample remains significantly less likely to make successful price predictions relative to the Alabama sample. However, no significant regional difference in probability is displayed among high-risk participants. Furthermore, Sellers in Tennessee were found to have an increased probability of accuracy in both risk preference groups.
Probit results of successful prediction probabilities across risk preference groups

Note: Standard errors are clustered at subject level. ***, **, and * represent significance at the 1, 5, and 10% level, respectively.
Confidence is shown to be negatively correlated with the probability of price prediction accuracy among high-risk participants, but has no impact on accuracy among low-risk participants. Confident individuals tend to be more risk-seeking, and therefore more prone to have a bias in price expectations (Möbius et al., Reference Möbius, Niederle, Niehaus and Rosenbla“2022). This increased bias likely contributed to the negative relationship between confidence and accuracy in the relatively high-risk group (Arkes, Reference Arkes2001). We also find that only low-risk participants utilizing GE-EPDs in their evaluation of bulls are more likely to make accurate price predictions. It is logical to expect low-risk individuals to consider the information provided when predicting market prices. In the low risk-taking group, cattle producers with some or complete college education are more likely to be accurate in their price predictions compared to producers with high school or less education. However, we do not find any significant effect of education in the high-risk-taking group. Results from the additional analyses examining regional differences are included in the appendix.
4. Discussion
The primary objectives of this article were to provide an analysis of the factors influencing the probability of accurate price predictions in seedstock bull markets and to determine if optimism bias influences price expectations in these markets. This study adds to the existing literature by drawing analysis from a lab-in-the-field experiment with actual producers, who were provided with information and assigned to Seller or Buyer roles, predicting the actual selling price of bulls. Optimism bias is not found to exist when information is provided in seedstock bull markets.
This result supports the notion that the existence of bias depends, at least in part, on the degree of a decision maker’s subjective uncertainty (Mayraz, Reference Mayraz2011). However, Sellers are found to be consistently less likely to make accurate predictions relative to Buyers. This finding may be due to an underlying endowment effect in seedstock bull markets. In addition, confidence is determined to have a negative impact on the probability of accuracy in the full sample, Angus tasks, and among relatively high-risk participants. The negative correlation between accuracy and confidence in Angus tasks suggests overconfidence from participants when valuing bulls within breeds they are most familiar with. Furthermore, our study reveals that high-risk participants have a lower probability of making accurate price predictions relative to low-risk participants. It is also interesting to report that only participants utilizing GE-EPDs and EPD percentage rank measures are found to have an increased probability of making accurate price predictions.
Additionally, our study advances the literature by its comparison of information use among producers in multiple states. Considerable variation in the rate of utilization of decision relevant information across the Alabama and Tennessee samples are found to exist. Tennessee participants utilize EPDs, GE-EPDs, and physical characteristics at higher rates than those in Alabama when evaluating cattle, while Alabama participants are found to utilize EPD percentile rank measures more commonly than those in Tennessee. However, GE-EPDs are utilized at the lowest rate of the information options. This indicates the existence of a knowledge gap regarding the increased reliability presented by GE-EPDs in the evaluation of cattle among producers in these two states. Interestingly, although the Tennessee sample reported a greater utilization of most information and physical traits, participants in Alabama were more likely to be accurate in predicting the market price of the bulls in our experiment. Future research utilizing biometric technology, such as eye tracking, could help further understand the information used during the evaluation of a bull.
Data availability
The dataset that support the findings of this study are available upon request from the authors and at their discretion.
Author contributions
Seth Ingram:
Conceptualization (Equal), Formal analysis (Equal), Investigation (Equal), Methodology (Equal), Software (Equal), Validation (Equal), Visualization (Equal), Writing-review and editing (Equal)
Charles C. Martinez:
Conceptualization (Equal), Formal analysis (Equal), Investigation (Equal), Methodology (Equal), Software (Equal), Validation (Equal), Visualization (Equal), Writing-review and editing (Equal)
Christopher N. Boyer:
Conceptualization (Equal), Formal analysis (Equal), Investigation (Equal), Methodology (Equal), Software (Equal), Validation (Equal), Visualization (Equal), Writing-review and editing (Equal)
Samir Huseynov:
Conceptualization (Equal), Formal analysis (Equal), Investigation (Equal), Methodology (Equal), Software (Equal), Validation (Equal), Visualization (Equal), Writing-review and editing (Equal)
Troy N. Rowan:
Conceptualization (Equal), Formal analysis (Equal), Investigation (Equal), Methodology (Equal), Software (Equal), Validation (Equal), Visualization (Equal), Writing-review and editing (Equal)
Mykel R. Taylor:
Conceptualization (Equal), Formal analysis (Equal), Investigation (Equal), Methodology (Equal), Software (Equal), Validation (Equal), Visualization (Equal), Writing-review and editing (Equal)
Elmin Alizada:
Conceptualization (Equal), Formal analysis (Equal), Investigation (Equal), Methodology (Equal), Software (Equal), Validation (Equal), Visualization (Equal), Writing-review and editing (Equal)
Funding statement
This research received no specific grant from any funding agency, commercial, or not-for-profit sectors.
Competing interest
All authors declare none.
Appendix
A1. Probit results of successful prediction probabilities across states

Note: Standard errors are clustered at subject level. ***, **, and * represent significance at the 1, 5, and 10% level, respectively.


 Open access