


Introduction
In the coming decades, the United States’ working forests and forest-adjacent communities will be affected by new policies and funding sources designed to expand forest carbon storage and reduce greenhouse gas (GHG) emissions from wildfire. Increased government and private sector funding for afforestation and forest restoration projects, as well as stimulus for development of new bioenergy and wood product markets, will flow into forest communities (Charnley et al. Reference Charnley, Davis and Schelhas2023).
Forest carbon policies are driven primarily by climate goals and the sequestration potential of forest ecosystems and forest products. Climate pathways that limit global warming to 1.5oC (IPCC 2022) and the United States Long-Term Strategy for reaching net-zero emissions by 2050 (US Department of State 2021) require unprecedented carbon dioxide removal (CDR) from the atmosphere. Additional carbon sequestration from US forests is considered a central strategy to scaling up CDR. In 2021, annual land-based CDR in the nation removed 0.84 Gt CO2eq, or about 13% of that year’s US emissions of 6.3 Gt (EPA 2023); about 90% came from net growth in forests and carbon storage in wood products (EPA 2023). However, the US forest carbon sink has been declining, largely because existing forests are aging and thus have slower carbon uptake (Wear and Wibbenmeyer Reference Wear and Wibbenmeyer2023b).
Proposed remedies include expanding the forest sink via afforestation and reforestation; increasing the carbon density of existing forests via restocking and management of a forest’s age structure, species composition, and health; and increasing the production and use of carbon-storing forest products. The Reforestation Hub, a partnership of two non-governmental organizations, American Forests and The Nature Conservancy, calls for the afforestation and reforestation of 148M US acres – an area roughly equivalent to the combined area of Montana and Kansas (The Nature Conservancy 2023). We present the potential land-use changes associated with an afforestation scenario in Discussion of impacts section.
Another policy strategy addresses the increased size and intensity of wildfires, a significant source of carbon dioxide. The 2020 California wildfires, for example, emitted 91 MMT of CO2e, 50% more than the state’s electric power generation. Although the primary objective is risk reduction, an additional aim is to manage fires in ways that minimize carbon emissions. This can be achieved by linking forest fuels treatment to carbon storage, where biomass removal for fire risk reduction offers carbon storage potential through various utilization methods (Sandalow et al. Reference Sandalow, Aines, Friedmann, McCormick and Sanchez2021).
Politically, forest management and forest carbon policy proposals are bipartisan, particularly relative to other environmental issues, in part because of their potential benefits for rural economic development in terms of jobs, land values, revenues from carbon credit sales, and tax receipts (Table SI 1). (Nonmonetary benefits of forests – for example, forest-based recreational opportunities – also play an important role but are outside the scope of this study.) Overall, forest carbon policies are likely to benefit rural communities and forest owners and managers. However, socio-economic effects are likely to be unevenly distributed and may disadvantage some communities. How will effects differ between large- and smaller-scale forest owners? How will differences in access to skills, labor, and technology affect the distribution of gains? How are disadvantaged (poorer and/or minority) owners, workers, and communities likely to fare?
The literature on minority and disadvantaged forestry workers and forest landowners provides insights into the challenges and opportunities inherent in the management of forest resources. Several studies highlight socio-economic disparities in the forestry sector, shedding light on the unequal distribution of benefits and burdens (Anderson et al. Reference Anderson, Plantinga and Wibbenmeyer2023; Bailey et al. Reference Bailey, Barlow and Dyer2019).
Family forest owners face particular challenges in management and program participation. Often, the smaller the size of the holding, the less likely the landowner will engage in timber harvesting or have forest management plans (Butler et al. Reference Butler, Butler and Floress2022). High transaction costs, program complexity, and low program awareness are just some of the barriers to voluntary forestry program participation by family forest owners (Butler et al. Reference Butler, Butler and Floress2022). These barriers can be compounded for aging, low-income, and minority landowners, who face additional disadvantages such as heirs’ property issues, high property taxes and development pressure, and historical discrimination and distrust of government programs (Butler et al. Reference Butler, Butler and Floress2022; Goyke and Dwivedi Reference Goyke and Dwivedi2021).
Some policies explicitly target geographies or communities. For example, the Infrastructure Investment and Jobs Act (IIJA 2021) and Inflation Reduction Act (IRA 2022) designate specific regions, like the wildland-urban interface and public drinking water source areas, to receive resources for wildfire treatment, forest restoration, and wood-processing facilities. The acts also allocate funds to underserved communities, supporting climate mitigation and carbon credit market participation. The Forest Service’s 10 Year Implementation Plan prioritizes areas based in part on social equity considerations (Charnley et al. Reference Charnley, Davis and Schelhas2023; US Forest Service 2022). In many cases, however, no beneficiaries or receiving areas are identified.
The scale and scope of programs intended to enhance forest sector CDR are likely to impact local economies and land use. Some policies are tied to specific regions explicitly, while others are implicit based on natural resources or socioeconomic conditions. In what follows, we examine factors likely to drive the location and demography of effects in the lower 48 states, including forest dependence, biophysical and land factors, ownership, economic opportunity costs, socio-demographic vulnerability, and presence of complementary infrastructure. We explore how policies directly and indirectly affect the forest economy and in turn how changes in the forest economy can affect forest-dependent and forest-adjacent communities. We identify where forests support community well-being but also where these policies might be most socio-economically consequential.
This national-scale study is intended to provide a broad contextual foundation for evaluating individual policies and strategies. However, regional analyses focused on capturing local social and economic drivers are an important avenue for future research, and would reveal additional factors that affect communities’ response to forest carbon policies. Such analysis affords greater detail about community demographics, employment, economic trends, and existing production capacity. It also allows for more detailed analysis of, for example, tax revenue effects and the potential transition of employment from one sector to another (e.g., agriculture to forestry).
The following section of this paper describes data sources and methods. Next, we provide a review of forest carbon policies and their intersection with environmental, economic, and community factors. Then, those factors are related to the spatial distribution and ownership profile of US forests, the manufacture of wood products and patterns of forest sector employment and income, and interactions with local communities. We identify local reliance on employment in the forest sector, using the concept of forest dependence, overlay forest-dependent communities with federal measures of disadvantaged counties, and explore projected land use changes in those communities. We conclude with a summary of results and topics for future research.
Methods and data
This work examines policies within an economic framework to highlight potential market impacts, both intended and unintended. While some specific policies are referenced, this work presents a conceptual taxonomy of policies and how they fit into an economic paradigm, rather than a comprehensive policy inventory. Impacts are predicted based on established economic theory of land use and management decisions. Specifically, this framework includes the following assumptions:
We assume that landowners primarily seek to maximize utility from their land uses. Of course, financial returns may not always be the primary, or only, objective. There are many other objectives of forest landowners, such as preserving family heritage, environmental stewardship, and aesthetics. However, even small family forest landowners whose decision-making may reflect a set of nonfinancial considerations would be affected by changes in financial returns (Amacher et al. Reference Amacher, Conway and Sullivan2004; Kuuluvainen et al. Reference Kuuluvainen, Karppinen and Ovaskainen1996). Furthermore, Conway et al. (Reference Conway, Amacher, Sullivan and Wear2003) show how amenity values and bequest motives interact with (but do not obviate) harvest decisions; Shahi et al. (Reference Shahi, Siry, Bettinger, Li and Smith2023), and Wear and Coulston (Reference Wear and Coulston2023) find that harvesting by noncommercial private forest landowners is responsive to timber prices.
Financial returns to specific land uses depend on a multitude of factors, including regional population dynamics and trends, operation costs, and consumer demand for land-based resources. For example, the returns to urban land use increase with local urbanization pressure, while returns to forest use decrease if operation costs increase or consumer demand for forest products decreases.
Within this economic paradigm, we assume that the probability of a landowner converting their land use increases as the value of alternative land use increases, although it might not be their primary consideration (Wear and Newman Reference Wear and Newman2004). Following this assumption, land use conversions into forest are more likely to occur on lands with low urbanization pressure. Conversely, conversions from forest to development are more likely to occur in areas with high urbanization pressure because, in this case, forest land use is less profitable than the alternative urban use (e.g., Hardie et al. Reference Hardie, Parks, Gottleib and Wear2000; Lubowski et al. Reference Lubowski, Plantinga and Stavins2008).
Policies aimed at public land management, such as supply management and wildfire risk reduction, are an important component of the tapestry of solutions and can have significant spillover effects. However, forest carbon policies aimed at public land management are omitted from this discussion in order to focus on market-driven impacts and leverage economic assumptions appropriately.
Finally, we do not explicitly consider trade policies, such as tariffs or quotas. Trade policy is mostly concerned with protection of domestic versus international jobs and commercial activity, rather than climate goals. Clearly, however, trade barriers are a way to stimulate demand for domestic forest supplies, and therefore could theoretically be used to increase US carbon storage.
To assess how federal forest carbon policy might impact various US regions and communities in the lower 48 states, we compiled a set of spatio-temporal metrics to analyze county-level characteristics, including land use, forest ownership, forest carbon stocks, economic indicators, and the forestry industry.
Forestland and timberland acreage, as well as forestland carbon, were collected from the USFS Forest Inventory and Analysis (FIA) database using the EVALIDator application programming interface (USDA Forest Service 2024a, 2024b, 2024c). Because not all counties have these measures available in 2023, we take the most recent non-missing value from 2000 to 2023. Most county data values (97%) are from between 2020 and 2023.
We use modeled estimates of forest ownership with high spatial resolution from the US Forest Service (Sass et al. Reference Sass, Butler and Markowski-Lindsay2020) to evaluate forest ownership in forest-dependent communities. A descriptive summary of the data, which distinguishes between private owner types, can be found in Oswalt et al. (Reference Oswalt, Smith, Miles and Pugh2019). We tabulate the ownership raster area for each county to derive forestland area by owner.
A forest dependence indicator was developed using US Census County Business Patterns data and thresholds defined by Frey et al. (Reference Frey, Kallayanamitra, Wilkens and James2022). The forest dependence indicator is based on the proportion of county jobs and payroll in these sectors – dependence is defined where forestry employment is at least 10% of all employment or where forestry payroll is at least 15% of all county payroll. Taking a long-term perspective, a county is flagged as forest dependent if it meets these criteria in any year from 1998 to 2020. These thresholds for identification of dependence, established through a review of literature by Frey et al. (Reference Frey, Kallayanamitra, Wilkens and James2022) on forestry, agriculture, and mining sector dependence, allow us to highlight broad areas of interest.
There are limitations to this approach. Binary thresholds such as these are ultimately arbitrary, do not encompass the full spectrum of local economic contexts or community interests in forests, and can lead to results that are sensitive to variation (Frey et al. Reference Frey, Kallayanamitra, Wilkens and James2022; Stedman et al. Reference Stedman, White, Patriquin and Watson2007). In addition, as pointed out by Frey et al. (Reference Frey, Kallayanamitra, Wilkens and James2022), county boundaries are not necessarily reflective of a community’s geography, and communities are multidimensional and overlapping. However, given the complexity of resource dependence and limitations of data, county-level identification using uniform thresholds is a useful lens for examining regional impacts of national policy.
Employment and payroll data were collected from the US Census Bureau (US Census Bureau 2022a). Shares of employment and payroll within the forest sector were calculated for each year from 1998 to 2020, and the mean share across the time period was used to determine county status. We include all primary wood products sectors: forestry and logging (NAICS 113), support activities for forestry (NAICS 1153), wood products manufacturing (NAICS 321), and paper manufacturing (NAICS 322). We omit hunting and trapping (NAICS 1142) because we are not examining the recreation economy. We also omit furniture and related products manufacturing (NAICS 337) because it includes non-forest products, although it is included in some other studies.
To examine the intersection of the forest economy and economic disadvantage, we leverage a federal definition of areas experiencing persistent poverty (US Department of Transportation 2023; USDA Economic Research Service 2023). This measure encompasses rates of poverty over several decades to account for enduring conditions in an area. A county is an area of persistent poverty if it “has consistently had greater than or equal to 20 percent of the population living in poverty during the last 30-year period,” as measured by Census data from 1990, 2000, and 2021 (US Department of Transportation 2023). A list of qualifying counties is available from the department’s website (US Department of Transportation 2023). Three hundred fifty-five US counties meet this definition, which include 4.2% of the U.S. population.
The Department of Transportation also defines Tribal lands as “disadvantaged” communities. We identify 662 counties that intersect legal Tribal entities (e.g., reservations) and statistical entities (e.g., Tribal designated statistical areas) per 2020 Census data (US Census Bureau 2022b). There are 72 counties with both persistent poverty and Tribal entities.
The Climate and Land Use Model (CALM), developed by Wear and Wibbenmeyer (Reference Wear and Wibbenmeyer2023a), empirically predicts land-use conversion decisions on nonfederal lands based on the financial incentives of private landowners and past conversion decisions. We leverage this model to examine future land uses in 2042 under two policy scenarios: status quo (business as usual), presented in Forest carbon policy landscape section, and with an afforestation policy, discussed in Discussion of impacts section.
The software programs R (R Core Team 2024), Python (Python Software Foundation 2023), Stata (StataCorp 2021), and ArcGIS (Esri 2023) were used for data collection, analysis, and visualization.
Forest carbon policies
Forest carbon policies may create incentives for forest carbon sequestration, forest-related GHG emissions reductions, or expanded use of carbon-storing wood products, including voluntary carbon credit markets. They also include wildfire policies, but since those largely focus on public lands, we do not discuss them in depth here.
In principle, afforestation, reforestation, and carbon-oriented forest management could be achieved by regulatory mandates. But mandates are rare to non-existent in US land-use policy because of constitutional property rights protections. Instead, forest sector policies typically take the form of financial incentives (i.e., subsidies) and can be distinguished by the primary target of the incentive: (1) the forest sector, (2) forest product consumers, or (3) GHG emitters.
Forest sector subsidies
Subsidies and incentives that increase the net financial returns to forest production increase the relative value of forested land and may lead to afforestation or reforestation. The most common of these supply-side incentives are government subsidies for afforestation or reforestation through cost-sharing. Federal examples include the Conservation Reserve Program; Environmental Quality Incentives Program (EQIP); Healthy Forests Reserve Program; and Emergency Forest Restoration Program. The 2022 Inflation Reduction Act (IRA) significantly expanded funding for USDA conservation programs, some of which assist historically underserved forest owners.
Forestry cost share programs also exist at the state level, including in eleven of the thirteen southeastern states. Several states, including Kentucky, Michigan, North Carolina, and Oregon, directly target carbon benefits (Chizmar et al. Reference Chizmar, Parajuli, Bardon and Cubbage2021).
Federal and state tax codes provide subsidies in the form of tax deductions for reforestation or conservation (e.g., conservation easements). These kinds of tax incentives, in effect, subsidize forestry and increase the financial returns to private forest owners. Policy can also be used to increase the value or reduce the cost of forest-related labor to incentivize forestry and forest production (via job training and technical assistance programs, for example). Capital investments in facilities that use or produce wood products can also be subsidized. Government investment in wood products research and development subsidizes intellectual capital, potentially yielding lower-cost technologies or entirely new products and thereby potentially stimulating forestry and wood products industries.
Forest product consumer incentives
As with forest sector policies, consumer-oriented policies can increase financial returns to forest production. Following the logic of our economic assumptions, by increasing demand for wood products, policy incentives that target consumers can stimulate afforestation and reforestation, increase carbon storage in forest products, offset emissions from higher-emissions materials, or reduce emissions by displacing fossil fuels in the energy sector.
Consumer incentives fall into three broad categories. First, subsidies for using biomass energy and tax incentives for using wood construction materials can encourage the purchase and use of wood products by reducing their costs relative to alternatives. Second, renewable energy standards and procurement rules may dictate the use of forest or biomass products. Lastly, certification programs (e.g., US Green Building Council’s LEED rating system) promote the use of sustainable wood products.
GHG emitter incentives
Mandatory carbon policies, like a cap-and-trade program, that apply to GHG emitters (from any sector) could generate demand for forest and forest products sequestration, depending on allowable credit activities. In most cap-and-trade programs, companies can purchase carbon removal credits to meet their emissions reduction requirements. Two US regulatory cap-and-trade programs, the Western Climate Initiative and the eastern states’ Regional Greenhouse Gas Initiative, allow limited use of forest carbon credits. Any national cap-and-trade program would likely follow suit – for example, Title V of H.R.2454 - American Clean Energy and Security Act of 2009 (Waxman-Markey) lays out the structure of allowable agricultural and forest offsets.
Even without regulatory compliance programs, corporate and government net-zero commitments create demand for carbon credits and voluntary carbon markets (“net” refers to carbon accounting that includes CDR via forest sequestration or other approaches). Forest carbon credits are currently the most common source of CDR credits in both compliance-based and voluntary carbon markets. Voluntary markets take various forms (Pan et al. Reference Pan, Shrestha, Innes, Zhou, Li, Li, He, Sheng, Niles and Wang2022; Peters-Stanley et al. Reference Peters-Stanley, Goldstein and González2014). Hundreds of US companies now participate in voluntary offset markets, with offsets generated by dozens of forest owners and confirmed by verifiers who validate carbon storage.
Implementation of a US carbon tax could create similar incentives. A carbon tax might offset emissions with CDR credits or fund CDR efforts, including forest and forest product sequestration.
Both cap-and-trade and carbon tax policies raise the price of carbon-emitting goods and could drive demand toward wood substitutes for carbon-intensive materials like concrete and steel, potentially leading to higher demand for productive forestland.
Forest carbon policy landscape
Existing forestland accounts for 34% of US land area and is widely distributed outside the Great Plains and arid West (USDA Forest Service 2024a). The northwest (the northern Sierras to the Northern Rockies) has the greatest area of forest, followed by the South Central and Southeast regions, the Northeast, and northern North Central states. Even without conversion of additional land to forest, the forest carbon policy landscape is extensive.
Public vs private ownership
Of US forestland, 62% is privately owned, mostly in the East, and 38% is publicly owned, mostly in the West (USDA Forest Service 2024a). Public forest management is guided by relatively inflexible administrative rules, so public forests in the West are unlikely to provide substantial growth in CDR. Despite a large reforestation backlog on federal lands, the main source of new forests and new carbon-storing forest management practices will be private lands and agricultural lands, predominately in eastern states.
Interaction with the agricultural sector creates a perhaps underappreciated policy dynamic and a potential source of income shifting in rural areas. Some policies (e.g., subsidies) are available only to the private sector. Private landowners will be the primary participants in forest carbon credit markets because under current law, national forests (accounting for 75% of all public forestland) are not allowed to sell carbon credits. Some states and localities, however, have begun to generate and sell credits from the forests they own.
Forestland versus timberland
Policy incentives geared toward the wood products sector could foster carbon storage by encouraging practices that lengthen rotation cycles, shift to carbon-sequestering species, and reduce harvest residues. Here, we distinguish between forestland and timberland. Timberland is defined by its capacity for harvest and legal status (wilderness areas and parks are excluded, for example) and offers ample opportunities for enhanced carbon storage. Constituting two thirds of US forest, timberlands are concentrated in the Southeast, eastern South Central region, and portions of the northern North Central, Northeast, and northern Intermountain regions (dark purple areas in Figure 1) (USDA Forest Service 2024a). The Southeast’s robust timber economy accounts for more than 55% of the nation’s harvested roundwood products (Oswalt et al. Reference Oswalt, Smith, Miles and Pugh2019). Active management is essential for implementing policies that promote carbon storage through forest management techniques, and thus effective policies would target private lands and timberlands.
Percent county area in forestland (USDA Forest Service 2024a) and percent county forestland in timberland (USDA Forest Service 2024b), by county. The symbology classes represent data quartiles of each variable, with 16 total possible combinations when overlaid. Resources Planning Act Assessment regions labeled and shown in black outline.

Forest carbon policy should also prioritize less carbon-dense forests. Although old forests store considerable carbon, their growth rates are lower, limiting their ability to absorb additional carbon dioxide from the atmosphere. Young and middle-age forests, with faster growth rates, offer greater CDR potential. Additionally, reforestation and regeneration after timber harvesting amplify carbon sequestration capabilities.
The distribution of carbon stocks across regions highlights the importance of targeting less carbon-dense forests (Figure 2). The Pacific Northwest, northern North Central region, and Northeast, with some of the oldest forests, exhibit high carbon density. However, in recent years, western forests have approached near zero CDR because emissions from mortality and forestland losses have offset carbon accumulation through forest growth (Wear and Coulston Reference Wear and Coulston2015). In contrast, the Southeast and South Central regions, characterized by young commercial plantations, have lower carbon density but much higher CDR. This distribution underscores the potential for significant net carbon storage increases if policies target areas with lower current carbon storage, particularly non-forested lands where afforestation would augment carbon sequestration.

Family vs corporate ownership
Private forest owners derive benefits directly from their forests and provide services to communities through their management. Distinguishing private ownership types is important, however: owners of large tracts, whether family or corporate, have better access to the expertise required for policy program participation than small woodlot owners. Commercial forest owners can respond more swiftly to market signals than noncommercial forest owners (Newman and Wear Reference Newman and Wear1993).
Corporate forests have undergone major changes in recent decades (Gunnoe et al. Reference Gunnoe, Bailey and Ameyaw2018). Historically, most commercial ownership was associated with vertically integrated firms, which owned both forestland and wood products mills. However, by 2012, nearly all of these firms had divested their forests, most of which were then acquired by timber investment management organizations (TIMOs) or converted into real estate investment trusts (REITs). This transformation was driven by growing timber availability, transaction costs, and tax incentives (Butler and Wear Reference Butler, Wear, Wear and Greis2013; Zhang et al. Reference Zhang, Butler and Nagubadi2012). The divestiture of industrial forests also facilitated the transfer of some land to conservation organizations, like The Nature Conservancy, particularly for biodiversity protection (Stein Reference Stein2011). These transfers separate the ownership of ecologically valuable land from production forests, allowing for specialized management approaches.
Given their corporate structure and requirements for minimum dividend distributions, TIMOs and REITs have incentive to manage forests intensively, leading to higher harvest rates and increased planting activity (commercial lands – mostly TIMO and REIT owners – in general have the highest harvest and replanting rates of all landowners in all regions of the US, as shown in Wear and Coulston (Reference Wear and Coulston2023)). Their ready access to capital from investors enhances their ability to respond to market signals by investing in growing markets and divesting in contracting ones (Mei and Clutter Reference Mei and Clutter2020). Examining the overlay of TIMO and REIT ownership with production (Figure 3 and Figure 4), we observe that TIMO and REIT forest holdings coincide with high timber production and are most extensive in the South Central region, especially in east Texas and also in Maine (Sass et al. Reference Sass, Butler and Markowski-Lindsay2020).
Projected percent change in forest from 2012 to 2042 under a status-quo or business as usual scenario. Projections are from CALM, the Carbon and Land Use Model as described in Wear and Wibbenmeyer (Reference Wear and Wibbenmeyer2023a). Regions are separated by black outlines.

Volume of roundwood products produced in 2012 by county, in thousand cubic feet (MCF); includes saw logs, veneer logs, pulpwood, composite products, post-poles-pilings, and other products (excludes residential fuelwood) (USDA Forest Service Timber Product Output, personal communication, D. Wear, June 21, 2023). Regions are separated by black outlines.

Noncorporate ownership, primarily family forest owners, accounts for 40% of continental US forest land across 9.6M ownerships (BJ Butler et al. Reference Butler, Caputo, Robillard, Sass and Sutherland2021; Sass et al. Reference Sass, Butler and Markowski-Lindsay2020). The greatest concentration of family forestland is in states east of the 100th meridian (Butler et al. Reference Butler, Butler and Floress2022). Sixty percent of family owners hold less than 10 acres, but their forests account for less than 10% of total family forest acreage (Butler et al. Reference Butler, Caputo, Robillard, Sass and Sutherland2021).The proportion of US forests under family ownership is declining in all regions, with an average annual net loss of 2.5M acres (Butler et al. Reference Butler, Butler and Floress2022). One-third of this area is transferred to other ownership types; two-thirds is converted out of forest use. The evolving landscape of forest ownership has implications for policy and management.
The diverse demographics and management settings of family forest owners influence their participation in markets, access to capital, and even federal support. Race, often in combination with poverty, has affected community advantage, social vulnerability, and access to management technologies. The National Woodland Owner Survey shows that 5% (10.5M acres) of US family forestland is owned by 209,000 minority owners, and that minority owners are more likely to have smaller holdings (SM Butler et al. Reference Butler, Schelhas and Butler2020; USDA Forest Service 2013, 2018). The average size of a Black-owned forest holding was about 150 acres – less than one-third the average size of White-owned holdings (475 acres). This discrepancy arises from complex factors, including systemic racism and policy discrimination, socioeconomic disadvantage, and differences in forest management. And yet, research from one county in Alabama showed that Black populations living in areas with higher rates of Black property ownership are more likely to have greater values of well-being indicators (Fraser et al. Reference Fraser, Gyawali and Schelhas2005).
Survey data show that minorities are one third as likely to engage in forest management and participate in public programs, potentially leading to unprofitability, land loss, and deforestation (SM Butler et al. Reference Butler, Schelhas and Butler2020). Forest management is crucial to land retention because it facilitates forest health, profitability, and long-term sustainability. Public programs, such as the Forest Service’s Cooperative Forestry, provide some of those benefits through technical assistance and cost-sharing.
Forest owners may not engage in forest management or programs for many reasons, including distrust due to historical discrimination, lack of capital or access to credit, and lack of program awareness (SM Butler et al. Reference Butler, Schelhas and Butler2020; Hitchner et al. Reference Hitchner, Schelhas and Gaither2017). In particular, public services often provide greater absolute benefit for large forest holdings through economies of scale and market access, further disadvantaging minority owners of small forest holdings (BJ Butler et al. Reference Butler, Caputo, Robillard, Sass and Sutherland2021). The relative benefits of the programs for disadvantaged landowners are unclear.
Land-use change
The largest source of forest carbon emissions in the land sector is the conversion of forestland to non-forest uses (Wear and Boyd Reference Wear and Boyd2021). We have described how incentives and voluntary credit markets can increase the returns to forestland and thereby promote land-use change to forest. However, following our bedrock economic assumptions, a landowner will only convert land to forest if the economic benefit exceeds the cost. The main cost considered by a landowner is the opportunity cost of giving up the land in its original use. In other words, the economic return from forestry (including a subsidy, tax break, or carbon credit payment) must exceed the return from, for example, agriculture. This means we can predict which lands are most likely to change to forestry based on analysis of other land uses’ opportunity costs.
The value of timber as determined by wood products markets plays a significant and dynamic role in the pace and direction of land-use conversion to forest. High demand for wood products has either stabilized or expanded the extent of forestland (Hardie et al. Reference Hardie, Parks, Gottleib and Wear2000; Kim et al. Reference Kim, Wear, Coulston and Li2018; Lubowski et al. Reference Lubowski, Plantinga and Stavins2008, Reference Lubowski, Plantinga and Stavins2006; Wear and Boyd Reference Wear and Boyd2021). On net, between 1982 and 2012, 22M acres of rural land transitioned from agriculture to forest in response to the increasing value of forest uses relative to agricultural returns (Wear and Bartuska Reference Wear and Bartuska2021).
The demand for land in alternative uses creates opportunity for policy mechanisms that can encourage retention of existing forests – for example, compensation for carbon storage that could slow the rate of urbanization or the “development footprint” of economic growth. It also reveals where policy aimed at forest management or afforestation could be most effective – for example, areas where investments in carbon sequestration would be implausible or at least impermanent because of anticipated development pressures. Ultimately the effectiveness of policy depends on the amount of incentive required to prevent development and the resulting carbon benefits – i.e., maximizing the carbon benefit per unit cost of subsidy.
Figure 3 depicts CALM’s land-use predictions in the status quo scenario defined in Wear and Wibbenmeyer (Reference Wear and Wibbenmeyer2023a): no new forest carbon policy incentives are introduced and land-use change is consistent with recent patterns. The figure shows areas converting away from (purple) and into (green) forest. From 2012 to 2042, the result is a 2M-acre net loss of forestland, which would reverse two thirds of the 3M-acre gain observed between 1982 and 2012. High forest losses occurring along the Atlantic and Gulf coasts and in northwestern Washington result mainly from urbanization but may also arise from clearing for agricultural uses (US Department of Agriculture 2020).
Forest gains under the status quo scenario (which are lower than losses overall) are concentrated in parts of the South, especially west of the Mississippi. This pattern reflects, in part, the high opportunity cost of developed land in proximity to urban areas and urban growth on the eastern seaboard. Thus, without new forest conversion incentives, forestland is expected to decline in the coming decades. Forest climate policy might help arrest or reverse that decline by enhancing the returns to forest retention or expansion as evidenced by the successes of the Conservation Reserve Program (Hellerstein Reference Hellerstein2017).
Forest economies and employment
The wood products industry lies at the intersection of carbon policy and community welfare, linking forest utilization to the well-being of local communities. This sector provides not only rural employment and income but also a significant carbon storage pool: solid wood products can store carbon for a century or more in the built environment (Bergman et al. Reference Bergman, Puettmann, Taylor and Skog2014). The sector encompasses a wide range of products, from lumber and plywood to paper and paperboard. Softwood lumber and pulpwood are traded as commodities worldwide. Hardwood lumber products, primarily used in furniture production, are considered specialty products with widely varying prices.
The United States produces and consumes more wood than any other country (Wear et al. Reference Wear, Prestemon and Foster2016). The wood products industry’s production level peaked in the late 1990s, then declined in response to economic cycles, especially housing starts, and has gradually transitioned to utilization of more chipped material (Oswalt et al. Reference Oswalt, Smith, Miles and Pugh2019; Wear et al. Reference Wear, Wibbenmeyer and Joiner2023).
Changes in federal timber-harvesting practices in the West during the 1990s altered the regional distribution of production (Chen et al. Reference Chen, Lewis and Weber2016; Ferris and Frank Reference Ferris and Frank2021; Wear and Murray Reference Wear and Murray2004). Regional shares of production have stabilized, with the Southeast and South Central regions producing about 60% of all outputs, the Intermountain, Pacific Northwest, and Pacific Southwest regions producing about 17%, and the North and North Central combined producing about 23% (Figure 4).
The geography of wood production facilities and infrastructure shapes incentives and policy results. Incentives often target areas with existing mill, pulp and paper, and bioenergy infrastructure, where proximity to forestland reduces the costs of various forest management activities. Even when not explicitly targeted, existing infrastructure economically complements (reduces the costs of) forest management activities and transportation costs, thereby determining the economic feasibility of timber harvesting. In the absence of complete facility and infrastructure data, spatial production patterns can indicate existing capacity, as depicted by 2012 production in Figure 4.
The wood products industry is evolving, with wood-based biomass energy becoming more prominent because of global and national efforts to mitigate climate change. The shift toward using bioenergy to replace fossil fuels could lead to increased forest investments (IPCC 2022; US Department of State 2021). Wood-based biomass energy production has gained traction, especially in the Southeast, where wood pellets are manufactured and exported to Europe for electricity generation (Aguilar et al. Reference Aguilar, Mirzaee, McGarvey, Shifley and Burtraw2020). Still a relatively small share of total wood products (<5%), pellet production is concentrated in areas near deep-water ports and with access to international markets. Domestic biomass pellet manufacturing capacity and employment increased by 20% and 23%, respectively, from 2016 through 2022 (EIA 2022a). Most of this growth has been driven by the export market, where sales grew by roughly 80% from 2016 through 2022 (Figure 5).
Densified biomass sales (tons), by destination from 2016 to 2022 (EIA 2022a).

Some wood pellets are used for US electricity generation, though at low and decreasing rates (Figure 5). Uses include stand-alone facilities and co-firing with coal (Picciano et al. Reference Picciano, Aguilar, Burtraw and Mirzaee2022). In 2021, wood and wood products accounted for slightly less than 1% of US net electricity generation (EIA 2022b). In some locations, efforts to reduce wildfire risk through forest thinning could provide additional biomass for pellet production, though the sector has yet to signal interest in this material. Alternatively, this biomass could support local combustion-based bioenergy generation or gasification processes that generate renewable natural gas or sustainable aircraft fuels (Elias et al. Reference Elias, Dees, Cabiyo, Saksa and Sanchez2023).
Although biomass energy could generate local economic activity and reduce GHG emissions (Aguilar et al. Reference Aguilar, Sudekum, McGarvey, Knapp, Domke and Brandeis2022), analysis from Dahal et al. (Reference Dahal, Aguilar, McGarvey, Becker and Abt2020) finds that biomass power creates fewer jobs and less economic output than coal- or natural gas-fired power generation (the authors did not examine wind or solar) and shifts economic benefits away from fossil fuel regions and toward rural forest communities.
Over the past two decades, employment in the forest sector has closely paralleled the decline in timber production. The primary employment segments include solid wood products manufacturing, paper manufacturing, forestry and logging, and support activities for forestry. Employment in forestry and logging operations is distributed widely across forested regions, but paper manufacturing facilities tend to be more concentrated, often sited near water resources.
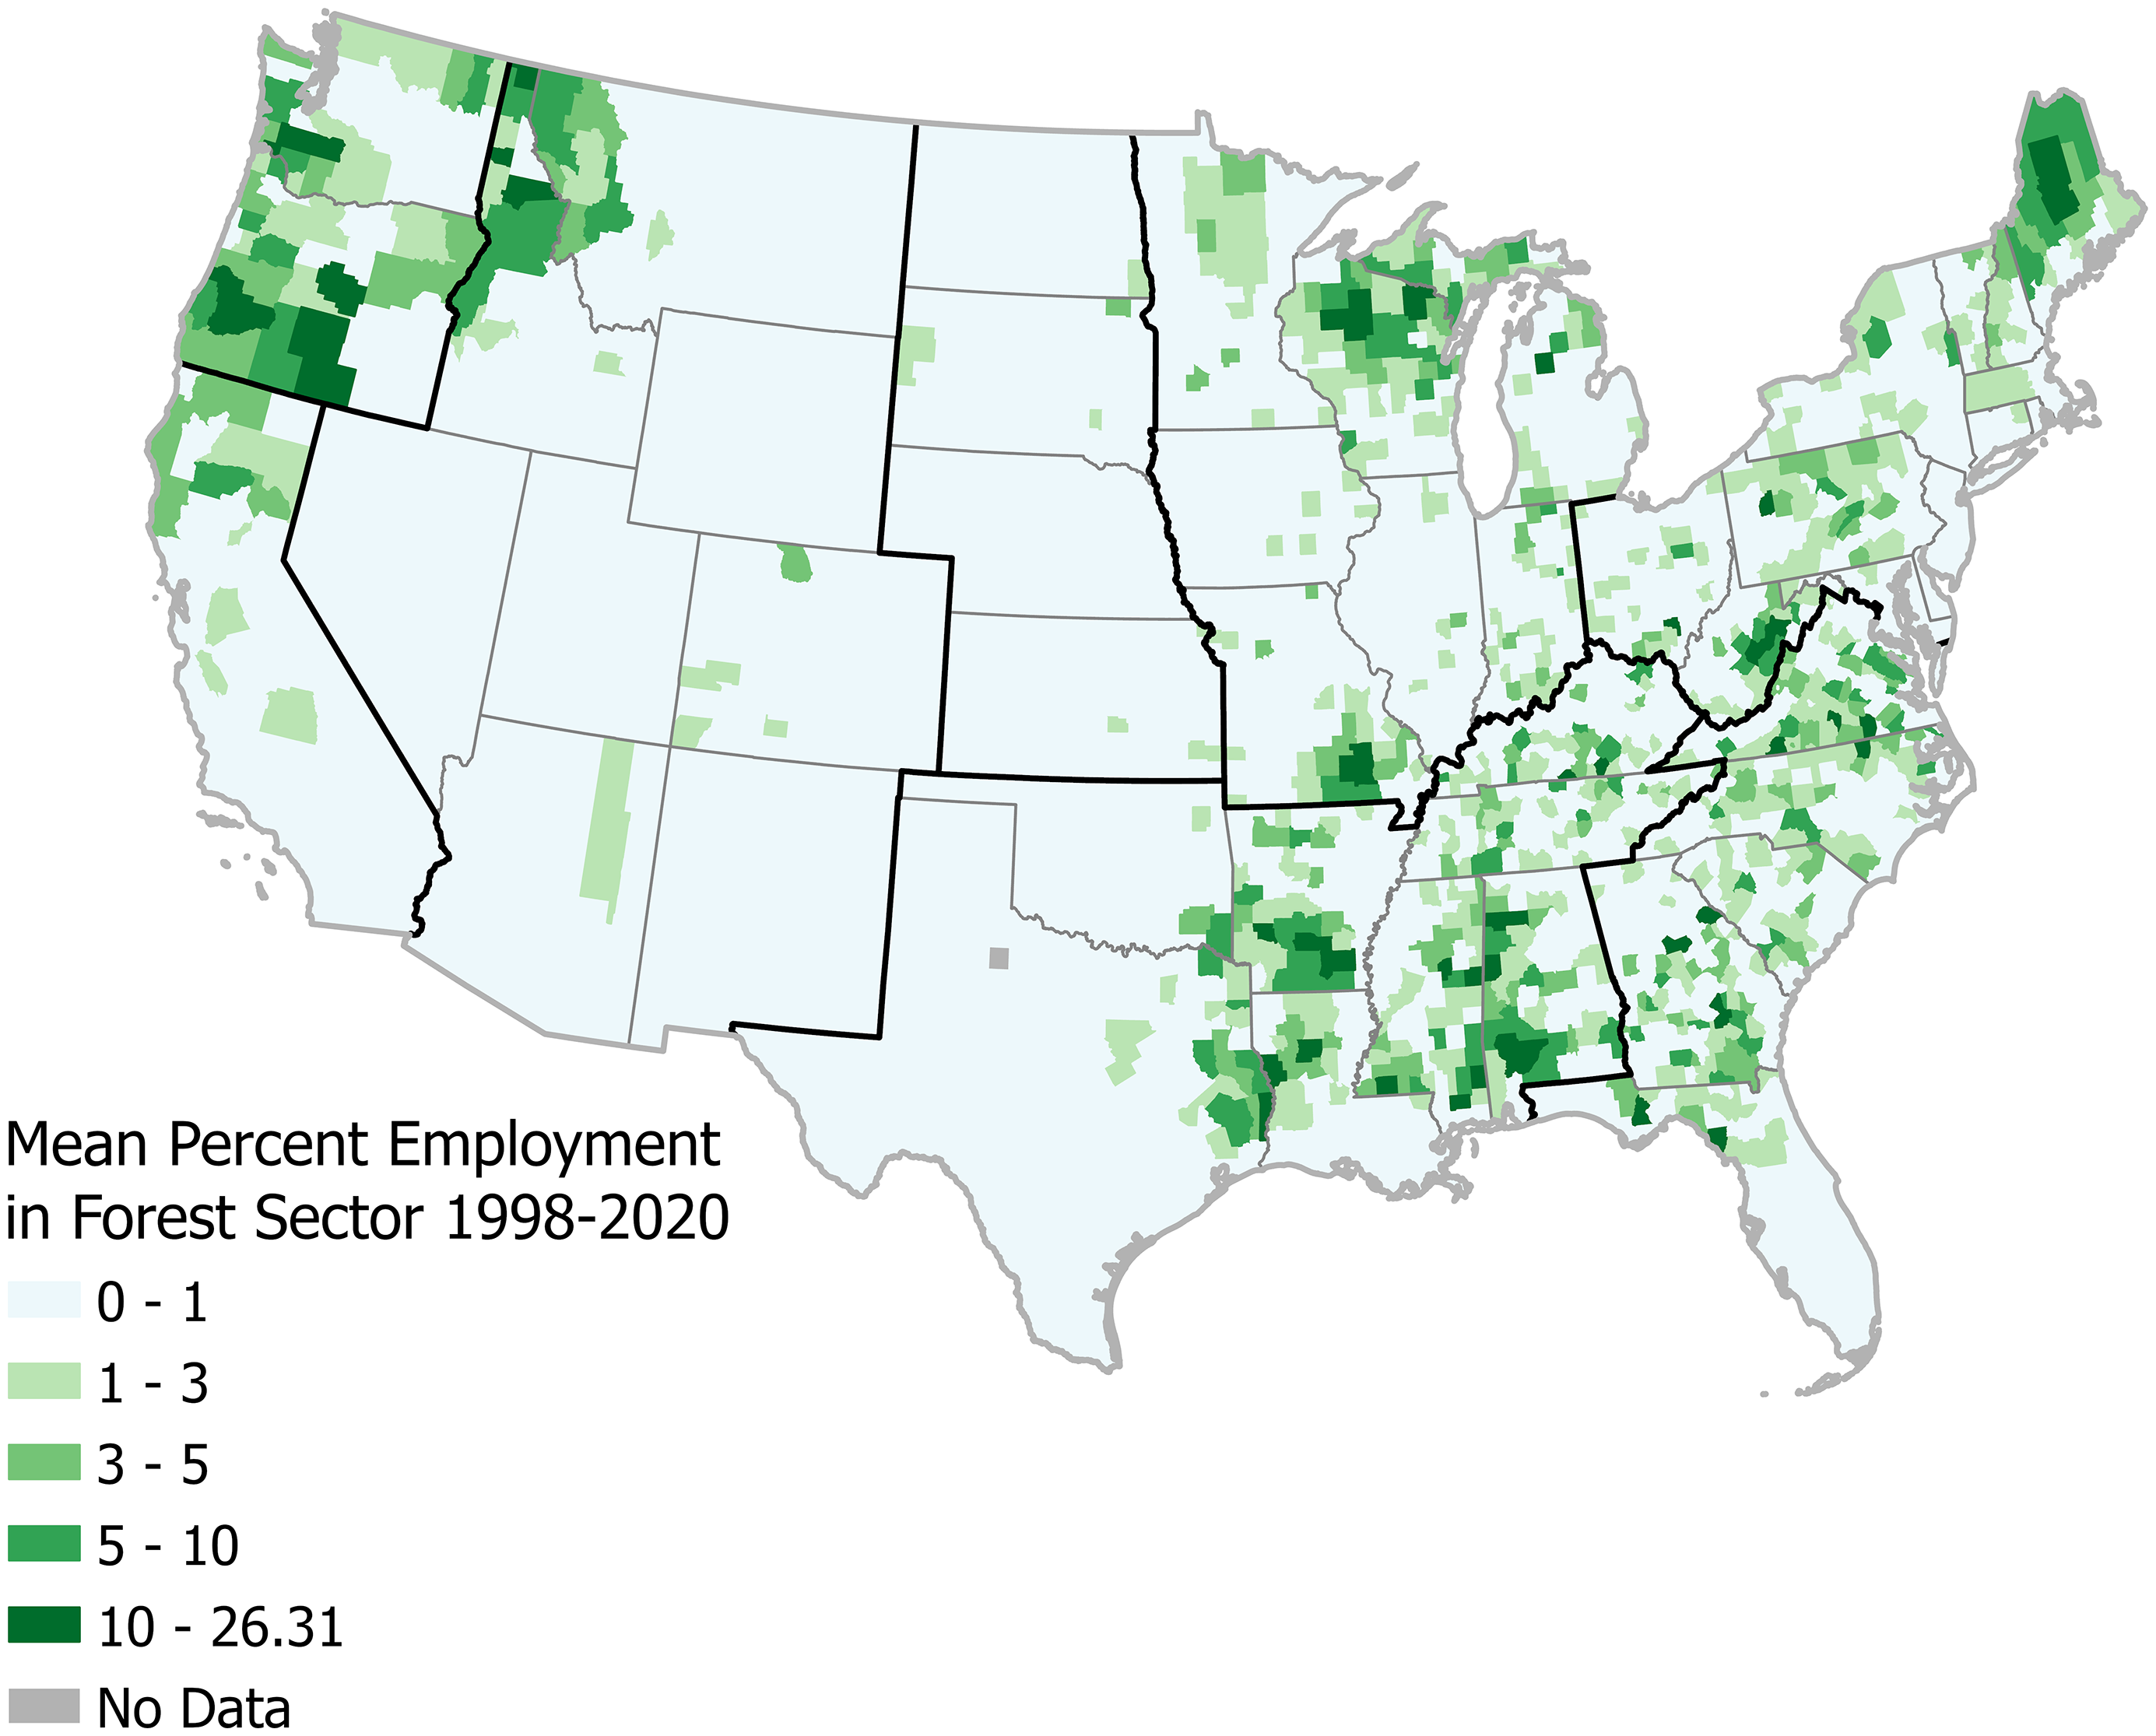
The significance of the wood products sector in local economies is reflected in the share of employment it provides. With an average of approximately 646,000 jobs between 1998 and 2020, forest sector employment accounts for 0.56% of total employment (US Census Bureau 2022). These figures have fluctuated over the years, with a peak of 0.78% in 1999 and a low of 0.37% in 2014. The distribution across counties is shown in Figure 6. Similar patterns are observed in payroll data. Notably, certain counties, especially in the South-Central and northern North Central regions, have seen net gains in wood products employment, while losses have been widespread in regions such as the northern Intermountain, northern California, southern Oregon, and Wisconsin. The South and Pacific Northwest stand out as major production regions. The Midwest, eastern Sierras, and Northeast maintain high employment shares because they have lower population densities and limited alternative economic opportunities.
Mean percent of total county employment in wood product sectors from 1998 to 2020 (US Census Bureau 2022a). Wood product sectors included here are forestry and logging (NAICS 113), support activities for forestry (NAICS 1153), wood products manufacturing (NAICS 321), and paper manufacturing (NAICS 322). Regions are separated by black outlines.
Some communities facing projected forestland decreases under a projected status quo scenario have forestry businesses and employees who cannot readily transition to alternative livelihoods (Carroll et al. Reference Carroll, Blatner, Frederick, Schuster and Findley2000). These communities may experience economic losses unless new forest carbon policies direct a shift toward a forest carbon economy (Brandeis and Zhimei Reference Brandeis and Zhimei2016; Rasker Reference Rasker2017).
Forest communities and disadvantage
The concept of forest dependence has grown out of natural resource-based economic dependence, including agriculture, minerals, oil and gas, and recreation (Haynes Reference Haynes2003). These concepts have been used to assess community reliance and resilience based on the intensity of a local sector economy relative to other sectors, where a significant portion of the population is financially supported by it, directly or indirectly. While there are other ways that local natural resources benefit community well-being through culture, subsistence use, social ties, and environmental services, we focus here on economic dependence (Stedman et al. Reference Stedman, White, Patriquin and Watson2007). Recent work quantifying forest dependence is leveraged to identify communities that have been reliant on the forestry sector over the last two decades and are thus likely to be impacted by policies targeting forestry markets (Frey et al. Reference Frey, Kallayanamitra, Wilkens and James2022).
We assess communities heavily reliant on working forestland and forest products industries, focusing on those that are tribally owned or experiencing persistent poverty. We evaluate the extent to which a county relies on the forest sector for its employment (10%) and income (15%) based on US Census County Business Patterns data (Frey et al. Reference Frey, Kallayanamitra, Wilkens and James2022). The former criterion reflects the portion of the population relying on forestry jobs, while the latter reflects the quality of those jobs (Stedman et al. Reference Stedman, White, Patriquin and Watson2007). A total of 244 counties are classified as economically forest dependent (Figure 7). Their location roughly corresponds to areas with high concentrations of timberland, but the correspondence is not perfect, likely because of overall economic activity associated with concentrations of forest products industries. These regions stand to gain if climate policies encourage traditional wood products consumption, but reduced consumption would disproportionately harm them. The share of wood products income or employment is in part determined by the overall structure of the local economy: timber production can have outsized effects on areas with relatively low rates of timber production but high employment shares. These are generally more remote areas with low economic diversification.
Forest-dependent counties, identified by following forest sector employment share (10%) and payroll share (15%) thresholds (Frey et al. Reference Frey, Kallayanamitra, Wilkens and James2022). Employment and payroll shares (US Census Bureau 2022a) were calculated for each year from 1998 to 2020, and the mean share across the time period was used to determine county status. Regions are separated by black outlines.

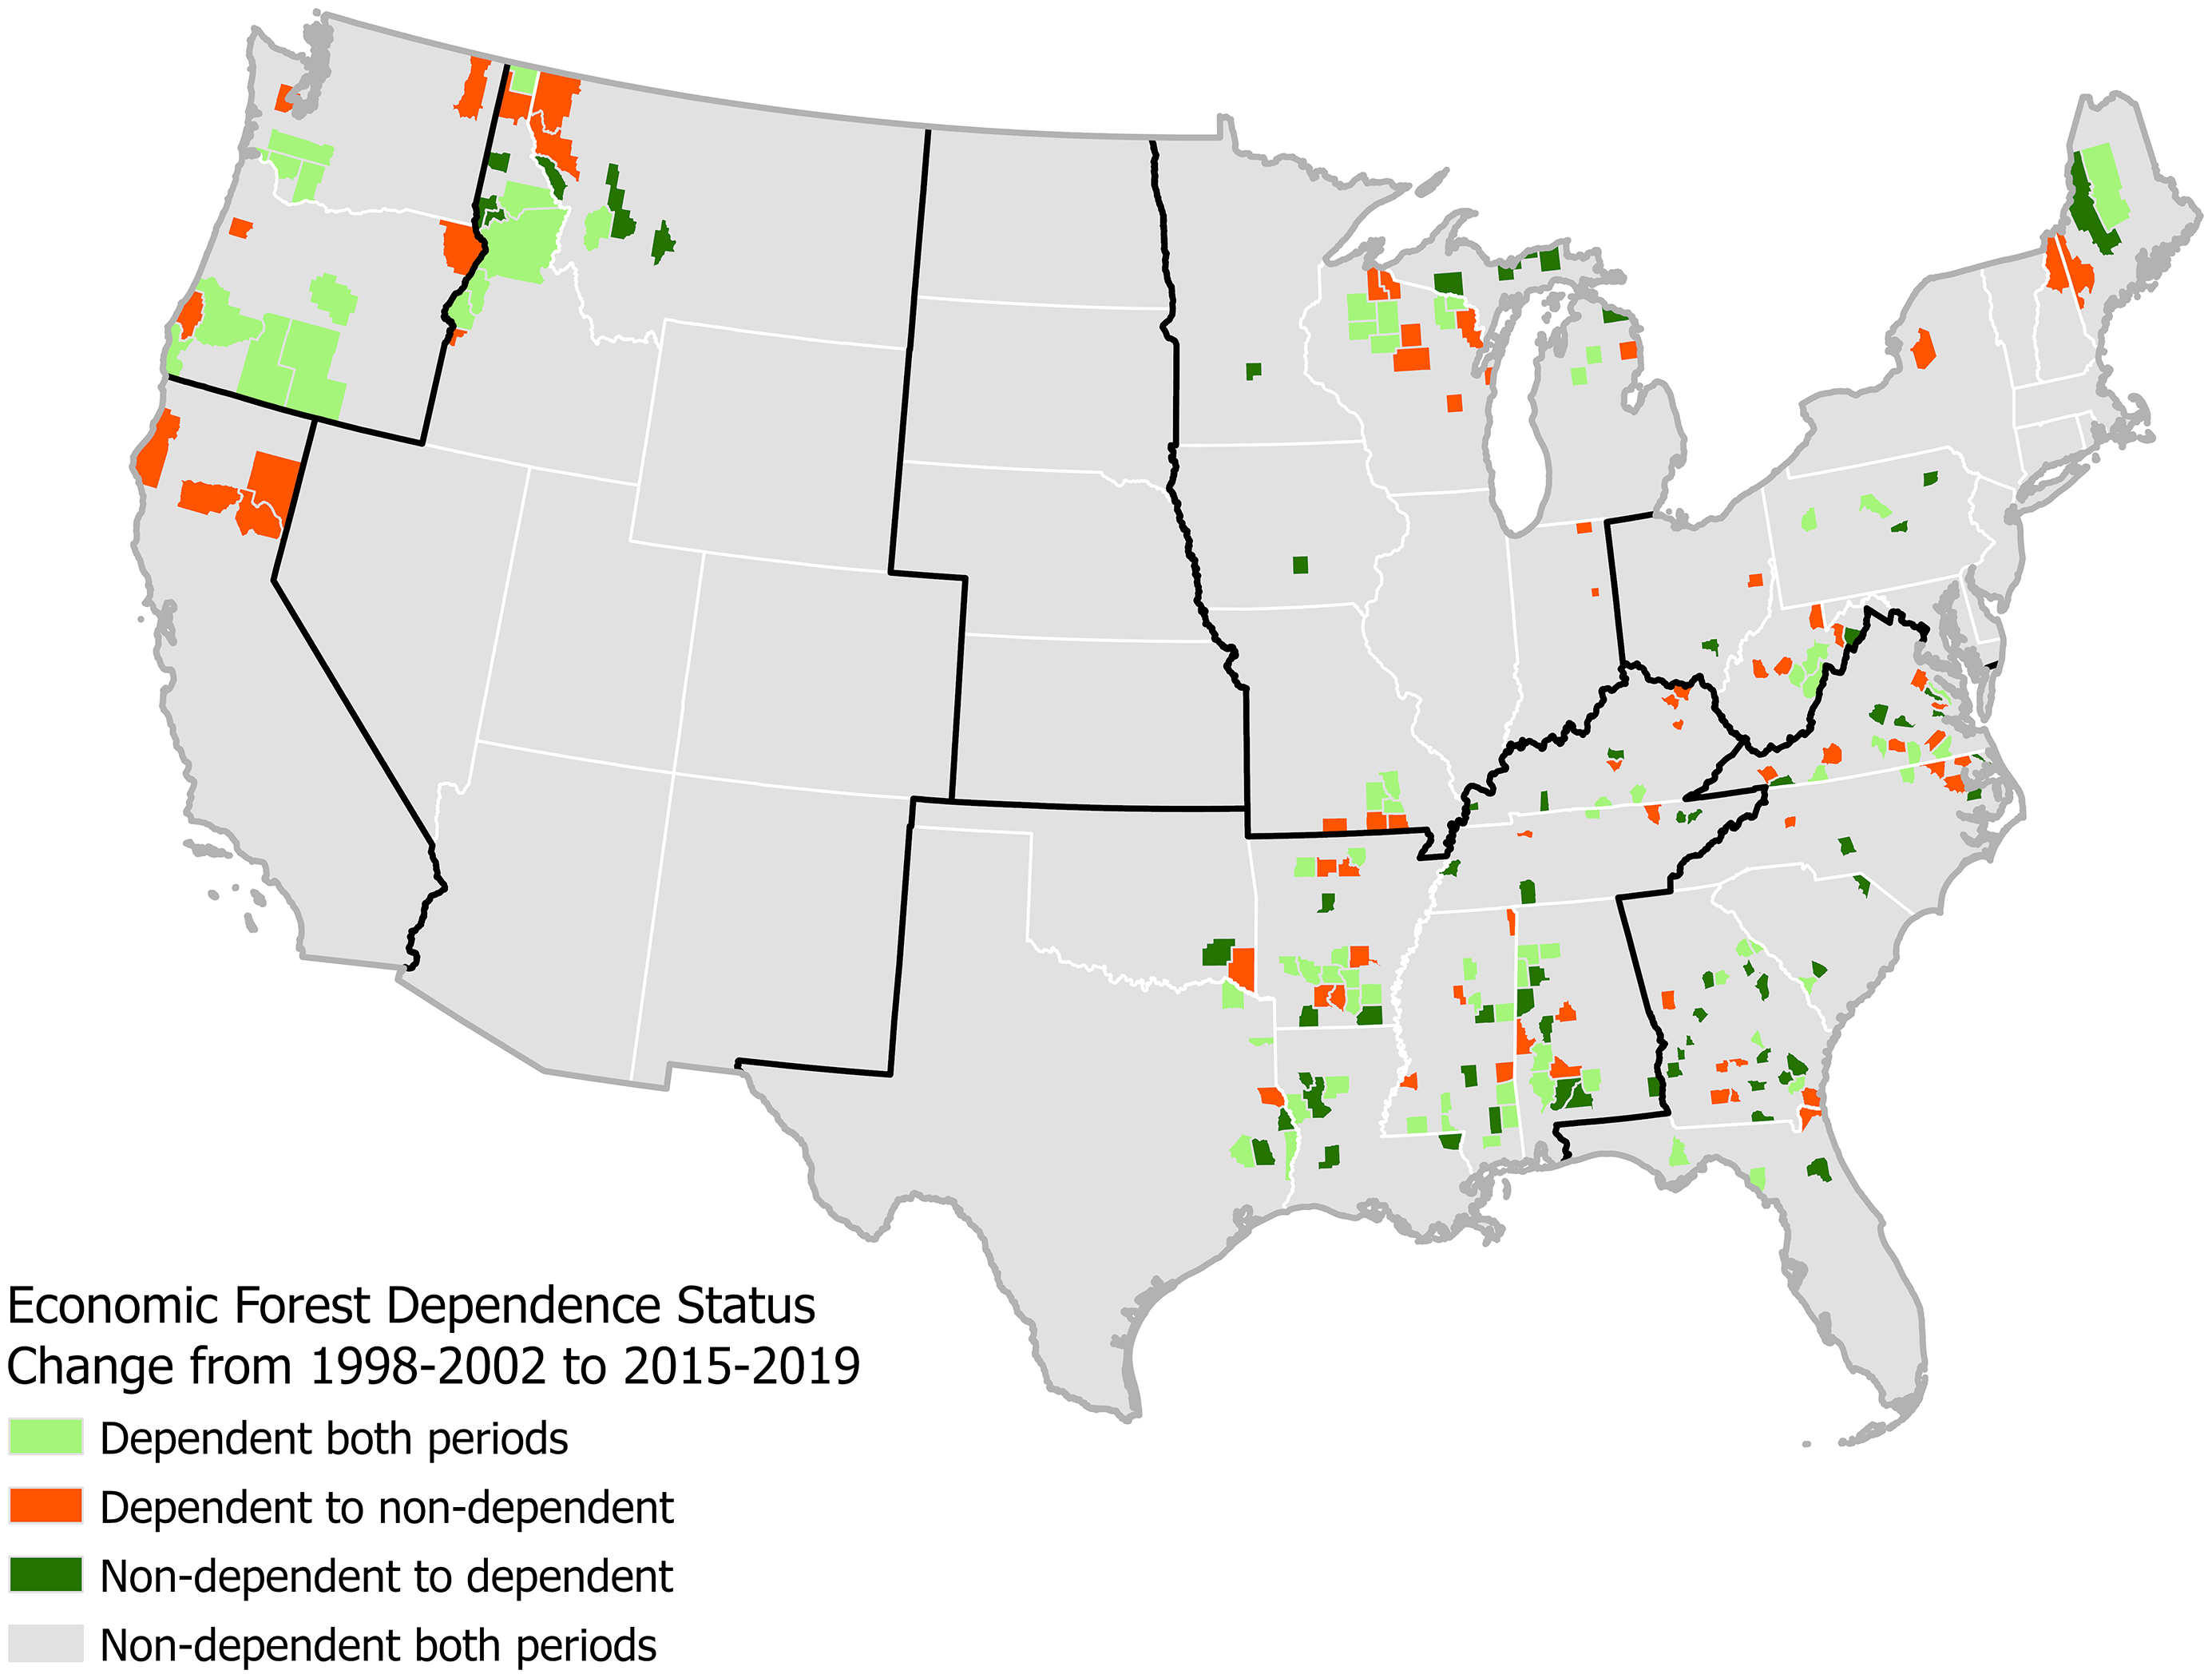
Counties whose dependence status has changed between circa 2000 and circa 2017 are somewhat evenly distributed across forestry-intensive regions, with some notable patterns (Figure 8). For instance, Coös County, New Hampshire, shifted to non-dependent status after paper mill closures caused forestry job losses and payroll reductions (New Hampshire Employment Security Economic and Labor Market Information Bureau 2007). Paper mills are the sector’s largest processing facilities in terms of capital investment, employment per unit output, income per employee, and total value added to harvested timber. Closures represent structural rather than marginal changes in local economies, with broad, long-term implications. For example, four counties in northern California whose status changed from dependent to non-dependent saw significant decreases in indicator values: the average decrease in percentage of county employment and payroll in forestry was 6% and 10%, respectively.
Change in forest dependence status, by county, between 1998–2002 and 2015–2019. Forest-dependent counties are based on forest sector employment and payroll (US Census Bureau 2022a) share thresholds of at least 10% 15%, respectively (Frey et al. Reference Frey, Kallayanamitra, Wilkens and James2022). Regions are separated by black outlines.
Areas with persistent forest dependence are vulnerable to future production declines. Transitioning counties may already be destabilized by sector-related economic downturns, or policy-driven production increases in these areas could yield significant economic benefits.
Roughly half of all forest-dependent counties (n = 114) can be categorized as either Tribal or high-poverty communities (Figure 9). In these areas, economic opportunities are fewer and the sector is likely critical for community economic stability. Overlaps between the two categories occur mainly in the South Central, Southeast, Northeast, northern North Central, and Pacific Northwest regions. Sixty forest-dependent counties have persistent poverty; all are in the Southeast. Another 60 forest-dependent counties are coincident with Tribal areas, and six counties are classified as both.

In disadvantaged, forest-dependent counties, approximately 75% of the land is forested (Table SI 2). Private timberland accounts for nearly 90% of forest area in persistently impoverished areas. In Tribal forest-dependent counties, a large portion of forestland is federally owned, and only 61% is private timberland, some of which is held in federal trust.
As expected, forest-dependent and impoverished counties are relatively rural, with 73% of their population residing in rural areas and a 42% share of minority populations (substantially higher than the 25% share of minority populations nationally). Both impoverished and Tribal forest-dependent counties exhibit higher rates of corporate ownership (34% and 28%, respectively) than other counties (19%). About half of the forests in dependent and impoverished areas is owned by families, emphasizing the significance of family ownership issues. One such issue, especially prevalent in the southeastern region, is heirs’ property rights challenges. The practical constraints faced by owners of heirs’ property limit their access to government programs and credit for timberland management (Bailey et al. Reference Bailey, Barlow and Dyer2019). In contrast, forests in Tribal forest-dependent counties are mainly public because the western Intermountain, Pacific Northwest, northern North Central, and Northeast regions have high federal, state, and local government ownership rates, respectively.
Discussion of impacts
Current forest carbon incentives focus on established practices: no technological shifts are imminent, and significant short-term structural change is unlikely. However, policies promoting increased wood production may gain momentum in the long run, driven by goals like reducing GHG emissions through wood construction (Winchester and Reilly Reference Winchester and Reilly2020). This shift would require infrastructure investments and efficient transportation networks. The exception, with a near-term potential for change, concerns corporate versus family ownership and small versus large forest operations. Existing policies favor larger entities because of administrative requirements, and this bias may continue with expanding carbon credit programs.
We explore the consequences of three broad policy strategies to expand or retain carbon storage in forests and forest products and to reduce forest carbon emissions:
-
1. Increase forest carbon storage primarily through afforestation, plus reforestation and management of forest age structure, species composition, and health.
-
2. Promote forest carbon credit markets.
-
3. Increase the harvest of carbon-storing forest products (e.g., building materials, pulp and paper, biomass for energy production) to store carbon or offset emissions.
Afforestation
CDR from forests could be enhanced through policies that expand forest area. We have presented the CALM model results of a status quo land-use change scenario (Forest carbon policies section). Now consider a carbon policy scenario where carbon incentives (government or carbon credit market payments) are sufficient to generate an additional 3M acres of forest per year for the next 10 years, leading to an additional 25M acres of forest in the US in 2062, after accounting for forest losses due to land-use changes (Wear and Wibbenmeyer Reference Wear and Wibbenmeyer2023b). Figure 10 maps the CALM model results of predicted afforestation locations, with an overlay of forest-dependent communities.
Projected percent change in forest area by county from 2012 to 2042, as modeled using CALM, and forest dependent and disadvantaged community status (Wear and Wibbenmeyer Reference Wear and Wibbenmeyer2023a). Regions are separated by black outlines.

The greatest growth in CDR would come from afforestation, whose potential is highest east of the 100th meridian, especially in the South Central region. Land-use projections indicate that this region has lower probabilities of development and higher propensity to shift from agriculture to forest uses. The interaction with the agricultural sector presents an important and perhaps underappreciated policy dynamic and a potential source of income shifting in rural areas.
Afforestation projected by CALM occurs mainly on private agricultural land and away from areas with anticipated urbanization pressure. Therefore, a large majority of any additional CDR from forests would come from afforestation of private agricultural lands, as well as management of existing private forests.
Because it derives from non-forest land uses, the ownership profile of newly forested land is unclear: the land would likely come from either commercial or family farm owners and may be accompanied by ownership changes. This suggests that the interaction between farm and forest sectors is important for climate policies.
Afforestation policy would be most likely to succeed in the Southeast and South Central regions, with their concentration of corporate ownerships, productive forests, and a strong forest products industry. In these regions, afforestation policy would likely further incentivize corporate actors like TIMOs and REITs to expand their landholdings. The Northeast and Northwest, in contrast, would be better targets for incentives for carbon management in existing forests, such as extending forest rotations and transitioning species composition to increase the carbon density.
Another mechanism for protecting forest carbon stocks and expanding forest carbon sinks is avoided deforestation, especially in regions with high-carbon forests. The status quo projections indicate especially high carbon emissions associated with expected land-use changes in the Pacific Northwest and eastern seaboard, roughly corresponding to areas of urban growth. Runs of the CALM model indicate that carbon benefits of avoided deforestation generally exceed those from additional afforestation over the simulation period (to 2062) by a factor of 40–100% (Wear and Wibbenmeyer Reference Wear and Wibbenmeyer2023a). Smart-growth or avoided deforestation policies may be deployed to preserve existing forests and their stored carbon. If so, a natural geographic target for those policies is places where development pressure is greatest – but this emphasis would need to be balanced against the higher per acre costs of subsidies in these areas.
Correspondence between likely afforestation areas and forest-dependent communities is weak. Communities near unforested land – where afforestation could occur – are less likely to be forest dependent. Forest-dependent communities are much more likely to be affected by policies that change forest management and forest production. Figure 10 compares the locations of predicted afforestation with forest-dependent communities.
For example, forest-dependent communities in Maine, Oregon, and northern Wisconsin are less likely to benefit from afforestation because these areas are already densely forested. However, in the Southeast and South Central regions, some forest-dependent communities could benefit from the expansion of forests into agriculture-dependent communities. In some cases, this could lead to increased forestry activity, such as planting and management, near forest-dependent communities and create jobs in the forest sector.
Substantial CDR benefits could also come from reducing the deforestation associated with urbanization. Carbon emissions from deforestation could be reduced by targeting smart-growth policies to areas where development and deforestation projections correspond with high forest carbon density – especially in the Pacific Northwest and Atlantic Coast.
Forest carbon credit markets
Large corporate forest owners are strategically positioned to capitalize on policy incentives and participate in forest carbon credit markets. They benefit from economies of scale, access to capital, administrative resources, and well-documented management practices. Third-party companies and NGOs are also likely to respond to offset incentives.
In contrast, noncorporate, family-owned forests face higher startup costs and struggle to achieve economies of scale in carbon program management ( Markowski-Lindsay et al. Reference Markowski-Lindsay, Stevens, Kittredge, Butler, Catanzaro and Dickinson2011). Programs could offer support for underserved forest landowners (Schelhas et al. Reference Schelhas, Hitchner and Dwivedi2018). Although barriers to participation don’t necessarily lead to ownership consolidation, the transaction costs associated with unfamiliar programs would tend to favor larger corporate owners and may promote ownership consolidation. The Family Forest Carbon Program developed by the American Forest Foundation and The Nature Conservancy attempts to overcome these barriers by providing technological support (largely based on USFS FIA data) and expand market access for small landowners. Natural Capital Exchange Inc. (NCX) similarly provides tools for small landowners to engage in carbon and other ecosystem service markets.
Because carbon credit markets favor the participation of large corporate forest owners, these markets are unlikely to benefit forest-dependent communities. Gains from corporate participation often flow to remote corporate entities rather than supporting local economies. (Absentee ownership, even for smaller corporate or non-corporate lands, will also tend to shift economic benefits away from local communities.)
Carbon credits from existing forests result from changes in forest management, like extending timber harvest rotations. Although this may create some new jobs in the short run, longer rotations can reduce harvesting employment, potentially affecting forest-dependent communities, particularly those reliant on corporate employment. Long-run effects are unclear, however, because the additional forest growth of extended rotations increases timber harvest volume. Notably, a recent study highlights that more than 25% of current forest carbon offset credits are susceptible to wildfire risks, emphasizing the need for participants in the carbon credit marketplace to support wildfire risk reduction programs and policies (Kaarakka et al. Reference Kaarakka, Rothey and Dee2022).
The geographic concentration of large corporate forest ownerships, like TIMOs and REITs, indicates where forest carbon credit programs will likely succeed. Figure 11 overlays TIMO and REIT concentration with forest-dependent communities. The areas of overlap in Maine, Mississippi, and Alabama raise concerns about job losses, since changes in corporate forest management to generate carbon credits could depress harvesting employment. However, if carbon credits are generated through harvest reductions, commercial owners may expand their forest holdings to offset the reduced harvest levels. This could benefit forest-dependent communities in areas with smaller, non-corporate landowners, but only if barriers to credit market participation for disadvantaged and small landowners are reduced (e.g., by substantial technical and programmatic assistance).
Percent of all county forestland in TIMO or REIT ownership (Sass et al. Reference Sass, Butler and Markowski-Lindsay2020) with an overlay of forest-dependent and disadvantaged community status. Regions are separated by black outlines.

Forest carbon credit markets, although beneficial for achieving climate goals, may inadvertently disadvantage small forest owners and forest-dependent communities. Participation in these markets will be more accessible to corporate forest owners, particularly TIMOs and REITs, because of their technical and administrative capabilities. This dynamic may lead to further corporate expansion through the acquisition of small corporate and family forests, potentially affecting certain forestry jobs, like harvesting.
The benefits of carbon markets and other climate policies may not be fully realized by local forest owners and communities. Many REITs are publicly traded, and corporate forests in general are held by absentee owners. To be clear, forest carbon credit markets can help support the sector and achieve climate goals; they are not necessarily bad for forest-dependent communities. Rather, we suggest that greater attention, and resources, be devoted to leveling the playing field – via technical support, for example – so that small forest owners can participate and benefit. Effective participation will likely require investment aggregators, such as the Family Forest Carbon program being developed by the American Forest Foundation and The Nature Conservancy.
Expanded wood products production
The wood products sector creates a nexus between carbon policy and community welfare, providing rural employment and income. Wood products are the second most important storage pool of forest carbon, since solid wood products can store carbon for a century or more in the built environment.
Forest carbon policies that incentivize greater use of wood products will tend to benefit communities with existing production infrastructure because mills and bioenergy facilities are already located near forests, available transport, and markets.
Bioenergy production is driven by timber availability, infrastructure, productivity, and demand. Carbon incentives for wood products or bioenergy production are likely to be leveraged in the Southeast and South Central regions, with notable pellet production in northeastern states. Expanded wood-based bioenergy production could alter the geography of demand, potentially intensifying production in the Midwest and Northeast.
Growth in bioenergy production could generate ripple effects across the wood products sector, with implications for many regions. Overall, expanded domestic use of wood bioenergy would increase demand for wood, boost employment, and attract investment in timber production, primarily by corporate owners.
A wood products sector could also develop in certain western areas where the need (and federal funds) for woody biomass removal as a wildfire management strategy coincides with infrastructure that can absorb the biomass into production. Also noteworthy are emergent initiatives focused on building infrastructure to use biomass from fuel treatments, such as Colorado’s Wood to Energy Program (Colorado State Forest Service 2023) and The Nature Conservancy’s efforts in California (Porter and Longcor Reference Porter and Longcor2020).
Policies that expand demand for wood products will give communities with existing plants and workers an advantage, and forest-dependent counties are more likely to have both. The correspondence of forest-dependent high-poverty communities with mill capacity in the South Central and Southeast regions suggests that carbon policies to boost wood products are likely to boost employment as well, with correspondingly beneficial wage, tax revenue, and local community business effects. This is true particularly in the near term (Figure 12).
Percentage of southeastern counties with mills in 2020 (USDA Forest Service 2022) and pellet plants in 2023 (Biomass Magazine 2023), by county type. Figure reflects only counties in states with complete mill location data in the southern Timber Product Output database (Alabama, Arkansas, Florida, Georgia, Kentucky, Louisiana, Mississippi, North Carolina, Oklahoma, South Carolina, Tennessee, Texas, and Virginia).

Nevertheless, we see the possibility of expanded production capacity in other regions as well. We noted earlier that greater wood bioenergy production (through either combustion or thermochemical methods) could lead to new or expanded facilities where energy production is needed, and the wood inputs and their transport can be provided cost-effectively. This includes areas where biomass is removed from forests as a wildfire risk reduction strategy (largely in the West). Production at facilities that produce biochar and biological carbon removal and storage could also be stimulated by more aggressive CDR policies. Note that the broad geographic distribution of existing pellet plants already places them in proximity to forest-dependent communities (Biomass Magazine 2023).
Conclusion
US forests provide consequential carbon dioxide removal benefits. Strategies for decarbonizing the US economy anticipate a long period of continued CDR from the nation’s forests. Baseline projections from CALM indicate that without policy intervention, the rate of CDR by forests is declining because of land-use losses, fire emissions, and slowing growth rates (Wear and Wibbenmeyer Reference Wear and Wibbenmeyer2023b; Wear and Coulston Reference Wear and Coulston2015).
We have reviewed new policies and funding sources to expand forest carbon storage and reduce GHG emissions from wildfire that will alter the economic and regulatory conditions that shape the nation’s working forests, affecting those and adjacent communities. Increased government funding and private sector investments in forest restoration, afforestation, and the buildout of wood products markets will likely have net economic and environmental benefits. However, the benefits may not be evenly distributed, and some stakeholders – small forest owners, wood products companies and workers, vulnerable and Tribal communities, and areas historically dependent on the forest sector – may suffer.
About half of forest-dependent counties are coincident with disadvantage. That intersection of dependence and disadvantage highlights where forest economies are vulnerable and where the wood products sector could contribute to rural development goals. Increasing production in these areas would likely have substantial economic benefits. High concentrations of large corporate forest owners, like TIMOs and REITs, may indicate where certain forest carbon policies will be most effective.
Below we summarize our modeled findings of how the several forest carbon strategies would play out.
Afforestation
Policies to expand forest cover and increase carbon density would boost forest-based CDR, especially in the South Central region. Most CDR growth will come from improving management of private forests and converting agricultural land to forest. Despite a reforestation backlog on federal lands, private lands will be the primary source of new forests. CDR, mainly through afforestation, could be enhanced in areas less subject to development, potentially reshaping rural income dynamics.
Forest carbon credit markets
Forest carbon credit markets, though vital for climate goals, might inadvertently disadvantage small forest owners and communities. These markets favor corporate forest owners, particularly TIMOs and REITs, that have technical and administrative capabilities. Benefits to corporate owners and operators, especially with publicly traded REITs and absentee owners, are unlikely to accrue to forest-dependent counties. To be sure, carbon markets can benefit the sector and help achieve climate goals. But special attention should be given to policies that support equitable access to these markets, such as technical support that enables small forest owners to participate and support for investment aggregators, such as the Family Forest Carbon program.
Expanded wood products markets
Policies that promote wood products are likely to immediately benefit communities in the South Central region, where high-poverty forest-dependent communities are concentrated. Longer-term, expanded wood bioenergy, expanded use of CDR technologies like biochar, and wood construction incentives could lead to new and reinvigorated production across the country.
Concluding remarks
This study provides a broad contextual foundation for evaluating how individual climate policies and strategies could affect private landowners and disadvantaged communities. Our national-level study implemented at the county scale sketches out these effects and considerations for policy design but cannot address all elements of these distributional questions. A county-level analysis does not allow for examination of the relationships between forest dependence and socioeconomic characteristics (e.g., total income, minority status) for embedded communities at the household or business establishment level (e.g., Nerfa et al. Reference Nerfa, Rhemtulla and Zerriffi2020; Talpă et al. Reference Talpă, Lozan, Hălălișan and Popa2022). The ability to leverage individual household or business data could differentiate vulnerabilities, challenges, and opportunities for different categories of community stakeholders. Future research that allows for this differentiation could help guide policy design and program investments to better promote economic resilience, social equity, and environmental sustainability outcomes.
Supplementary material
The supplementary material for this article can be found at https://doi.org/10.1017/age.2025.10012
Data availability statement
Source data used in this analysis are publicly available.
Acknowledgements
The authors gratefully acknowledge financial support from the US Endowment for Forestry and Communities, a not-for-profit corporation that works collaboratively with partners in the public and private sectors to advance systemic, transformative, and sustainable change for the health and vitality of the nation’s working forests and forest-reliant communities. The authors also thank Margaret Walls, Daniel Raimi, and Robin Young for their contributions.
Funding statement
This work was supported by the US Endowment for Forestry and Communities under grant number 22-00322.
Competing interests
The authors have no competing interests to declare.


 Open access