


1. Introduction
In actuarial science, credibility theory plays a central role in premium estimation by integrating individual claims experience with information from the broader portfolio. Originating from early actuarial efforts to reconcile individual risk assessment with collective experience, it provides a statistically grounded approach for balancing sensitivity to recent data with the stability of estimates. Early contributions to limited fluctuation credibility, such as those by Mowbray (Reference Mowbray1914) and Whitney (Reference Whitney1918), laid the foundation for more advanced credibility methods by introducing techniques to account for risk heterogeneity while maintaining estimation stability.
A major advancement in credibility theory came with the development of greatest accuracy credibility, which minimizes the squared-error loss of linear estimators when estimating an insured’s pure risk premium and serves as the cornerstone of classical credibility models. Notable contributions include those of Keffer (Reference Keffer1929), Bailey (Reference Bailey1943, Reference Bailey1950), who pioneered early credibility models, and Bühlmann (Reference Bühlmann1967, Reference Bühlmann1970), Bühlmann & Straub (Reference Bühlmann and Straub1970), whose work led to the establishment of the Bühlmann and Bühlmann-Straub credibility models. These models assume an optimal linear structure, combining individual and collective experience. However, as noted by Yan & Song (Reference Yan and Song2022), Bühlmann’s linear Bayesian credibility estimators lack robustness and are highly sensitive to heavy-tailed excess claims, potentially leading to significant estimation errors when approximating a nonlinear Bayesian credibility estimator.
Building on the foundational work of Bühlmann (Reference Bühlmann1967) and Bühlmann & Straub (Reference Bühlmann and Straub1970), researchers have developed credibility methods from various perspectives. Künsch (Reference Künsch1992) introduced a linear credibility estimator in which claims are replaced by a robust
 $M$
-estimator, while Gisler & Reinhard (Reference Gisler and Reinhard1993) examined the application of robust credibility within the general Bühlmann-Straub model. Pitselis (Reference Pitselis2008) applied robust statistical methods to regression credibility estimation using the influence function approach of
$M$
-estimator, while Gisler & Reinhard (Reference Gisler and Reinhard1993) examined the application of robust credibility within the general Bühlmann-Straub model. Pitselis (Reference Pitselis2008) applied robust statistical methods to regression credibility estimation using the influence function approach of
 $M$
-estimators. The asymptotic optimality of pure robust credibility was later established in Pitselis (Reference Pitselis2013). Further, robust estimators have been extended naturally to credibility theory for generalized mixed linear models (see, e.g., Nelder & Verrall, Reference Nelder and Verrall1997; Garrido & Zhou, Reference Garrido and Zhou2006; Lai & Sun, Reference Lai and Sun2012; Erdemir & Sucu, Reference Erdemir and Sucu2016), strengthening their applicability in actuarial science.
$M$
-estimators. The asymptotic optimality of pure robust credibility was later established in Pitselis (Reference Pitselis2013). Further, robust estimators have been extended naturally to credibility theory for generalized mixed linear models (see, e.g., Nelder & Verrall, Reference Nelder and Verrall1997; Garrido & Zhou, Reference Garrido and Zhou2006; Lai & Sun, Reference Lai and Sun2012; Erdemir & Sucu, Reference Erdemir and Sucu2016), strengthening their applicability in actuarial science.
Overall, the credibility theory literature has mainly focused on estimating the hypothetical mean for each risk group and, in turn, the expected pure premium. That is, it has been centered on mean estimation. However, focusing only on the mean may place less importance on the variability of observed losses. For example, the role of variance is seen in the well-known variance premium principle, which satisfies several desirable properties (Dickson, Reference Dickson2017, Chapter 3), while Hong & Martin (Reference Hong and Martin2017) address this issue in a more general framework by modeling the entire predictive distribution using a Dirichlet process mixture of lognormal models, rather than focusing solely on moments such as the mean or variance. Chen et al. (Reference Chen, Cheung, Choi and Yam2020) provide empirical evidence that both mean and variance shape credibility risk premiums, with variance proving more volatile than traditionally assumed. From the perspective of premium principles, Yong et al. (Reference Yong, Zeng and Zhang2024) studied a credibility framework based on the variance premium principle, where the goal is to estimate both the mean and variance instead of only the mean.
The linear credibility model, referred to as semi-linear credibility, for transformed loss data was first studied by De Vylder (Reference De Vylder1976), with further discussion in Bühlmann & Gisler (Reference Bühlmann and Gisler2005). Credibility models incorporating data trimming (Kim & Jeon, Reference Kim and Jeon2013) and winsorization (Zhao & Poudyal, Reference Zhao and Poudyal2024) can also be classified as semi-linear credibility. Semi-linear credibility explicitly incorporates the relationship between original and transformed data, improving estimation robustness. However, this study focuses on pure robust linear credibility and derives an explicit formula for its asymptotic properties. In the context of data truncation techniques in credibility theory, Cheung et al. (Reference Cheung, Yam and Zhang2022) proposed a satisficing approach to develop semi-linear credibility for heterogeneous risks.
Building upon the transition from linear to more complex credibility models, Le Courtois (Reference Le Courtois2021), with further insights from Hong & Martin (Reference Hong and Martin2021), introduced the
 $q$
-credibility estimator based on observed ground-up losses, rather than transformed data. The phrase “ground-up” loss refers to the individual loss amount that is assumed to be unaffected by policy modifications or data transformations; see, for example, Klugman et al. (Reference Klugman, Panjer and Willmot2019, p. 186, Section 9.7) and Poudyal & Brazauskas (Reference Poudyal and Brazauskas2022, Section 2). By incorporating quadratic term adjustments (hence the term
$q$
-credibility estimator based on observed ground-up losses, rather than transformed data. The phrase “ground-up” loss refers to the individual loss amount that is assumed to be unaffected by policy modifications or data transformations; see, for example, Klugman et al. (Reference Klugman, Panjer and Willmot2019, p. 186, Section 9.7) and Poudyal & Brazauskas (Reference Poudyal and Brazauskas2022, Section 2). By incorporating quadratic term adjustments (hence the term
 $q$
), this approach enhances premium estimation accuracy by capturing nonlinear dependencies in claim data. This manuscript extends the
$q$
), this approach enhances premium estimation accuracy by capturing nonlinear dependencies in claim data. This manuscript extends the
 $q$
-credibility framework to transformed data, addressing an important gap in credibility estimation and forming the core contribution of this work, whereas Le Courtois (Reference Le Courtois2021) considered
$q$
-credibility framework to transformed data, addressing an important gap in credibility estimation and forming the core contribution of this work, whereas Le Courtois (Reference Le Courtois2021) considered
 $q$
-credibility only for ground-up loss data. Specifically, we propose a quadratic credibility model that integrates both ground-up and robustly transformed data, referred to as robust quadratic credibility (RQC). To our knowledge, this is the first study to develop a second-order credibility framework that systematically incorporates transformed data, enhancing robustness in quadratic credibility estimation. The RQC framework embeds robust winsorized moments within the quadratic credibility model. RQC stabilizes and improves premium estimation accuracy by transforming ground-up loss data and applying second-order polynomial adjustments, particularly under heterogeneous risks. This framework extends the semi-linear credibility methodology originally introduced by De Vylder (Reference De Vylder1976), while maintaining interpretability and statistical efficiency.
$q$
-credibility only for ground-up loss data. Specifically, we propose a quadratic credibility model that integrates both ground-up and robustly transformed data, referred to as robust quadratic credibility (RQC). To our knowledge, this is the first study to develop a second-order credibility framework that systematically incorporates transformed data, enhancing robustness in quadratic credibility estimation. The RQC framework embeds robust winsorized moments within the quadratic credibility model. RQC stabilizes and improves premium estimation accuracy by transforming ground-up loss data and applying second-order polynomial adjustments, particularly under heterogeneous risks. This framework extends the semi-linear credibility methodology originally introduced by De Vylder (Reference De Vylder1976), while maintaining interpretability and statistical efficiency.
We establish the asymptotic properties of the proposed RQC estimators, derive closed-form expressions for premium calculations, and compare their performance against classical and semi-linear credibility models. Our results show that RQC reduces mean squared error (MSE) relative to classical credibility,
 $q$
-credibility, and semi-linear credibility, while capturing claim heterogeneity more effectively.
$q$
-credibility, and semi-linear credibility, while capturing claim heterogeneity more effectively.
The remainder of the paper is organized as follows. Section 2 introduces the RQC framework, outlining its motivation and theoretical foundation. The classical credibility models are revisited, followed by an extension that integrates robust estimators into quadratic credibility models. Section 3 presents two parametric examples – Exponential-Inverse Gamma and Lognormal-Normal models – demonstrating the applicability of RQC. The theoretical formulations are examined alongside estimation of credibility structural parameters, with explicit derivations of key quantities such as variance-covariance structures and credibility factors. Section 4 extends the analysis to nonparametric examples, reinforcing the robustness of RQC without assuming specific distributional forms. Section 5 evaluates RQC in practical actuarial contexts through analytical comparisons and applications to real-world insurance datasets, highlighting its advantages in achieving a more robust and equitable premium determination and performance of RQC taken against outlier. The empirical analysis assesses the practical implications of the proposed model and benchmarks its predictive performance against conventional credibility approaches. Finally, Section 6 summarizes the main findings, discusses their relevance to actuarial practice, and outlines potential directions for future research.
2. Robust q-credibility
Consider the risk class random variable
 $\Theta$
(Bühlmann & Gisler, Reference Bühlmann and Gisler2005, p. 12) with prior probability density (or mass) function
$\Theta$
(Bühlmann & Gisler, Reference Bühlmann and Gisler2005, p. 12) with prior probability density (or mass) function
 $\pi (\theta )$
. For a particular policyholder, that is, conditional on
$\pi (\theta )$
. For a particular policyholder, that is, conditional on
 $\Theta =\theta$
, assume we have observed
$\Theta =\theta$
, assume we have observed
 $n$
independent and identically distributed (i.i.d.) past-claim observations
$n$
independent and identically distributed (i.i.d.) past-claim observations
 $ X_{1} \mid \theta , \, X_{2} \mid \theta , \, \ldots , \, X_{n} \mid \theta .$
Consequently, the marginal variables
$ X_{1} \mid \theta , \, X_{2} \mid \theta , \, \ldots , \, X_{n} \mid \theta .$
Consequently, the marginal variables
 $X_{1},\ldots ,X_{n}$
are exchangeable and identically distributed, though not necessarily independent; see, e.g., Hong & Martin (Reference Hong and Martin2020) and Le Courtois (Reference Le Courtois2021). Then, an actuary is interested in setting a premium rate to cover
$X_{1},\ldots ,X_{n}$
are exchangeable and identically distributed, though not necessarily independent; see, e.g., Hong & Martin (Reference Hong and Martin2020) and Le Courtois (Reference Le Courtois2021). Then, an actuary is interested in setting a premium rate to cover
 $X_{n+1}$
, for the next policy period for that particular policyholder. First, we note that the classical linear credibility problem is defined as:
$X_{n+1}$
, for the next policy period for that particular policyholder. First, we note that the classical linear credibility problem is defined as:
 \begin{align} \mathrm{P}\scriptstyle{\mathrm{ROBLEM}}\ 1: \quad & \min _{\alpha , \, \beta _{i} \, \in \,\mathbb{R}} \, P_{1}, \quad P_{1} \,:\!=\, \mathbb{E}_{X_{1:n+1}} \left \{ {\left [ \alpha + \sum _{i=1}^{n} \beta _{i} \, X_{i} - X_{n+1} \right ]}^{2} \right \}, \end{align}
where
 $ \mathbb{E}_{X_{1:n+1}}$
(the subscript
$ \mathbb{E}_{X_{1:n+1}}$
(the subscript
 $X_{1:n+1}$
will be dropped when clear from the context) denotes expectation with respect to the joint distribution of
$X_{1:n+1}$
will be dropped when clear from the context) denotes expectation with respect to the joint distribution of
 $X_1$
,
$X_1$
,
 $\ldots$
,
$\ldots$
,
 $X_n$
, and
$X_n$
, and
 $X_{n+1}$
.
$X_{n+1}$
.
Building on this framework, the
 $q$
-credibility model proposed by Le Courtois (Reference Le Courtois2021) introduces an additional term to capture quadratic information,
$q$
-credibility model proposed by Le Courtois (Reference Le Courtois2021) introduces an additional term to capture quadratic information,
 $\{X_{i}^2\}_{i=1:n}$
, formulated as:
$\{X_{i}^2\}_{i=1:n}$
, formulated as:
 \begin{align} \mathrm{P}\scriptstyle{\mathrm{ROBLEM}}\ 2: \quad & \min _{\alpha , \ \beta _{i}, \, \gamma _{i} \, \in \, \mathbb{R}} \, P_{2}, \quad P_{2} \,:\!=\, \mathbb{E}_{X_{1:n+1}} \left \{ \left [ \alpha + \sum _{i=1}^{n} \beta _{i} \, X_{i} + \sum _{i=1}^{n} \gamma _{i} \, X_{i}^2 - X_{n+1} \right ]^{2} \right \}. \end{align}
The primary motivation behind the credibility model (2) is to incorporate quadratic terms into the credibility framework. This approach integrates both linear and quadratic information, enhancing credibility estimation. Hong & Martin (Reference Hong and Martin2021) further explored the relationship between this quadratic estimator and the classical Bühlmann methodology, emphasizing its potential to improve the estimation accuracy by accounting for nonlinear dependencies in the data.
2.1 General structure
Being a loss random variable, we assume that the support of
 $X$
is
$X$
is
 $[0, \infty )$
. Let
$[0, \infty )$
. Let
 $Y = f(X)$
denote a robust transformation of the ground-up loss
$Y = f(X)$
denote a robust transformation of the ground-up loss
 $X$
, where
$X$
, where
 $ f \,:\, [0, \infty ) \to [0, \infty )$
is an arbitrary, nondegenerate function representing a general transformation of the loss variable
$ f \,:\, [0, \infty ) \to [0, \infty )$
is an arbitrary, nondegenerate function representing a general transformation of the loss variable
 $X$
. Using this transformation, the optimization problem for estimating the robust credibility premium under the semi-linear credibility, see, e.g., Bühlmann & Gisler (Reference Bühlmann and Gisler2005, Definition 5.1, p. 126), framework is defined as
$X$
. Using this transformation, the optimization problem for estimating the robust credibility premium under the semi-linear credibility, see, e.g., Bühlmann & Gisler (Reference Bühlmann and Gisler2005, Definition 5.1, p. 126), framework is defined as
 \begin{align} \mathrm{P}\scriptstyle{\mathrm{ROBLEM}}\ 3: \quad & \min _{\alpha , \ \beta _{i} \, \in \, \mathbb{R}} \, P_{3}, \quad P_{3} \,:\!=\, \mathbb{E}_{Y_{1:n}, X_{n+1}} \left \{ \left [ \alpha + \sum _{i=1}^{n} \beta _{i} \, Y_{i} - X_{n+1} \right ]^{2} \right \}. \end{align}
Robust credibility methods based on trimming (Kim & Jeon, Reference Kim and Jeon2013) and winsorizing (Zhao & Poudyal, Reference Zhao and Poudyal2024) can be viewed as special cases of Problem 3, where
 $ X_{n+1}$
is replaced by its trimmed or winsorized counterpart,
$ X_{n+1}$
is replaced by its trimmed or winsorized counterpart,
 $ Y_{n+1}$
.
$ Y_{n+1}$
.
The classical credibility model described in Problem 1 and the
 $q$
-credibility model outlined in Problem 2 rely on the first and second moments of ground-up losses. These approaches are susceptible to contamination by outliers, potentially leading to sensitivity in the credibility premium. Semi-linear credibility, as formulated in Problem 3, aims to provide a more stable linear premium structure. However, to the best of our knowledge, the
$q$
-credibility model outlined in Problem 2 rely on the first and second moments of ground-up losses. These approaches are susceptible to contamination by outliers, potentially leading to sensitivity in the credibility premium. Semi-linear credibility, as formulated in Problem 3, aims to provide a more stable linear premium structure. However, to the best of our knowledge, the
 $q$
-credibility model in Problem 2 has not yet been investigated with transformed data
$q$
-credibility model in Problem 2 has not yet been investigated with transformed data
 $ Y = f(X)$
. Therefore, the primary motivation of this study is to address this gap by replacing the moments of ground-up losses with the corresponding moments of robustly transformed data,
$ Y = f(X)$
. Therefore, the primary motivation of this study is to address this gap by replacing the moments of ground-up losses with the corresponding moments of robustly transformed data,
 $ Y = f(X)$
, and to extend the credibility framework by incorporating quadratic terms of the transformed losses into Problem 3. Accordingly, the desired optimization problem is defined as
$ Y = f(X)$
, and to extend the credibility framework by incorporating quadratic terms of the transformed losses into Problem 3. Accordingly, the desired optimization problem is defined as
 \begin{align} \mathrm{P}\scriptstyle{\mathrm{ROBLEM}}\ 4: \quad & \min _{\alpha , \, \beta _{i}, \, \gamma _{i} \, \in \, \mathbb{R}} \, P_{4}, \quad P_{4} \,:\!=\, \mathbb{E}_{Y_{1:n}, X_{n+1}} \left \{ \left [ \alpha + \sum _{i=1}^{n} \beta _{i} \, Y_{i} + \sum _{i=1}^{n} \gamma _{i} \, Y_{i}^2 - X_{n+1} \right ]^{2} \right \}. \end{align}
As the transformed variables, we note that
 $ Y_1 \mid \theta , \, Y_2 \mid \theta , \, \ldots , \, Y_n \mid \theta$
are i.i.d. The corresponding marginal variables
$ Y_1 \mid \theta , \, Y_2 \mid \theta , \, \ldots , \, Y_n \mid \theta$
are i.i.d. The corresponding marginal variables
 $Y_i$
’s are also identically distributed as
$Y_i$
’s are also identically distributed as
 $X_{i}$
’s. Consequently, under a symmetric quadratic loss function and equal exposure weights (i.e., no observation-specific weights), the optimal coefficients are index-invariant; that is,
$X_{i}$
’s. Consequently, under a symmetric quadratic loss function and equal exposure weights (i.e., no observation-specific weights), the optimal coefficients are index-invariant; that is,
 \begin{equation*} \beta _{1} = \cdots = \beta _{n} \equiv \beta \quad \text{and} \quad \gamma _{1} = \cdots = \gamma _{n} \equiv \gamma . \end{equation*}
Then, Problem 4 becomes
 \begin{align} \quad & \min _{\alpha , \ \beta , \, \gamma \, \in \, \mathbb{R}} \, P_{5}, \quad P_{5} \,:\!=\, \mathbb{E}_{Y_{1:n}, X_{n+1}} \Big\{ \big[ \alpha + n\beta \widehat {Y} + n\gamma \widehat {Y^{2}} - X_{n+1} \big]^{2} \Big\}, \end{align}
where
 \begin{align} \widehat {Y^{k}} & \,:\!=\, \dfrac {1}{n} \sum _{i=1}^{n} Y_{i}^{k}, \quad k \ge 1, \quad \mbox{with} \quad \widehat {Y^{1}} \,:\!=\, \widehat {Y}. \end{align}
Then, the solution of this problem produces the estimator of
 $X_{n+1}$
and is summarized in Theorem1.
$X_{n+1}$
and is summarized in Theorem1.
We now introduce the following notations for the ground-up loss random variable
 $X$
and its corresponding transformed variable
$X$
and its corresponding transformed variable
 $Y$
:
$Y$
:
 \begin{align} \begin{array}{l@{\quad}l@{\quad}l}a=\mathbb{V}ar(\mathbb{E}[Y \mid \theta ]), & \quad b=\mathbb{C}ov(\mathbb{E}[Y^2 \mid \theta ],\mathbb{E}[Y \mid \theta ]), & \quad c=\mathbb{V}ar(\mathbb{E}[Y^2 \mid \theta ]), \\[3pt]d=\mathbb{V}ar(\mathbb{E}[X \mid \theta ]), & \quad e=\mathbb{C}ov(\mathbb{E}[Y \mid \theta ], \mathbb{E}[X \mid \theta ]), & \quad f=\mathbb{C}ov(\mathbb{E}[Y^{2} \mid \theta ],\mathbb{E}[X \mid \theta ]), \\[3pt] g=\mathbb{E}[\mathbb{C}ov(Y^2,Y \mid \theta )], & \quad h=\mathbb{E}[\mathbb{V}ar(Y^2 \mid \theta )], & \quad v= \mathbb{E}[\mathbb{V}ar(Y \mid \theta )], \\[3pt] l=\mathbb{E}[\mathbb{C}ov(Y^2,X \mid \theta )], & \quad k=\mathbb{E}[\mathbb{C}ov(Y,X \mid \theta )], & \quad u= \mathbb{E}[\mathbb{V}ar(X \mid \theta )], \\[3pt] \mu _{X}^{1}=\mathbb{E}[\mathbb{E}[X \mid \theta ]], & \quad \mu _{Y}^{1}=\mathbb{E} \left [ \mathbb{E} \left [ Y \mid \theta \right ]\right ] & \quad \mu _{Y}^{2}=\mathbb{E}[\mathbb{E}[Y^2 \mid \theta ]]. \end{array}\end{align}
Lemma 1.
With the notation introduced in Eq.
(7)
and for
 $\widehat {Y^{k}}$
,
$\widehat {Y^{k}}$
,
 $k \ge 1$
, defined in Eq.
(6)
, assume that
$k \ge 1$
, defined in Eq.
(6)
, assume that
 $ Y^{2} \neq \beta _{0} + \beta _{1} Y$
almost surely (a.s.). Then, the following moment relations hold:
$ Y^{2} \neq \beta _{0} + \beta _{1} Y$
almost surely (a.s.). Then, the following moment relations hold:
-
(i)
 $ \mathbb{V}ar ( \widehat {Y} ) = a+\dfrac {v}{n},$
-
(ii)
$ \mathbb{V}ar ( \widehat {Y^{2}} ) = c+\frac {h}{n}.$
-
(iii)
$\mathbb{C}ov ( \widehat {Y},\widehat {Y^{2}} ) = b+\frac {g}{n}$
, -
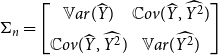
(iv) The covariance matrix,
$ \Sigma _n = \begin{bmatrix} \mathbb{V}ar (\widehat Y) & \mathbb{C}ov ( \widehat Y,\widehat {Y^2} ) \\[5pt] \mathbb{C}ov ( \widehat Y,\widehat {Y^2} ) & \mathbb{V}ar (\widehat {Y^2} ) \end{bmatrix}$
is positive definite.
Proof. See Appendix A.1.
Theorem 1.
The robust credibility premium that minimizes the expected quadratic loss function defined in Problem 4, based on the nondegenerate transformed data
 $Y = f(X)$
satisfying
$Y = f(X)$
satisfying
 $ Y^{2} \neq \beta _{0} + \beta _{1} Y$
a.s., is given by
$ Y^{2} \neq \beta _{0} + \beta _{1} Y$
a.s., is given by
 \begin{align} \widehat {P}_{\mbox{rqc}} & = \mu _{X}^{1} + z_{1} \left ( \widehat {Y} - \mu _{Y}^{1} \right ) + z_{2} \big( \widehat {Y^2}-\mu _{Y}^{2} \big), \end{align}
where
 \begin{align*} & \alpha = \mu _{X}^{1}-z_{1}\,\mu _{Y}^{1}-z_{2}\,\mu _{Y}^{2}, && \!\!\beta = \dfrac {e(nc+h)-f(nb+g)}{(na+v)(nc+h)-(nb+g)^{2}}, && \!\!\gamma = \dfrac {f(na+v)-e(nb+g)}{(na+v)(nc+h)-(nb+g)^{2}}, \\ & z_{1} = n \beta , && z_{2} = n \gamma , \end{align*}
where the common denominator in both
 $\beta$
and
$\beta$
and
 $\gamma$
is strictly positive by Lemma
1
.
$\gamma$
is strictly positive by Lemma
1
.
Proof. See Appendix A.2.
Note 1.
For the linear term only, the result of Theorem
1
reduces to the semi-linear credibility premium structure but with a different
 $ z_{1}$
. This corresponds to Problem
3
and is presented in Theorem 5.2 of Bühlmann & Gisler (Reference Bühlmann and Gisler2005
, p. 126).
$ z_{1}$
. This corresponds to Problem
3
and is presented in Theorem 5.2 of Bühlmann & Gisler (Reference Bühlmann and Gisler2005
, p. 126).
When comparing the credibility models (2) and (4), it becomes evident that (4) represents a robust extension of (2), achieved by employing the robust transformation
 $ Y=f(X)$
of the ground-up loss random variable
$ Y=f(X)$
of the ground-up loss random variable
 $X$
. This transformation incorporates robustness directly into the credibility framework, making (4) better equipped to handle outliers and extreme values in the data. Consequently, the robust credibility premium derived from (4) is expected to exhibit greater stability and reduced sensitivity when compared to the credibility premium associated with Problem 2, ensuring improved reliability in premium estimations under varying data conditions.
$X$
. This transformation incorporates robustness directly into the credibility framework, making (4) better equipped to handle outliers and extreme values in the data. Consequently, the robust credibility premium derived from (4) is expected to exhibit greater stability and reduced sensitivity when compared to the credibility premium associated with Problem 2, ensuring improved reliability in premium estimations under varying data conditions.
With the robust
 $ q$
-credibility premium structure given in Eq. (8), we also summarize other credibility premium structures here for completeness.
$ q$
-credibility premium structure given in Eq. (8), we also summarize other credibility premium structures here for completeness.
Solving Problem 1, the resulting classical credibility premium is then calculated as
 \begin{align} \widehat {P}_{\mbox{cc}} & = \mu _{X}^{1} + z \left ( \widehat {X} - \mu _{X}^{1} \right ), \quad z = \dfrac {na}{na + v}. \end{align}
Similarly, solving Problem 2, the corresponding
 $q$
-credibility premium is then calculated as
$q$
-credibility premium is then calculated as
 \begin{align} \widehat {P}_{\mbox {qc}} & = \mu _{X}^{1} + z_{1} \left ( \widehat {X} - \mu _{X}^{1} \right ) + z_{2} \big( \widehat {X^{2}}-\mu _{X}^{2} \big), \end{align}
where for the right winsorizing proportion
 $q = 0$
, Theorem1 yields
$q = 0$
, Theorem1 yields
 \begin{equation*} \begin{cases} z_{1} = \dfrac {n\left [a(nc+h)-b(nb+g)\right ]} {(na+v)(nc+h)-(nb+g)^{2}}, \\[10pt] z_{2} = \dfrac {n\left (bv-ag\right )}{(na+v)(nc+h)-(nb+g)^{2}}. \end{cases} \end{equation*}
This result coincides exactly with Proposition 1.1 of Le Courtois (Reference Le Courtois2021).
Finally, solving Problem 3, the corresponding semi-linear credibility premium is then calculated as
 \begin{align} \widehat {P}_{\mbox{slc}} & = \mu _{X}^{1} + z \left ( \widehat {Y} - \mu _{Y}^{1} \right ), \quad z = \dfrac {ne}{na+v}. \end{align}
More discussion can be found in Bühlmann & Gisler (Reference Bühlmann and Gisler2005).

We now calculate the mean square error (MSE) of the RQC premium structure given in Eq. (8).
Proposition 1.
The MSE for a new observation,
 $X_{n+1}$
, with RQC premium as given in Eq.
(8)
, is given by
$X_{n+1}$
, with RQC premium as given in Eq.
(8)
, is given by
 \begin{align} MSE_{\mbox{rqc}} & \equiv MSE \left ( \widehat {P}_{\mbox{rqc}}, X_{n+1} \right ) = d+u-z_{1}e-z_{2}f. \end{align}
Alternatively, the MSE can also be expressed in terms of the hypothetical mean
 $\mu _{X}^{1}(\theta )=$
 $\mathbb{E}[X_{n+1} \mid \theta ]$
as
$\mathbb{E}[X_{n+1} \mid \theta ]$
as
 \begin{align} MSE_{\mbox{rqc}}^{'} & \equiv MSE^{'} \left ( \widehat {P}_{\mbox{rqc}}, \mu _{X}^{1}(\theta ) \right ) = d-z_{1}e-z_{2}f. \end{align}
Proof. See Appendix A.3.
For the classical Buhlmann credibility whose premium structure is given in Eq. (9), the corresponding MSE is given by
 \begin{align} MSE_{\mbox{cc}} & \equiv MSE \left ( \widehat {P}_{\mbox{cc}}, X_{n+1} \right ) = d+u-zd. \end{align}
For the
 $q$
-credibility considered in Le Courtois (Reference Le Courtois2021) with the premium structure given in Eq. (10), the MSE is calculated as
$q$
-credibility considered in Le Courtois (Reference Le Courtois2021) with the premium structure given in Eq. (10), the MSE is calculated as
 \begin{align} MSE_{\mbox{qc}} & \equiv MSE \left ( \widehat {P}_{\mbox{qc}}, X_{n+1} \right ) = d+u-z_{1}e-z_{2}f, \end{align}
where
 $z_{1}$
and
$z_{1}$
and
 $z_{2}$
are defined in Theorem1 with
$z_{2}$
are defined in Theorem1 with
 $(p,q) = (0,0)$
.
$(p,q) = (0,0)$
.
Similarly, for the semi-linear credibility with the premium structure given by Eq. (11), the corresponding MSE is given by
 \begin{align} MSE_{\mbox{slc}} & \equiv MSE \big( \widehat {P}_{\mbox{slq}}, X_{n+1} \big) = d+u-ze. \end{align}
Proposition 2. As discussed in Remark 1.7 of Le Courtois (Reference Le Courtois2021) and Proposition 2 of Yong et al. (Reference Yong, Zeng and Zhang2024), it follows that
 \begin{align} MSE_{\mbox{rqc}} & \leq MSE_{\mbox{slc}} \leq MSE_{\mbox{cc}} \quad \mbox{and} \quad MSE_{\mbox{rqc}} \leq MSE_{\mbox{qc}} \leq MSE_{\mbox{cc}}, \end{align}
 \begin{align} MSE_{\mbox{rqc}}^{'} & \leq MSE_{\mbox{slc}}^{'} \leq MSE_{\mbox{cc}}^{'} \quad \mbox{and} \quad MSE_{\mbox{rqc}}^{'} \leq MSE_{\mbox{qc}}^{'} \leq MSE_{\mbox{cc}}^{'}. \end{align}
Proof. See Appendix A.4.
2.2 Data winsorization
The estimators derived from winsorized data exhibit greater robustness to outliers compared to their standard counterparts. They are extensively utilized in the analysis of both life and non-life insurance products; see, for example, Valdez et al. (Reference Valdez, Vadiveloo and and2014), Hwang et al. (Reference Hwang, Hu, Lee and Wang2017), and Lobo et al. (Reference Lobo, Fonseca and Alves2024).
In this paper, we consider the robust transformation
 $ Y = f(X)$
of the underlying random variable
$ Y = f(X)$
of the underlying random variable
 $ X$
. Specifically,
$ X$
. Specifically,
 $ f(X)$
represents the winsorized transformation, where observations are adjusted based on left and right winsorizing proportions. For given proportions
$ f(X)$
represents the winsorized transformation, where observations are adjusted based on left and right winsorizing proportions. For given proportions
 $ 0 \leq p, q \leq 1$
with
$ 0 \leq p, q \leq 1$
with
 $ p \leq 1 - q$
, the transformed data are obtained by applying
$ p \leq 1 - q$
, the transformed data are obtained by applying
 $ 100p\%$
left- and
$ 100p\%$
left- and
 $ 100q\%$
right-winsorization, leading to the following representation:
$ 100q\%$
right-winsorization, leading to the following representation:
 \begin{align} Y & = f(X) = \begin{cases} F^{-1}(p); & \mbox{for } X \lt F^{-1}(p), \\ X; & \mbox{for } F^{-1}(p) \le X \le F^{-1}(1-q), \\ F^{-1}(1-q); & \mbox{for } x\gt F^{-1}(1-q). \end{cases} \end{align}
The proportions
 $ p$
and
$ p$
and
 $ q$
can be controlled by the researcher. That is, the winsorization proportions
$ q$
can be controlled by the researcher. That is, the winsorization proportions
 $ p$
and
$ p$
and
 $ q$
are selected subjectively, which can also be viewed as hyperparameter tuning, as discussed in Poudyal et al. (Reference Poudyal, Aryal and Pokhrel2025, Section 2.2) for a similar choice, and must be chosen in alignment with the modeling objectives. Since there is no universal rule for selecting
$ q$
are selected subjectively, which can also be viewed as hyperparameter tuning, as discussed in Poudyal et al. (Reference Poudyal, Aryal and Pokhrel2025, Section 2.2) for a similar choice, and must be chosen in alignment with the modeling objectives. Since there is no universal rule for selecting
 $(p, q)$
, the choice is context-dependent and guided by the specific inferential or practical goals of the application. This approach is consistent with the broader
$(p, q)$
, the choice is context-dependent and guided by the specific inferential or practical goals of the application. This approach is consistent with the broader
 $ L$
-estimation literature, where the weight function is typically chosen based on inferential goals rather than formal optimization; see Brazauskas et al. (Reference Brazauskas, Jones and Zitikis2009, Section 2.3) and Serfling (Reference Serfling1980, p. 263). The choice of
$ L$
-estimation literature, where the weight function is typically chosen based on inferential goals rather than formal optimization; see Brazauskas et al. (Reference Brazauskas, Jones and Zitikis2009, Section 2.3) and Serfling (Reference Serfling1980, p. 263). The choice of
 $ p$
and
$ p$
and
 $ q$
has a significant effect on risk control and the resulting credibility premium.
$ q$
has a significant effect on risk control and the resulting credibility premium.
For any positive integer
 $k$
, the winsorized mean or moments are derived as the expectation of
$k$
, the winsorized mean or moments are derived as the expectation of
 $ Y^k$
. That is,
$ Y^k$
. That is,
 \begin{eqnarray} \mathbb{E} \big[ Y^{k} \mid \theta \big] & = & p^{k} \left [F^{-1}(p)\right ]^{k} + \int _{p}^{1-q} (F^{-1}(u))^{k} \,du + q^{k} \left [F^{-1}(1-q)\right ]^{k}. \end{eqnarray}
The corresponding empirical winsorized moments, which serves as an estimate of the population winsorized moments in Eq. (20) and is equivalent to Eq. (6), is now given by

where
 $[\,]$
denotes the greatest integer part.
$[\,]$
denotes the greatest integer part.
2.3 Asymptotic properties
We now summarize the asymptotic distributional properties of
 $ \widehat {Y^{k}}$
from Eq. (21). By Serfling (Reference Serfling1980, p. 264), the first sample winsorized moment in Eq. (21) can be written as
$ \widehat {Y^{k}}$
from Eq. (21). By Serfling (Reference Serfling1980, p. 264), the first sample winsorized moment in Eq. (21) can be written as
 \begin{align*} \widehat {Y}=\frac {1}{n}\sum _{i=1}^{n}K \bigg (\frac {i}{n+1}\bigg )h(X_{i:n})+\sum _{m=1}^{2}c_{m}h\big(X_{[np_{m}],n}\big), \end{align*}
where
 $c_{1}$
,
$c_{1}$
,
 $c_{2}$
are nonzero constants, and
$c_{2}$
are nonzero constants, and
 \begin{equation} K(x) = \begin{cases} 1; & \text{if } np_{1} \leq x \leq np_{2}, \\[4pt] 0;& \text{otherwise}, \\ \end{cases} \end{equation}
and
 $np_{m}$
is the winsorized point. Chernoff et al. (Reference Chernoff and Gastwirth1967) prove that
$np_{m}$
is the winsorized point. Chernoff et al. (Reference Chernoff and Gastwirth1967) prove that
 $\widehat {Y}$
is
$\widehat {Y}$
is
 $\mathcal{AN} \big (\mu , \frac {\sigma ^{2}}{n} \big )$
, where the mean
$\mathcal{AN} \big (\mu , \frac {\sigma ^{2}}{n} \big )$
, where the mean
 \begin{equation} \mu =\int _{0}^{1}K(u)H(u)du+\sum _{i=1}^{2}c_{i}h(p_{i}), \end{equation}
and the variance
 \begin{align} \sigma ^{2}=\int _{0}^{1}\alpha ^{2}(u)du, \end{align}
where
 \begin{align*} \alpha (u)=\frac {1}{1-u}\bigg [\int _{u}^{1} K(r)H^{'}(r)(1-r)dr+\sum _{p_{i}\geq u}c_{i}(1-p_{i})H^{'}(p_{i}), \quad H(u)=F^{-1}(u). \end{align*}
For the winsorizing proportions
 $ (p_{i}, q_{i})$
and
$ (p_{i}, q_{i})$
and
 $ (p_{j}, q_{j})$
, there are six possible combinations. For further details, we refer the reader to Poudyal (Reference Poudyal2025), Zhao et al. (Reference Zhao, Brazauskas and Ghorai2018). Among the six possible scenarios, we consider the most natural combination of winsorizing proportions for the RQC structure, as formulated in Problem 4, which is given by
$ (p_{j}, q_{j})$
, there are six possible combinations. For further details, we refer the reader to Poudyal (Reference Poudyal2025), Zhao et al. (Reference Zhao, Brazauskas and Ghorai2018). Among the six possible scenarios, we consider the most natural combination of winsorizing proportions for the RQC structure, as formulated in Problem 4, which is given by
 \begin{align} 0 \leq p_{j} \leq p_{i} \lt 1-q_{i} \leq 1-q_{j} \leq 1. \end{align}
Theorem 2.
The
 $k$
-variate vector
$k$
-variate vector
 $ ( \sqrt {n} ( \widehat {Y^1} - \mu _{Y}^{1}(\theta ) ), \ldots , \sqrt {n} ( \widehat {Y^k} - \mu _{Y}^{k}(\theta ) ) )$
converges in distribution to the
$ ( \sqrt {n} ( \widehat {Y^1} - \mu _{Y}^{1}(\theta ) ), \ldots , \sqrt {n} ( \widehat {Y^k} - \mu _{Y}^{k}(\theta ) ) )$
converges in distribution to the
 $k$
-variate normal random vector with the mean
$k$
-variate normal random vector with the mean
 $\mathbf{0}=(0, \ldots , 0)$
and the variance-covariance matrix
$\mathbf{0}=(0, \ldots , 0)$
and the variance-covariance matrix
 $\mathbf{\Sigma }$
:=
$\mathbf{\Sigma }$
:=
 $[\sigma _{ij}^{2}]_{i,j=1}^{k}$
with the entries
$[\sigma _{ij}^{2}]_{i,j=1}^{k}$
with the entries
 \begin{align} \sigma _{ij}^{2} & = \int _{p_{j}}^{1-q_{j}}\int _{p_{i}}^{1-q_{i}}H_{i}^{'}(r)H_{j}^{'}(s) \left [ \min \, \{r,s\}-rs \right ] \,dr\,ds \nonumber \\ & \quad + \left [ p_{j}^{2}H_{j}^{'}(p_{j})-q_{j}^{2}H_{j}^{'}(1-q_{j}) \right ] \Delta _{i} + q_{j}^{2}H_{i}(1-q_{i})H_{j}^{'}(1-q_{j}) - p_{j}^{2}H_{i}(p_{i})H_{j}^{'}(p_{j}) \nonumber \\ & \quad + p_{i}H_{i}^{'}(p_{i})\int _{p_{i}}^{1-q_{j}}H_{j}(s)\,ds + q_{i}H_{i}^{'}(1-q_{i})\int _{1-q_{i}}^{1-q_{j}}H_{j}(s)\,ds \nonumber \\ & \quad -\Big[p_{i}(1-p_{i})H_{i}^{'}(p_{i})+q_{i}^{2}H_{i}^{'}(1-q_{i})\Big]\int _{p_{j}}^{1-q_{j}}H_{j}(s)\,ds \nonumber \\ & \quad + \Big[ p_{i}^{2}H_{i}^{'}(p_{i})+q_{i}(1-q_{i})H_{i}^{'}(1-q_{i}) \Big] q_{j}H_{j}(1-q_{j}) \nonumber \\ & \quad- \Big[ p_{i}(1-p_{i})H_{i}^{'}(p_{i})+q_{i}^{2}H_{i}^{'}(1-q_{i}) \Big] p_{j}H_{j}(p_{j}) \nonumber \\ & \quad + p_{i}(1-p_{i})p_{j}^{2}H_{i}^{'}(p_{i})H_{j}^{'}(p_{j}) + p_{i}^{2}q_{j}^{2}H_{i}^{'}(p_{i})H_{j}^{'}(1-q_{j}) + p_{j}^{2}q_{i}^{2}H_{i}^{'}(1-q_{i})H_{j}^{'}(p_{j}) \nonumber \\ & \quad + q_{i}(1-q_{i})q_{j}^{2}H_{i}^{'}(1-q_{i})H_{j}^{'}(1-q_{j}), \end{align}
where
 $ \Delta _{x} = p_{x}H_{x}(p_{x}) +\int _{p_{x}}^{1-q_{x}}H_{x}(s)\,ds +q_{x}H_{x}(1-q_{x}), \quad x \, \in \,\{ i, j \}.$
Proof.
Following Chernoff et al. (Reference Chernoff and Gastwirth1967, Remark 9) and using the variance formula from Eq. (24),
 $\sigma _{ij}^{2}$
can be expressed as
$\sigma _{ij}^{2}$
can be expressed as
 \begin{align*} \sigma _{ij}^{2} & = \int _{0}^{1}\alpha _{i}(u)\alpha _{j}(u)du \nonumber \\& = \int _{0}^{1} \bigg\{ \frac {1}{1-u} \bigg[ \int _{u}^{1} K_{i}(r)H_{i}^{'}(r)(1-r)dr+\sum _{p_{i}\geq u}c_{i}(1-p_{i})H_{i}^{'}(p_{i}) \bigg] \nonumber \\& \quad \times \frac {1}{1-u} \bigg[ \int _{u}^{1}K_{j}(s)H_{j}^{'}(s)(1-s)ds+\sum _{p_{j}\geq u}c_{j}(1-p_{j})H_{j}^{'}(p_{j}) \bigg] \bigg\} du \nonumber\end{align*}
 \begin{align}& = \int _{0}^{1} \frac {1}{(1-u)^{2}} \bigg[ \int _{u}^{1} K_{i}(r)H_{i}^{'}(r)(1-r)dr\int _{u}^{1}K_{j}(s)H_{j}^{'}(s)(1-s)ds \bigg] du \nonumber \\[5pt] & \quad + \int _{0}^{1} \frac {1}{(1-u)^{2}} \bigg[ \int _{u}^{1} K_{i}(r)H_{i}^{'}(r)(1-r)dr \times \sum _{p_{j}\geq u}c_{j}(1-p_{j})H_{j}^{'}(p_{j}) \bigg] du \nonumber \\[5pt] & \quad + \int _{0}^{1} \frac {1}{(1-u)^{2}} \bigg[ \int _{u}^{1}K_{j}(s)H_{j}^{'}(s)(1-s)ds\times \sum _{p_{i}\geq u}c_{i}(1-p_{i})H_{i}^{'}(p_{i}) \bigg] du \nonumber \\[5pt] & \quad +\int _{0}^{1} \frac {1}{(1-u)^{2}} \bigg[ \sum _{p_{i}\geq u}c_{i}(1-p_{i})H_{i}^{'}(p_{i}) \times \sum _{p_{j}\geq u}c_{j}(1-p_{j})H_{j}^{'}(p_{j}) \bigg] du \nonumber \\ & = \Omega _{1} + \Omega _{2} + \Omega _{3} + \Omega _{4}, \end{align}
where
 $ \Omega _{1}, \ \Omega _{2}, \, \Omega _{3}, \ \Omega _{4},$
represent the first, second, third, and fourth terms, respectively.
$ \Omega _{1}, \ \Omega _{2}, \, \Omega _{3}, \ \Omega _{4},$
represent the first, second, third, and fourth terms, respectively.
For the winsorizing proportions satisfying inequality (25), we consider the following notations:
 \begin{align*} A_{i} & = p_{i}(1-p_{i})H_{i}^{'}(p_{i}), \quad B_{i}=q_{i}^{2}H_{i}^{'}(1-q_{i}), \quad A_{j}=p_{j}(1-p_{j})H_{j}^{'}(p_{j}), \quad B_{j}=q_{j}^{2}H_{j}^{'}(1-q_{j}), \\[6pt] R(r)&=H_{i}^{'}(r)(1-r),\quad S(s)=H_{j}^{'}(s)(1-s), \quad R_\ast (r)=\frac {R(r)}{(1-u)^2}, \quad S_\ast (s)=\frac {S(s)}{(1-u)^2}. \end{align*}
Then, it follows that
 \begin{align*} \Omega _{1} & = \int _{p_{j}}^{1-q_{j}}\int _{p_{i}}^{1-q_{i}}H_{i}^{'}(r)H_{j}^{'}(s)\,[\min \, \{r,s\}-rs]\,dr\,ds\\[6pt] & = p_{i}H_{i}(p_{i})H_{j}(p_{j})+q_{i}H_{i}(1-q_{i})H_{j}(1-q_{j})-\Delta _{i}\Delta _{j}+\int _{p_{j}}^{1-q_{j}}H_{i}(s)H_{j}(s)ds, \\[6pt] \Omega _{2}& = \int _{0}^{p_{j}} \frac {A_{j}+B_{j}}{(1-u)^{2}} \int _{p_{i}}^{1-q_{i}} R(r) \,dr \, du +\int _{p_{j}}^{p_{i}} \frac {B_{j}}{(1-u)^{2}} \int _{p_{i}}^{1-q_{i}} R(r) \,dr \, du \\[6pt] & \quad + \int _{p_{i}}^{1-q_{i}} \frac {B_{j}}{(1-u)^{2}} \int _{u}^{1-q_{i}} R(r) \,dr \, du \\[6pt] & = \bigg (\frac {p_{j}}{1-p_{j}}A_{j}+\frac {p_{i}}{1-p_{i}}B_{j}\bigg ) \int _{p_{i}}^{1-q_{i}}R(r) \,dr+B_{j}\int _{p_{i}}^{1-q_{i}} \int _{u}^{1-q_{i}}R_\ast (r)\,dr \, du. \\[6pt] & = \left [p_{j}^{2}H_{j}^{'}(p_{j})-q_{j}^{2}H_{j}^{'}(1-q_{j})\right ]\Delta _{i}+q_{j}^{2}H_{i}(1-q_{i})H_{j}^{'}(1-q_{j})-p_{j}^{2}H_{i}(p_{i})H_{j}^{'}(p_{j}), \\[6pt] \Omega _{3}& = \int _{0}^{p_{j}} \frac {A_{i}+B_{i}}{(1-u)^{2}} \int _{p_{j}}^{1-q_{j}}S(s)\,ds \, du + \int _{p_{j}}^{p_{i}} \frac {A_{i}+B_{i}}{(1-u)^{2}} \int _{u}^{1-q_{j}}S(s) \,dv \, du \\[6pt] & \quad + \int _{p_{i}}^{1-q_{i}} \frac {B_{i}}{(1-u)^{2}} \int _{u}^{1-q_{j}}S(s) \,ds \, du \end{align*}
 \begin{align*} & = \frac {p_{j}}{1-p_{j}} \big (A_{i}+B_{i}\big )\int _{p_{j}}^{1-q_{j}}S(s) \,ds + \big (A_{i}+B_{i}\big )\int _{p_{j}}^{p_{i}} \int _{u}^{1-q_{j}}S_\ast (s)\,ds \, du \\[4pt] & \quad + B_{i}\,\int _{p_{i}}^{1-q_{i}} \int _{u}^{1-q_{j}}S_\ast (s)\,ds \, du. \\[4pt] & = \frac {p_{j}}{1-p_{j}} \big (A_{i}+B_{i}\big ) \int _{p_{j}}^{1-q_{j}}S(s) \,ds \\[4pt] & \quad + \big (A_{i}+B_{i}\big )\left [\int _{p_{j}}^{p_{i}} \int _{p_{j}}^{s}S_\ast (s)\,du \, ds +\int _{p_{j}}^{p_{i}} \int _{p_{i}}^{1-q_{j}}S_\ast (s)\,du \, ds \right ] \\[4pt] & \quad + B_{i}\,\left [\int _{p_{i}}^{1-q_{i}} \int _{p_{i}}^{s}S_\ast (s)\,du \, ds+\int _{1-q_{i}}^{1-q_{j}} \int _{p_{i}}^{1-q_{i}}S_\ast (s)\,du \, ds.\right ] \\[4pt] & = p_{i}H_{i}^{'}(p_{i})\int _{p_{i}}^{1-q_{j}}H_{j}(s)\,ds+ q_{i}H_{i}^{'}(1-q_{i})\int _{1-q_{i}}^{1-q_{j}}H_{j}(s)\,ds \\[4pt] & \quad -\left [p_{i}(1-p_{i})H_{i}^{'}(p_{i})+q_{i}^{2}H_{i}^{'}(1-q_{i})\right ]\int _{p_{j}}^{1-q_{j}}H_{j}(s)\,ds \\[4pt] & \quad + \left [p_{i}^{2}H_{i}^{'}(p_{i})+q_{i}(1-q_{i})H_{i}^{'}(1-q_{i})\right ]q_{j}H_{j}(1-q_{j}) \\[4pt] & \quad -\left [p_{i}(1-p_{i})H_{i}^{'}(p_{i})+q_{i}^{2}H_{i}^{'}(1-q_{i})\right ]p_{j}H_{j}(p_{j}), \\[4pt] \Omega _{4}& = \big (A_{i}+B_{i}\big )\big (A_{j}+B_{j}\big )\int _{0}^{p_{j}}\frac {1}{(1-u)^{2}} du \\[4pt] & \quad +\big (A_{i}+B_{i}\big )\,B_{j}\,\int _{p_{j}}^{p_{i}} \frac {1}{(1-u)^{2}} du +B_{i}\,B_{j}\,\int _{p_{i}}^{1-b_{i}} \frac {1}{(1-u)^{2}}du \\[4pt] & = \frac {p_{j}}{1-p_{j}}(A_{i}+B_{i})(A_{j}+B_{j})+\frac {p_{i}-p_{j}}{(1-p_{i})(1-p_{j})}(A_{i}+B_{i})\,B_{j}+\frac {1-p_{i}-q_{i}}{(1-p_{i})q_{i}}\,B_{i}\,B_{j} \\[4pt] & = p_{i}(1-p_{i})p_{j}^{2}H_{i}^{'}(p_{i})H_{j}^{'}(p_{j}) + p_{i}^{2}q_{j}^{2}H_{i}^{'}(p_{i})H_{j}^{'}(1-q_{j})+p_{j}^{2}q_{i}^{2}H_{i}^{'}(1-q_{i})H_{j}^{'}(p_{j}) \\[4pt] & \quad +q_{i}(1-q_{i})q_{j}^{2}H_{i}^{'}(1-q_{i})H_{j}^{'}(1-q_{j}). \end{align*}
Finally,
 $ \sigma _{ij}^{2} = \Omega _{1} + \Omega _{2} + \Omega _{3} + \Omega _{4},$
provides the desired expression of Eq. (26).
$ \sigma _{ij}^{2} = \Omega _{1} + \Omega _{2} + \Omega _{3} + \Omega _{4},$
provides the desired expression of Eq. (26).
For each fixed
 $ \theta \in \Theta$
, let the mean and variance of
$ \theta \in \Theta$
, let the mean and variance of
 $ Y^{k}$
be denoted by
$ Y^{k}$
be denoted by
 $ \mu _{Y}^{k}(\theta )$
and
$ \mu _{Y}^{k}(\theta )$
and
 $ v^{k}(\theta )$
, respectively. Using these definitions and the result of Theorem2, we obtain
$ v^{k}(\theta )$
, respectively. Using these definitions and the result of Theorem2, we obtain
 \begin{align} & \sqrt {n} \left ( \widehat {Y}-\mu _{Y}^{1}(\theta ) \right ) \, \sim \, \mathcal{AN} \left(0, v^{1}(\theta ) \right) \quad \mbox{and} \quad \sqrt {n} \big( \widehat {Y^{2}}-\mu _{Y}^2(\theta ) \big) \, \sim \, \mathcal{AN} \left(0, v^{2}(\theta )\right). \end{align}
Further, using the asymptotic result from Theorem2 along with the inequality condition provided in (25), we can derive the conditional variance and covariance, in particular,
-
•
$\mathbb{C}ov(Y,Y^2 \mid \theta )$
is Eq. (26) with
$p_{i}=p_{j}=p,q_{i}=q_{j}=q, H_{i}=(F^{-1}),H_{j}=(F^{-1})^2,$
-
•
$\mathbb{V}ar(Y^2 \mid \theta )$
is Eq. (26) with
$p_{i}=p_{j}=p,q_{i}=q_{j}=q, H_{i}=(F^{-1})^{2},H_{j}=(F^{-1})^{2},$
-
•
$\mathbb{C}ov(X,Y \mid \theta )$
is Eq. (26) with
$ p_{i}=p,p_{j}=0,q_{i}=q,q_{j}=0, H_{i}=(F^{-1}),H_{j}=(F^{-1}),$
-
•
$ \mathbb{C}ov(X,Y^2 \mid \theta )$
is Eq. (26) with
$ p_{i}=p,p_{j}=0,q_{i}=q,q_{j}=0, H_{i}=(F^{-1})^2,H_{j}=(F^{-1})$
.


We conclude this section with the following lemma, which plays a crucial role in constructing the RQC premium for winsorized data.
Lemma 2.
Assume that
 $ \mathbb{E} [ | X_{i} | ^{k} ] \lt \infty , k=1,2,3,4.$
Since
$ \mathbb{E} [ | X_{i} | ^{k} ] \lt \infty , k=1,2,3,4.$
Since
 $Y$
is a winsorized version of
$Y$
is a winsorized version of
 $X$
, Eq.
(19)
, then
$X$
, Eq.
(19)
, then
 $ \mathbb{E} [ | Y_{i} |^k ] \lt \infty , k=1,2,3,4.$
And as
$ \mathbb{E} [ | Y_{i} |^k ] \lt \infty , k=1,2,3,4.$
And as
 $n arrow \infty$
, we have
$n arrow \infty$
, we have
-
(i)
$\mathbb{E} [ \mathbb{E} [ \widehat {Y} ] ] \to \mu _{Y}^{1}$
, -
(ii)
$n\mathbb{E} [ \mathbb{V}ar [ \widehat {Y} ] ] \to v$
, -
(iii)
$\mathbb{V}ar [ \mathbb{E} [ \widehat {Y} ] ] \to a$
, -
(iv)
$\mathbb{C}ov ( \widehat {Y} ,\mu_{Y}^{1}(\theta) ) \to \mathbb{C}ov (\mu_{Y}^{1}(\theta) ,\mu_{Y}^{1}(\theta) ) = a$
, -
(v)
$\mathbb{C}ov ( \widehat {Y^2} ,\mu_{Y}^{1}(\theta) ) \to\mathbb{C}ov (\mu_{Y}^{2}(\theta) ,\mu_{Y}^{1}(\theta) ) = b$
, -
(vi)
$\mathbb{V}ar [ \mathbb{E} [ \widehat {Y}^2] ] \to c$
, -
(vii)
$\mathbb{C}ov (\mu_{X}^{1}(\theta), \widehat {Y} ) \to \mathbb{C}ov (\mu_{X}^{1}(\theta) ,\mu_{Y}^{1}(\theta) ) = e$
, -
(viii)
$\mathbb{C}ov (\mu_{X}^{1}(\theta), \widehat {Y^2} ) \to \mathbb{C}ov (\mu_{X}^{1}(\theta) ,\mu_{Y}^{2}(\theta) ) = f$
.


Proof. See Appendix A.5.
Note 3. The semi-linear credibility elements in Eqs. (11) and (16) can also be derived using the results of Lemma 2 .
Next, we will see how this robust credibility premium works on parametric models.
3. Parametric examples
This section examines the proposed RQC premium structure using two parametric models: Exponential-Inverse Gamma and Lognormal-Normal. The Exponential-Inverse Gamma combination is a conjugate prior pairing; thus, the classical credibility result aligns with the traditional Bayesian outcome. This makes it a suitable benchmark for comparing the results obtained through the RQC approach with those from the most widely used credibility method. While the normal-normal combination is another classical conjugate prior, the positive nature of the loss data necessitates modeling the loss component with a lognormal distribution instead of a normal one.
3.1 Exponential-inverse gamma model
Let
 $X_{1} \mid \theta , \ldots , X_{n} \mid \theta$
be independent and identically distributed (i.i.d.) random variables, following an Exponential distribution with mean of
$X_{1} \mid \theta , \ldots , X_{n} \mid \theta$
be independent and identically distributed (i.i.d.) random variables, following an Exponential distribution with mean of
 $\theta$
. And the parameter
$\theta$
. And the parameter
 $\theta$
is Inverse Gamma
$\theta$
is Inverse Gamma
 $(\alpha , \beta )$
distributed with mean of
$(\alpha , \beta )$
distributed with mean of
 $\dfrac {\beta }{\alpha -1}$
. Now, the credibility premium for the Exponential-Inverse Gamma model is derived as follows.
$\dfrac {\beta }{\alpha -1}$
. Now, the credibility premium for the Exponential-Inverse Gamma model is derived as follows.
For loss random variable
 $X \mid \theta \sim Exp(\theta )$
, we have
$X \mid \theta \sim Exp(\theta )$
, we have
 $F(x \mid \theta )=1-e^{-x/\theta }=w$
and the quantile function
$F(x \mid \theta )=1-e^{-x/\theta }=w$
and the quantile function
 $F^{-1}(w)=-\theta \log (1-w)$
. First, we note that for
$F^{-1}(w)=-\theta \log (1-w)$
. First, we note that for
 $k=1,2,3,4$
;
$k=1,2,3,4$
;
 \begin{eqnarray*} \int \big (\log u\big )^{k}\,du & = & u(\log u)^{k}-ku(\log u)^{k-1}+k(k-1)u(\log u)^{k-2} \\ & & -k(k-1)(k-2)u(\log u)^{k-3}+k(k-1)(k-2)(k-3) + \mbox{Constant}. \end{eqnarray*}
Based on Eq. (20), we calculate the first four moments of the hypothetical mean
 \begin{align*} \mu _{Y}^{1}(\theta ) & = -\theta \left\{p\,\text{log}(1-p)+\int _{p}^{1-q}\text{log}(1-w)dw+q\,\text{log}q\right\} \\& = -\theta \left\{p\,\text{log}(1-p)+q(1-\text{log}q)-(1-p)[1-\text{log}(1-p)]+q\,\text{log}q\right\}\end{align*}
 \begin{align*} & = -\theta \left\{\text{log}(1-p)+q-(1-p)\right\}\\[3pt] & = \theta \Bigg\{ \underbrace {1-p-q-\text{log}(1-p)}_{m_{1}(p,q)} \Bigg\} \\[3pt] & \,:\!=\, \theta \, m_{1}(p,q), \\[3pt] \mu _{Y}^{2}(\theta ) & = \theta ^{2} \left\{ p\,\big [\text{log}(1-p)\big ]^{2}+\int _{p}^{1-q}\big [\text{log}(1-w)\big ]^{2}\,dw+q\,\big (\text{log}\,q)^{2} \right\} \\[3pt] & = \theta ^{2} \Big\{ p\big [\text{log}(1-p)\big ]^{2}+(1-p)\big [\text{log}(1-p)\big ]^{2} \\[3pt] & \quad +2(1-p)[1-\text{log}(1-p)]-q(\text{log}\,q)^{2} -2q(1-\text{log}q)+q\big (\text{log}\,q)^{2} \Big\} \\[3pt] & = \theta ^{2} \left \{ \big [\text{log}(1-p)\big ]^{2}+2(1-p)\big [1-\text{log}(1-p)\big ]-2q (1-\log q) \right \} \\[3pt] & \,:\!=\, \theta ^{2}\,m_{2}(p,q), \\[3pt] \mu _{Y}^{3}(\theta )& = -\theta ^{3}\bigg \{p\,\big [\text{log}(1-p)\big ]^{3}+\int _{p}^{1-q}\big [\log (1-w)\big ]^{3}\,dw+q\,\big (\log \,q)^{3}\bigg \} \\[3pt] & = -\theta ^{3}\Big \{\big (\log (1-p)\big )^{3}-3(1-p)(\log (1-p))^{2}+6(1-p)\log (1-p) \\[3pt] & \quad -6(1-p)+3q(\log q)^{2} -6q\log q+6q\Big \} \\[3pt] & \,:\!=\, \theta ^{3}\, m_{3}(p,q), \\[3pt] \mu _{Y}^{4}(\theta ) & = \theta ^{4}\bigg \{p\,\big [\log (1-p)\big ]^{4}+\int _{p}^{1-q}\big [\log (1-w)\big ]^{4}\,dw+q\,\big (\log \,q)^{4}\bigg \} \\[1pt] & = \theta ^{4}\Big \{\big (\log (1-p)\big )^{4}-4(1-p)(\log (1-p))^{3}+12(1-p)(\log (1-p))^{2}\\[1pt] & \quad -24(1-p)\log (1-p) +24(1-p) +4q(\log q)^{3}-12q(\log q)^{2}+24q\log q-24q\Big \} \\[1pt] & \,:\!=\, \theta ^{4}\, m_{4}(p,q). \end{align*}
Besides, the derivatives of quantiles are
 \begin{align*} H_{1}^{'}(w) & = \big [F^{-1}(w))\big ]^{'} = \dfrac {1}{F^{'}(F^{-1}(w))} = \dfrac {1}{F^{'} \left (-\theta \log (1-w) \right )} = \dfrac {1}{\frac {1}{\theta } e^{- \frac {-\theta \log (1-w)}{\theta }}}=\dfrac {\theta }{1-w}, \\ H_{2}^{'}(w) & = \big [\big (F^{-1}(w)\big )^2\big ]^{'} =\dfrac {2F^{-1}(w)}{F^{'}(F^{-1}(w))}= \dfrac {-2\theta \log (1-w)}{F^{'} \left ( \theta \log (1-w) \right )} = \dfrac {-2\theta \log (1-w)}{\frac {1}{\theta } e^{- \frac {-\theta \log (1-w)}{\theta }}}=-\dfrac {2\theta ^2\log (1-w)}{1-w}. \end{align*}
For the process variance and covariance, Zhao et al. (Reference Zhao, Brazauskas and Ghorai2018) have proved that for a location-scale or log-location-scale family distribution, and
 $p_{i}=p_{j}=p,q_{i}=q_{j}=q$
, Eq. (26) leads to
$p_{i}=p_{j}=p,q_{i}=q_{j}=q$
, Eq. (26) leads to
 \begin{align*} \mathbb{V}ar(Y \mid \theta ) & = \theta ^{2}\bigg\{m_{2}(p,q)-m_{1}^{2}(p,q)+2\left[m_{1}(p,q)\, (A-B) + B ({-}\log q) -A \big ({-}\log (1-p)\big )\right]\\ & \quad -(A-B)^2+\frac {A^{2}}{p}+\frac {B^{2}}{q}\bigg\}\\[-5pt] & \,:\!=\, \theta ^{2}v_{1}(p,q), \qquad \mbox{where} \quad A=p^2\,H_{1}^{'}(p)/\theta =\frac {p^2}{1-p},\,B=q^2\,H_{1}^{'}(1-q)/\theta =q. \end{align*}
 \begin{align*} \mathbb{V}ar \left ( Y^2 \mid \theta \right ) & = \theta ^{4} \bigg \{m_{4}(p,q)-m_{2}(p,q)^{2}+2\big [m_{2}(p,q) (C-D)+D \log ^{2}(q)-C\log ^{2}(1-p)\big ] \\ & \quad -(C-D)^{2} +\frac {C^2}{p}+\frac {D^2}{q}\bigg \}\\ & \,:\!=\, \theta ^{4}v_{2}(p,q), \\ \mbox{where } C & = p^2\,H_{2}^{'}(p)/\theta ^2=-p^{2}\dfrac {2\log (1-p)}{1-p} \mbox{ and } D=q^2\,H_{2}^{'}(1-q)/\theta ^2=-q^{2}\dfrac {2\log (q)}{q}. \\ \mathbb{C}ov \left ( Y^2,Y \mid \theta \right ) & = \theta ^{3} \bigg\{ m_{3}(p,q)-m_{1}(p,q)m_{2}(p,q)+m_{1}(p,q)(C-D)+ D({-}\log (q))\\& \quad -C ({-}\log (1-p)) + m_{2}(p,q)(A-B) + B\log ^{2}(q)-A\log ^{2}(1-p)\\& \quad -(A-B)(C-D)+\frac {AC}{p}+\frac {BD}{q} \bigg\} \\ & \,:\!=\, \theta ^{3}v_{3}(p,q). \end{align*}
When we consider the covariance of original value
 $X$
and robust version
$X$
and robust version
 $Y$
, we have
$Y$
, we have
 \begin{align*} \mathbb{C}ov(Y,X \mid \theta ) & = pH_{i}^{'}(p)\int _{p}^{1}H_{j}(s)\,ds+ qH_{i}^{'}(1-q)\int _{1-q}^{1}H_{j}(s)\,ds \\[8pt]& \quad -\left [p(1-p)H_{i}^{'}(p)+q^{2}H_{i}^{'}(1-q)\right ]\int _{0}^{1}H_{j}(s)\,ds\\[8pt] & \quad + \int _{0}^{1}\int _{p}^{1-q}H_{i}^{'}(r)H_{j}^{'}(s)\,[\min \, \{r,s\}-rs]\,dr\,ds\\[8pt] & = \theta ^2\bigg \{\frac {-p}{(1-p)}\int _{p}^{1}\log (1-s)\,ds-\int _{1-q}^{1}\log (1-s)\,ds+(p+q)\,\int _{0}^{1}\log (1-s)\,ds\\[8pt] & \quad + \int _{0}^{1}\int _{p}^{1-q}\frac {1}{1-r}\frac {1}{1-s}\,[\min \, \{r,s\}-rs]\,dr\,ds\bigg \}\\[8pt] & \,:\!=\, \theta ^2\,v_{4}(p,q),\quad \text{where}\, H_{i}(r)=F^{-1}(r)=-\theta \log (1-r), H_{j}(s) = -\theta \log (1-s). \\[12pt] \mathbb{C}ov \left ( Y^2,X \mid \theta \right ) & = p\frac {-2\theta ^2\log (1-p)}{1-p}\int _{p}^{1}-\theta \log (1-s)\,ds+ q\frac {-2\theta ^2\log (q)}{q}\int _{1-q}^{1}-\theta \log (1-s)\,ds \\[8pt] & \quad -\bigg [p(1-p)\frac {-2\theta ^2\log (1-p)}{1-p} +q^{2}\frac {-2\theta ^2\log (q)}{q} \bigg ]\,\int _{0}^{1}-\theta \log (1-s)\,ds \\[8pt] & \quad + \int _{0}^{1}\int _{p}^{1-q}\frac {-2\theta ^2\log (1-r)}{1-r}\frac {\theta }{1-s}\,[\min \, \{r,s\}-rs]\,dr\,ds\\[8pt] & = \theta ^{3}\bigg \{\frac {2\log (1-p)}{1-p}\int _{p}^{1}\log (1-s)\,ds+2\log (q)\int _{1-q}^{1}\log (1-s)\,ds \end{align*}
 \begin{align*} & \quad -\big [2p\log (1-p)+2q\log (q)\big ] \int _{0}^{1}\log (1-s)\,ds \\[4pt] & \quad - \int _{0}^{1}\int _{p}^{1-q}\frac {2\log (1-r)}{1-r}\frac {1}{1-s}\,[\min \, \{r,s\}-rs]\,dr\,ds\bigg \}\\[4pt] & \,:\!=\, \theta ^{3}v_{5}(p,q), \text{ where } H_{i}(r)=[F^{-1}(r)]^2=\theta ^2\log ^2(1-r), H_{j}(s) = F^{-1}(s)\\ & =-\theta \log (1-s). \end{align*}
When
 $\alpha \gt 4$
, using the moment formula of an Inverse Gamma distribution, we derived the collective premium, variance/covariance of hypothetical means, and the expectation of process variance/covariance for this Exponential-Inverse Gamma model. See details in Appendix B.1.
$\alpha \gt 4$
, using the moment formula of an Inverse Gamma distribution, we derived the collective premium, variance/covariance of hypothetical means, and the expectation of process variance/covariance for this Exponential-Inverse Gamma model. See details in Appendix B.1.
Exponential (
 $\theta$
)-inverse gamma (
$\theta$
)-inverse gamma (
 $5, 2$
) using winsorized data. Fix
$5, 2$
) using winsorized data. Fix
 $p=0$
, as
$p=0$
, as
 $q$
increases, left column shows the variance or covariance of mean under risk parameter
$q$
increases, left column shows the variance or covariance of mean under risk parameter
 $\theta$
; middle column panel shows the expectation of variance or covariance under risk parameter
$\theta$
; middle column panel shows the expectation of variance or covariance under risk parameter
 $\theta$
; right column panel shows the expectation of mean under risk parameter
$\theta$
; right column panel shows the expectation of mean under risk parameter
 $\theta$
.
$\theta$
.

Speaking of the connection between non-robust parameters and robust parameters, when
 $(p,q)\to (0,0)$
, the values
$(p,q)\to (0,0)$
, the values
 $m_{1}(p,q)\to\! 1, m_{2}(p,q)\to\! 2, m_{3}(p,q)\to\! -6, m_{4}(p,q)\to\! 24, v_{1}(p,q)\to 1,$
 $v_{2}(p,q)\to 20, v_{3}(p,q)\to -8, v_{4}(p,q)\to 1 , v_{5}(p,q)\to 4$
, and the winsorized mean
$v_{2}(p,q)\to 20, v_{3}(p,q)\to -8, v_{4}(p,q)\to 1 , v_{5}(p,q)\to 4$
, and the winsorized mean
 $\widehat {Y}$
converges to the original sample mean
$\widehat {Y}$
converges to the original sample mean
 $\widehat {X}$
. Then, the RQC factors
$\widehat {X}$
. Then, the RQC factors
 $z_{1}$
and
$z_{1}$
and
 $z_{2}$
become conventional
$z_{2}$
become conventional
 $q$
-credibility factors.
$q$
-credibility factors.
Fixed
 $p=0$
, we demonstrate the impact of the right-winzorizing proportion
$p=0$
, we demonstrate the impact of the right-winzorizing proportion
 $q$
(to take against extremely large loss) on the QRC estimation of this combination. As
$q$
(to take against extremely large loss) on the QRC estimation of this combination. As
 $q$
increases from 0 to 1, the structural parameters discussed above are visualized in Figure 1. The prior distribution of the Inverse Gamma is set with parameters
$q$
increases from 0 to 1, the structural parameters discussed above are visualized in Figure 1. The prior distribution of the Inverse Gamma is set with parameters
 $ \alpha = 5$
and
$ \alpha = 5$
and
 $ \beta = 2$
. The similarity between
$ \beta = 2$
. The similarity between
 $ v$
and
$ v$
and
 $ k$
, as well as between
$ k$
, as well as between
 $ g$
and
$ g$
and
 $ l$
, raises the question of whether this behavior is influenced by the conjugate prior. As the right winsorizing proportion
$ l$
, raises the question of whether this behavior is influenced by the conjugate prior. As the right winsorizing proportion
 $ q$
increases, all structural parameters exhibit a decreasing trend. When comparing the transformed variable
$ q$
increases, all structural parameters exhibit a decreasing trend. When comparing the transformed variable
 $ Y$
with the original variable
$ Y$
with the original variable
 $ X$
, the variance of the hypothetical mean (VHM) for
$ X$
, the variance of the hypothetical mean (VHM) for
 $ Y$
declines more rapidly than that for
$ Y$
declines more rapidly than that for
 $ X$
. For instance,
$ X$
. For instance,
 $ b = \mathbb{E}[\mathbb{C}ov(Y^2,Y \mid \theta )]$
approaches 0.15 when
$ b = \mathbb{E}[\mathbb{C}ov(Y^2,Y \mid \theta )]$
approaches 0.15 when
 $ q = 0.125$
, whereas
$ q = 0.125$
, whereas
 $ l = \mathbb{E}[\mathbb{C}ov(Y^2,X \mid \theta )]$
remains around 0.2. In addition, while
$ l = \mathbb{E}[\mathbb{C}ov(Y^2,X \mid \theta )]$
remains around 0.2. In addition, while
 $ Y^2$
exhibits a curved pattern,
$ Y^2$
exhibits a curved pattern,
 $ Y$
follows a more linear trend. The change in the expected process variance (EPV) is notably more significant than that in the VHM.
$ Y$
follows a more linear trend. The change in the expected process variance (EPV) is notably more significant than that in the VHM.
Similarly, the credibility factors
 $z_{1}$
and
$z_{1}$
and
 $z_{2}$
are visualized in Figure 2. The coefficient
$z_{2}$
are visualized in Figure 2. The coefficient
 $ z_1$
begins at approximately 1 and consistently increases as
$ z_1$
begins at approximately 1 and consistently increases as
 $ q$
grows. Meanwhile,
$ q$
grows. Meanwhile,
 $ z_2$
remains close to 0, suggesting that the first moment contributes substantially more to the premium credibility model than the second moment. However, when
$ z_2$
remains close to 0, suggesting that the first moment contributes substantially more to the premium credibility model than the second moment. However, when
 $ q$
approaches 0.7,
$ q$
approaches 0.7,
 $ z_1$
exhibits a sharp increase, indicating unreliable factor estimation when the remaining sample size of original values becomes too small. Furthermore,
$ z_1$
exhibits a sharp increase, indicating unreliable factor estimation when the remaining sample size of original values becomes too small. Furthermore,
 $ z_1$
extends beyond the range
$ z_1$
extends beyond the range
 $[0,1]$
, and
$[0,1]$
, and
 $ z_2$
can take both positive and negative values, further highlighting the instability in factor estimation under extreme winsorizing proportions.
$ z_2$
can take both positive and negative values, further highlighting the instability in factor estimation under extreme winsorizing proportions.
Exponential (
 $\theta$
)-inverse gamma (
$\theta$
)-inverse gamma (
 $5, 2$
). left panel shows the values of
$5, 2$
). left panel shows the values of
 $z_{1}$
for different
$z_{1}$
for different
 $q^{\prime}s$
with
$q^{\prime}s$
with
 $p=0$
; right panel shows the values of
$p=0$
; right panel shows the values of
 $z_{2}$
for different
$z_{2}$
for different
 $q^{\prime}s$
with
$q^{\prime}s$
with
 $p=0$
.
$p=0$
.

3.2 Lognormal-normal
In contrast to the Exponential-Inverse Gamma model that belongs to the shape-scale family, we pick up Lognormal-Normal (the typical log-transformation of location-scale family distributions) in the second illustration and show the general application of the proposed approach.
For loss random variable
 $X \mid \theta \sim \mbox{LogNormal}(\theta , \sigma ^2)$
, and
$X \mid \theta \sim \mbox{LogNormal}(\theta , \sigma ^2)$
, and
 $\theta \sim \mbox{Normal}(\mu , v^2)$
, we have the cdf of conditional distribution
$\theta \sim \mbox{Normal}(\mu , v^2)$
, we have the cdf of conditional distribution
 \begin{equation*}F(x \mid \theta )=\Phi \left (\frac {\log x-\theta }{\sigma }\right ),\end{equation*}
where
 $-\infty \lt \theta \lt \infty$
and
$-\infty \lt \theta \lt \infty$
and
 $\sigma \gt 0$
. This parameter setting guarantees the existence of the mean and variance. And the quantile function
$\sigma \gt 0$
. This parameter setting guarantees the existence of the mean and variance. And the quantile function
 $F^{-1}(w)=e^{\theta +\sigma \Phi ^{-1}(w)}$
.
$F^{-1}(w)=e^{\theta +\sigma \Phi ^{-1}(w)}$
.
From Appendix B.2, we have
 \begin{equation*} \int _{0}^{a}\left [F^{-1}(w)\right ]^k dw = e^{k\theta +\frac {1}{2}k^2\sigma ^{2}}\,\Phi \left (\Phi ^{-1}(a)-k\sigma \right ). \end{equation*}
Then, Eq. (20) leads to the hypothetical moments
 \begin{align*} \mu _{Y}^{1}(\theta ) & = e^{\theta }\left \{p e^{\sigma \Phi ^{-1}(p)}+\int _{p}^{1-q}e^{\sigma \Phi ^{-1}(w)}dw+q e^{\sigma \Phi ^{-1}(1-q)}\right \} \\& = e^{\theta }\left\{p e^{\sigma \Phi ^{-1}(p)}+e^{\frac {1}{2}\sigma ^{2}}\left [\Phi \left (\Phi ^{-1}(1-q)-\sigma \right )-\Phi \left (\Phi ^{-1}(p)-\sigma \right )\right ]+q e^{\sigma \Phi ^{-1}(1-q)}\right\} \\ & \,:\!=\, e^{\theta } m_{1}(p,q). \end{align*}
 \begin{align*} \mu _{Y}^{2}(\theta ) & = e^{2\theta }\left \{p e^{2\sigma \Phi ^{-1}(p)}+ e^{2\sigma ^{2}}\left [\Phi \left (\Phi ^{-1}(1-q)-2\sigma \right )-\Phi \left (\Phi ^{-1}(p)-2\sigma \right )\right ] +q e^{2\sigma \Phi ^{-1}(1-q)} \right \} \\[3pt] & \,:\!=\, e^{2\theta }m_{2}(p,q).\\[3pt] \mu _{Y}^{3}(\theta )& = e^{3\theta }\left\{ p e^{3\sigma \Phi ^{-1}(p)}+ e^{9/2\sigma ^{2}}\left [\Phi \left (\Phi ^{-1}(1-q)-3\sigma \right )-\Phi \left (\Phi ^{-1}(p)-3\sigma \right )\right ] +q e^{3\sigma \Phi ^{-1}(1-q)} \right\} \\[3pt] & \,:\!=\, e^{3\theta } m_{3}(p,q). \\[3pt] \mu _{Y}^{4}(\theta )& = e^{4\theta }\left\{ p e^{4\sigma \Phi ^{-1}(p)}+ e^{8\sigma ^{2}}\left [\Phi \left (\Phi ^{-1}(1-q)-4\sigma \right )-\Phi \left (\Phi ^{-1}(p)-4\sigma \right )\right ] +q e^{4\sigma \Phi ^{-1}(1-q)} \right\}\\[3pt] & \,:\!=\, e^{4\theta } m_{4}(p,q). \end{align*}
In addition, the derivative of LogNormal quantile functions is
 \begin{align*} H^{'}(w)&=\dfrac {1}{F^{'}\big (e^{\theta +\sigma \Phi ^{-1}(w)}\big )}=\dfrac {\sigma e^{\theta +\sigma \Phi ^{-1}(w)}}{\frac {1}{\sqrt {2\pi }} e^{-\left (\frac {\log e^{\theta +\sigma \Phi ^{-1}(w)}-\theta }{\sigma }\right )^2/2}}=e^\theta \,\sqrt {2\pi }\sigma \, e^{[\Phi ^{-1}(w)]^2/2+\sigma \Phi ^{-1}(w)} =: e^{\theta }G^{'}(w). \end{align*}
And based upon Eq. (26), the conditional variance and covariance are given by
 \begin{align*} \mathbb{V}ar(Y \mid \theta ) & = e^{2\theta }\bigg \{m_{2}(p,q)-m_{1}^{2}(p,q)+2\Big [m_{1}(p,q)\, (A-B) + B (e^{\sigma \Phi ^{-1}(1-q)}) -A (e^{\sigma \Phi ^{-1}(p)})\Big ]\\& \quad -(A-B)^2+\frac {A^{2}}{p}+\frac {B^{2}}{q}\bigg \}\\ & \,:\!=\, e^{2\theta }v_{1}(p,q), \mbox{ where } A=p^{2}G^{'}(p),\, B=q^{2}G^{'}(1-q), \\ \mathbb{V}ar \left ( Y^2 \mid \theta \right )& = e^{4\theta } \bigg \{m_{4}(p,q)-m_{2}(p,q)^{2}+2\Big [m_{2}(p,q) (C-D)+D (e^{2\sigma \Phi ^{-1}(1-q)})-C(e^{2\sigma \Phi ^{-1}(p)})\Big ] \\ & \quad -(C-D)^{2} +\frac {C^2}{p}+\frac {D^2}{q}\bigg \}\\ & \,:\!=\, e^{4\theta }v_{2}(p,q), \text{ where } C = 2p^{2}e^{\sigma \Phi ^{-1}(p)}G^{'}(p),\, D=2q^{2}e^{\sigma \Phi ^{-1}(1-q)}G^{'}(q),\end{align*}
 \begin{align*} \mathbb{C}ov \left ( Y^2,Y \mid \theta \right ) & = e^{3\theta } \bigg \{m_{3}(p,q)-m_{1}(p,q)m_{2}(p,q)+m_{1}(p,q)(C-D)+ D\big(e^{\sigma \Phi ^{-1}(1-q)}\big)\\ & \quad -C (e^{\sigma \Phi ^{-1}(p)}) + m_{2}(p,q)(A-B) + B(e^{2\sigma \Phi ^{-1}(1-q)})-A(e^{2\sigma \Phi ^{-1}(p)})\\ & \quad -(A-B)(C-D)+\frac {AC}{p}+\frac {BD}{q}\bigg \}\\ & \,:\!=\, e^{3\theta }v_{3}(p,q), \\ \mathbb{C}ov \left ( Y,X \mid \theta \right ) & = pH_{i}^{'}(p)\int _{p}^{1}H_{j}(s)\,ds+ qH_{i}^{'}(1-q)\int _{1-q}^{1}H_{j}(s)\,ds \\ & \quad -\left [p(1-p)H_{i}^{'}(p)+q^{2}H_{i}^{'}(1-q)\right ]\int _{0}^{1}H_{j}(s)\,ds\\ & \quad + \int _{0}^{1}\int _{p}^{1-q}H_{i}^{'}(r)H_{j}^{'}(s)\,[\min \, \{r,s\}-rs]\,dr\,ds\\ & = e^{2\theta }\bigg \{pG^{'}(p)\int _{p}^{1}e^{\sigma \Phi ^{-1}(s)}\,ds+ qG^{'}(1-q)\int _{1-q}^{1}e^{\sigma \Phi ^{-1}(s)}\,ds \\ & \quad -[p(1-p)G^{'}(p)+q^{2}G^{'}(1-q)] \int _{0}^{1}e^{\sigma \Phi ^{-1}(s)}\,ds \\ &\quad + \int _{0}^{1}\int _{p}^{1-q}G^{'}(r)G^{'}(s)\,[\min \, \{r,s\}-rs]\,dr\,ds\bigg \}\\ & \,:\!=\, e^{2\theta }v_{4}(p,q), \text{ where } H_{i}(r)=e^{\theta +\sigma \Phi ^{-1}(r)}, H_{j}(s) = e^{\theta +\sigma \Phi ^{-1}(s)}, \\[12pt] \mathbb{C}ov \left ( Y^2,X \mid \theta \right )& = p\,2e^{\theta +\sigma \Phi ^{-1}(p)}H^{'}(p)\int _{p}^{1}e^{\theta +\sigma \Phi ^{-1}(s)}\,ds\\ & \quad + q\, 2e^{\theta +\sigma \Phi ^{-1}(1-q)}H^{'}(1-q)\int _{1-q}^{1}e^{\theta +\sigma \Phi ^{-1}(s)}\,ds\\ & \quad -[p(1-p)2e^{\theta +\sigma \Phi ^{-1}(p)}H^{'}(p)+q^{2}2e^{\theta +\sigma \Phi ^{-1}(1-q)}H^{'}(1-q)]\,\int _{0}^{1}e^{\theta +\sigma \Phi ^{-1}(s)}\,ds\\ & \quad + \int _{0}^{1}\int _{p}^{1-q}2e^{\theta +\sigma \Phi ^{-1}(r)}H^{'}(r)H^{'}(s)\,[\min \, \{r,s\}-rs]\,dr\,ds\\ & = e^{3\theta }\bigg \{2pe^{\sigma \Phi ^{-1}(p)}G^{'}(p)\int _{p}^{1}e^{\sigma \Phi ^{-1}(w)}\,ds+ 2qe^{\sigma \Phi ^{-1}(1-q)}G^{'}(1-q)\int _{1-q}^{1}e^{\sigma \Phi ^{-1}(s)}\,ds \\ & \quad -\left [2p(1-p)e^{\sigma \Phi ^{-1}(p)}G^{'}(p)+2q^{2}e^{\sigma \Phi ^{-1}(1-q)}G^{'}(1-q)\right ]\int _{0}^{1}e^{\sigma \Phi ^{-1}(s)}\,ds \\ &\quad + \int _{0}^{1}\int _{p}^{1-q}2e^{\sigma \Phi ^{-1}(r)}G^{'}(r)G^{'}(s)\,[\min \, \{r,s\}-rs]\,dr\,ds\bigg \} \\ & \,:\!=\, e^{3\theta }v_{5}(p,q), \text{ where } H_{i}(r)=e^{2\theta +2\sigma \Phi ^{-1}(r)}, H_{j}(s) = e^{\theta +\sigma \Phi ^{-1}(s)}. \end{align*}
Therefore, if the risk parameter
 $\theta$
is normally distributed with mean of
$\theta$
is normally distributed with mean of
 $\mu$
and variance of
$\mu$
and variance of
 $v^{2}$
, the structural parameters for credibility premium are listed in Appendix B.3.
$v^{2}$
, the structural parameters for credibility premium are listed in Appendix B.3.
As seen in Figure 3, all the structural parameters exhibit a decreasing curvature as
 $q$
increases between 0 and 1, indicating a consistent trend across different parameter settings. A significant difference between
$q$
increases between 0 and 1, indicating a consistent trend across different parameter settings. A significant difference between
 $ v$
and
$ v$
and
 $ k$
becomes evident when
$ k$
becomes evident when
 $ q \gt 0.75$
, suggesting that higher winsorizing proportions have a notable impact on the relationship between variance and covariance structures. Additionally, both
$ q \gt 0.75$
, suggesting that higher winsorizing proportions have a notable impact on the relationship between variance and covariance structures. Additionally, both
 $ v$
and
$ v$
and
 $ g$
reach their minimum values before increasing again as
$ g$
reach their minimum values before increasing again as
 $ q$
approaches 1, highlighting a non-monotonic pattern in their behavior. When comparing the transformed variable
$ q$
approaches 1, highlighting a non-monotonic pattern in their behavior. When comparing the transformed variable
 $ Y$
with the original variable
$ Y$
with the original variable
 $ X$
, the variance of the hypothetical mean decreases more rapidly for
$ X$
, the variance of the hypothetical mean decreases more rapidly for
 $ Y$
than for
$ Y$
than for
 $ X$
. For example, as
$ X$
. For example, as
 $ q$
increases to 0.5,
$ q$
increases to 0.5,
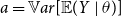 $ a = \mathbb{V}ar[\mathbb{E}(Y \mid \theta )]$
nearly reaches 7, whereas
$ a = \mathbb{V}ar[\mathbb{E}(Y \mid \theta )]$
nearly reaches 7, whereas
 $ e = \mathbb{C}ov[\mathbb{E}(Y, X \mid \theta )]$
remains around 9, further illustrating the differential impact of winsorization on these structural parameters.
$ e = \mathbb{C}ov[\mathbb{E}(Y, X \mid \theta )]$
remains around 9, further illustrating the differential impact of winsorization on these structural parameters.
Lognormal
 $(\theta , 0.4^2)$
-normal
$(\theta , 0.4^2)$
-normal
 $(1.5, 1^2)$
using winsorized data. Fix
$(1.5, 1^2)$
using winsorized data. Fix
 $p=0$
, as
$p=0$
, as
 $q$
increases, left column shows the variance or covariance of mean under risk parameter
$q$
increases, left column shows the variance or covariance of mean under risk parameter
 $\theta$
; middle column panel shows the expectation of variance or covariance under risk parameter
$\theta$
; middle column panel shows the expectation of variance or covariance under risk parameter
 $\theta$
; right column panel shows the expectation of mean under risk parameter
$\theta$
; right column panel shows the expectation of mean under risk parameter
 $\theta$
.
$\theta$
.

The credibility factors
 $z_{1}$
and
$z_{1}$
and
 $z_{2}$
, as visualized in Figure 4, can be described similarly to those in the Exponential-Inverse Gamma model shown in Figure 2.
$z_{2}$
, as visualized in Figure 4, can be described similarly to those in the Exponential-Inverse Gamma model shown in Figure 2.
Lognormal
 $(\theta , 0.4^2)$
-normal
$(\theta , 0.4^2)$
-normal
 $(1.5, 1^2)$
using winsorized data. Left panel shows the values of
$(1.5, 1^2)$
using winsorized data. Left panel shows the values of
 $z_{1}$
for different
$z_{1}$
for different
 $q^{\prime}s$
with
$q^{\prime}s$
with
 $p=0$
; Right panel shows the values of
$p=0$
; Right panel shows the values of
 $z_{2}$
for different
$z_{2}$
for different
 $q^{\prime}s$
with
$q^{\prime}s$
with
 $p=0$
.
$p=0$
.

4. Nonparametric estimation
We illustrate the ideas with a simple Bühlmann-type model and we consider individual claim losses
 $(X_{ij})$
in the structure. Suppose there are
$(X_{ij})$
in the structure. Suppose there are
 $r (r\geq 1)$
groups of risks in a portfolio and the number of observations
$r (r\geq 1)$
groups of risks in a portfolio and the number of observations
 $n_{i}$
varies between risks. Then for
$n_{i}$
varies between risks. Then for
 $ith$
group, we have the risk parameter
$ith$
group, we have the risk parameter
 $\theta _{i}$
, and the loss vector
$\theta _{i}$
, and the loss vector
 ${\textbf {X}}_{i}=(X_{i1},\ldots ,X_{in_{i}}),\, i=1,\ldots ,r.$
It is assumed that for each group
 $i$
,
$i$
,
 $X_{ij}$
share the identical risk parameter
$X_{ij}$
share the identical risk parameter
 $\theta _{i}$
and it does not change over time. Then, the hypothetical mean
$\theta _{i}$
and it does not change over time. Then, the hypothetical mean
 $\mathbb{\mathbb{E}}[X_{ij} \mid \theta _{i}]=\mu _{X}(\theta _{i})$
and process variance
$\mathbb{\mathbb{E}}[X_{ij} \mid \theta _{i}]=\mu _{X}(\theta _{i})$
and process variance
 $\mathbb{V}ar(X_{ij} \mid \theta _{i})=v(\theta _{i})$
. Under each risk parameter
$\mathbb{V}ar(X_{ij} \mid \theta _{i})=v(\theta _{i})$
. Under each risk parameter
 $\theta _{i}$
, the conditional
$\theta _{i}$
, the conditional
 $X_{ij} \mid \theta _{i}$
are assumed to be independent and identically distributed. Our objective is to estimate the risk premium for each group
$X_{ij} \mid \theta _{i}$
are assumed to be independent and identically distributed. Our objective is to estimate the risk premium for each group
 $i$
, using the robust credibility approaches. And then determine the total premium for the entire portfolio.
$i$
, using the robust credibility approaches. And then determine the total premium for the entire portfolio.
Let
 $Y_{ij}$
be the winsorized version of
$Y_{ij}$
be the winsorized version of
 $X_{ij}$
by Eq. (19). Then, as the number of observations
$X_{ij}$
by Eq. (19). Then, as the number of observations
 $n_{i}\to \infty$
, the empirical hypothetical mean converges to the parameters such that
$n_{i}\to \infty$
, the empirical hypothetical mean converges to the parameters such that
 \begin{align} & \widehat {\mu }_{Y}^{(i)}=\dfrac {\sum _{j=1}^{n_{i}}Y_{ij}}{n_{i}} \to \mu _{Y}(\theta _{i}) \end{align}
Besides, the empirical estimate,
 $\widehat {v}_{i}^{(k)}$
, of process variance
$\widehat {v}_{i}^{(k)}$
, of process variance
 $v^{k}(\theta _{i})$
are empirical estimate of Eq. (24). All these lead to the robust version of empirical structural parameters for the entire portfolio.
$v^{k}(\theta _{i})$
are empirical estimate of Eq. (24). All these lead to the robust version of empirical structural parameters for the entire portfolio.
We categorize the expectation of hypothetical mean (EHM), expectation of process variance or covariance (EPV), and variance or covariance of hypothetical moment (VHM) into three distinct groups. The empirical estimates of these structural parameters, as introduced in Eq. (7), are denoted
 \begin{align*} &\text{EHM}\quad &&\widehat {\mu _{Y}^{1}}=\widehat {Y}=\frac {1}{N}\sum _{i=1}^{r}n_{i}\,\widehat {Y_{i}}=\frac {1}{N}\sum _{i=1}^{r} \, \sum _{j=1}^{n_{i}}Y_{ij}, \\ & &&\widehat {\mu _{Y}^{2}}=\widehat {Y^2}=\frac {1}{N}\sum _{i=1}^{r}n_{i}\,\widehat {Y_{i}^{2}}=\frac {1}{N}\sum _{i=1}^{r} \, \sum _{j=1}^{n_{i}}Y_{ij}^{2}, \\ & && \widehat {\mu _{X}^{1}}=\widehat {X}=\frac {1}{N}\sum _{i=1}^{r}n_{i}\,\widehat {X_{i}}=\frac {1}{N}\sum _{i=1}^{r} \, \sum _{j=1}^{n_{i}}X_{ij}, \end{align*}
 \begin{align*} &\text{EPV}\quad && \widehat {v}=\frac {\sum _{i=1}^{r} \, \sum _{j=1}^{n_{i}} \left ( Y_{ij}-\widehat {Y_{i}} \right )^{2}}{N-r}, \\[4pt] & && \widehat {u} = \frac {\sum _{i=1}^{r} \, \sum _{j=1}^{n_{i}} \left ( X_{ij}-\widehat {X_{i}} \right )^{2}}{N-r}, \\[4pt] & && \widehat {h} = \frac {\sum _{i=1}^{r} \, \sum _{j=1}^{n_{i}} \Big( Y_{ij}^{2}-\widehat {Y_{i}^{2}} \Big)^{2}}{N-r}. \\[4pt] & && \widehat {g} = \frac {\sum _{i=1}^{r} \, \sum _{j=1}^{n_{i}} \left ( Y_{ij}^{2}-\widehat {Y_{i}^{2}} \right ) \left ( Y_{ij}-\widehat {Y_{i}} \right )}{N-r}, \\[4pt] & && \widehat {k}=\frac {\sum _{i=1}^{r} \, \sum _{j=1}^{n_{i}} \left ( Y_{ij}-\widehat {Y_{i}} \right ) \left ( X_{ij}-\widehat {X_{i}} \right )}{N-r}, \\[4pt] & && \widehat {l}=\frac {\sum _{i=1}^{r} \, \sum _{j=1}^{n_{i}} \left ( Y_{ij}^{2}-\widehat {Y_{i}^{2}} \right ) \left ( X_{ij}-\widehat {X_{i}} \right )}{N-r}, \\[4pt] &\text{VHM}\quad &&\widehat {a} = \frac {\sum _{i=1}^{r}n_{i}\, \left ( \widehat {Y_{i}}-\widehat {Y} \right )^{2}-(r-1)\widehat {v}}{N-\frac {1}{N} \sum _{i=1}^{r}n_{i}^{2}}, \\[4pt] & &&\widehat {c} = \frac {\sum _{i=1}^{r}n_{i}\, \left ( \widehat {Y_{i}^2}-\widehat {Y^2} \right )^{2}-(r-1)\widehat {h}}{N-\frac {1}{N} \sum _{i=1}^{r}n_{i}^{2}}, \\[4pt] & &&\widehat {d} = \frac {\sum _{i=1}^{r}n_{i}\, \left ( \widehat {X_{i}}-\widehat {X} \right )^{2}-(r-1)\widehat {u}}{N-\frac {1}{N} \sum _{i=1}^{r}n_{i}^{2}}, \\[4pt] & &&\widehat {b} = \frac {\sum _{i=1}^{r}n_{i}\, \left ( \widehat {Y_{i}^{2}}-\widehat {Y^{2}} \right ) \left ( \widehat {Y_{i}}-\widehat {Y} \right )-(r-1)\widehat {g}}{N-\frac {1}{N} \sum _{i=1}^{r}n_{i}^{2}}, \\[4pt] & &&\widehat {e} = \frac {\sum _{i=1}^{r}n_{i}\, \left ( \widehat {Y_{i}}-\widehat {Y} \right ) \left ( \widehat {X_{i}}-\widehat {X} \right )-(r-1)\widehat {k}}{N-\frac {1}{N} \sum _{i=1}^{r}n_{i}^{2}}, \\[4pt] & &&\widehat {f} = \frac {\sum _{i=1}^{r}n_{i}\, \left ( \widehat {Y_{i}^{2}}-\widehat {Y^{2}} \right ) \left ( \widehat {X_{i}}-\widehat {X} \right )-(r-1)\widehat {l}}{N-\frac {1}{N} \sum _{i=1}^{r}n_{i}^{2}}, \end{align*}
where
 $ N \,:\!=\, \sum _{i=1}^{r} n_{i}$
.
$ N \,:\!=\, \sum _{i=1}^{r} n_{i}$
.
Note 4.
All the VHMs are
 $\max \, \{VHM, 0 \}$
. Thus, if one of VHMs is
$\max \, \{VHM, 0 \}$
. Thus, if one of VHMs is
 $0$
, then the corresponding credibility factors
$0$
, then the corresponding credibility factors
 $z_{1}$
and
$z_{1}$
and
 $z_{2}$
are
$z_{2}$
are
 $0$
. In this scenario, the entire process does not provide a good experience.
$0$
. In this scenario, the entire process does not provide a good experience.
Therefore, the credibility factors for Group
 $i$
are
$i$
are
 \begin{eqnarray*} z_{1,i} & = & \ n_{i}\dfrac {\hat {e}(n_{i}\hat {c}+\hat {h})-\hat {f}(n_{i}\hat {b}+\hat {g})}{(n_{i}\hat {a}+\hat {v})(n_{i}\hat {c}+\hat {h})-(n_{i}\hat {b}+\hat {g})^{2}}, \\ z_{2,i} & = & n_{i}\dfrac {\hat {f}(n_{i}\hat {a}+\hat {v})-\hat {e}(n_{i}\hat {b}+\hat {g})}{(n_{i}\hat {a}+\hat {v})(n_{i}\hat {c}+\hat {h})-(n_{i}\hat {b}+\hat {g})^{2}}, \end{eqnarray*}
and the corresponding credibility premium is estimated by
 \begin{equation*} \widehat {P}_{i} = \widehat {\mu _{X}^{1}} + z_{1,i} \left ( \widehat {Y}_{i}-\widehat {\mu _{Y}^{1}} \right ) + z_{2,i} \left ( \widehat {Y_{i}^2}-\widehat {\mu _{Y}^{2}} \right ). \end{equation*}
We study the use of these estimators via a real data analysis in the next section.
5. Real data illustration
For numerical illustration, we conduct a real data analysis using the Switzerland insurance company dataset from Bühlmann & Gisler (Reference Bühlmann and Gisler2005, p. 124), which has also been analyzed in Yong et al. (Reference Yong, Zeng and Zhang2024).
The summary statistics of each type of property are listed in Table 1. It is clear that the loss data of each Policy resembles a right heavy-tailed distribution. Thus, we will see how the upper winsorizing proportion
 $q$
can take against the extreme claims and affect the credibility premium ultimately. We set
$q$
can take against the extreme claims and affect the credibility premium ultimately. We set
 $q=(0.05, 0.10,0.15,0.20)$
in robust winsorizing, and then derive the structural parameters for the above-mentioned property funds through the procedure discussed in Section 4. The collective premium for each class are displayed in Table 2. And one performance indicator, the root mean square error
$q=(0.05, 0.10,0.15,0.20)$
in robust winsorizing, and then derive the structural parameters for the above-mentioned property funds through the procedure discussed in Section 4. The collective premium for each class are displayed in Table 2. And one performance indicator, the root mean square error
 $ RMSE=\sqrt {MSE}$
, is defined and utilized to compare the accuracy of the estimation. In particular, a byproduct of RQC, robust semi-linear credibility using winsorized data has been derived by Eq. (11).
$ RMSE=\sqrt {MSE}$
, is defined and utilized to compare the accuracy of the estimation. In particular, a byproduct of RQC, robust semi-linear credibility using winsorized data has been derived by Eq. (11).
Summary statistics of 6 policies

Table 1 Long description
A table titled 'Summary statistics of 6 policies' with six rows and five columns. The columns are labeled 'Policy', 'Size', 'Min', 'Mean', 'Median', and 'Max'. Each row corresponds to a different policy, with values listed under each column. Row 1: Policy 1, Size 34, Min 214,266, Mean 367,613, Median 330,245, Max 880,000. Row 2: Policy 2, Size 22, Min 201,015, Mean 419,609, Median 297,623, Max 1,046,388. Row 3: Policy 3, Size 27, Min 208,415, Mean 595,402, Median 319,141, Max 2,485,646. Row 4: Policy 4, Size 8, Min 201,232, Mean 567,279, Median 565,936, Max 1,005,186. Row 5: Policy 5, Size 12, Min 201,991, Mean 730,042, Median 461,904, Max 2,112,000. Row 6: Policy 6, Size 24, Min 210,000, Mean 671,737, Median 475,000, Max 3,000,000.
Estimated credibility factors (
 $z_{1}$
and
$z_{1}$
and
 $z_{2}$
), premiums (
$z_{2}$
), premiums (
 $\hat {p}$
), and RMSE under robust
$\hat {p}$
), and RMSE under robust
 $q$
-credibility (RQC),
$q$
-credibility (RQC),
 $q$
-credibility, semi-linear credibility (SLC), and classical structures
$q$
-credibility, semi-linear credibility (SLC), and classical structures

Table 2 Long description
A table comparing estimated credibility factors, premiums, and RMSE under different credibility structures. The table has 20 rows and 10 columns. Column headers are Estimate, Policy 1, Policy 2, Policy 3, Policy 4, Policy 5, and Policy 6. Row labels include q values (0.05, 0.10, 0.15, 0.20), z1, z2 (10^-6), p (millions), and RMSE (10^6) for both RQC and SLC structures. The table presents data for different policies under various credibility structures and q values. Each row provides specific estimates for z1, z2, premiums, and RMSE values. Notable trends include variations in premiums and RMSE values across different policies and credibility structures.
The RQC framework, within each policy, follows a clear pattern in which small values of
 $ q$
(such as
$ q$
(such as
 $ q = 0.05, 0.1, 0.15$
) lead to a reduction in RMSE, while large values of
$ q = 0.05, 0.1, 0.15$
) lead to a reduction in RMSE, while large values of
 $ q$
(such as
$ q$
(such as
 $ q = 0.2$
) cause an increase. A similar trend is observed in the semi-linear credibility model. Policy 5 consistently has a significantly higher premium across all credibility methods, regardless of the winsorizing proportion
$ q = 0.2$
) cause an increase. A similar trend is observed in the semi-linear credibility model. Policy 5 consistently has a significantly higher premium across all credibility methods, regardless of the winsorizing proportion
 $ q$
. When
$ q$
. When
 $ q = 0.05$
, the RQC premiums are generally at least as stable as those under the semi-linear credibility model, whereas an opposite trend appears when
$ q = 0.05$
, the RQC premiums are generally at least as stable as those under the semi-linear credibility model, whereas an opposite trend appears when
 $ q = 0.10$
. The empirical results further validate the theoretical findings, particularly the inequality relations established in Proposition2:
$ q = 0.10$
. The empirical results further validate the theoretical findings, particularly the inequality relations established in Proposition2:
 \begin{align*} MSE_{\mbox{rqc}} \leq MSE_{\mbox{slc}} \leq MSE_{\mbox{cc}} \quad \mbox{and} \quad MSE_{\mbox{rqc}} \leq MSE_{\mbox{qc}} \leq MSE_{\mbox{cc}}. \end{align*}
In particular, when
 $ q$
is small,
$ q$
is small,
 $ MSE_{\mbox{qc}}$
exhibits a decreasing trend, reflecting an improvement in predictive accuracy. However, as
$ MSE_{\mbox{qc}}$
exhibits a decreasing trend, reflecting an improvement in predictive accuracy. However, as
 $ q$
increases beyond a certain threshold, the MSE begins to rise, indicating a potential loss of efficiency due to excessive winsorization. In Policy 3, premium estimates under both RQC and semi-linear credibility remain unchanged for a fixed winsorizing proportion
$ q$
increases beyond a certain threshold, the MSE begins to rise, indicating a potential loss of efficiency due to excessive winsorization. In Policy 3, premium estimates under both RQC and semi-linear credibility remain unchanged for a fixed winsorizing proportion
 $ q$
. Compared to
$ q$
. Compared to
 $ q$
-credibility, a small adjustment in the right winsorizing proportion increases the premiums of Policies 3 and 6 while slightly reducing the premiums of other policies. Within the RQC framework, the credibility factors
$ q$
-credibility, a small adjustment in the right winsorizing proportion increases the premiums of Policies 3 and 6 while slightly reducing the premiums of other policies. Within the RQC framework, the credibility factors
 $ z_1$
and
$ z_1$
and
 $ z_2$
, despite differing in scale, maintain a balancing effect in credibility contribution. A negative
$ z_2$
, despite differing in scale, maintain a balancing effect in credibility contribution. A negative
 $ z_2$
requires a sufficiently large
$ z_2$
requires a sufficiently large
 $ z_1$
to balance the trade-off between first- and second-moment experience information contributions, thereby ensuring robustness in credibility estimation.
$ z_1$
to balance the trade-off between first- and second-moment experience information contributions, thereby ensuring robustness in credibility estimation.
Further, to see the benefits of our RQC approach, we conduct a sensitivity analysis by increasing the maximum observed value in Policy 4 by a factor of four; this policy has the smallest sample size in the portfolio. The objectives are twofold: To assess how the estimated premiums – both at the individual policy level and in aggregate – respond to the modification of a single data point; to provide a detailed comparison of RMSEs between the proposed RQC method and the traditional
 $q$
–credibility approach. Our key findings from Table 3 are as follows:
$q$
–credibility approach. Our key findings from Table 3 are as follows:
-
• Consistent with results from the original data, the RMSEs consistently decrease when moving from RQC to
$q-$
credibility for each policy. However, the magnitude of improvement varies across policies and depends on the chosen winsorizing proportion
$q$
. -
• The impact of the modified data is more pronounced in Policy 4, with an amplification of 29.134% under the optimal choice of
$q=0.10$
, compared to its effect on the overall portfolio. -
• The total premium remains more stable under RQC than under
$q-$
credibility when the data are modified. For example, at a small proportion
$q=0.05$
, the change in total premium decreases from the benchmark value of 4.133% to 3.658%.


6. Concluding remarks
This study introduced the RQC framework, which extends classical and semi-linear credibility models by incorporating second-order polynomial adjustments of transformed loss data. The motivation behind RQC is to enhance the stability and predictive accuracy of credibility premiums, particularly in the presence of extreme claims and heavy-tailed distributions, while accounting for nonlinear dependencies in claim data.
Sensitivity analysis: the change of premium,
 $\hat {p}$
, and the decrease of RMSE from RQC to
$\hat {p}$
, and the decrease of RMSE from RQC to
 $q$
-credibility models when the maximum observed value in Policy 4 was increased by a factor of four
$q$
-credibility models when the maximum observed value in Policy 4 was increased by a factor of four

Table 3 Long description
A table comparing the change in premium and RMSE decrease across different policies and q-values. The table has 6 columns and 13 rows. The columns are labeled as Estimate, Policy 1, Policy 2, Policy 3, Policy 4, Policy 5, Policy 6, and Total. The rows are labeled with different q-values (0.05, 0.10, 0.15, 0.20) and q-credibility. Each row provides the change in premium (p change percent) and RMSE decrease percent for each policy and the total. Row 1: q = 0.05, p change percent, -0.351, -0.432, 8.264, 21.531, 1.917, 1.242, 3.658. Row 2: q = 0.05, RMSE decrease percent, 0.102, 0.110, 0.107, 0.096, 0.107, 0.109, -. Row 3: q = 0.10, p change percent, 0.688, 2.118, 0.044, 29.134, 3.844, 2.907, 3.547. Row 4: q = 0.10, RMSE decrease percent, 0.503, 0.539, 0.525, 0.494, 0.536, 0.534, -. Row 5: q = 0.15, p change percent, -1.935, 3.032, -3.199, 11.200, 4.935, 14.960, 3.851. Row 6: q = 0.15, RMSE decrease percent, 0.539, 0.542, 0.543, 0.469, 0.514, 0.543, -. Row 7: q = 0.20, p change percent, -6.026, 1.332, 2.249, 9.836, 4.798, 15.971, 3.943. Row 8: q = 0.20, RMSE decrease percent, 0.457, 0.499, 0.472, 0.662, 0.609, 0.486, -. Row 9: q-credibility, p change percent, -0.884, -1.471, 9.497, 18.157, -0.175, 5.852, 4.123.
By integrating winsorized transformations of ground-up loss data into the credibility model, we derived closed-form expressions for the RQC premium and established its asymptotic properties. Analytical comparisons demonstrated that RQC effectively reduces MSE and captures claim heterogeneity, thereby improving the robustness of nonlinear Bayesian credibility estimation. The sensitivity analysis further indicates that RQC offers clear advantages over QC when tested against a single data modification in the credibility estimation. Furthermore, the theoretical findings were validated through two parametric examples – Exponential-Inverse Gamma and Lognormal-Normal models – illustrating the practical advantages of RQC in credibility premium estimation.
As a byproduct of this scholarly work, we also derived semi-linear credibility structural parameters using winsorized data, reinforcing the robustness of credibility estimation. This extension provides an additional layer of stability in handling extreme claims, making credibility models more adaptable to practical actuarial applications.
To our knowledge, this study contributes to credibility theory by providing a second-order credibility framework that systematically incorporates transformed data, offering a more robust approach to nonlinear Bayesian credibility estimation. Future research could explore extensions to higher-degree polynomial structures beyond quadratic forms, multivariate credibility models, and broader actuarial applications, such as risk pricing in reinsurance and health insurance. Moreover, integrating advanced statistical learning techniques into credibility models may further enhance predictive performance in high-dimensional settings.
Acknowledgment
We are grateful to the handling editor and the two anonymous reviewers for their thorough assessment of this manuscript and their many helpful suggestions. Their detailed feedback on the presentation, theoretical content, and numerical analyses has led to substantial improvements in clarity and overall quality.
Data availability statement
The dataset used in this study is publicly available and can be found on page 124 of Bühlmann & Gisler (Reference Bühlmann and Gisler2005) – A Course in Credibility Theory and Its Applications. The code supporting the findings of this research will be made available by the corresponding author, C.P., upon reasonable request.
Funding statement
This research received no external funding.
Competing interest
The authors declare no conflicts of interest.
Appendix A. Auxiliary Results
A.1 Proof of Lemma1
With the notations from Eq. (7) and
 $\widehat {Y^{k}}$
,
$\widehat {Y^{k}}$
,
 $k \ge 1$
as defined in Eq. (6), we have
$k \ge 1$
as defined in Eq. (6), we have
-
(i) The law of total variance gives us
\begin{equation*} \mathbb{V}ar(\widehat {Y})= \mathbb{V}ar\big (\mathbb{E}\big [\widehat {Y} \mid \theta \big ]\big )+\mathbb{E}\big [\mathbb{V}ar\big (\widehat {Y} \mid \theta \big )\big ] = \mathbb{V}ar\big (\mu _{Y}^{1}(\theta )\big )+\mathbb{E}\big [\mathbb{V}ar\big (\widehat {Y} \mid \theta \big )\big ]=a+\dfrac {v}{n}. \end{equation*}
-
(ii) Again, using the law of total variance, we have
\begin{equation*} \mathbb{V}ar\big (\widehat {Y^2}\big )= \mathbb{V}ar\big (\mathbb{E}\big [\widehat {Y^2} \mid \theta \big ]\big ) +\mathbb{E}\big [\mathbb{V}ar\big (\widehat {Y^2} \mid \theta \big )\big ] = \mathbb{V}ar\big (\mu _{Y}^{2}(\theta )\big )+\mathbb{E}\big [\mathbb{V}ar\big (\widehat {Y^2} \mid \theta \big )\big ]=c+\dfrac {h}{n}. \end{equation*}
-
(iii) By properties of covariance,
\begin{eqnarray*} \mathbb{C}ov\big (\widehat {Y},\widehat {Y^{2}}\big ) & = & \mathbb{C}ov \left ( \frac {Y_{1}+Y_{2}+\dots +Y_{n}}{n},\frac {Y_{1}^{2}+Y_{2}^{2}+\dots +Y_{n}^{2}}{n} \right ) \\ & = & \sum _{i=1}^{n}\sum _{j=1,j\neq i}^{n} \mathbb{C}ov \left ( \frac {Y_{i}}{n},\frac {Y_{j}^{2}}{n} \right ) + \sum _{i=1}^{n} \mathbb{C}ov \left ( \frac {Y_{i}}{n},\frac {Y_{i}^{2}}{n} \right ) \\ & = & \sum _{i=1}^{n}\sum _{j=1,j\neq i}^{n} \frac {b}{n^2}+ \sum _{i=1}^{n}\frac {b+g}{n^2} \\ & = & \frac {n(n-1)}{n^2}b+\frac {n}{n^2}(b+g) \\ & = & b+\dfrac {g}{n}. \end{eqnarray*}
-
(iv) Since
$Y$
is assumed to be non-degenerate, it follows from 1 and 2 that
\begin{equation*} \mathbb{V}ar (\widehat Y) = a+\tfrac {v}{n} \gt 0 \quad \mbox{and} \quad \mathbb{V}ar \big( \widehat {Y^2} \big) = c+\tfrac {h}{n} \gt 0. \end{equation*}
Further, by the Cauchy–Schwarz inequality,
with equality if and only if there exist constants
\begin{equation*} \big[ \mathbb{C}ov \big( \widehat Y,\widehat {Y^2}\big) \big]^{2} \le \mathbb{V}ar ( \widehat Y) \mathbb{V}ar \big( \widehat {Y^2} \big), \end{equation*}
$\beta _{0}, \, \beta _{1} \in \mathbb{R}$
such that
$ \widehat {Y^2} = \beta _{0} + \beta _{1} \, \widehat Y$
a.s. (see, e.g., Ash, Reference Ash2000, p. 130). Since
$ \widehat {Y^k} = \displaystyle \frac {1}{n} \sum _{i=1}^n Y_i^{k},$
for
$ k \ge 1$
, the relation
$ \widehat {Y^2} = \beta _{0} + \beta _{1} \, \widehat Y$
a.s. would imply
$ Y^{2} = \beta _{0} + \beta _{1} \, Y$
a.s., contradicting the assumption. Hence the Cauchy–Schwarz inequality is strict, that is,and therefore
\begin{equation*} \big[ \mathbb{C}ov \big( \widehat Y,\widehat {Y^2}\big) \big]^{2} \lt \mathbb{V}ar ( \widehat Y) \mathbb{V}ar \big( \widehat {Y^2} \big), \end{equation*}
establishing the positive definiteness of
\begin{equation*} \det (\Sigma _n) = \mathbb{V}ar (\widehat Y) \mathbb{V}ar \big( \widehat {Y^2} \big) - \big[ \mathbb{C}ov \big( \widehat Y,\widehat {Y^2} \big) \big]^{2} \gt 0, \end{equation*}
$\Sigma _{n}$
.


A.2 Proof of Theorem1
To minimize
 $P_{4}$
, the normal equations are:
$P_{4}$
, the normal equations are:
 \begin{eqnarray} {} & & \dfrac {\partial P_{4}}{\partial \alpha } = 0 \nonumber \\[3pt] \implies & & 2 \mathbb{E}\bigg[\alpha +\sum _{i=1}^{n} \beta _{i} Y_{i} + \sum _{i=1}^{n} \gamma _{i} Y_{i}^2 - X_{n+1}\bigg] = 0 \nonumber \\[3pt] \implies & & \alpha +\sum _{i=1}^{n} \beta _{i} \mathbb{E}[Y_{i}] + \sum _{i=1}^{n} \gamma _{i} \mathbb{E} \left [ Y_{i}^2 \right ] = \mathbb{E}[ X_{n+1}] \end{eqnarray}
 \begin{eqnarray} & & \dfrac {\partial P_{4}}{\partial \beta _{k}} = 0 \nonumber \\[3pt] \implies & & 2 \mathbb{E} \left [Y_{k} \left ( \alpha +\sum _{i=1}^{n} \beta _{i} Y_{i} + \sum _{i=1}^{n} \gamma _{i} Y_{i}^2 - X_{n+1} \right ) \right ] = 0 \nonumber \\[3pt] \implies & & \alpha \mathbb{E}[ Y_{k}] + \sum _{i=1}^{n} \beta _{i} \mathbb{E}[Y_{k}Y_{i}] + \sum _{i=1}^{n} \gamma _{i} \mathbb{E} \left [ Y_{k}Y_{i}^2 \right ] = \mathbb{E}[ Y_{k}X_{n+1}] \end{eqnarray}
 \begin{eqnarray} & & \dfrac {\partial P_{4}}{\partial \gamma _{k}} = 0 \nonumber \\[3pt] \implies & & 2 \mathbb{E}\left [Y_{k}^2\left(\alpha +\sum _{i=1}^{n} \beta _{i} Y_{i} + \sum _{i=1}^{n} \gamma _{i} Y_{i}^2 - X_{n+1}\right)\right ] = 0 \nonumber \\[3pt] \implies & & \alpha \mathbb{E} \left [ Y_{k}^2 \right ] + \sum _{i=1}^{n} \beta _{i} \mathbb{E}\big[Y_{k}^2Y_{i}\big] + \sum _{i=1}^{n} \gamma _{i} \mathbb{E}\big[Y_{k}^2Y_{i}^2\big] = \mathbb{E}\big[ Y_{k}^2 X_{n+1}\big] \end{eqnarray}
Eq. (A2)
 $-$
Eq. (A1)
$-$
Eq. (A1)
 $\times \ \mathbb{E}[Y_{k}]$
gives us
$\times \ \mathbb{E}[Y_{k}]$
gives us
 \begin{align*} & \sum _{i=1}^{n} \beta _{i} \left(\mathbb{E}[Y_{k}Y_{i}]-\mathbb{E}[Y_{k}]\mathbb{E}[Y_{i}] \right)+ \sum _{i=1}^{n} \gamma _{i} \left(\mathbb{E}[Y_{k}Y_{i}^2]-\mathbb{E}[Y_{k}]\mathbb{E}[Y_{i}^2]\right)\\[3pt]& =\mathbb{E}[Y_{k}X_{n+1}]-\mathbb{E}[Y_{k}]\mathbb{E}[X_{n+1}]\\[3pt] \implies & \sum _{i=1}^{n} \beta _{i} \mathbb{C}ov(Y_{k},Y_{i})+ \sum _{i=1}^{n} \gamma _{i} \mathbb{C}ov(Y_{k},Y_{i}^2)=\mathbb{C}ov(Y_{k},X_{n+1}) \end{align*}
Similarly, Eq. (A3)
 $-$
Eq. (A2)
$-$
Eq. (A2)
 $\times \ \mathbb{E} \left [ Y_{k}^2 \right ]$
gives us
$\times \ \mathbb{E} \left [ Y_{k}^2 \right ]$
gives us
 \begin{align*} & \sum _{i=1}^{n} \beta _{i} \left ( \mathbb{E}\big[Y_{k}^2 Y_{i}\big] - \mathbb{E}\big[Y_{k}^2\big]\mathbb{E}[Y_{i}] \right ) + \sum _{i=1}^{n} \gamma _{i} \left ( \mathbb{E}\big[Y_{k}^2 Y_{i}^2\big]-\mathbb{E}\big[Y_{k}^2\big]\mathbb{E}\big[Y_{i}^2\big] \right )\\& = \mathbb{E}\big[ Y_{k}^2 X_{n+1}\big]-\mathbb{E}\big[Y_{k}^2\big]\mathbb{E}[X_{n+1}] \\ \implies & \sum _{i=1}^{n} \beta _{i} \mathbb{C}ov\big(Y_{k}^2,Y_{i}\big) + \sum _{i=1}^{n} \gamma _{i} \mathbb{C}ov\big(Y_{k}^2,Y_{i}^2\big) = \mathbb{C}ov\big(Y_{k}^2,X_{n+1}\big) \end{align*}
It follows that
 $ \forall i=1\,:\,n, \ \beta _{i}=\beta , \ \gamma _{i}=\gamma .$
We consider the following notations,
 \begin{eqnarray*} \mathbb{C}ov(Y_{k},Y_{i}) & = & \begin{cases} a; &i\neq k, \\ a+v; & i=k, \end{cases} \\[5pt] \mathbb{C}ov(Y_{k}^2,Y_{i}) & = & \begin{cases} b; &i\neq k, \\ b+g; &i=k, \end{cases} \\[5pt] \mathbb{C}ov(Y_{k}^2,Y_{i}^2) & = & \begin{cases} c; & i\neq k, \\ c+h; & i=k. \end{cases} \end{eqnarray*}
Further,
 \begin{eqnarray*} \begin{cases} \beta \, (na+v) + \gamma \, (nb+g) = e, \\[3pt] \beta \, (nb+g) + \gamma \, (nc+h) = f, \end{cases} & \implies & \begin{cases} \beta = \dfrac {e(nc+h)-f(nb+g)} {(na+v)(nc+h)-(nb+g)^{2}}, \\[15pt] \gamma = \dfrac {f(na+v)-e(nb+g)}{(na+v)(nc+h)-(nb+g)^{2}}, \end{cases} \end{eqnarray*}
where the common denominator in both
 $\beta$
and
$\beta$
and
 $\gamma$
is guaranteed to be strictly positive by Lemma1, as in Theorem1.
$\gamma$
is guaranteed to be strictly positive by Lemma1, as in Theorem1.
We now consider
 \begin{equation} z_{1}=n\beta \quad \mbox{and} \quad z_{2}=n\gamma . \end{equation}
From Eq. (A1), it follows that
 \begin{equation*} \alpha = \mu _{X}^{1}-z_{1}\,\mu _{Y}^{1}-z_{2}\,\mu _{Y}^{2}. \end{equation*}
Finally, the resulting RQC premium is now given by
 \begin{align*} \widehat {P}_{\mbox{rqc}} & = \alpha + n \, \beta \, \widehat {Y} + n \, \gamma \, \widehat {Y^{2}} \\ & = \mu _{X}^{1} - z_{1}\,\mu _{Y}^{1} - z_{2}\,\mu _{Y}^{2} + z_{1} \, \widehat {Y} + z_{2} \, \widehat {Y^{2}} \\ & = \mu _{X}^{1} + z_{1} \left ( \widehat {Y}-\mu _{Y}^{1} \right ) + z_{2} \big( \widehat {Y^2}-\mu _{Y}^{2} \big), \end{align*}
as desired.
A.3 Proof of Proposition1
By definition of MSE, we get
 \begin{align*} MSE_{\mbox{rqc}} & \equiv MSE \left ( \widehat {P}_{\mbox{rqc}}, X_{n+1} \right ) = \mathbb{E} \big[ \big( \widehat {P}_{\mbox{rqc}}-X_{n+1} \big)^2 \big] = \mathbb{V}ar\left (\widehat {P}_{\mbox{rqc}}-X_{n+1}\right ) \\[3pt] & = \mathbb{V}ar \left ( \widehat {P}_{\mbox{rqc}} \right ) + \mathbb{V}ar(X_{n+1}) - 2\mathbb{C}ov\left (\widehat {P}_{\mbox{rqc}}, X_{n+1}\right ) \\[3pt] & = z_{1}^{2} \mathbb{V}ar \left ( \widehat {Y} \right ) + z_{2}^{2} \mathbb{V}ar \big( \widehat {Y^2} \big) + 2z_{1}z_{2} \mathbb{C}ov \big( \widehat {Y},\widehat {Y^2} \big) + \mathbb{V}ar \left ( X_{n+1} \right ) \\[3pt] & \quad -2z_{1}\mathbb{C}ov\left (\widehat {Y},X_{n+1}\right )-2z_{2} \mathbb{C}ov\big(\widehat {Y^2},X_{n+1}\big) \\[3pt] & \overset {\text{By Lemma 1}}{\to } z_{1}^{2}(a+v/n)+z_{2}^{2}(c+h/n)+2z_{1}z_{2}(b+g/n)+(d+u)-2z_{1}e-2z_{2}f \\[3pt] & = z_{1}\big [z_{1}(a+v/n)+z_{2}(b+g/n)\big ]+z_{2}\big [z_{2}(c+h/n)+z_{1}(b+g/n)\big ]\\[3pt] & \quad +(d+u)-2z_{1}e-2z_{2}f \\[3pt] & = z_{1}e+z_{2}f+d+u-2z_{1}e-2z_{2}f \\[3pt] & = d+u-z_{1}e-z_{2}f. \end{align*}
Similarly,

as desired
A.4 Proof of Proposition2
Define the “premium spaces” for classical credibility, semi-linear credibility,
 $q$
-credibility, and RQC models as
$q$
-credibility, and RQC models as
 \begin{align*} &\Delta _{\mbox{cc}} \,:\!=\, \left \{ \alpha +\sum _{i=1}^{n} \beta _{i} X_{i} \mid \alpha , \beta _{1},\ldots , \beta _{n}\, \in \,\mathbb{R} \right \}, \\ &\Delta _{\mbox{slc}} \,:\!=\, \left \{ \alpha +\sum _{i=1}^{n} \beta _{i} Y_{i} \mid \alpha , \beta _{i}\, \in \,\mathbb{R}, i=1,2,\ldots ,n \right \}, \\ &\Delta _{\mbox{qc}} \,:\!=\, \left \{ \alpha +\sum _{i=1}^{n} \beta _{i} X_{i} + \sum _{i=1}^{n} \gamma _{i} X_{i}^2 \mid \alpha , \beta _{i}, \gamma _{i}\, \in \,\mathbb{R}, i=1,2,\ldots ,n \right \}, \\ &\Delta _{\mbox{rqc}} \,:\!=\,\ \left \{ \alpha +\sum _{i=1}^{n} \beta _{i} Y_{i} + \sum _{i=1}^{n} \gamma _{i} Y_{i}^2 \mid \alpha , \beta _{i}, \gamma _{i}\, \in \,\mathbb{R}, i=1,2,\ldots ,n \right \}. \end{align*}
Since the space of the combinations of the
 $\{X_{i} \}_{i=1:n}$
is a subspace of the combinations of the
$\{X_{i} \}_{i=1:n}$
is a subspace of the combinations of the
 $\{X_{i} \}_{i=1:n}$
and of the
$\{X_{i} \}_{i=1:n}$
and of the
 $\{X_{i}^{2} \}_{i=1:n}$
, then premium space
$\{X_{i}^{2} \}_{i=1:n}$
, then premium space
 $\Delta _{\mbox{cc}}$
belongs to
$\Delta _{\mbox{cc}}$
belongs to
 $\Delta _{\mbox{qc}}$
. Similarly, since
$\Delta _{\mbox{qc}}$
. Similarly, since
 $X_{i}$
can be treated as a special case of
$X_{i}$
can be treated as a special case of
 $Y_{i}$
, we can derive
$Y_{i}$
, we can derive
 $ \Delta _{\mbox{cc}} \subseteq \Delta _{\mbox{slc}} \subseteq \Delta _{\mbox{rqc}}$
and
$ \Delta _{\mbox{cc}} \subseteq \Delta _{\mbox{slc}} \subseteq \Delta _{\mbox{rqc}}$
and
 $ \Delta _{\mbox{cc}} \subseteq \Delta _{\mbox{qc}} \subseteq \Delta _{\mbox{rqc}}$
. By the Pythagorean theorem, we have
$ \Delta _{\mbox{cc}} \subseteq \Delta _{\mbox{qc}} \subseteq \Delta _{\mbox{rqc}}$
. By the Pythagorean theorem, we have
 $ MSE_{\mbox{rqc}} \leq MSE_{\mbox{slc}} \leq MSE_{\mbox{cc}}$
and
$ MSE_{\mbox{rqc}} \leq MSE_{\mbox{slc}} \leq MSE_{\mbox{cc}}$
and
 $ MSE_{\mbox{rqc}} \leq MSE_{\mbox{qc}} \leq MSE_{\mbox{cc}},$
establishing (17). The inequalities in (18) can be established similarly.
$ MSE_{\mbox{rqc}} \leq MSE_{\mbox{qc}} \leq MSE_{\mbox{cc}},$
establishing (17). The inequalities in (18) can be established similarly.
A.5 Proof of Lemma2
The outline of the proofs are summarized below.
-
(i) By Eq. (20),
$\mathbb{E}\left [ \widehat {Y} \right ] \to \mu _{Y}^{1}(\theta )$
, then
$\mathbb{E}[\mathbb{E}[\widehat {Y}]] \to \mathbb{E}[\mu _{Y}^{1}(\theta )]=\mu _{Y}^{1}$
as
$n\to \infty$
. -
(ii) By Eq. (24),
$n\mathbb{E}[\mathbb{V}ar(\widehat {Y})] = \mathbb{E}[n\mathbb{V}ar(\widehat {Y} \mid \theta )]\to \mathbb{E}[v(\theta )]=v$
. -
(iii) Again, by Eq. (20),
$\mathbb{V}ar(\mathbb{E}\left [\widehat {Y}\right ])\to \mathbb{V}ar(\mu _{Y}^{1}(\theta ))=a$
. -
(iv) The covariance can be written as
Since
\begin{equation*} \mathbb{C}ov \left ( \widehat {Y},\mu _{Y}^{1}(\theta ) \right ) = \mathbb{E} \left [ \widehat {Y}\, \mu _{Y}^{1}(\theta ) \right ] - \mathbb{E} \left [ \widehat {Y} \right ] \mathbb{E} \left [ \mu _{Y}^{1}(\theta ) \right ]. \end{equation*}
$ \left | \widehat {Y}\,\mu _{Y}^{1}(\theta ) \right | \leq \left | \widehat {Y} \right | \, \left | \mu _{Y}^{1}(\theta ) \right |$
, and both
$\left |\widehat {Y}\right |$
and
$\left |\mu _{Y}^{1}(\theta )\right |$
are square integrable, then by dominated convergence theorem (see, e.g., Folland, Reference Folland1999, p. 54),
\begin{equation*} \mathbb{C}ov \left ( \widehat {Y},\mu _{Y}^{1}(\theta ) \right ) \rightarrow \mathbb{E}\big [\big (\mu _{Y}^{1}(\theta )\big )^{2} \big ]-\big (\mathbb{E}\big [\mu _{Y}^{1}(\theta )\big ]\big )^{2} = a. \end{equation*}
-
(v) Since
$|\widehat {Y^2}|$
is also square integrable, we can have a similar proof as (iv), that is
\begin{equation*}\mathbb{C}ov\big (\widehat {Y^{2}},\mu _{Y}^{1}(\theta ) \big ) \rightarrow \mathbb{E}\big [\mu _{Y}^{2}(\theta )\, \mu _{Y}^{1}(\theta ) \big ]-\mathbb{E}\big [\mu _{Y}^{2}(\theta )\big ]\,\mathbb{E}\big [\mu _{Y}^{1}(\theta )\big ] = b.\end{equation*}
-
(vi) Since
$\mathbb{E}\big [\widehat {Y^{2}}\big ] \to \mu _{Y}^{2}(\theta )$
, then
$\mathbb{V}ar(\mathbb{E}[\widehat {Y^{2}}]) \to \mathbb{V}ar(\mu _{Y}^{2}(\theta ))=c$
. -
(vii)
$\mathbb{C}ov\big (\mu _{X}^{1}(\theta ) , \widehat {Y}\big ) \to \mathbb{E}\big [\mu _{X}^{1}(\theta ) \, \mu _{Y}^{1}(\theta ) \big ]-\mathbb{E}\big [\mu _{X}^{1}(\theta )\big ]\,\mathbb{E}\big [\mu _{Y}^{1}(\theta )\big ] = e$
. -
(viii)
$ \mathbb{C}ov\big (\mu _{X}^{1}(\theta ) , \widehat {Y^{2}}\big ) = \mathbb{E}\big [\mu _{X}^{1}(\theta ) \, \mu _{Y}^{2}(\theta ) \big ]-\mathbb{E}\big [\mu _{X}^{1}(\theta )\big ]\,\mathbb{E}\big [\mu _{Y}^{2}(\theta )\big ] = f$
.


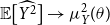
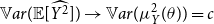


Appendix B. Parametric Models Illustration
B.1 Exponential-Inverse Gamma Model Structure Parameters
 \begin{align*} \mu _{Y}^{1}& = \mathbb{E}\big [\mu _{Y}^{1}(\theta )\big ]=\mathbb{E}\big [\theta \,m_{1}(p,q)\big ]=\mathbb{E}[\theta]m_{1}(p,q)= \frac {\beta }{\alpha -1}m_{1}(p,q), \\[3pt] \mu _{X}^{1} & = \mu _{Y}^{1} \,\mbox{with}\, p=q=0, \\[3pt] \mu _{Y}^{2}& = \mathbb{E} \left [ \mu _{Y}^{2}(\theta ) \right ] = \mathbb{E}\big [\theta ^2\,m_{2}(p,q)\big ]=\mathbb{E}[\theta ^2]m_{2}(p,q)= \frac {\beta ^2}{(\alpha -1)(\alpha -2)}m_{2}(p,q), \\[3pt] a & = \mathbb{V}ar(\mu _{Y}^{1}(\theta ))=\mathbb{V}ar\big (\theta \,m_{1}(p,q)\big )=\mathbb{V}ar\big (\theta \big )\big [m_{1}(p,q)\big ]^{2}= \frac {\beta ^{2}}{(\alpha -1)^{2}(\alpha -2)}\big [m_{1}(p,q)\big ]^{2}, \\[3pt] b & = \mathbb{E} \left [ \mu _{2}(\theta )\,\mu _{1}(\theta ) \right ] - \mathbb{E} \left [ \mu _{2}(\theta ) \right ] \, \mathbb{E}\left [\mu _{1}(\theta )\right ] = \mathbb{E} \left [ \theta ^{2}\,m_{2}\cdot \theta \,m_{1} \right ] - \mathbb{E} \left [ \theta ^{2}\,m_{2} \right ] \, \mathbb{E} \left [ \theta \,m_{1} \right ] \\[3pt] & = m_{1}m_{2} \left ( \mathbb{E} \left [ \theta ^{3} \right ] - \mathbb{E} \left [ \theta ^{2} \right ] \mathbb{E} \left [ \theta \right ] \right ) = \frac {2\beta ^{3}}{(\alpha -1)^{2}(\alpha -2)(\alpha -3)}m_{1}m_{2}, \\[3pt] c & = \mathbb{V}ar(\mu _{Y}^{2}(\theta )) = \mathbb{V}ar\big (\theta ^2\,m_{2}(p,q)\big )=\mathbb{V}ar\big (\theta ^2\big )\big [m_{2}(p,q)\big ]^{2} \\[3pt] & = \frac {(4\alpha -10)\beta ^{4}}{(\alpha -1)^{2}(\alpha -2)^{2}(\alpha -3)(\alpha -4)}\big [m_{2}(p,q)\big ]^{2}, \end{align*}
 \begin{align*} d & = a \,\mbox{with}\, p=q=0, \\[3pt] e & = \mathbb{E} \left [ \mu _{X}(\theta )\,\mu _{1}(\theta ) \right ] - \mathbb{E}[\mu _{X}(\theta )]\, \mathbb{E}[\mu _{1}(\theta )] = \mathbb{E} \left [ \theta \,m_{X}\cdot \theta \,m_{1} \right ] - \mathbb{E} \left [ \theta \,m_{X} \right ] \, \mathbb{E} \left [ \theta \,m_{1} \right ] \\[3pt] & = m_{1}m_{X} \left ( \mathbb{E} \left [ \theta ^{2} \right ] - \mathbb{E} \left [ \theta \, \right ] \mathbb{E} \left [ \theta \, \right ] \right ) = \frac {\beta ^{2}}{(\alpha -1)^{2}(\alpha -2)} m_{1}m_{X}, \\[3pt] f & = \mathbb{E}[\mu _{2}(\theta )\,\mu _{X}(\theta )]-\mathbb{E}[\mu _{2}(\theta )]\, \mathbb{E}\left [\mu _{X}(\theta )\right ] = \mathbb{E} \left [ \theta ^{2}\,m_{2}\cdot \theta \,m_{X} \right ] - \mathbb{E} \left [ \theta ^{2}\,m_{2} \right ] \, \mathbb{E} \left [ \theta \,m_{X} \right ] \\[3pt] & = m_{X}m_{2} \left ( \mathbb{E} \left [ \theta ^{3} \right ] - \mathbb{E} \left [ \theta ^{2} \right ] \mathbb{E} \left [ \theta \, \right ] \right ) = \frac {2\beta ^{3}}{(\alpha -1)^{2}(\alpha -2)(\alpha -3)}m_{X}m_{2}, \\[3pt] g & = \mathbb{E}[\mathbb{C}ov(Y^2,Y \mid \theta ]=\mathbb{E}\big [\theta ^3\,v_{3}(p,q)\big ]= \frac {\beta ^3}{(\alpha -1)(\alpha -2)(\alpha -3)}v_{3}(p,q), \\[3pt] h & = \mathbb{E}[\mathbb{V}ar(Y^2 \mid \theta )]=\mathbb{E}\big [\theta ^{4}v_{2}(p,q)\big ]= \frac {\beta ^4}{(\alpha -1)(\alpha -2)(\alpha -3)(\alpha -4)}v_{2}(p,q), \\[3pt] k & = \mathbb{E}[\mathbb{C}ov(Y,X \mid \theta ]=\mathbb{E}\big [\theta ^2\,v_{4}(p,q)\big ]= \frac {\beta ^2}{(\alpha -1)(\alpha -2)}v_{4}(p,q), \\[3pt] l & = \mathbb{E}[\mathbb{C}ov(Y^2,X \mid \theta ]=\mathbb{E}\big [\theta ^3\,v_{5}(p,q)\big ] = \frac {\beta ^3}{(\alpha -1)(\alpha -2)(\alpha -3)}v_{5}(p,q), \\[3pt] v & = \mathbb{E}[\mathbb{V}ar(Y \mid \theta )]=\mathbb{E}\big [\theta ^2\,v_{1}(p,q)\big ]= \frac {\beta ^2}{(\alpha -1)(\alpha -2)}v_{1}(p,q), \\[3pt] u & = v \mbox{ with } p=q=0. \end{align*}
B.2 Lognormal Moments
Let
 $x=e^{\theta +x\sigma }$
and
$x=e^{\theta +x\sigma }$
and
 $a, b\, \in \,[0,1]$
, then the integrals of the Lognormal moment with limited boundaries from 0 to
$a, b\, \in \,[0,1]$
, then the integrals of the Lognormal moment with limited boundaries from 0 to
 $100a\%$
quantile are
$100a\%$
quantile are
 \begin{eqnarray*} \int _{0}^{a}\left [F^{-1}(w)\right ]^k dw & = & \int _{0}^{\pi _{a}}x^k f(x)dx = \int _{-\infty }^{\frac {\ln \pi _{a}-\theta }{\sigma }}(e^{\theta +z\sigma })^{(k-1)}\,\frac {\phi (z)}{\sigma }d(e^{\theta +z\sigma }) \\[4pt] & = & e^{k\theta }\int _{-\infty }^{\frac {\ln \pi _{a}-\theta }{\sigma }}e^{kz\sigma }\frac {1}{\sqrt {2\pi }}e^{-z^2/2}dz = e^{k\theta +\frac {1}{2}k^2\sigma ^{2}}\int _{-\infty }^{\frac {\ln \pi _{a}-\theta }{\sigma }}\frac {1}{\sqrt {2\pi }}e^{-(z-k\sigma )^{2}/2}dz \\[4pt] & = & \int _{-\infty }^{\frac {\ln \pi _{a}-\theta }{\sigma }-k\sigma }\frac {1}{\sqrt {2\pi }}e^{-t^2/2}dt = e^{k\theta +\frac {1}{2}k^2\sigma ^{2}}\,\Phi \left (\Phi ^{-1}(a)-k\sigma \right ). \end{eqnarray*}
Further, it follows that
 \begin{equation*} \int _{a}^{b}\left [F^{-1}(w)\right ]^k dw = e^{k\theta +\frac {1}{2}k^2\sigma ^{2}}\,\left [\Phi \left (\Phi ^{-1}(b)-k\sigma \right )-\Phi \left (\Phi ^{-1}(a)-k\sigma \right )\right ]. \end{equation*}
B.3 Lognormal-Normal Model Structure Parameters
 \begin{align*} \mu _{Y}^{1} & = \mathbb{E}[\mu _{Y}^{1}(\theta )]=\mathbb{E}\big [e^{\theta }m_{1}(p,q)\big ]=e^{\mu +\frac {1}{2}v^2}m_{1}(p,q), \\[4pt] \mu _{X}^{1} & = \mu _{Y}^{1} \,\mbox{with}\, p=q=0, \end{align*}
 \begin{align*} \mu _{Y}^{2} & = \mathbb{E}[\mu _{Y}^{2}(\theta )]=\mathbb{E}\big [e^{2\theta }m_{2}(p,q)\big ]=\mathbb{E}\big [e^{2\theta }\big ]m_{2}(p,q)= e^{2\mu +2v^{2}}m_{2}(p,q), \\[4pt] a & = \mathbb{V}ar\big (\mu _{Y}^{1}(\theta )\big )=\mathbb{V}ar\big (e^{\theta }m_{1}(p,q)\big )=\mathbb{V}ar\big (e^{\theta }\big )\big [m_{1}(p,q)\big ]^{2}= \big (e^{2\mu +2v^2}-e^{2\mu +v^2}\big )\big [m_{1}(p,q)\big ]^{2}, \\[4pt] b & = \mathbb{E}[\mu _{2}(\theta )\,\mu _{1}(\theta )]-\mathbb{E}[\mu _{2}(\theta )]\, \mathbb{E}\left [\mu _{1}(\theta )\right ]=\mathbb{E}[e^{2\theta }m_{2}\, e^{\theta }m_{1}]-\mathbb{E}[e^{2\theta }m_{2}] \, \mathbb{E}[e^{\theta }m_{1}] \\ & = m_{1}m_{2}(\mathbb{E}[e^{3\theta }]-\mathbb{E}[e^{2\theta }]\mathbb{E}[e^{\theta }])\\ & = \big (e^{3\mu +9/2v^2}-e^{3\mu +5/2v^2}\big )m_{1}m_{2}, \\[4pt] c & = \mathbb{V}ar\big (\mu _{Y}^{2}(\theta )\big )=\mathbb{V}ar\big (e^{2\theta }m_{2}(p,q)\big )=\mathbb{V}ar\big (e^{2\theta }\big )\big [m_{2}(p,q)\big ]^{2}= \big (e^{4\mu +8v^2}-e^{4\mu +4v^2}\big )\big [m_{2}(p,q)\big ]^{2}, \\[4pt] d & = a \,\mbox{with}\, p=q=0, \\[4pt] e & = \mathbb{E}[\mu _{X}(\theta )\,\mu _{1}(\theta )]-\mathbb{E}[\mu _{X}(\theta )]\, \mathbb{E}[\mu _{1}(\theta )]=\mathbb{E}[e^{\theta }m_{X}\, e^{\theta }m_{1}]-\mathbb{E}[e^{\theta }m_{X}]\, \mathbb{E}[e^{\theta }m_{1}] \\ & = m_{1}m_{X}(\mathbb{E}[e^{2\theta }]-\mathbb{E}[e^{\theta }]\mathbb{E}[e^{\theta }])\\ & = \big (e^{2\mu +2v^2}-e^{2\mu +v^2}\big ) m_{1}m_{X}, \\[4pt] f & = \mathbb{E}[\mu _{2}(\theta )\,\mu _{X}(\theta )]-\mathbb{E}[\mu _{2}(\theta )]\, \mathbb{E}\left [\mu _{X}(\theta )\right ]=\mathbb{E}[e^{2\theta }m_{2}\, e^{\theta }m_{X}]-\mathbb{E}[e^{2\theta }m_{2}]\, \mathbb{E}[e^{\theta }m_{X}] \\ & = m_{X}m_{2}(\mathbb{E}[e^{3\theta }]-\mathbb{E}[e^{2\theta }]\mathbb{E}[e^{\theta }])\\ & = \big (e^{3\mu +9/2v^2}-e^{3\mu +5/2v^2}\big )m_{X}m_{2}, \\[4pt] g & = \mathbb{E}[\mathbb{C}ov(Y^2,Y \mid \theta ]=\mathbb{E}\big [e^{3\theta }v_{3}(p,q)\big ]= e^{3\mu +9/2v^2}v_{3}(p,q), \\[4pt] h & = \mathbb{E}[\mathbb{V}ar(Y^2 \mid \theta )]=\mathbb{E}\big [e^{4\theta }v_{2}(p,q)\big ]= e^{4\mu +8v^2}v_{2}(p,q), \\[4pt] k & = \mathbb{E}[\mathbb{C}ov(Y,X \mid \theta ]=\mathbb{E}\big [e^{2\theta }v_{4}(p,q)\big ]= e^{2\mu +2v^2}v_{4}(p,q), \\[4pt] l & = \mathbb{E}[\mathbb{C}ov(Y^2,X \mid \theta ]=\mathbb{E}\big [e^{3\theta }v_{5}(p,q)\big ]= e^{3\mu +9/2v^2}v_{5}(p,q), \\[4pt] v & = \mathbb{E}[\mathbb{V}ar(Y \mid \theta )]=\mathbb{E}\big [e^{2\theta }v_{1}(p,q)\big ]= e^{2\mu +2v^2}v_{1}(p,q), \\[4pt] u & = v \,\mbox{with}\, p=q=0. \end{align*}


 θ
θ 5,2
5,2 p=0
p=0 q
q θ
θ θ
θ θ
θ
 θ
θ 5,2
5,2 z1
z1 q′s
q′s p=0
p=0 z2
z2 q′s
q′s p=0
p=0
 (θ,0.42)
 (1.5,12)
 p=0
p=0 q
q θ
θ θ
θ θ
θ
 (θ,0.42)
 (1.5,12)
 z1
z1 q′s
q′s p=0
p=0 z2
z2 q′s
q′s p=0
p=0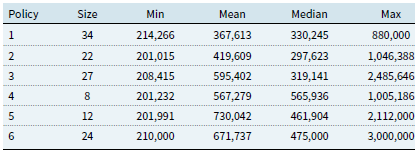
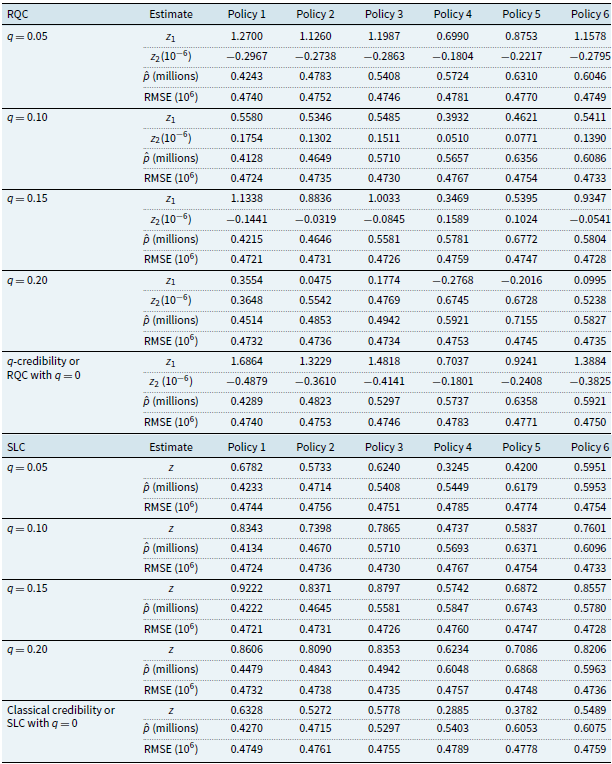
 z1
z1 z2
z2 p^
p^ q
q q
q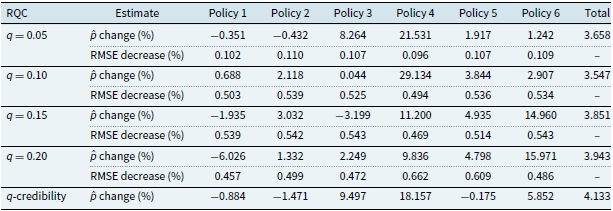
 p^
p^ q
q
 Open access