


Introduction
Svalbard, the northernmost archipelago of Norway, has a glacier system that is affected by both the cold Arctic climate and the warm Atlantic current. The study of ice cores from ice caps or glaciers in Svalbard helps to clarify recent environmental change under an oceanic climate in the Arctic (e.g. Reference Hagen and LiestølHagen and Liestøl, 1990; Reference KoernerKoerner, 1997; Reference IsakssonIsaksson and others, 2001; Reference MotoyamaMotoyama and others, 2001b; Reference WatanabeWatanabe and others, 2001).
Most ice-core studies in Svalbard have been located in the percolation or saturation zone, each location of which can have different melting and/or refreezing conditions. This means that each ice cap or glacier in Svalbard can contribute in different ways to the reconstruction of past and recent climatic environment. For instance, Reference PohjolaPohjola and others (2002) reported that stable-isotope ratios in the Lomonosovfonna ice core have well-preserved annual or at least biannual atmospheric signals. Chemical compounds in the Snøfjellafonna snowpack in northwestern Svalbard have been less flushed out by summer melting than those in the Brøggerfonna snowpack in northwestern Svalbard (Reference Goto-AzumaGoto-Azuma and others, 1995). Reference MotoyamaMotoyama and others (2001a) reported that a snow layer with a high concentration of ions on the Vestfonna snow-pack in northeastern Svalbard was formed by redistribution of ions during depth-hoar formation or by warm snowfall. Reconstruction of recent climates from ice-core studies in the Svalbard region requires a clear understanding of processes during melting and refreezing in each glacier. Furthermore, a common indicator of melting and/or refreezing processes in the snowpack is needed.
Austfonna ice cap in Svalbard has extensive areas where percolation has affected the snowpack (e.g. Reference KoernerKoerner, 1997; Reference WatanabeWatanabe and others, 2001), and has been studied for a long time (e.g. Reference SchyttSchytt, 1964). The accumulation rate (in water equivalent) at the dome of Austfonna is estimated to be 0.5–0.6 m a−1 by Sin’kevich and Tarrusov (1989) and 0.5–0.8 m a−1 by Reference PinglotPinglot and others (1999). Tarrusov (1992) estimated that the effective percolation depth is 2–5 m. Reference KoernerKoerner (1997) estimated the melt index of Austfonna at 67%, and pointed out that climatic interpretation of the ice-core record in Austfonna is difficult due to meltwater percolation. Reconstructing recent climates from Austfonna ice-cap data is therefore problematic. We found that the ratio of Mg2+/Na+ in snow and ice samples indicates if melting has occurred at Austfonna. This indicator should help elucidate the recent climatic environment in Austfonna and might also apply to other glaciers where surface melting is prevalent.
Study Site and Analytical Procedures
Snowpack samples were collected from the walls of four pits within a 500 m diameter region in the dome of Austfonna during spring 1998 (Reference Watanabe, Kamiyama, Kameda, Takahashi and IsakssonWatanabe and others, 2000). These pits, hereafter labeled I, II, III and IV, were surveyed before the melting season started (26 March, 19 March, 25 March and 10 April, respectively). The pit depths were 1.21, 1.89, 1.03 and 1.80 m, respectively. Pit walls were continuously sampled, in 30–40 mm increments. No samples crossed the boundaries between the different snow layers, which were classified by the snow stratigraphy. Samples from soft parts of the pit wall were transferred into clean plastic bottles by a clean pipe made of acrylic resin. If the wall was too hard to allow insertion of the pipe (e.g. in the presence of ice layers), the pit-wall samples were cut by a handsaw and placed into clean plastic bottles after the surface of the sample was shaved off with a clean ceramics knife. These bottles and tools were cleaned before sampling by supersonic waves using pure water.
An ice core was obtained in spring 1999 about 3 km north of the 1998 sampling region. Details of the ice-core sampling have been reported by Reference MotoyamaMotoyama and others (2001a). For chemical analyses, the entire ice core was divided into a continuous sequence of samples, each 20 cm long.
Laboratory analyses of the pit-wall and ice-core samples included seven major soluble ions (Na+, K+, Mg2+, Ca2+, Cl−, SO4 2− and NO3 −), the stable oxygen isotope (δ 18O), the pH and liquid electrical conductivity (LEC). The major soluble ions, pH and LEC were analyzed after the samples were filtered (pore size 0.45 μm).Water-soluble ions were measured by ion chromatography with estimated errors <5% for each ion. LEC and pH were measured using flow-cell-type sensors by the method described in Reference WatanabeWatanabe and others (1997). Errors were estimated to be within ±0.01 for pH; LEC errors were ±0.1 μS cm−1 for LEC ≥ 10 μS cm−1, and ±0.01 μS cm−1 for LEC <10 μS cm−1. The δ 18O was analyzed with a mass spectrometer (MAT δE). Estimated errors were within ±0.1‰ for δ 18O.
Results
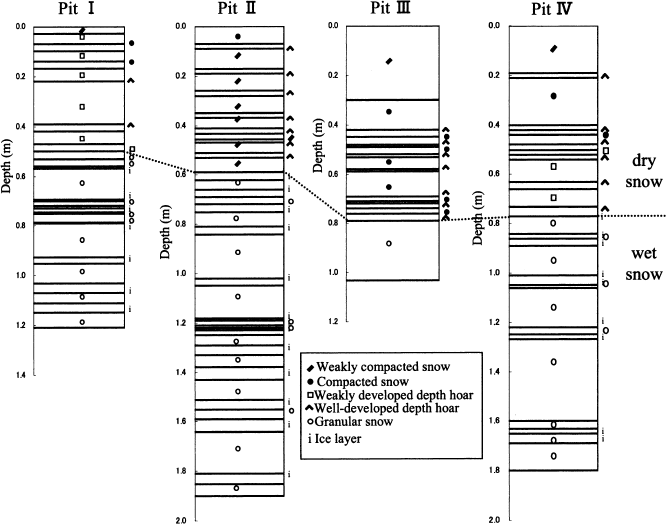
Figure 1 shows the stratigraphy at the four pit sites. At all four sites, the upper parts of the pit walls consisted of compacted snow or depth-hoar layers; hence, these parts are referred to as dry snow. Conversely, the parts below the dry snow consisted of granular snow or ice layers and thus had a history of melting; hence, these lower parts are referred to as wet snow. The depth of the boundary between the dry and wet snow was 0.50, 0.59, 0.79 and 0.77 m for pits I, II, III and IV, respectively.
Vertical stratigraphies on the pit walls at the four sites. The dotted lines show the boundary depths between dry and wet snow.
Typical examples of the vertical distributions of δ 18O, LEC and pH at pit I are shown in Figure 2. Dry and wet snow have different features in their δ 18O, LEC and pH distributions. The dry snow has a wider range of δ 18O values (−23.3‰ to −11.4‰) than the wet snow (−18.0‰ to −14.8‰); higher LEC concentrations, and with more variability (2.50–12.9 μS), than the wet snow (1.61–5.43 μS); and lower pH values (5.2–5.3) than the wet snow (5.5–5.6).
Vertical distributions of δ 18O, LEC and pH on the pit walls at pit I. The dotted line shows the boundary depth between dry and wet snow.
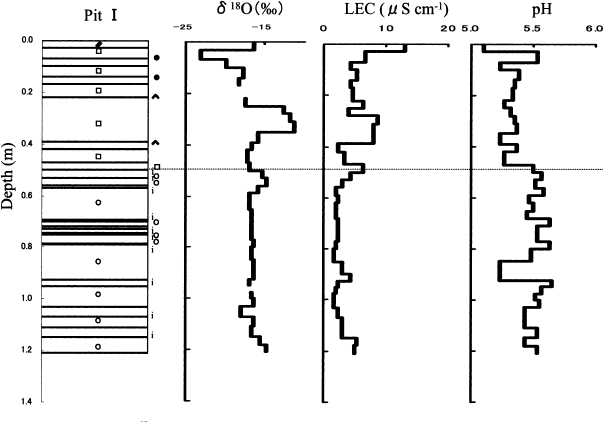
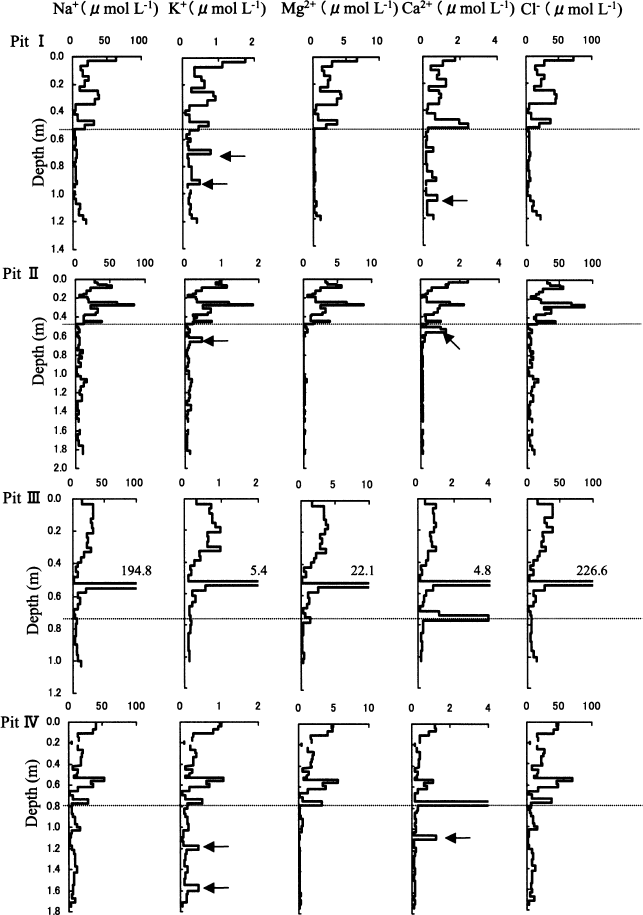
Figure 3 shows the vertical distributions of Na+, K+, Mg2+, Ca2+ and Cl− in the pit-wall samples at the four sites. In the wet snow, concentrations of the five species are lower than in the dry snow and have smoother vertical profiles. K+ and Ca2+ have some sharp concentration peaks in the wet snow that do not correlate with concentrations of other ions. Na+ and Cl− ions account for 84.3% and 87.7% of all of the major soluble ions in the dry and wet snow, respectively (Table 1). Because the W/D (average wet/average dry) concentration ratios are 0.27 for Na+ and 0.25 for Cl− (Table 1), the concentration of the major soluble ions in the wet snow is typically only about one-quarter of that in the dry snow. However, the ratios vary significantly for each ion species (0.07–0.64 of W/D inTable 1).
Vertical distributions of Na+, K+, Mg2+, Ca2+ and Cl− on the pit walls at the four sites. The dotted lines show the boundary depths between dry and wet snow. Arrows indicate sharp peaks in the wet snow that do not correlate with the other ions.
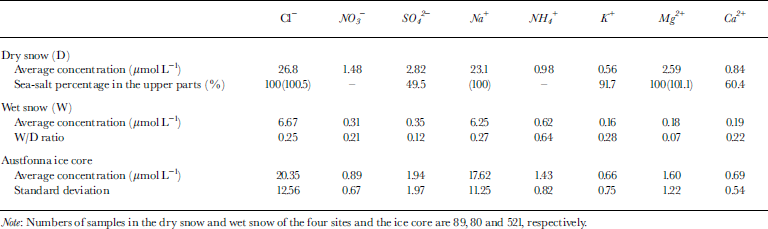
For the Austfonna ice core, the results of the chemical analysis and the stratigraphy were discussed by Reference WatanabeWatanabe and others (2001). Average values of the chemical compounds in the ice core are between those in the dry and wet snow (Table 1).
Discussion
Redistribution of chemical components by melting of the pit-wall samples
Since the samples on the pit wall were collected in March and April 1998, the boundary between the dry and wet snow probably corresponds to the end-of-summer surface of 1997. Also, since acidity and the concentrations of LEC and major soluble ions are lower in the wet snow than in the dry snow (Fig. 2; Table 1), chemical components have probably been flushed out from the wet snowpack during the thaw.
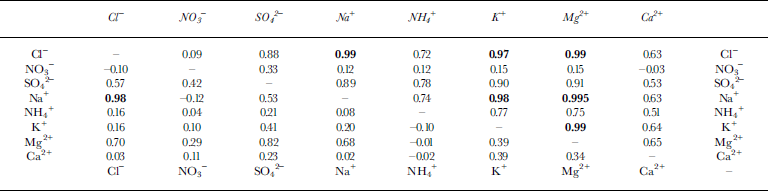
Table 2 shows the correlation coefficients of ion pairs in the dry and wet snow. In the dry snow, the correlation coefficients of Na+ with Cl−, Mg2+ and K+ are >0.95; hence, Na+, Cl−, Mg2+ and K+ probably originated from sea salt and indicate the oceanic climate. The wet snow also exhibits a high correlation between Na+ and Cl− (0.98). This result suggests that the flushing-out rate of ions from the snowpack during the thaw is similar for Na+ and Cl− . But Mg2+, having a W/D ratio of 0.07 (Table 1), is apparently flushed out faster than the other ions (W/D ratios of 0.12–0.64).
The ratio of Mg2+/Na+ as an indicator of melting
We want to find a way to distinguish whether or not the snowpack has experienced melting. Figure 4 shows the vertical distributions of the ratios of Mg2+/Na+, Ca2+/Na+, Cl−/Na+, and K+/Mg2+ of the pit-wall samples at the four sites. We show these ratios in order to focus attention on (1) the sources of the ion species and (2) the flushing-out rates of the ions from the snowpack during thawing. Table 3 shows the average values and standard deviations of the ratios of Mg2+/Na+, Ca2+/Na+, Cl−/Na+, and K+/Mg2+ in the dry and wet snow.
Vertical distributions of Mg2+/Na+, Ca2+/Na+, Cl−/Na+, and K+/Mg2+ ratios on the pit walls at the four sites. The dotted lines show the boundary depths between dry and wet snow.


The ratio of Ca2+/Na+ in the dry snow is an example of two ions coming from different sources. The standard deviation (0.08) is higher than the average value (0.05). Ratios of ions from different sources (e.g. Ca2+/Na+, NH4 +/Na+, SO4 2−/Na+) are likely to have higher standard deviations in the dry snow and thus are unsuitable as melt indicators. Na+, Cl−, Mg2+ and K+ are suitable because almost all of the Na+, Cl−, Mg2+ and K+ have a marine origin (Table 1).
The ratios of Cl−/Na+ are unlikely to change between dry and wet snow since they have the same flushing-out rate. For example, here the average ratio of Cl−/Na+ in the dry snow is 1.18 (±0.11), which is similar to that in the wet snow (1.07 ± 0.15). Hence, ratios of two ions having the same flushing-out rate are unsuitable as melt indicators. The ratios of Mg2+ to the other three sea-salt ions (Na+, Cl− and K+) are useful melt indicators since Mg2+ (W/D = 0.07) appears to be flushed out faster than Na+, Cl− and K+ (W/D = 0.27, 0.25 and 0.28, respectively) (Table 1). Other authors (e.g. Reference Davies, Vincent and BrimblecombeDavies and others, 1982, Reference Davies, Jones and Orville-Thomas1987; Reference Brimblecombe, Tranter, Abrahams, Blackwood, Davies and VincentBrimblecombe and others, 1985) have also suggested that Mg2+ is flushed out faster than Na+ and Cl−.
The average ratios of K+/Mg2+ in the dry and wet snow are 0.23 ± 0.06 and 1.33 ± 1.25, respectively. K+ has some sharp peaks uncorrelated with other ions in the wet snow (Fig. 3). Furthermore, the distribution of K+/Mg2+ ratios in the dry snow often equals that in the wet-snow histograms in Figure 5. Thus, K+/Mg2+ is unsuitable as a melt indicator.
Histograms of the K+/Mg2+ (upper) and Mg2+/Na+ (lower) ratios. Gray and black bars indicate dry and wet snow, respectively.

The average ratio of Mg2+/Na+ in the dry snow is 0.11 ± 0.02, which is similar to the ratio in sea salt (0.12). However, the vertical distributions and histograms in Figures 4 and 5 show that the average Mg2+/Na+ ratio of 0.03 ± 0.02 in the wet snow is distinguishable from that in the dry snow and in sea salt. The minimum ratio of Mg2+/Na+ in the dry snow exceeds the maximum value in the wet snow.These results show that the ratio of Mg2+/Na+ reliably indicates whether or not the snowpack of the pit walls has experienced melting.
Given the strong correlation between Na+ and Cl−, the ratio of Mg2+/Cl− should also be a reliable melt indicator. However, Mg2+/Na+ has the additional advantage that both ions are cations and thus can be measured using one sample in a single run by ion chromatography.
Therefore, we propose the following four reasons for using the ratio of Mg2+/Na+ as a melt indicator in a snowpack:
-
(1) nearly all Mg2+ and Na+ come from the same source (sea salt),
-
(2) Mg2+ and Na+ have different flushing-out rates,
-
(3) Mg2+ and Na+ do not have sharp peaks in the wet snow,
-
(4) Mg2+ and Na+ are cations and thus can be measured easily on the same ice sample in one run.
The difference in flushing-out rates between Mg2+ and Na+ is probably caused by different ion-flushing processes during melting and percolation, rather than different physical locations of the chemical components within the ice matrix. This is because Mg2+ and Na+ are from the same source (sea salt) and have been transported in the same way (cloud condensation nuclei inside the precipitation particles).
Evaluation of the ratio of Mg2+/Na+ in the Austfonna ice core
The foregoing analysis has been used to interpret the Austfonna ice core. Chemical components of the ice core are shown in Figure 6. About 81.4% of the Mg2+/Na+ ratios in the ice core fall within the range 0.01–0.13; the lower bound is the mean minus the standard deviation for the wet snow, whereas the upper value is the mean plus the standard deviation for the dry snow (Table 3). This comparison suggests that the Austfonna region has been under an oceanic climate and that the variation of the Mg2+/Na+ ratios in the ice core was caused by melt percolation. Three ice-core parts that have Mg2+/Na+ ratios of 0.03 ± 0.02 are shaded in Figure 6. These shaded parts probably experienced strong melt percolation and flushing-out of ions.
Vertical distributions of Mg2+/Na+ ratio, δ18O, Mg2+ ,Cl−, SO4 2−, and SO4 2−/Cl− ratio in the Austfonna ice core from the surface to 113 m depth. Shaded boxes indicate parts having Mg2+/Na+ ratios of 0.03 ± 0.02. The horizontal line marks AD 1920. Arrows mark three other volcanic time markers that were identified by electrical conductivity measurements (Reference WatanabeWatanabe and others, 2001).
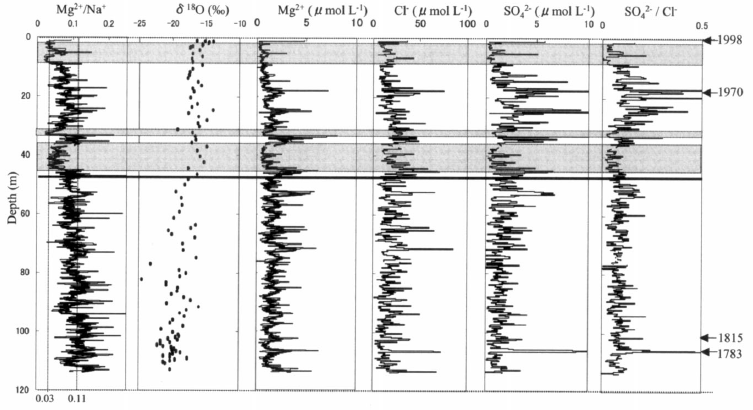
Results for other ion species support the hypothesis that the variation of Mg2+/Na+ ratios is caused by melt percolation. The shaded regions in Figure 6 have relatively low concentrations of Mg2+, SO4 2− and Cl− compared to neighboring parts. As indicated by the second row in Table 1, roughly half of the SO4 2− is not from sea salt, whereas Mg2+ and Cl− are assumed to originate from sea salt. This suggests that the decrease in concentrations of Mg2+, SO4 2− and Cl− (without a single exception) occurred after snow accumulation on Austfonna. Reference KoernerKoerner (1997) suggested that SO4 2− flushes out faster than Cl− when ice or firn melts. Our W/D measurements of 0.12 for SO4 2− and 0.25 for Cl− (Table 1) support Koerner’s suggestion, i.e. some ice-core regions with relatively low SO4 2− /Cl− ratios have experienced melt percolation. The shaded parts in Figure 6 have relatively low concentrations and low SO4 2−/Cl− ratios, which also indicates that melt percolation occurred.
Figure 7 shows the Mg2+/Na+ ratios and the stratigraphy of firn or bubbly ice (I) and bubble-free ice (II). We assume that bubbly ice is formed by the compression of firn, and bubble-free ice is formed by refreezing of meltwater. We classify the stratigraphy into three types:
-
(1) type A consists of >50% firn or bubbly ice,
-
(2) type B consists of 50–90% bubble-free ice, and
-
(3) type C consists of >90% bubble-free ice (<10% firn or bubbly ice).
Vertical distributions of Mg2+/Na+ ratio and the firn and ice stratigraphy. The horizontal thick lines and shaded boxes have the same meanings as in Figure. 6. I and II indicate the stratigraphies of firn or bubbly ice and of bubble-free ice, respectively. Horizontal dotted lines indicate divisions between ice types having different stratigraphy.

The shaded boxes all have the following order of stratigraphic features: type A on top (upper part), type B in the middle, and type C at the bottom (lower parts). This order suggests that in the upper part of each shaded box some melting percolated and flushed out ions to the lower region, while in the middle and lower parts of each shaded box, water percolated from above and also meltwater percolated further downward. The middle and lower parts are composed of bubble-free ice; if this region had instead been completely saturated with meltwater, then the bubbles would not be present and the Mg2+/Na+ ratios would be >0.03 due to the higher ratios of the percolating water. This suggests that the upper part is a highly percolated run-out zone (i.e. ions flushed out), whereas the middle and lower parts are a mixture of percolated, incompletely saturated and partly run-out zone (i.e. some ions flushed in and some flushed out). Firn and ice in the shaded boxes are assumed to have experienced percolation beyond an annual layer since the thicknesses of the shaded boxes are larger than an annual layer (0.5–0.8 m).
Most parts of the ice core have Mg2+/Na+ ratios near 0.11. These parts can be divided into two zones. One is a zone of firn or bubbly ice (type A) observed at depths of 60–63 and 107–109 m. This firn or bubbly ice is considered to be unmelted because the Mg2+/Na+ ratios and stratigraphy exclude the possibility of melting. We assume such zones were below the melting point during the summer when precipitation fell on Austfonna.
The other zone consists of bubble-free ice (types B and C). This bubble-free ice is assumed to be superimposed ice formed from refreezing of meltwater. If meltwater had percolated beyond the zone, the Mg2+/Na+ ratios would be lower or higher than 0.11 ± 0.02; hence, the refreezing was limited to the thickness of the zone. As the analytical resolution (about 0.2 m) is thinner than that of an annual layer (about 0.5–0.8 m), the zone probably experienced repeated summer melting and winter refreezing when precipitation fell on Austfonna.
The remaining 19.6% of the ice (types B and C) has Mg2+/Na+ ratios >0.13 (i.e. 0.11 + 0.02). This ice is considered to be superimposed ice with percolated water with relatively high Mg2+/Na+ ratios coming from outside of the zone. Ice in these parts likely contains above-average amounts of refrozen meltwater that once had high Mg2+/Na+ ratios.
According to the discussion above, there are five zones that can be distinguished by their Mg2+/Na+ ratios and ice and firn stratigraphy. These are summarized in Table 4. Hence, in addition to ice and firn stratigraphy, the Mg2+/Na+ ratio can be used to improve our interpretation of the melting, percolation, saturation and refreezing processes in the Austfonna ice core.

Recent climatic environment on Austfonna derived from Mg2+/Na+ ratios and ice and firn stratigraphy
We now use the Mg2+/Na+ ratios and the ice and firn stratigraphy to understand the recent climate on Austfonna. The magnitude of melting is compared, based on the five zones (1–5) in Table 4. From most melted to least melted, the zones are ordered as

Since melting usually occurs at the surface of Austfonna, the magnitude of the melting is related to summer air temperature.
Thus, the years that produced snow for zones 2 and 3 were probably warmer than those corresponding to zones 1, 4 and 5. Reference WatanabeWatanabe and others (2001) detected a shift of about +2‰ in δ 18O at about 48 m depth. The year corresponding to the 48 m depth is near AD 1920. At this time, a distinct warming trend was observed at Isfjord Radio Meteorological Station (Reference Hanssen-Bauer, Solås and SteffensenHanssen-Bauer and others, 1990). Zones 2 and 3 occur only after 1920, whereas zone 1 occurs only before 1920. Since practically no melting has occurred in zone 1, the years that produced snow in zone 1 probably were colder and might not have had summer melting. Therefore, firn or bubbly ice after 1920 (zone 2) and the wet snow observed in the pit walls probably experienced much more melting compared to firn or bubbly ice before 1920 (zone 1).
We used the Mg2+/Na+ ratio in the Austfonna ice core to identify firn or bubbly ice that experienced melt percolation. This use of the Mg2+/Na+ ratio might be applicable to other ice cores from sites with an oceanic climate.
Conclusions
Based on chemical analysis of the snowpack from pit walls in Austfonna, we found that the Mg2+/Na+ ratio is a good indicator of whether or not firn or bubbly ice in an Austfonna ice core experienced melt percolation. The requirements of an indicator ratio are (1) the two ions that form the ratio have the same source, (2) the two ions that form the ratio have different flushing-out rates, and (3) the two ions that form the ratio do not have sharp peaks that are not correlated with other ions after the flushing processes. The Mg2+/Na+ ratio satisfies these requirements. Using this ratio, we predicted that firn or bubbly ice prior to 1920 was less affected by melting than ice after 1920.
Acknowledgements
We wish to thank H. B. Clausen of University of Copenhagen and Y. Fujii of the National Institute of Polar Research for useful comments. We also thank members of JAGE-98 and -99 for help with the fieldwork, and S. Matoba of the National Institute of Polar Research, Japan, for assistance in cutting the Austfonna ice core. The paper was significantly improved as a result of comments by anonymous referees and its handling by Scientific Editor, S. J. Jones, to whom we are greatly indebted. This research was supported by a Grant for an International Scientific Research Program of the Ministry of Education, Gulture, Sports, Science and Technology (No. 08041114).



