


Introduction
Local governments, including cities, counties, and school districts provide billions of dollars in economic development incentives in the form of tax abatements to firms.Footnote 1 These incentives have been criticized for their lack of transparency and the high costs to taxing entities.Footnote 2 Unlike cash grants to businesses or procurement contracts, many governments at the state and local levels were not required to disclose the costs of tax abatements given to companies.
In a highly contested decision, the Government Accounting Standards Board (GASB), the U.S. non-governmental agency that sets standards for financial accounting, issued ruling GASB 77 in 2016, requiring disclosure of tax revenues forgone from tax incentives. Recent regulatory changes now require government entities to disclose revenue forgone through tax abatements in their Annual Comprehensive Financial Reports (ACFRs). The new standards hold out hope that the opaque world of economic development will come to light.
These disclosures have been met with both strong praise and criticism suggesting that these reforms could impact economic development policy. Economic developers, consultants, and firms submitted letters in outright opposition to GASB 77 or criticism of specific reporting requirements.Footnote 3 The organizations claimed that these disclosures can be a burden to local entities such as cities and school districts, and they worried that reporting of the costs but not the benefits may provide an incomplete picture of economic development. Transparency organizations, as well as critics of the use of tax abatements, wrote letters of support of the rule and pushed for a broadening of the definition of tax abatements to include tax increment financing (TIFs) and mandating the disclosure of individual incentive deals, not just aggregate costs.Footnote 4
Unfortunately, compliance with GASB 77 is incomplete. NGOs such as Good Jobs First have documented GASB 77 nondisclosure and posted a regular blog series on disclosures. Thrall and Jensen conducted an analysis of 2017 and 2018 GASB 77 disclosures and, using a very conservative data coding strategy, they found non-compliance rates of 22 percent and 20 percent,Footnote 5 respectively. Their survey of local government officials as well as city financial officers found that only 4 percent of elected officials and 12 percent of financial officers were “very familiar” with GASB 77.
In this project, we explore this non-compliance through an experiment that attempts to “nudge” both government officials in cities, counties, and school districts as well as their independent auditors into providing compliance data on their tax incentive deals offered to firms using a field experiment in the state of Texas. Texas is a representative state in terms of the use of economic development incentivesFootnote 6 and GASB ComplianceFootnote 7 and new legislation creating a state database of tax incentives allows us to inform government entities of our ability to compare their GASB filings with state tax databases. Our research builds on a broader political science literature on both transparencyFootnote 8 and compliance with financial standards.Footnote 9
Our hypothesis predicted that government agencies and independent auditors would be more likely to provide us with information on the location of tax incentive data when we remind them that disclosure is mandated by GASB accounting standards. Our main findings from this study are that efforts to increase compliance were either ineffective or even counterproductive. Consistent with the work of Moy,Footnote 10 there is some evidence that reminding agencies of their obligations can lead to a “backfire effect.”
The opacity of economic development programs
States, counties, cities, and school districts provide different forms of economic development incentives to firms. These incentives can subsidize power and water or cheap land for the favored firms’ operations. Governments can build specialized infrastructure for firms or tailor workforce development programs for company needs. Many governments provide cash grants to companies for relocation or expansion.
Despite the wide variety of potential grants and subsidies, tax abatements and exemptions remain the most common form of economic development incentives. In a study of manufacturing incentive programs, Danzman et al found that 147 of 210 programs were tax incentives.Footnote 11 While tax abatements and exemptions are often less effective than other forms of economic development programs,Footnote 12 for government officials they offer the advantage—unlike grants that must be budgeted and paid for—of unlimited tax incentives if programs are uncapped. For example, the largest cash grant program in the country, the Texas Enterprise Fund, is subject to biannual appropriations that can vary considerably across legislative sessions.Footnote 13 These incentives, limited by the legislature, have never exceeded $50 million per company or $280 million in a two-year period.Footnote 14 The largest Texas tax incentive, in contrast, is a now sunsetted tax limitation program called Chapter 313 which was an uncapped tax incentive for companies.Footnote 15 This program was estimated to cost as much as $1 billion per year.Footnote 16 One company, Samsung, applied for incentives covering up to $4.8 billion in property-tax breaks for an investment in Taylor, Texas.Footnote 17
These two Texas examples illustrate how tax incentives can be less constrained than grants or other incentive programs. Without regular budget authorizations, and no caps, governments can literally give out unlimited amounts of tax incentives, making them a favorite of elected politicians across states.Footnote 18
An additional feature of tax incentives, often criticized by good-government activists, is that tax abatements are a less transparent form of economic development incentives. As argued by Jensen and Malesky,Footnote 19 governments can “credit claim” the investment and job creation of firm relocations and expansion that they assert stem from the incentives. However, the political use of incentives raises the possibility that voters might be sensitive to their costs. Using a series of survey experiments, they find that when voters are presented with the tradeoffs between economic development and other policies, the political benefits of incentives dissipate. Making the costs of incentives more transparent is at the heart of the GASB 77—the transparency initiative that we are exploring in this paper. GASB 77 requires government entities to reveal how much in taxes are forgone due to economic development incentives, which aligns the transparency of the fiscal costs of tax incentives with other government programs.Footnote 20 This specific transparency reform in the domain of economic development connects to a larger literature on government transparency.
The impact of transparency on governments
Transparency has long been associated with good governance and is key to democratic accountability.Footnote 21 Nevertheless, the tradeoffs of making government more open remain subject to a lively debate among public administration scholars.Footnote 22 A starting point is clearly defining transparency.
First, it is important to differentiate reactive versus proactive transparency. Existing studies have largely experimented on government compliance with either proactive transparency requirements such as providing information on government websites or reactive transparency laws such as responding to requests. Reactive laws, including the Freedom of Information Act (FOIA), entail individual requests for information, which have been used in field experiments and observational data analysis in Mexico,Footnote 23 Brazil,Footnote 24 the UK,Footnote 25 the Netherlands,Footnote 26 and the US.Footnote 27 These studies generally agree that, compared to informal requests, governments respond more reliably to transparency clauses such as FOIA and provide more and better information when legal requirements are invoked, although recent work appealing to peer comparison suggests no impact.Footnote 28
In our area of study, economic development, many government agencies have moved to greater use of proactive transparency, requiring government agencies to post information about economic development, such as grants or tax breaks provided to companies for expansions or relocations. NGOs such as Good Jobs First have cataloged the passive transparency of government economic development programs,Footnote 29 and activists in places like New York State have pushed for “databases of deals” as a form of proactive transparency.Footnote 30
Unfortunately, media scrutiny and academic studies have often found problems with this proactive transparency in the use of economic development incentives. For example, media reports in Wisconsin found that government agencies were overstating job creation associated with these individual projects.Footnote 31 Academic research has shown that publicly announced incentive details and deals documented on government websites were subject to secret amendments, lowering the job requirements for these government grants.Footnote 32 Many states exempt economic development incentives from state public records requests, limiting activists’ ability to obtain information on these incentives.Footnote 33
GASB 77 was a major proactive transparency initiative, requiring disclosure of the costs of these economic development incentives. However, as noted, compliance with these rules has been incomplete. Unlike FOIA requests, for which governments are required to respond to the requester, our research question focuses on government responses to queries about their required information and the accuracy of their GASB 77 disclosure.
A small number of studies have examined similar questions. For example, Wagner inquired about county sheriffs’ incident reports, civilian complaints regarding road maintenance, collective bargaining agreements, and district attorney offices’ biennial budgets.Footnote 34 While these agencies are formally required to provide this information, additional information requests or clarifications can be met with either help or silence. Work by Pasquier and Villeneuve documents the different motivations for agencies resisting transparency, including a culture of secrecy, institutions’ motivations to not admit mistakes, political reasons such as security concerns, or organizational reasons in which agencies may not be equipped for these types of requests.Footnote 35 The Office of Evaluation Sciences conducted an email transparency experiment informing non-entitlement units of local governments on both the ease of filing paperwork and the transparency of peers in their use of COVID-19 funding.Footnote 36 The researchers find that their treatments have no impact on local government transparency. Closest to our work, Moy conducted a field experiment on U.S. city executives testing if reminding politicians of their obligations or making clear that their peers are complying with transparency requests leads to greater compliance.Footnote 37 Contrary to expectations, reminding politicians of their obligations had no impact on compliance, and city executives who received a peer-effects treatment were less likely to comply.
These studies of government responses have similarities to research on independent auditors. Studies of financial disclosure found shockingly high levels of non-compliance with disclosure rules.Footnote 38 This non-compliance can be driven by the complexity of the disclosureFootnote 39 and individual auditor attributes.Footnote 40
Our research design and theory do not focus on the motivation for or the resistance to transparency by government bodies and external actors. Rather, our field experiment examines if nudges reminding officials and auditors of their obligation to publish tax incentives leads the actors to provide us additional information on their mandatory disclosures.
New laws and standards have increased transparency requirements for numerous government entities from local governments to federal agencies. However, we have limited information on the role of private citizens and interest groups in checking the accuracy of this information or enforcing compliance with these rules. Therefore, adding to the evidence base on this question is critical.
Tax-abatement disclosures are fertile ground to test theories of transparency. GASB 77 is a reporting requirement promulgated by a private professional association and thus fits within the proactive transparency literature, although our experiment borrows also from research on reactive transparency. Unlike previous studies that document compliance or non-compliance with transparency rules,Footnote 41 we utilize an audit experimental approach to examine how reminding respondents of their obligations under GASB affects responses to our request for GASB 77 mandated data.Footnote 42
Unlike government laws, GASB 77 sets accounting standards that affect an actor’s ability to borrow. Thus, the main enforcement mechanism of GASB is through reputation. Scholars of transparency have argued that reputation can be an important mechanism for ensuring compliance with transparency laws.Footnote 43 Similar to FOIA studies citing specific FOIA laws,Footnote 44 we remind government actors and independent auditors of their disclosure obligations. Unlike FOIA studies, government agencies or auditors are not required to respond to our queries. Despite this difference, we expect local governments to be sensitive to legal disclosure responsibilities and the potential reputational cost of non-response, especially given that the inquiry is a relatively simple request.
Hypothesis: Localities primed with the GASB 77 disclosure responsibilities are more likely to cooperate with public tax-incentive disclosure inquiries.Footnote 45
Key to our research is understanding the roles of both financial officers in government entities who prepare the reports and the independent auditors who certify these reports. For financial officers representing counties, cities, or school districts, accurate financial disclosures can be associated with lowered borrowing costs. In a working paper on GASB 77 implementation, Li et al found that GASB 77 overall lowered borrowing costs for governments through reduced information asymmetry as well as public scrutiny.Footnote 46 In a study of another GASB reform of disclosures of post-employment benefits, Yu found that disclosures of non-transparent obligations lead to increased borrowing costs.Footnote 47 In a study of tax abatements, Chava et al found that greater use of subsidies is associated with higher borrowing costs.Footnote 48
This literature suggests that economic development subsidies can have negative impacts on local finances and that the information asymmetry can lead to higher borrowing costs across all borrowers. Financial market actors are sophisticated in their evaluation of selective transparency and incorporate limited GAAP compliance into prices.Footnote 49
Equally important is the role of independent auditors in compliance with GAAP standards. These independent auditors are responsible to identify accounting deficiencies and certify that government financial reports meet standards that provide confidence to users of financial statements. In reality, many auditors may have a hand in the preparation of financial statements, although this could lead to conflicts of interest. In a creative study of language convergence in reports across municipalities that share the same auditor, Yang finds striking similarities in financial reports that suggest auditors play a greater role than simply certification.Footnote 50
For the purposes of our study, auditors are subject to similar reputational effects where certification of compliance with GAAP standards is the central to their business, although Moore et al argue that the reputational consequences may be in the distant future.Footnote 51 However, the role of reputations in securing and retaining clients is key, thus non-compliance with financial reporting is a serious concern for auditors.Footnote 52
In the next section, we outline our research design in examining how reminding both government financial officers and independent auditors of their obligations impacts their responses to requests for tax abatement information.
Research design
To test our theoretical expectations on how reminding respondents of their GASB 77 obligations affects compliance with tax abatement disclosures, we implement a field experiment in which we email both external auditors and in-house financial officers in Texas, asking them to (1) provide a link to their annual comprehensive financial report (ACFR) and (2) confirm whether they have incorporated all local tax abatements in the 2020 ACFR. Our main outcome is the degree to which respondents comply with our request. We obtained a contact list of auditors and financial officers in Texas from the Federal Audit Clearinghouse and narrowed the scope to school districts, cities, and counties.Footnote 53 We note that the fielded experiment has a small number of modifications from our original pre-registered design.Footnote 54
Texas is a useful state in which to perform this experiment for three reasons. First, Texas economic development incentives, authorized by the state legislature, enable various tax abatement programs including local incentives (Chapter 380 incentives), county tax abatements (Chapter 381), and school tax limitations (Chapter 313). Other tax abatements, such as sales tax incentives, are state programs. These cities, counties, and school districts are the main providers of tax incentives in Texas. To give a recent example, a proposed $17 billion investment by Samsung in Taylor, Texas received almost $1 billion in incentives from the county, city, and school districts.Footnote 55 Additional incentives from the state are possible, but the largest tax incentives offered to the company are from the main taxing entities in the state. Thus, state law authorizes the use of tax incentives at the level of county, city, and school districts that are comparable across entities.
Second, Texas is a representative state in terms of GASB Compliance. Texas is the median state in terms of GASB noncompliance (ranked 25th).Footnote 56 According to Good Jobs First the majority of major cities and large counties complied with GASB 77, although a number of the largest school districts did not comply.Footnote 57 This variance in compliance is similar to other states, providing us with a representative case of tax abatement transparency.
Third, in 2021 the Texas legislature passed HB 2404. This bill mandated that entities upload tax abatement agreements to a database housed by the Texas Comptroller. This database not only allows us to examine if entities were failing to disclose their tax abatements, but informing subjects about the passage of this legislation was used as part of the randomized treatment in our experiment. We discuss this treatment later in this section, but this unique legislation in Texas provides an excellent laboratory to test theories of transparency.
Each one of these entities (school districts, cities, and counties) is required to publish an annual comprehensive financial report (ACFR) that provides details on the financial health of the entity. These reports can be produced in-house or by a third party, but the key for our research is that each one of these reports is audited by a professional auditor. We access a database that includes the auditor and contact information for the annual comprehensive financial report (ACFR) for the entity as well as the internal financial officer at the city, county, or school district. Some auditors can appear more than once, for example when a single auditor is responsible for multiple school districts. We randomly selected one entity in such cases, as discussed below. All internal financial officers represent only one government entity. We contacted these auditors and financial officers for the field experiment.
We first implemented the experiment with 227 external auditors as subjects from July to September 2022 and then began contacting 912 entity internal financial officers in October 2022. Our sample size is similar to many other transparency studies including the Yang et al study of 198 subdistrict governments.Footnote 58
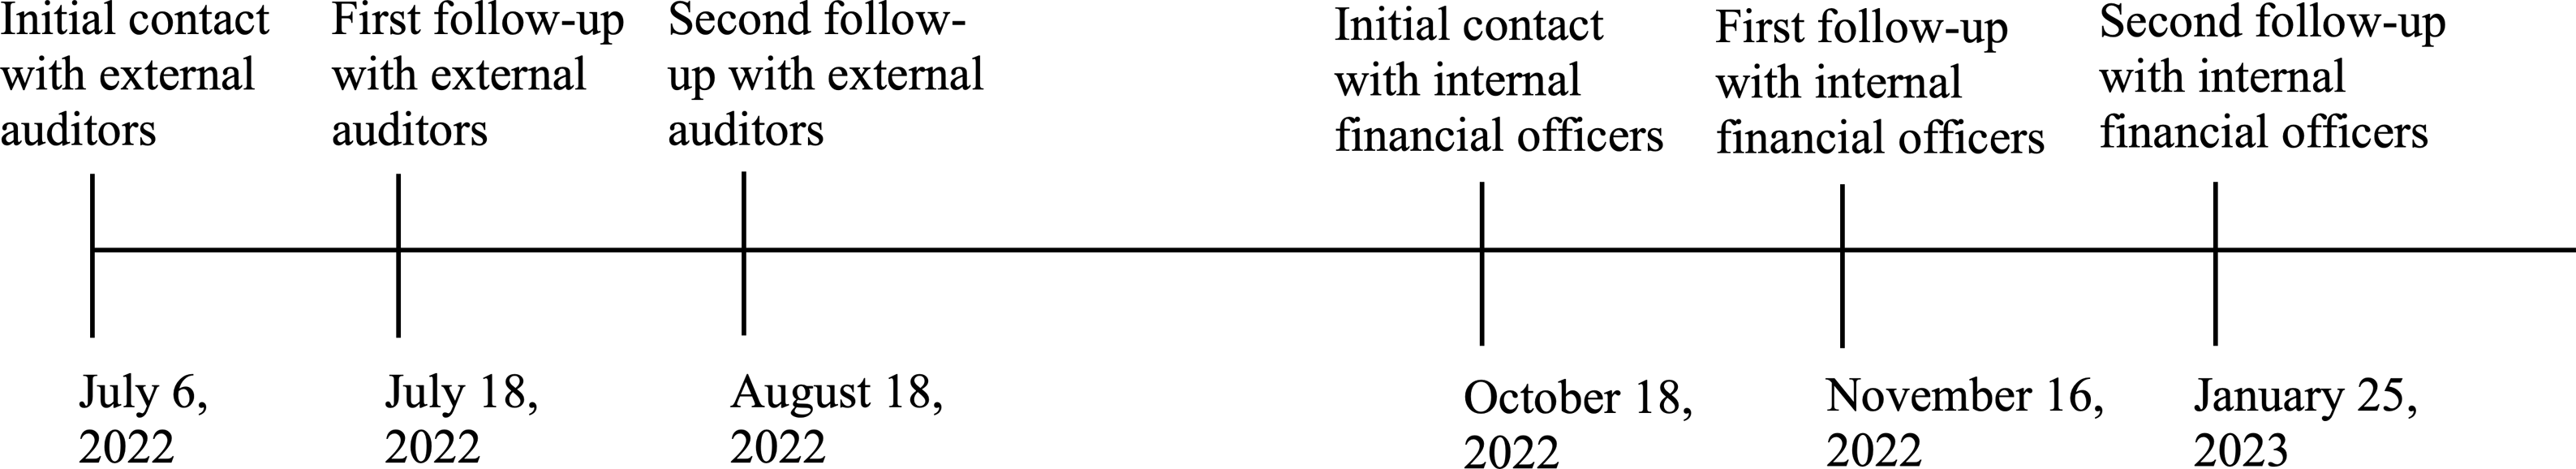
As a general communication protocol, we contacted the subjects three times unless they responded to our email. In other words, we sent out an initial email and conducted two rounds of follow-ups. Figure 1 shows the timeline of this study.
Timeline of communication with subjects.

Baseline Condition:
Dear [AUDITOR NAME]:
We are researchers at the University of Texas at Austin conducting research on tax abatements of local Texas government entities such as cities, counties, school districts, and housing authorities. We are inquiring after [ENTITY NAME]’s audited annual comprehensive financial report (ACFR) for reported tax abatements.
We are reaching out to verify that all local abatements provided by the government are included in the 2020 ACFR.
Can you please direct us to the website URL or repository from which we can download the audit report or otherwise access it? Can you verify that all local abatements were included in the 2020 report?
Thank you for your attention to this inquiry.
Sincerely,
NAMES REDACTED
Our only treatment in this study is a priming of regulatory requirements that local governments are legally obliged to disclose tax abatements and publish agreements in public databases. This represents an alteration from the pre-analysis plan in that the focus on the single state of Texas reduced statistical power and prompted us to bundle the planned interventions into a single treatment to heighten anticipated treatment effects. Since we contacted external auditors first and later reached out to in-house financial officers, we refined our treatment message for financial officers to be consistent with a change in the timing of the implementation of a Texas transparency law. For external auditors, the treatment message was:
The Government Accounting Standards Board (GASB) issued Rule 77 in 2015, requiring foregone tax revenues due to abatements be disclosed on ACFRs. Last spring the Texas Legislature passed and Governor Abbott signed HB 2404. The law requires that, starting May 1, 2022, entities with local development agreements are now required to submit these tax abatements, agreements and amendments to the Texas Comptroller to be included in a public database.
Due to an announced delay in the implementation of HB 2404 during our experiment, we provided a broader treatment to financial officers on our ability to check for disclosure of tax incentives. In both cases, we include information on the obligation to report these tax abatements and our ability to compare ACFRs with secondary information on tax abatements.Footnote 59 However, we do not think the difference in messages introduces theoretically meaningful confounders that would significantly alter the results. The treated group in the sub-sample of in-house financial officers received additional text that augmented the original treatment as follows:
The Government Accounting Standards Board (GASB) issued Rule 77 in 2015, requiring foregone tax revenues due to abatements be disclosed on ACFRs. Our research will collect incentive data to learn if local ACFRs match up with public databases of incentives such as the Good Jobs First Subsidy Tracker and private databases such as IncentivesFlow.
We randomly assigned external auditors and internal financial officers into treatment and control groups. For in-house financial officers, we used block randomization according to the population size of the local entities (school districts, cities, and counties). FOIA research has identified entity size as an important factor in shaping responses.Footnote 60
For school district sizes, we used the enrollment data from the US Department of Education. Cities’ and counties’ population size data were drawn from the census data maintained by the US Census Bureau. Because population size is a continuous variable and can create problems for block randomization, we converted size into a four-category scale based on quantiles. Pooling the localities together may have created confounds since counties would have dominated the larger quantiles. Thus, we block-randomized each type of local entity independently in its own quantile blocks—random assignment took place separately in each school district, city, and county quantile.
Since one external auditor can audit multiple localities, the random assignment process for this sub-sample was a bit more complicated. We first identified external auditors who had worked with more than one locality and randomly selected one out of all entities they audited. Then, we combined them with auditors who had only worked with one entity. Finally, we applied the same block-randomization strategy for external auditors by entity type and size quantile.
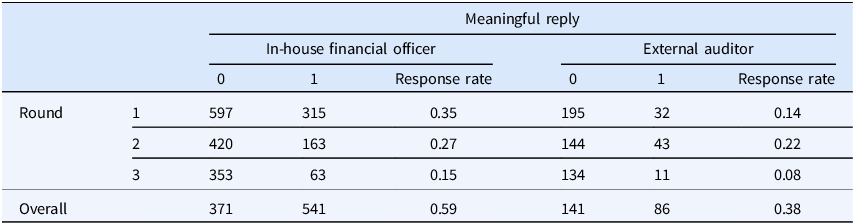
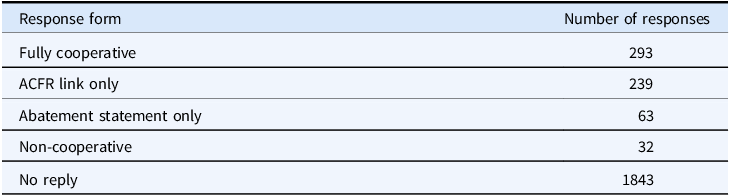
Table 1 summarizes the responses by subjects’ roles and different rounds of email communications. A “meaningful reply” is any reply that comes from a human being rather than an automatic reply message. Broadly speaking, there are four types of meaningful replies based on our requests: (1) providing both the ACFR link and a statement on the inclusion of tax abatements, (2) providing only the ACFR link, (3) providing only a statement on the inclusion of tax abatements, and (4) refusing to cooperate. The fourth category consists of replies that explicitly stated that the subjects had no legal obligation to disclose such information or responses that were not directly related to our requests.
Tabulation of (non)responses across rounds and subjects’ role

The table shows attrition between different rounds—the sums of replying and non-replying subjects are slightly less than the number of non-replying subjects in the previous round. This is mostly because the original contacts became unavailable due to changing their jobs, and the email response made this clear. We did not follow up on the communication when subjects changed employment or when our emails otherwise failed to deliver. There are in total 120 bounced contact attempts due to delivery failures or job changes: 70 in the first round, 30 in the second round, and 20 in the last round. These failed communications are also balanced across treatment and control groups in the first round; 35 are in treated and 35 in control. There are fewer bounced emails from treated groups in the second and third rounds of communications. There are 9 failed contact attempts from the treated group in the second round (21 from the control group) and 7 in the third round (13 from the control group). These responses are all coded as part of the “No Reply” category in the final responses. Given these bounced communications are small in number and they are balanced across treatment and control groups we do not think they present a threat to our results.
To match email responses with objective compliance data, we leveraged the disclosure of two tax-abatement programs for school districts and cities/counties respectively. The Texas comptroller website publishes Chapter 313 agreements, which are value-limitation agreements granted by school districtsFootnote 61 and Chapter 380/381 economic development agreements of cities and counties.Footnote 62
To determine disclosure compliance, we accessed the ACFRs of the local entities and determined whether these agreements had been disclosed. An entity is compliant if its ACFR discloses tax abatements that broadly match the agreements in the two public databases we identified. We then combined the objective compliance data with our email responses.
Out of 703 school districts in our sample, we identified 97 that have Chapter 313 agreements as indicated in the public dataset; 80 disclosed these agreements in ACFRs and 17 did not. We have 436 cities and counties in our sample, 170 of which have Chapter 380/381 agreements; 117 disclosed tax incentives in their 2020 ACFR and 53 did not.
Data analysis
The three rounds of communications are compiled into a dataset of email responses in which the unit of observation is auditor-round. Since our emails contain two requests—providing the ACFR link and a statement on whether tax abatements are included in the 2020 ACFR—there are five possible responses. A reply that is fully cooperative provides both the ACFR link and the statement on tax abatement. Some replies are only partially cooperative, in which the subject only provided either the ACFR link or a statement on the inclusion of tax abatements. A small number of replies are uncooperative: some recipients—mostly external auditors—claimed (incorrectly) that they did not have the authority to disclose such information, and others made various comments that are unrelated to our study. The last outcome value is non-reply, in which the recipients just did not write back to us.
We created two versions of the dependent variable. The first one we call Meaningful Reply, which is 1 if there is any reply from a real person and 0 if there is no response. Therefore, a meaningful reply includes all three forms of replies: fully cooperative, partially cooperative, and uncooperative. The second version is Cooperative Reply, which excludes the uncooperative responses. In other words, this variable is 1 only when respondents are fully or partially cooperative and 0 otherwise.Footnote 63
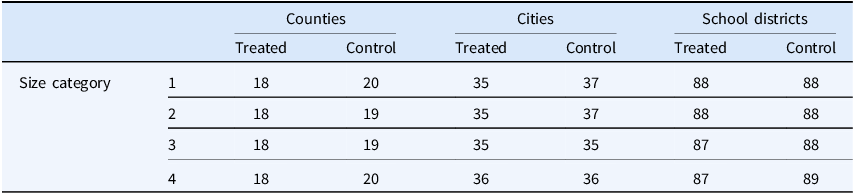
Our key independent variable is the treatment status, Treated, which takes 1 if a subject is in the treatment group and 0 if the subject is in the control group. Given our block randomization strategy, we verify that our assignment is balanced across different types of local entities in Table 2. As designed, the number of localities under treatment and control groups is roughly the same within each entity type and size category.
Number of local entities in treatment and control across type and size categories

We control for External Auditor, which is also a binary variable that is 1 if a subject is an external auditor and 0 if he/she is an in-house financial officer. We also control for Round, which is a categorical variable that takes values of 1, 2, and 3, indicating whether the correspondence took place in the initial contact, the first follow-up, or the second follow-up. Using the initial contact as the baseline of comparison, Round 2 and Round 3 capture the impact of follow-up communications on the likelihood of getting responses. Since local government partisanship could affect the response to our requests, we use the share of the Democratic party from the 2020 Presidential election,Footnote 64 or Democratic Vote Share, to capture local political ideology.Footnote 65 We use two binary variables County and City to indicate different types of local governments, with school districts being the baseline of comparison.
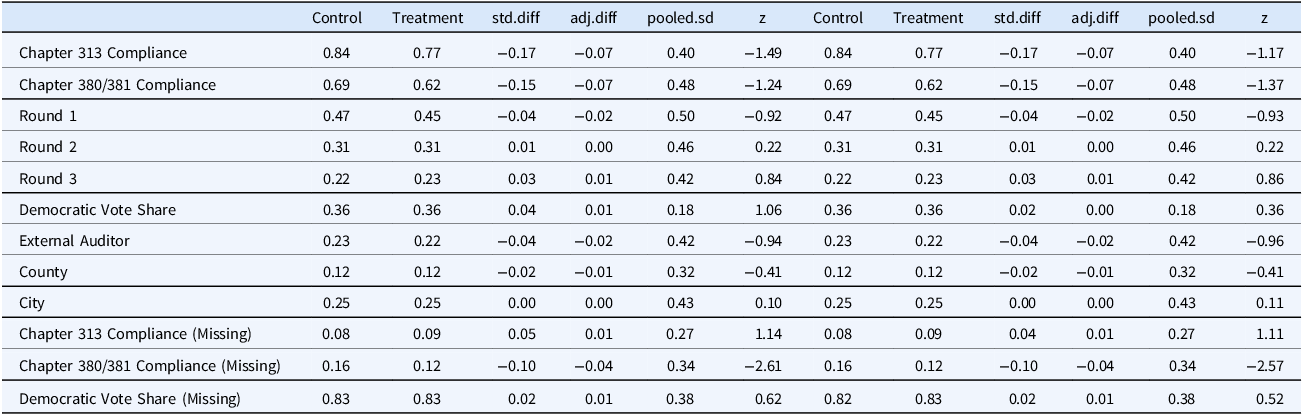
We compare the statistical differences across treated and control groups to check whether our treatment assignments are balanced across covariates, with results shown in Table 3. With the null hypothesis being no selection into assignment, an insignificant difference between treatment and control conditions suggests that the treatment assignment is balanced across these covariates. The results indicate that the differences between treatment and control groups are statistically insignificant across all covariates when the locality size is used as the randomization stratum and when there is no stratification.Footnote 66
Balance test of treatment assignment across covariates

With a binary dependent variable, we use the following linear probability model (LPM) to estimate the likelihood of response to our emails. We also included the logistic regression results in the Appendix as a robustness check. The results are highly consistent with the LPM regression, suggesting that our results are robust to different specifications. Y ir is a generic representation of our dependent variable, which is either Meaningful Reply ir which indicates whether a subject i has a meaningful reply in round r, or Cooperative Reply ir which indicates if a subject i cooperated in his/her reply in round r. Treated i represents whether the subject i is in the treated or the controlled group, which is invariant across rounds. External Auditor i reflects subject i’s professional role. Round indicates in which iteration the email was sent and replies received. Using school districts as the baseline of comparison, County i and City i control for these two types of entities our subjects audited or work with, both of which are also invariant across rounds. Finally, Democratic Vote Share i represents the partisanship of the respondent i’s locality as measured by the Democratic party’s vote share in the 2020 Presidential election.
 $$\begin{gathered}{Y_{ir}} = {\beta _0} + {\beta _1}Treate{d_i} + {\beta _2}External{\mkern 1mu} Audito{r_i} + {\beta _3}Round + {\beta _4}Count{y_i} + {\beta _5}Cit{y_i} \\ \!\!\!\!\!\!\!\!\!\!\!\!\!\!\!\!\!\!\!\!\!\!\!\!\!\!\!\!\!\!\!\!\!\!\!\!\!\!\!\!\!\!\!\!\!\!\!\!\!\!\!\!\!\!\!\!\!\!\!\!\!\!\!\!\!\!\!\!\!\!\!\!\!\!\!\!\!\!\!\!\!\!\!\!\!\!\!\!\!\!\!\!\!\!\!\!\!\!+ {\beta _6}Democratic{\mkern 1mu} Vote{\mkern 1mu} Shar{e_i} + {\varepsilon _i} \\ \end{gathered}$$
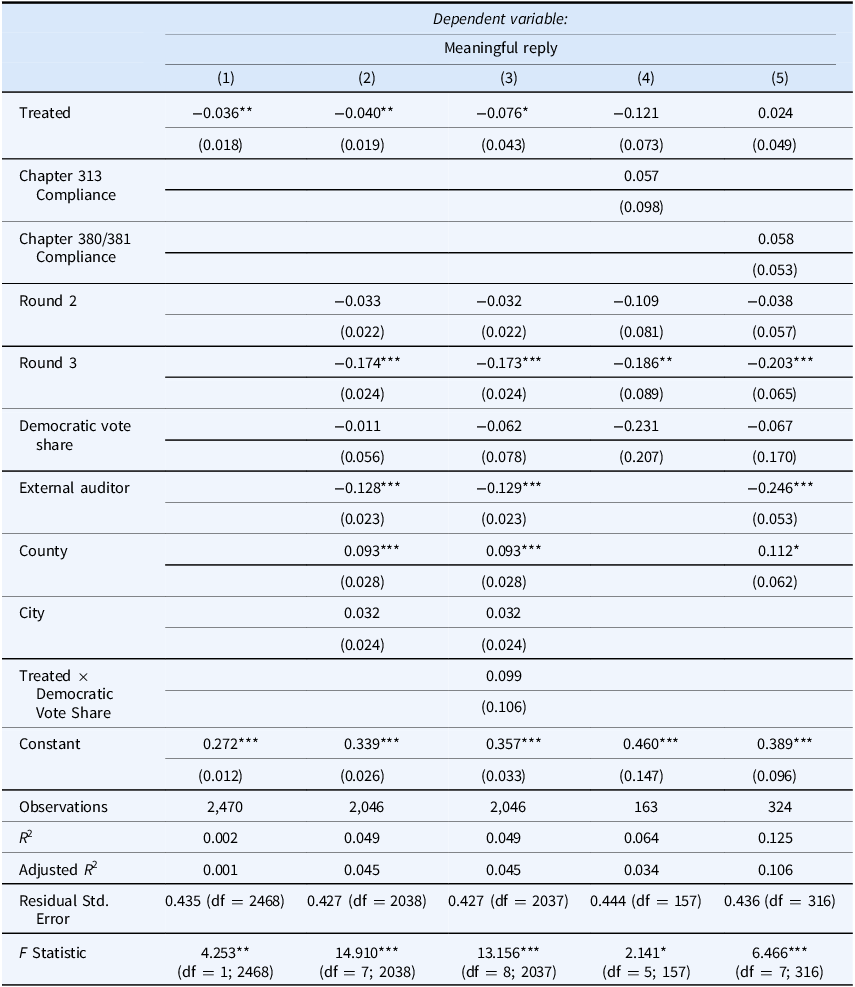
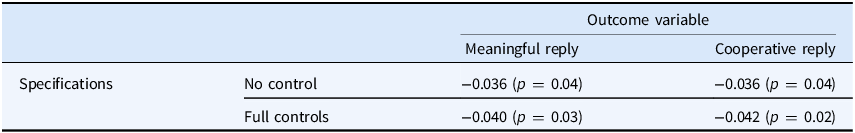
Table 4 presents the LPM regression results across various specifications. Model (1) is the bivariate regression of the meaningful response to treatment status. Note that it is functionally equivalent to the pre-registered t test. To our surprise, our treatment has a significant negative effect on the probability that we get a meaningful reply from the subjects. In particular, receiving the treatment reduces the probability of a meaningful reply by 3.6 percentage points compared to untreated subjects. Given the overall response rate of 55 percent, the 3.6 percentage points translates to a 6.5 percent change from the baseline, which suggests modest substantive significance in addition to statistical significance. The coefficient for Treated is still significant when we include control variables, as findings for Model (2) show.
LPM regression results of meaningful responses

Note: *p < 0.1; **p < 0.05; ***p < 0.01.
Models (4) and (5) investigate whether meaningful replies are influenced by objective compliance. Note that Models (2)-(4) augment the pre-registered analysis. The variable Chapter 313 Compliance is a binary indicator that takes 1 when a school district disclosed Chapter 313 agreements in 2020 ACFR and 0 if it did not. Similarly, Chapter 380/381 Compliance is 1 when a city or county disclosed Chapter 380/381 agreements in their 2020 ACFR and 0 otherwise. As these models show, our measures of objective compliance do not have a significant impact on meaningful replies. Our treatment effect is also insignificant within these subsamples of counties, cities, and school districts with matched compliance status. However, it is unclear whether the null effect is because of the lack of statistical power or true insignificance in these sub-samples as the number of observations is limited. To adjudicate this, we need a sample size of 1073 to detect the treatment effect estimated in Model (4) with 80 percent power, assuming a 5 percent significance level. For the counties and cities subsample, we need 27254 observations to detect the treatment effect in Model (5).
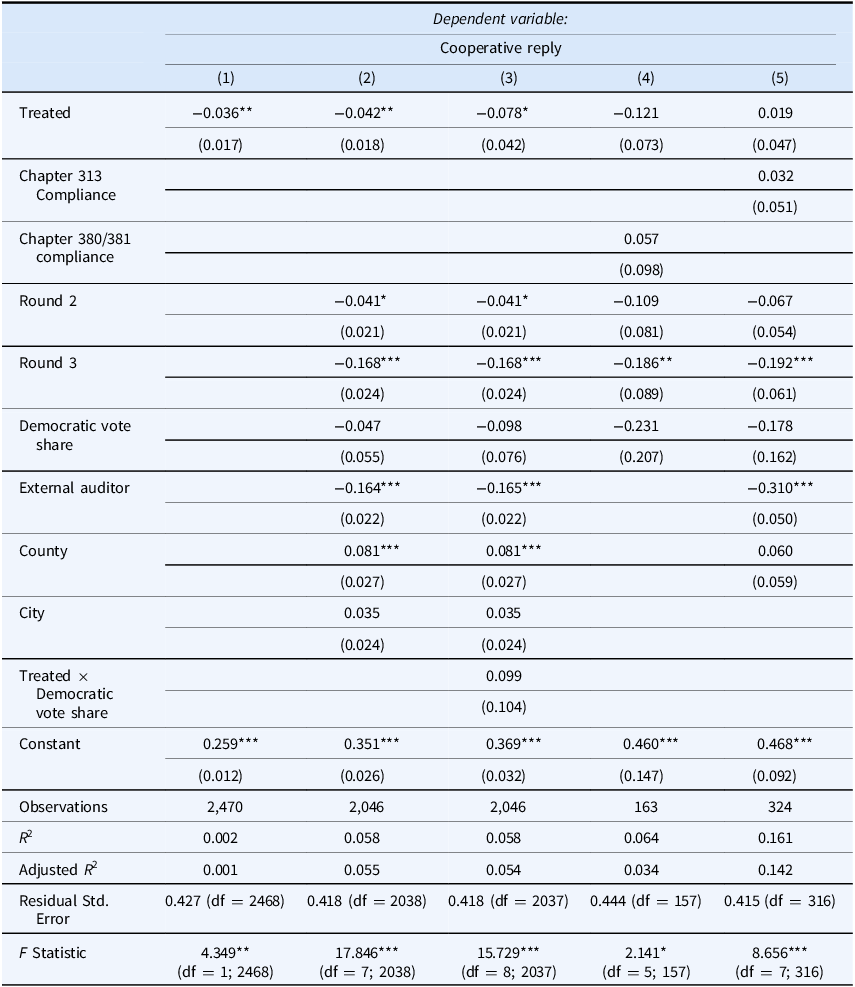
We re-run the analysis but changed the dependent variable to cooperative responses so that we only consider replies that provided some sort of information on tax abatement as valid. Again, Model (1) is functionally equivalent to the pre-registered t-test. The coefficients for the Treated variable remain similar to our previous estimations, suggesting that excluding non-cooperative responses does not meaningfully change the treatment effects.
Moreover, some coefficients for control variables included in the supplemental Models (2)-(5) deserve discussion as well. External Auditor is consistently negatively signed across all specifications. This is unsurprising because external auditors often think they do not have the liberty to disclose tax-abatement information on behalf of the local entities they audit. Indeed, in our email correspondence, some external auditors would either ask us to contact the local entities directly or to include the liaison from the local government entities in the conversation. We also find that subjects who did not respond in the previous round are less likely to reply in follow-ups, especially when we have to contact them in Round 3. Meanwhile, county-level governments are significantly more likely than school districts to respond to our requests, whereas city-level governments show no statistically significant difference from school districts. Finally, we find local partisanship has no significant impact on their responses to our requests.
One major concern of local partisanship affiliation is that our experimental outcome may be a political reaction of conservative financial officers against supposedly liberal university professors.Footnote 67 To further explore how local partisanship impacts treatment effects, we interact the treatment variable with the partisanship data to account for potential non-linear relationships. We plot the marginal treatment effect conditional on local partisanship in Figure 2, based on the Model (3) in Tables 4 and 5. Contrary to the expectation of political reaction, more democratic-leaning localities are less likely to attend to our requests in the control group. However, our treatment improves the chance of getting meaningful replies but not cooperative responses. Together, the figure shows that local partisanship is unlikely to contribute to non-responses or backfiring effects because the marginal effects between treated and control groups are statistically insignificant across the range of partisanship.
LPM regression results of cooperative responses

Note: *p < 0.1; **p < 0.05; ***p < 0.01.
Marginal treatment effects conditional on local partisanship.

Another concern of our analysis is heterogeneous treatment effects across blocks for randomization, that is, the size of localities. For robustness, we include inverse probability weighting (IPW) and size-category fixed effects in LPM regressions. While acknowledging other ways to analyze block randomizations, such as interacting treatment with block indicatorsFootnote 68 or Lin’s regression approach,Footnote 69 we adopt this approach as it allows for more straightforward and comparable interpretations.Footnote 70 The results, shown in Tables A3 and A4 of the Appendix, are largely consistent with our previous estimations.
As pre-registered, we conduct randomization inference (RI) as additional robustness checks of our results. This method uses the same outcome data but randomly reshuffles all treatment assignments for each observation 10,000 times. This creates new simulated datasets in which any differences between experimental groups are purely due to random chance. RI then compares the actual results against the simulated estimates of the randomly rescrambled data. We summarize our treatment effects estimated through RI in Table 6. The negative treatment effects are largely similar to our LPM estimations in Tables 4 and 5.
Estimated treatment effects by randomization inference

Finally, we analyze the treatment effect across four different forms of responses—that is, whether we receive a reply with both the ACFR link and a statement on the inclusion of abatement, only the ACFR link, only the statement on abatement, and non-cooperative responses. The breakdown of distinct responses is summarized in Table 7.
Breakdown of response forms

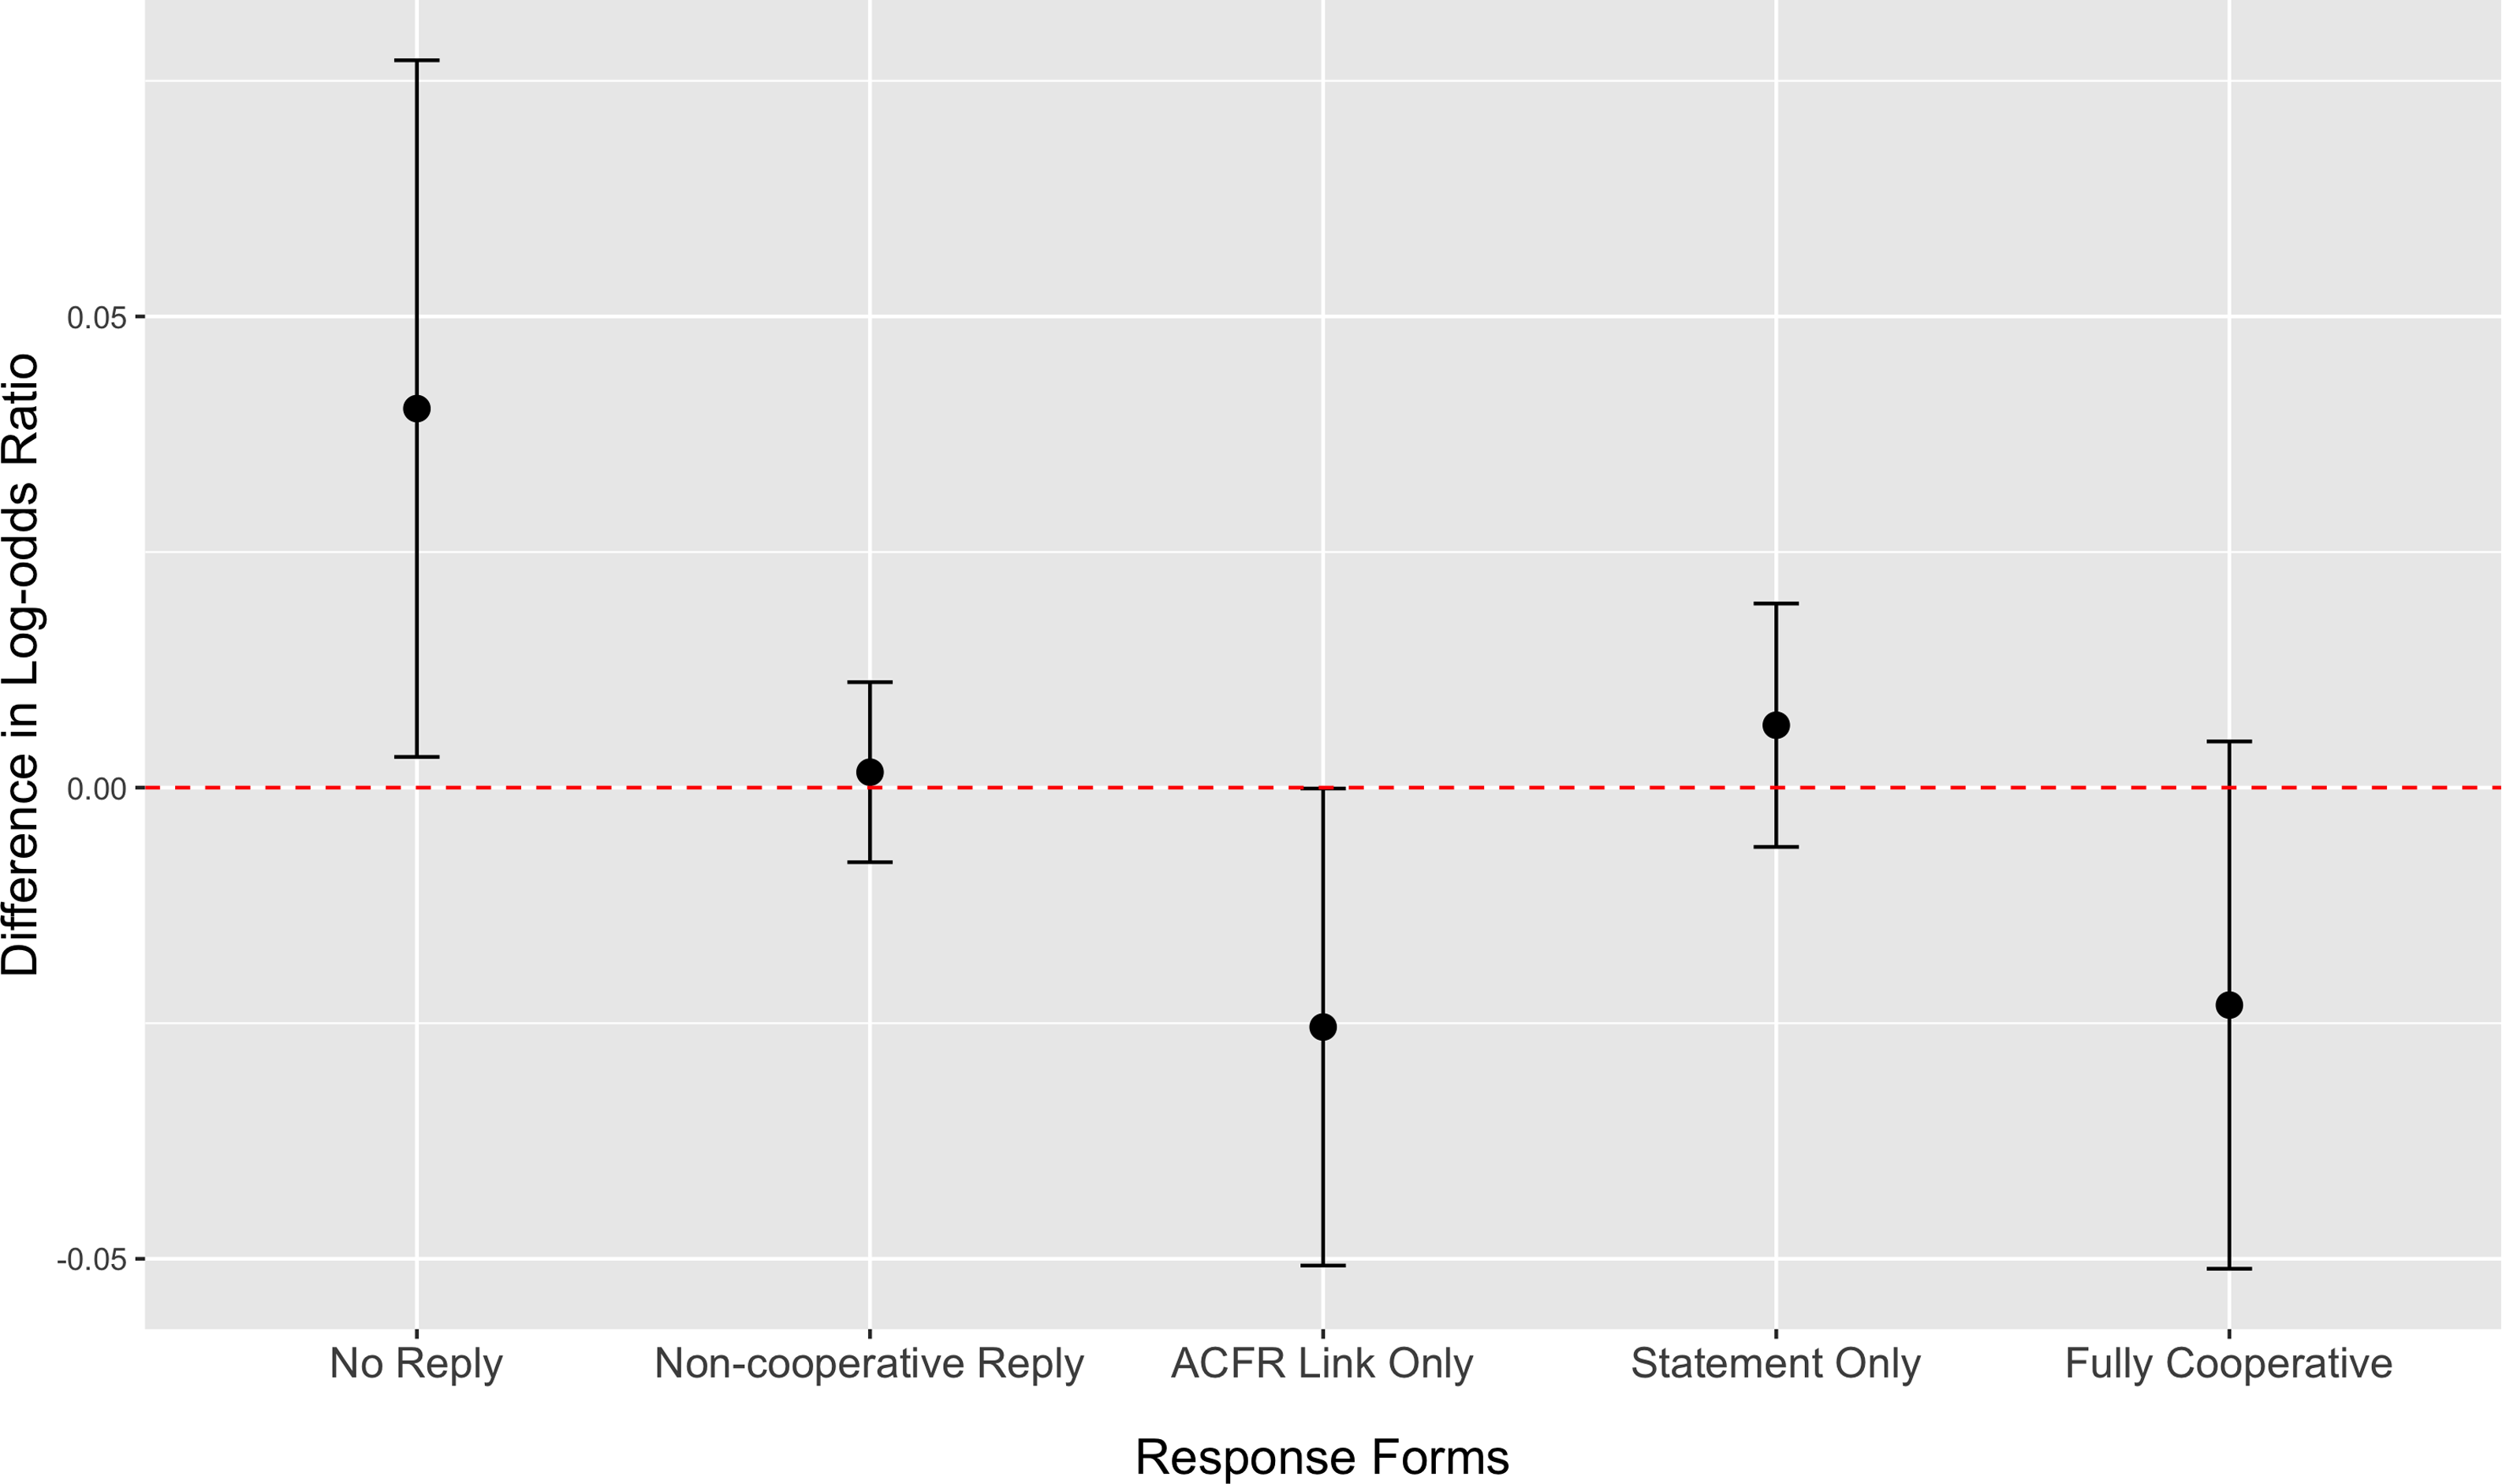
As pre-registered, we use multinomial logistic regression to analyze the treatment effects across these response forms. Figure 3 plots the marginal treatment effect—predicted average difference of log-odds ratios in specific response forms between treated and untreated groups using the fully specified model. Consistent with our previous finding, financial officers and auditors reminded of their disclosure responsibilities are significantly less likely to respond to our requests than those who do not receive such messages. However, when we disaggregate cooperative responses, we do not find significant treatment effects on the log-likelihood of getting cooperative responses. Nor does our treatment impact the chance of getting non-cooperative responses.Footnote 71 This suggests that non-responses primarily drive the negative treatment effects in Tables 4 and 5.
Difference in log-odds ratio between treated and control groups from multinomial logistic regression.

To address the concern of non-linear relationship between our treatment and local partisanship affiliation, we report multinomial regressions interacting with the treatment and local partisanship in Appendix Table A6. The interaction term is insignificant across all specifications, consistent with the Model (3) in Tables 4 and 5. This suggests that political reactions due to partisanship differences are unlikely to motivate the local government’s response to our request for tax abatement disclosure.
Conclusion
Our experimental approach examines non-compliance with a major economic development transparency initiative in the United States. Contrary to our theoretical expectations, entities that were treated with a reminder of their obligation to provide tax-abatement disclosures and with a prompt that researchers have the ability to cross-check these disclosures were more likely to be met with silence than data relative to the control group, at least in some models. At the very least, we find no support that our requests increased transparency of economic development.
Our results provide interesting insights into other literature on transparency, including studies of FOIA requests. Most useful for our study is Yang et al,Footnote 72 which found that government agencies use three strategies in dealing with information requests: selectivity, bargaining, and avoidance. Selectivity and bargaining pertain to reducing the scope of information provided to requesters, but in our case, GASB 77, the exact nature of these disclosures is already codified by GASB. We find limited evidence of avoidance. When primed with their legal obligations, some respondents appeared less likely to respond to our information request, at least in some model specifications.
As noted in the paper, survey evidence found that many government officials were unfamiliar with their GASB 77 obligations, although financial auditors are certainly aware. One conjecture is that a non-response to academics carries no penalty, and a response for non-complying entities could amount to an admission of guilt. Thus, an avoidance strategy could be a dominant strategy for all agencies providing disclosures.
As it was unanticipated and was not pre-registered in our design, our project cannot directly test the mechanism: why do entities fail to comply with a researcher’s request when prompted about disclosure obligations. Our work, when coupled with existing literature in the field suggests at least one plausible answer. Unlike studies that highlight the complexity of disclosing informationFootnote 73 or different attributes of auditorsFootnote 74 our experiment randomized a simple request for a clarification on existing disclosures. Non-compliance isn’t due to capacity or individual attributes.
Our simple explanation builds on the survey work of Thrall and Jensen’s findingFootnote 75 that GASB 77 compliance isn’t a particularly salient rule for internal financial officers, or elected officials. Our experiment found that respondents simply didn’t respond to email requests (as opposed to offering non-cooperative responses) when reminded of their obligations. The limited attention given to this rule change by the public or elected officials leads us to conclude that avoidance is a strategy used by both auditors and internal financial officers when faced with requests from the public.
These findings suggest limitations of transparency in shaping public policy. Even a major transparency initiative, championed by NGOs, requires reputational consequences for non-compliance due to the limited consequences for non-compliance. One final conjecture is that previous work has documented wide variation in tax abatement disclosures across states with some states close to full compliance.Footnote 76 This suggests that state-level elites, such as state auditors, could play a pivotal role in ensuring compliance with transparency regimes.
Supplementary material
To view supplementary material for this article, please visit https://doi.org/10.1017/bap.2025.8


 Open access