


Introduction
The growth of online higher education has made asynchronous online courses the choice modality within higher education. Students across programs find asynchronous education appealing for the same reasons: self-paced, flexible learning [Reference Robert1]. However, hidden behind the marquee features stoking the popularity of such courses lurk persistent challenges with student engagement that in turn can impact performance [Reference Sun and Kim2, Reference Hoffman, Furutomo, Eichelberger and McKimmy3]. For example, the lack of synchronous communication between instructor and student may contribute to isolation and disengagement [Reference Mladenova, Kalmukov and Valova4]. Insights into possible solutions can be uncovered by mining the data points and leveraging the tools of the Learning Management Systems (LMS) where asynchronous courses are hosted [Reference Wong5]. Tools such as nudges (automated reminders) when a student has or has not met criteria for engagement can substitute for synchronous contact with the instructor. Another tool to encourage early and consistent engagement, a predictor of positive course outcomes [Reference Hoffman, Furutomo, Eichelberger and McKimmy3, Reference Ihantola, Fronza, Mikkonen, Noponen and Hellas6], is use of bottlenecks (enforced deadlines) for course assignments. Bottlenecks are intentionally created periods during a course term where the completion of specific milestones (i.e., quizzes) is mandatory for students to advance further in the course. To investigate the challenges presented by these types of courses in higher education, this study aims to examine the use of behavioral interventions, hereafter referred to as “nudges” and “bottlenecks,” in the asynchronous learning environment to improve student engagement and student performance. Given there are not existing studies in the literature that have assessed potential synergistic impacts of combining multiple behavioral interventions in asynchronous courses, we sought specifically to understand if there are synergistic impacts of nudges and bottlenecks on student engagement, rather than assessing the effects of interventions on engagement alone. We explored potential synergistic effects of nudges and bottlenecks in this study across three courses using intra-course comparison allowing us to also assess the generalizability of this approach in courses with different structures.
Background
Engagement in online education
Student engagement, broadly defined as time and effort invested on educational pursuits, is a plentiful source of research [Reference Ma, Han, Yang and Cheng7, Reference Alqahtani, Badreldin and Alrashed8]. The construct is complex and variable in its definition and detection in online education. Debate regarding this has gone so far as to warrant systematic reviews about different approaches to study student/course engagement across the literature [Reference Kahu9]. Kahu [Reference Kahu9] suggests that “no single research project can possibly examine all facets of this complex construct” (p. 769). Beyond simply defining engagement, previous studies have focused on measuring it via LMS activity data [Reference Soffer and Cohen10], qualitative self-reports, and various quantitative measures [Reference Henrie, Halverson and Graham11].
Numerous studies have examined pathways to improve student engagement, motivated in part by evidence that low grades are typically associated with low participation and engagement [Reference Morris, Finnegan and Wu12]. Suggestions include basic architectural elements such as a modular structure, course orientation, syllabus presentation [Reference Riggs13], and instructor responsiveness in adapting to changing student expectations and enhancing students’ self-belief [Reference Zepke and Leach14]. Despite expansive research, engagement has remained a source of concern for educators as the lack thereof has been proven to impact retention rates [Reference Blumenstein, Liu, Richards, Leichtweis, Stephens, Lodge, Horvath and Corrin15, Reference Lee and Choi16], a sense of connectedness [Reference Stuart, O’Donnell, Scott, O’Donnell, Lund and Barber17], achievement, isolation, and self-regulation [Reference Dewan, Murshed and Lin18]. Accordingly, courses characterized by high levels of student engagement have been extensively studied, with engagement consistently associated with success indicators such as grades and course completion rates. LMS data can afford analysis of course progression, grades, and learner behaviors [Reference Soffer and Cohen10]. Yet few studies [Reference Hoffman, Furutomo, Eichelberger and McKimmy3, Reference Soffer and Cohen10] have used LMS activity data to explore engagement as it corresponds to achievement in online asynchronous courses.
Engagement in online learning extends beyond observable behaviors. The foundational educational experience model of Community of Inquiry framework conceptualizes meaningful educational experience as the intersection of cognitive presence (construction of meaning through sustained reflection and discourse), social presence, and teaching presence [Reference Garrison, Anderson and Archer19]. From this perspective, LMS activity metrics (e.g., logins, clicks, tool use) reflect behavioral engagement but do not directly capture cognitive engagement or depth of learning.
In this study, we operationalize engagement using LMS activity data as observable indicators of participation and course progression in asynchronous graduate biomedical courses. While these measures do not assess cognitive presence directly, they provide scalable, system-level indicators of students’ time-based engagement patterns and allow evaluation of intervention effects across multiple courses.
Deadlines
Online asynchronous courses are widely used in higher education and differ structurally from synchronous formats. Appealing features, such as self-paced and flexible learning, come into conflict with the structure of the system, causing more procrastination compared to synchronous courses [Reference Sun and Kim2]. Procrastination has a negative relationship with participation and performance [Reference Michinov, Brunot, Le Bohec, Juhel and Delaval20, Reference Levy and Ramim21]. Consistent access of course materials, assignment submission, and attendance over the duration of a course improves achievement compared to irregularities in these academic behaviors [Reference You22]. Students are also more likely to procrastinate on higher-level tasks (exams) versus lower-level tasks (quizzes) [Reference Sun and Kim2].
Academic calendars have fixed start/stop dates, which make management of bottlenecks an important area of research for reducing student procrastination. Enforced bottlenecks of practice assignments, as opposed to flexible completion timelines, can have a positive impact on assessments later [Reference Miller, Asarta and Schmidt23]. Advancements in LMS data activity logs have allowed researchers to further parse out the impact of procrastination and bottlenecks in asynchronous courses. Using date of first post and date of registration, McElroy & Lubbock [Reference McElroy and Lubich24] found that students who registered earlier and posted on the discussion board during the first days of class performed better overall in the course. Various studies of Massive Online Open Courses (MOOCs) with large data sets found that courses with fixed schedules had higher retention rates than self-paced courses [Reference Ihantola, Fronza, Mikkonen, Noponen and Hellas6, Reference Nesterko, Seaton and Reich25]. Indications in the literature point toward leveraging deadlines and LMS activity data more effectively to reduce procrastination.
Nudging in online education
To establish and sustain engagement in online education, instructors and course designers adopted the sociological concept of “nudging.” First described in the widely read text Nudge: Improving Decisions about Health, Wealth, and Happiness [Reference Thaler and Sunstein26], authors argue that designers (architects) of choices find avenues to nudge a person into making a better choice. As noted in their analysis of Nudge, Selinger and Whyte [Reference Selinger and Whyte27] point out that nudges must preserve choices and provide the example of shrinking plate sizes to nudge diners to consume less food. The non-exploitative nature of nudging made its implementation into educational design to engage students both wide and reaching.
A recent review of 10 studies on applying nudges to education outcomes found a positive effect with mixed results in application across various educational situations [Reference Lim and Lee28]. As a result of the potential positive effects of nudging, Weijers et al. [Reference Weijers, de Koning and Paas29] developed a nudge matrix to help guide educators in their use. Another review of nudge application in education found positive effects on decision-making and motivation in some contexts [Reference Damgaard and Nielsen30]. Results on the impact of nudges in online education have been mixed, but some studies show an increase of engagement if the nudges were personalized as reported in qualitative student survey data [Reference Graham, Toon, Wynn-Williams and Beatson31, Reference Lawrence, Brown and Redmond32].
Adoption of nudging in education has taken on various forms such as automated emails [Reference Motz, Mallon and Quick33, Reference Nikolayeva, Yessad, Laforge, Luengo, Alario-Hoyos, Rodriguez-Triana and Scheffel34], text messages [Reference Lai, Jong, Hsia and Lin35], or written prompts to encourage questions [Reference Weijers, de Koning, Scholten, Wong and Paas36] and include different levels of personalization [Reference Graham, Toon, Wynn-Williams and Beatson31]. Recorded lectures, the foundation of most online courses, were viewed with greater frequency when students were nudged [Reference OldenBeek, Winkler, Buhl-Wiggers and Hardt37]. A reduction in missed assignments, increased adherence to instructions, and higher grades have also been the result of nudging [Reference Motz, Mallon and Quick33]. Multiple studies have found the first nudge to have the greatest impact as too many reminders quickly turned nudges into nags [Reference Lawrence, Brown and Redmond32, Reference Brown, Basson, Axelsen, Redmond and Lawrence38, Reference Brown, Lawrence and Axelsen39]. Nags, or nudge fatigue, can be minimized by nudge design that hits the mark with what, when, and who to nudge [Reference Lawrence, Brown and Redmond32, Reference Brown, Basson, Axelsen, Redmond and Lawrence38]. Qualitative student responses indicate early nudges to be helpful [Reference Lawrence, Brown, Redmond and Basson40]. Further evidence of nudging effects indicates reduced dropout rates as nudges are designed to encourage (but not force) the student to make a better choice to engage with the course materials [Reference Rodriguez, Guerrero-Roldán, Baneres and Karadeniz41].
Although studies differed in scope and approach, the themes of simple, targeted, and personalized nudges impacted student engagement via LMS activity data and qualitative feedback [Reference Piotrkowicz, Dimitrova, Hallam and Price42]. Evidence further indicates that nudges positively impact study timing and duration, two key indicators in knowledge acquisition [Reference OConnell and Lang43]. This study expands on prior research by implementing nudges through automated LMS emails and analyzing their effect on student engagement and performance using LMS data. We accomplished this by analyzing student behavior using the LMS in three different courses in three academic quarters. Our primary outcomes were course engagement, changes in course tool usage, and time to quiz completion. We proposed to measure outcomes by assessing the impact of deadlines and nudges within the context of three graduate courses in biomedical science.
Methods
Intervention structure and academic courses
To study how bottlenecks and bottleneck + nudge interventions synergistically changed student engagement in the asynchronous learning environment, we utilized student course data from the LMS. We assessed three different courses within Clinical and Translational Science. The courses had several common features: academic term length, type of student, content presentation via recorded lectures, assessment quantity and length, and a common course format within the LMS (see Supplemental Figure 1). For each of three academic quarters, each served as one cohort including all three courses. The first cohort was the control, where no interventions were applied and the courses progressed as normal. The second cohort had a bottleneck halfway through the course which required students to complete approximately half of course assignments prior to a date published in the course syllabus (referred to as “bottleneck without nudges” or “bottleneck alone”). Assignments not completed prior to the bottleneck date would receive a zero. The third cohort received automated reminders or nudges to complete course assignments in addition to the bottleneck experienced by the second group (referred to as “bottleneck with nudges”). The timing and structure of the nudges was informed in part by the application of a nudge matrix by Weijers et al. as a “Transparent Type 2 nudge” in which the goal of the nudge is clear [Reference Weijers, de Koning and Paas29]. Nudges were personalized to the student using the LMS-embedded feature of an e-mail greeting using replace strings (e.g. {FirstName}), which automatically substitutes specific user details. Interventional timepoints for the study among courses are visualized in Figure 1. One course in the study (hereafter referred to as Course 1) was focused on the regulatory aspects of clinical research, the second course (Course 2) focused on academic publishing, and the third course (Course 3) was an introduction to graduate-level clinical epidemiology. We utilized these three courses and limited statistical analysis to intra-course differences between study arms (i.e., intervention types); this modality allowed us to assess the effects of single and dual interventions across multiple course types and assess the generalizability of effects observed.
Study Timeline for all courses displaying the weeks of the course. Study timeline shows where nudges occurred (in the bottleneck + nudges group) and where the bottleneck occurred (in the bottleneck without and with nudges groups) relative to course start and end. Each rectangle represents 1 week in the course schedule. (Created in BioRender. Di Florio, D. (2026) https://BioRender.com/x4vs32e).

Figure 1. Long description
A horizontal timeline represents a course divided into weekly segments (small ovals). Labels indicate “course start” on the left and “course end” on the right. Several arrows point to specific weeks labeled “nudge,” and one is labeled “bottleneck,” marking an intervention point intended to influence student behavior.
Within an LMS, there are numerous tools that students can use to access learning materials. Tools assessed for this analysis were course content (access to the main course content page of the LMS), grades, homepages (access to the landing page of the LMS with course-specific announcements, calendar, and contact information), manage files (access to embedded files such as lecture transcripts or readings, for Course 1 only), quizzes, assignments, and external learning tools (e-learning modules housed outside the LMS for course 3 only). The LMS tracks the number of clicks, as a measure of interaction, for each of these categories. We estimated the percentage of time spent in each category by dividing the number of clicks in a course tool divided by the total number of clicks. The use of the word “significant” in this manuscript solely refers to statistical significance (i.e., where p-values are <0.05).
Study participants and ethical considerations
Participants in the study were comprised of a variety of learners at a medical research institution, specifically enrolled in courses in Clinical and Translational Science. The learners included persons pursuing an institution certificate, course collection enrollees (learners enrolled in one to three courses) employees or non-employees pursuing a master‘s degree, medical doctors pursuing a master‘s degree, medical-scientist students (pursuing a dual MD-PhD or MD-MS), non-degree candidates in other institutional programs, and graduate students pursuing a PhD in biomedical sciences. The learners comprising the study and their academic pursuits/designations are summarized in Supplemental Table 1. Research for this study was exempt from Institutional Review Board (IRB) review (Institutional IRB exemption number 3-002753), data was de-identified prior to analysis and all data was stored on a secure internal institutional server with access limited to the study team directly using the data. Groups of students were randomly assigned on a rolling basis (quarter over quarter) therefore we were unable to obtain equal group numbers, even within a course, from quarter to quarter. None of the interventions affected assignment grading and only forced a completion deadline for ½ of course material ½ way through the course (in bottleneck interventions); this was done because many students in asynchronous courses wait until the last week of class to complete the course materials/assignments.
Statistical analysis
To visualize and assess daily course access across cohorts, we synched plots to start on the first Monday of each course. To assess daily student access not synced by course date, we calculated the percentage of students in the course that access the course each day of the course; this data was analyzed using 1-way ANOVA with Dunnett‘s test for multiple post-hoc comparisons. Interruptions to student access might be modulated depending on confounding factors such as holidays (national and international) which are detailed in Figure 2. The mean (shown in violin plots) for hits per day represents the average rate of course access per student within each course and treatment group (i.e. ± interventions). Each individual data point represents the number of course access events by a given student within the duration of the observation period and normalized on a per day basis within the observation period, yielding a student-level access rate. Hits per day of the course portal/LMS was compared between treatment groups using quasi-Poisson regression models to assess temporal changes in student course access within 1 day of interventions. For Course 1, since the nudge and bottleneck occurred on the same day in the nudges + bottleneck group, a period of time between the nudge and bottleneck did not exist and hits/day was not able to be calculated; we therefore only used the model to assess hits/day after the third nudge in this group. Given the nature of the data describing tool access, no statistical analysis was performed; however, we determined the percentage of student clicks in each category compared to total clicks throughout the entirety of the course. Grades were compared with 1-way ANOVA with Dunnett‘s test for post-hoc multiple comparisons.
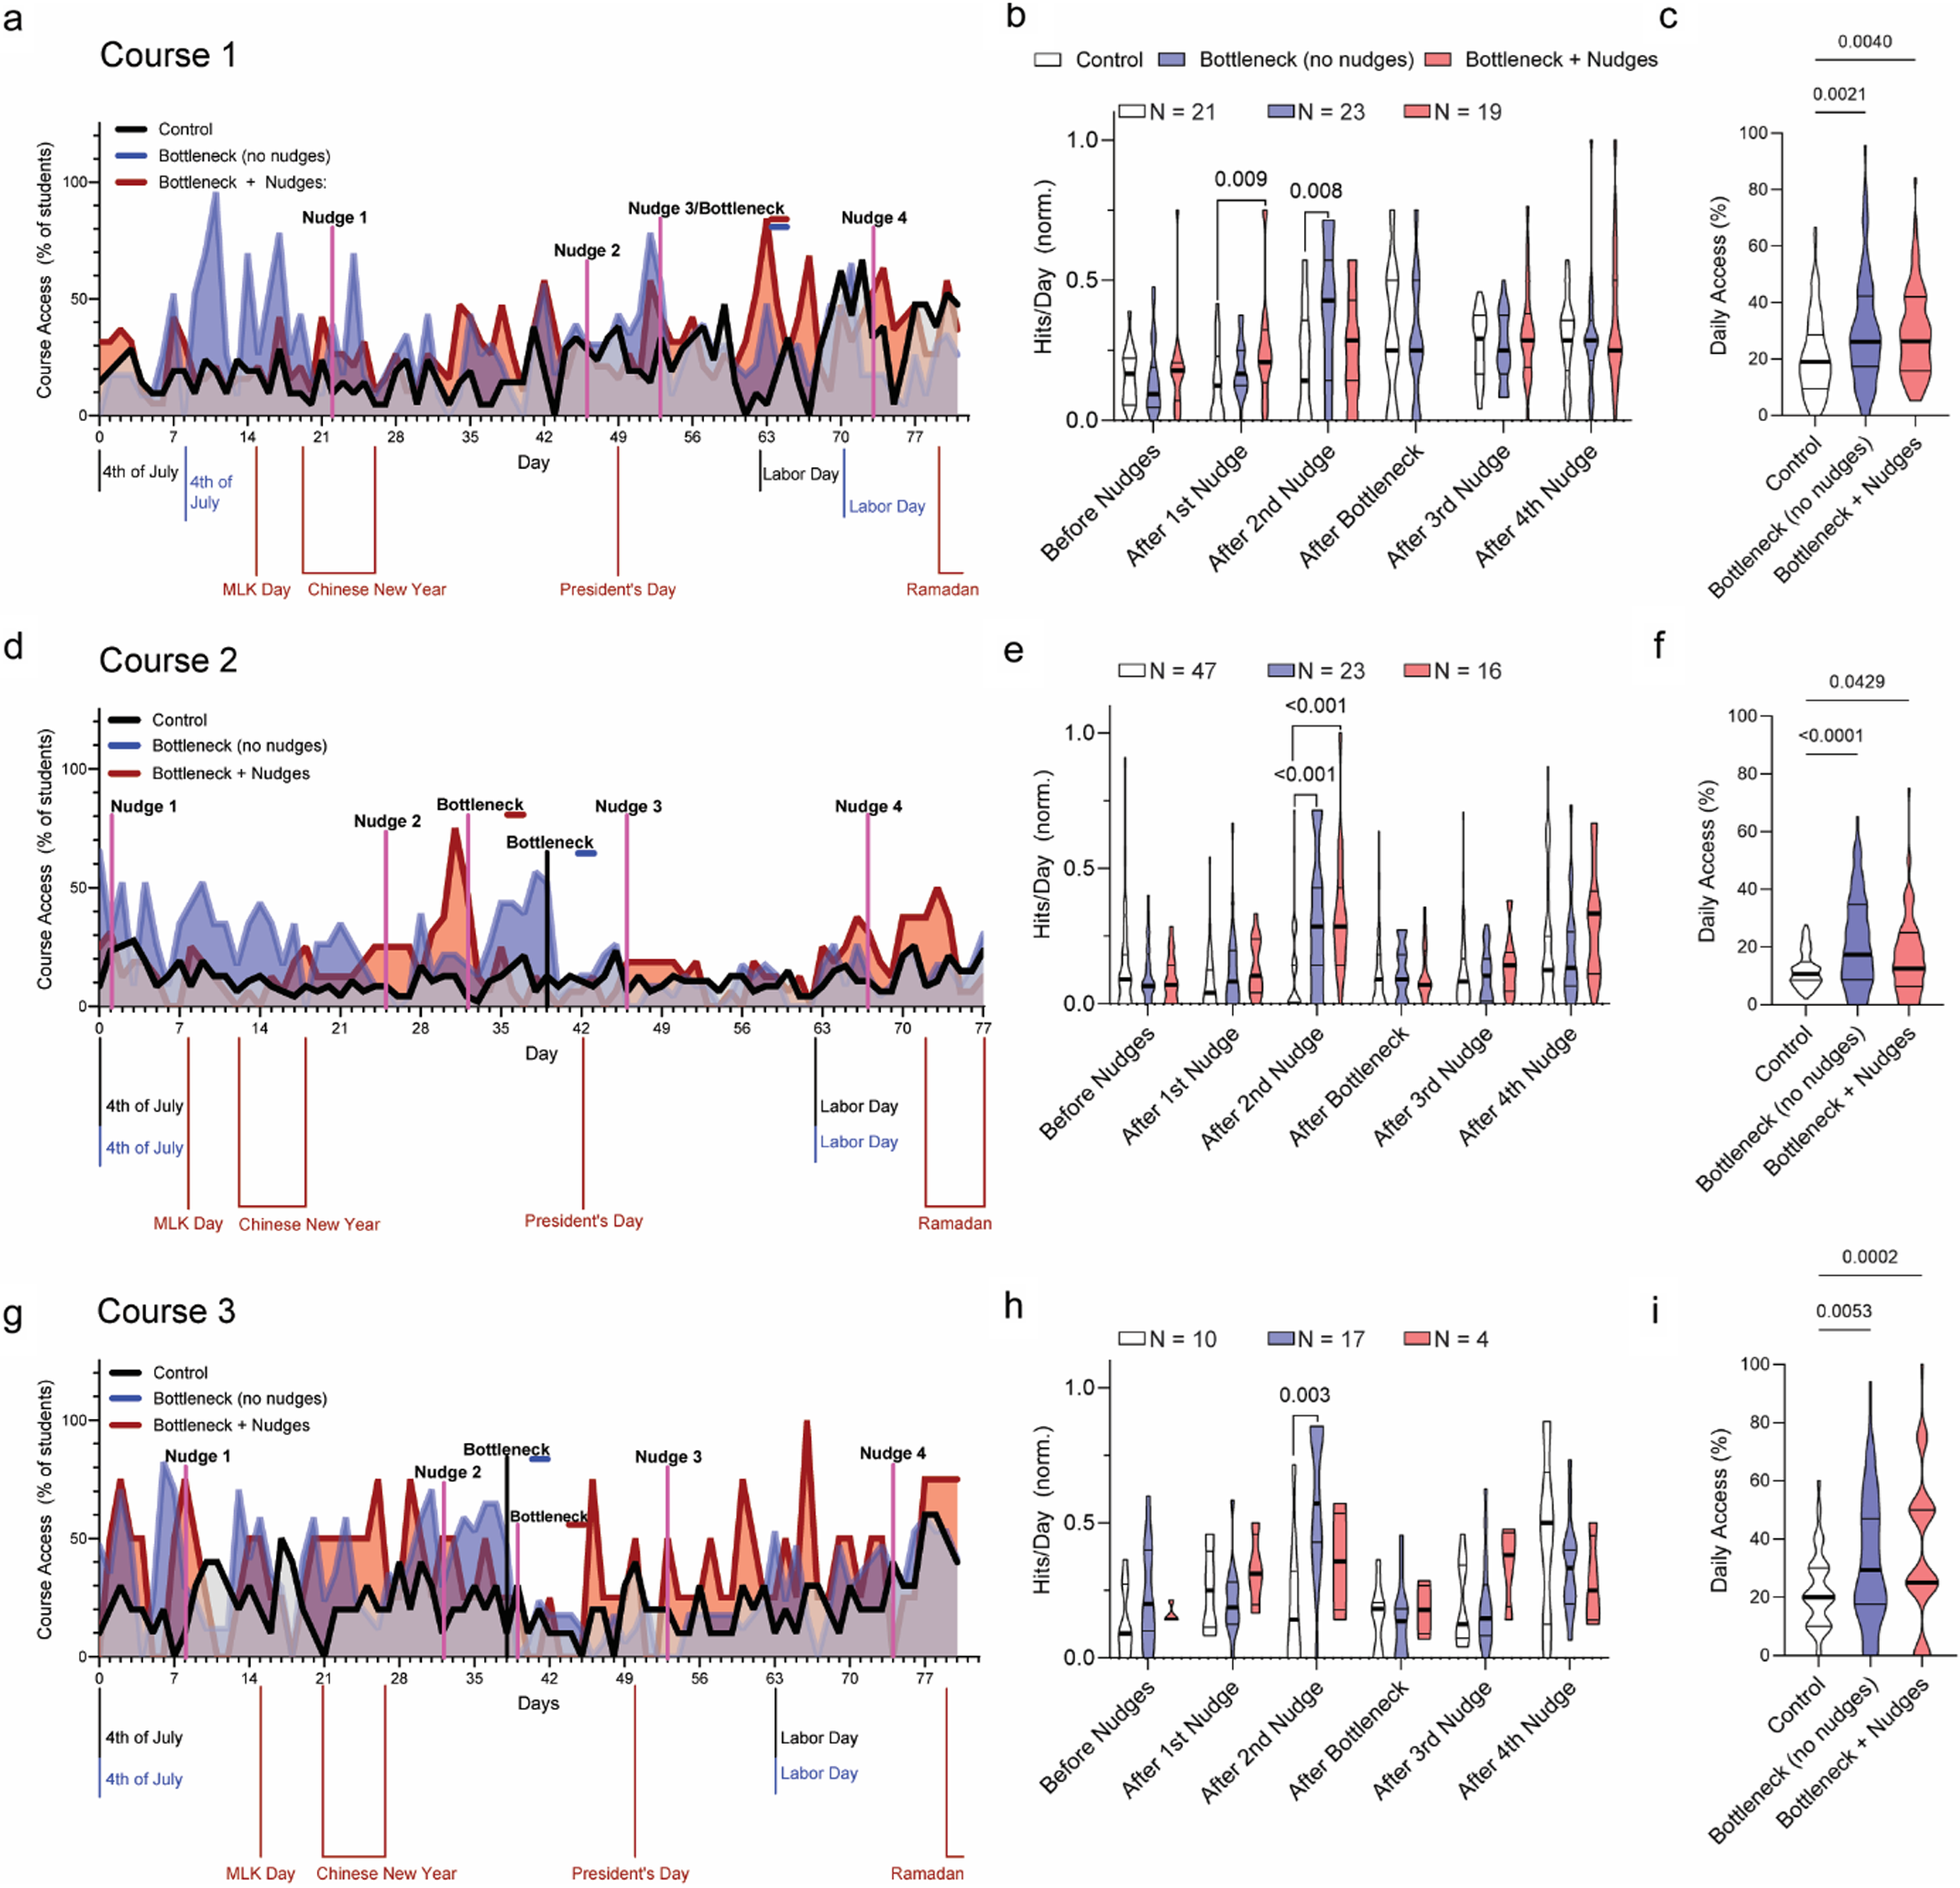
Course Access for all Courses. (a, d, and g) Course access by synchronized relative dates in course comparing control (black and transparent white/gray) bottleneck (blue) and bottleneck + nudges (red) (81 days for all groups in Course 1, 77 days for Course 2, and 80 days for Course 3). (b, e, and h) Hits per day models for Courses 1–3 (N/group are overlaid on these graphs). (c, f, and i) Course access across total days in each course for Course 1 (control = 85 days, bottleneck = 92 days, and bottleneck + nudges = 88 days), Course 2 (control = 82 days, bottleneck = 87 days, and bottleneck + nudges = 84 days), and Course 3 (control = 85 days, bottleneck = 84 days, and bottleneck + nudges = 88 days).

Figure 2. Long description
Multi-panel figure (a–i) showing course access over time and distributions of engagement across three courses under control, bottleneck, and bottleneck plus nudges conditions. Time-series plots show access trends with marked nudges and holidays; violin/box plots compare daily access and variability across intervention stages. Sample sizes vary by panel.
For each separate quiz in each course, the average time to quiz completion (days from course start date) was compared between groups using Kruskal–Wallis tests comparing the groups for completion times at each quiz (overall 3 group comparison and pairwise with the control). Additionally, we fit a linear mixed-effects model for each course that includes a random intercept and random quiz number slope for each student, with fixed effect terms for group (control vs bottleneck) vs (nudge + bottleneck), bottleneck period (before vs after the bottleneck), and quiz number, and two-way interactions between group and bottleneck period, between group and quiz number, and between bottleneck period and quiz number, and a 3-way interaction between group, bottleneck period, and quiz number. Such models allow dependence between completion times from the same student and allow the quiz number slopes to depend on group and the bottleneck period. This allows a comparison of the slope changes (Δ slope) pre-vs post-bottleneck, as well as the difference in slope changes between groups (ΔΔ slope). Across all statistical analyses, we performed multiple test corrections and report corrected p-values, where p < 0.05 after adjustment was considered significant.
Results
Course access is increased among educational interventions compared to control
We observed increases in daily course access in intervention groups for all courses (Figure 2(a–c)) and notably increased engagement during the first half of the course in both intervention groups using data synced by course dates. To determine the impact of nudges and bottlenecks on temporal course access following interventions (i.e., course access within a 24-hour period of intervention), we utilized Poisson regression. Hits per day models revealed variable responses in either intervention group compared to respective controls. Significant increases in hits per day (the average rate of course access events per student within each course and treatment group within the denoted time period on a daily basis) occurred after the first or second nudge periods across all courses (Figure 2(b, e, and h)) with variation across courses in terms of which intervention (bottleneck without nudges or bottleneck + nudges) caused increased hits per day (models and analysis in Supplemental Tables 2-4 for Courses 1–3). In Course 1, the first and second nudge timepoints results in higher course access in the bottleneck + nudges group (p = 0.009) and the bottleneck without nudges group (p = 0.008), respectively (Figure 2(b)). In Course 2, there was increased course access following the second nudge in both bottleneck + nudges (p < 0.001) and bottleneck without nudges (p < 0.001) vs the control (Figure 2(e)). And in Course 3, there was an increase in course access following the second nudge timepoint in the bottleneck group only (p = 0.003) (Figure 2(h)). Given the low sample size for the bottleneck + nudges group in Course 3, we were underpowered to observe significant increases at the second nudge timepoint but did observe an increase in hits/day from baseline (Figure 2(h)). We also noted that course access tended to increase in all groups across courses towards the end of the term, suggesting temporal effects of interventions on course access primarily drive increased engagement prior to the bottleneck period (Figure 2(a, d, and g)).
To determine the overall effect of interventions on course access, we assessed daily course access over the entirety of the course. In Course 1, we saw a significant increase in daily course access (ANOVA p = 0.001) throughout the entirety of the course in the bottleneck group from 21.3% to 29.6% (p = 0.002); subsequently, course access in the bottleneck + nudges group increased to 29.2% (p = 0.004) (Figure 2(c)). For Course 2, average daily course access was also increased (ANOVA p < 0.0001). In the control group we observed 12.1% daily course access compared to bottleneck group which was 21.5% (p < 0.0001) and bottleneck + nudges was 16.5% (p = 0.043) (Figure 2(f)). In Course 3, we observed an increase in daily course access (ANOVA p = 0.0002) of controls at 22.6% to 31.5% in bottleneck alone (p = 0.005) and 33.8% daily course access in the bottleneck + nudges (p = 0.0002) (Figure 2(i)). This data suggests that both intervention types can enhance course interaction overall, but detecting temporal effects of interventions on course access, particularly in the earlier timepoints, could be limited by statistically underpowered group sizes.
Tool usage in courses is altered by interventions
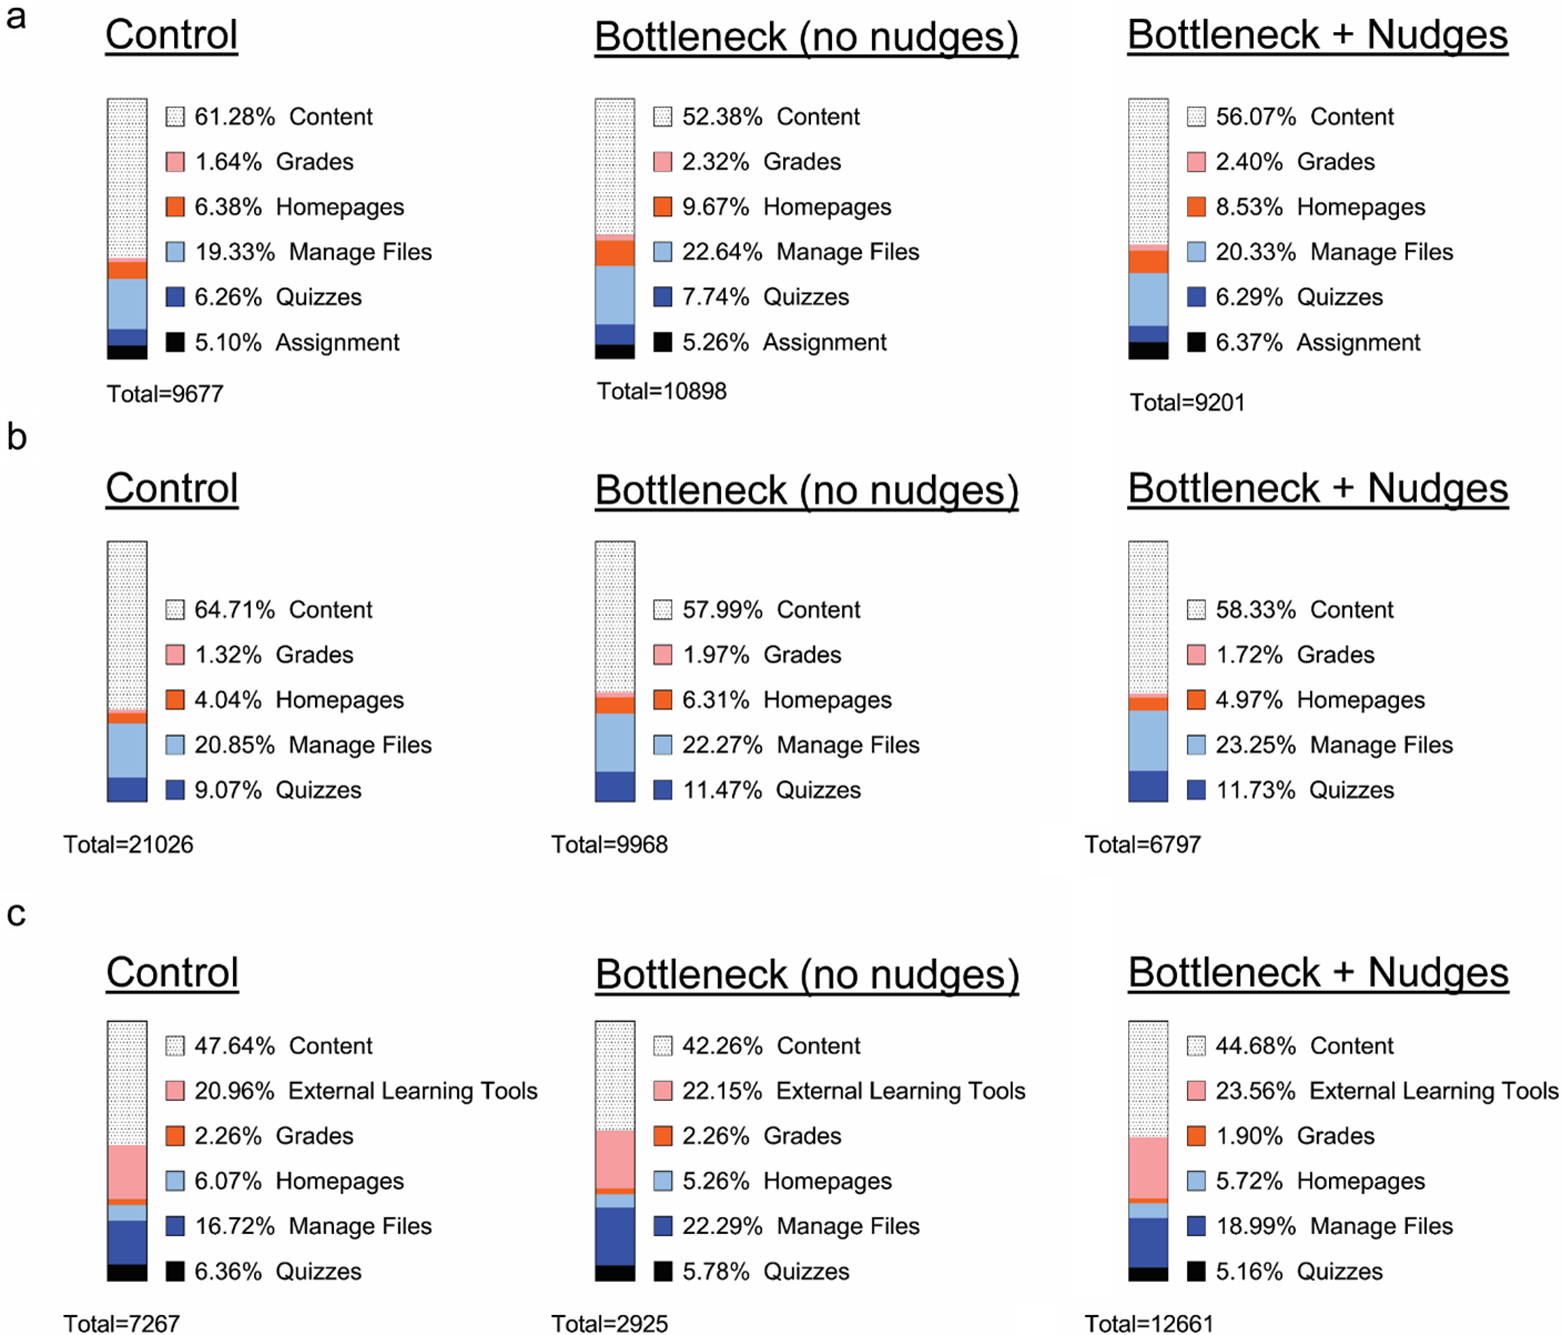
In Course 1, tool usage varied the most for content, homepages, quizzes, and assignments. Course content had the highest percentage of interaction from students and varied depending on interventions. In the control group, 61.3% of course interaction was in content, compared to the bottleneck group at 52.3%, and bottleneck + nudges had 56.1% interaction (Figure 3(a)). Interaction with homepages increased from 6.3% in the control group to 9.7% and 8.6% in the bottleneck and bottleneck + nudges group (Figure 3(a)). Quiz interactions increased in the bottleneck group (7.7%) compared to control (6.3%), but bottleneck + nudges showed little to no variation compared to control at 6.3% (Figure 3(a)). Student interaction with assignments showed a modest increase from controls (5.1%) to bottleneck group (5.3%) and bottleneck + nudges (6.4%) (Figure 3(a)).
Tool Usage Across Courses Compared to Study Arms. Plots showing relative tool usage (%) in different study arms for (a) course 1, (b) course 2, and (c) and course 3.

Figure 3. Long description
Nine stacked bar charts (a–i) show proportions of student interactions by category (e.g., content, grades, quizzes, homepage, assignments) across three experimental groups: control, bottleneck, and bottleneck with nudges. Each chart includes percentage values and totals. The distribution of activity types varies across conditions, indicating shifts in how students engage with course materials. Totals for each panel are listed below each chart.
Like Course 1, we observed the biggest change in access to course content in Course 2 which was 64.7% in the control group, 52.4% in the bottleneck group, and 56.1 in the bottleneck + nudges group (Figure 3(b)). Student access to quizzes was notably increased in the bottleneck without (11.5%) or with nudges (11.7%) compared to control (9.1%) (Figure 3(b)). In Course 3, access to course content was somewhat decreased (control = 47.6%, bottleneck = 42.3%, and bottleneck + nudges = 44.5%), but not as much as in Course 1 and 2. Students in the Course 3 control group accessed external learning tools at 21.0% compared to bottleneck without (22.2%) and with nudges (23.6%) showing an increase in access to external tools among the intervention groups (Figure 3(c)). No other changes to course tools were notable to the study team but can be found in Figure 3(c). The data shows that interventions affect access to course tools to some extent, but how much it changes and for which tools/categories fluctuate across courses and groups to a significant degree cannot be determined with this dataset.
Changes in student course grades in response to educational interventions
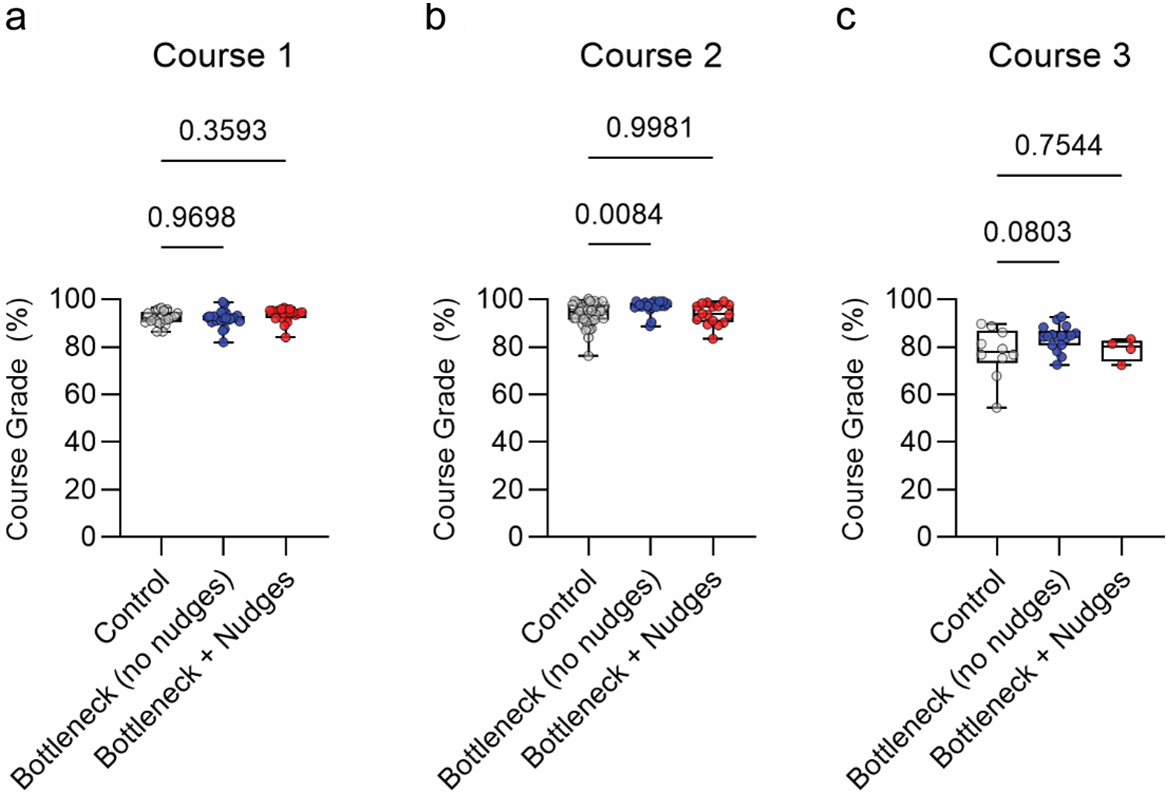
The results of previous studies suggest that increasing student engagement in courses leads to an increase in student grades. We assessed overall grades in the three courses comparing bottleneck without and with nudges compared to the no-intervention control group. We hypothesize that intervention groups would have improved or increased grades compared to control. In course 1, we observed no significant changes (ANOVA p = 0.148) between average grades of control (92.1%), bottleneck without nudges (92.0%) or bottleneck with nudges (93.4%) (Figure 4(a)). In course 2, we saw significant differences (ANOVA p = 0.011) between the control (93.8%) and bottleneck without nudges (96.98%; p = 0.008) but no difference between control and bottleneck with nudges (93.7%) (Figure 4(b)). And in course 3, there was not significant differences (ANOVA p = 0.09) between control (77.6%), bottleneck without nudges (83.8%) or bottleneck with nudges (79.0%) (Figure 4(c)). These data suggest that differences in course design may impact the effectiveness of bottleneck and nudge intervention on student grades; however, this result may be confounded by factors such as the course level (introductory courses) and the student population (which is made up of persons primarily pursuing graduate degrees and these students are all generally high achievers academically).
Overall Course Grades. (a) for course 1, (b) course 2, and (c) and course 3 among control vs bottleneck without and with interventions. Abbreviations: C, control group (no intervention), B, bottleneck group (without nudges), B + N, bottleneck and nudges.

Figure 4. Long description
Three panels (a–c) show boxplots of completion rates (%) for Courses 1, 2, and 3. Each compares three groups: control, bottleneck (no nudges), and bottleneck plus nudges. Data points and distributions are shown with medians and variability. P-values are displayed above comparisons, indicating statistical significance varies by course, with some differences between intervention groups.
Reduction in time to quiz completion by interventions varies depending on course
Quiz-level data plots comparing time to quiz completion for intervention groups vs controls are displayed in Supplemental Figure 2. These data showed that time to quiz completion was reduced in intervention groups, but the effect size and which interventions provided for reduced time to quiz completion varied by course; this basic assessment suggested that interventions lead to shorter time to quiz completion but did not account for the effects of the bottleneck. For a more rigorous statistical assessment that accounted for the bottlenecks, we fit a linear mixed-effects model for each course. The model-estimated differences in time to quiz completion slope within each group for each course (Δ slope; pre-minus post-bottleneck period) and differences between groups in Δ slope for each course (Δ Δ slope) before and after the bottleneck (Supplemental Table Sets 5–7). We compared the change in slope pre-and post-bottleneck between control, bottleneck, and nudges + bottleneck groups by deriving Δ Δ slope (Figure 5).
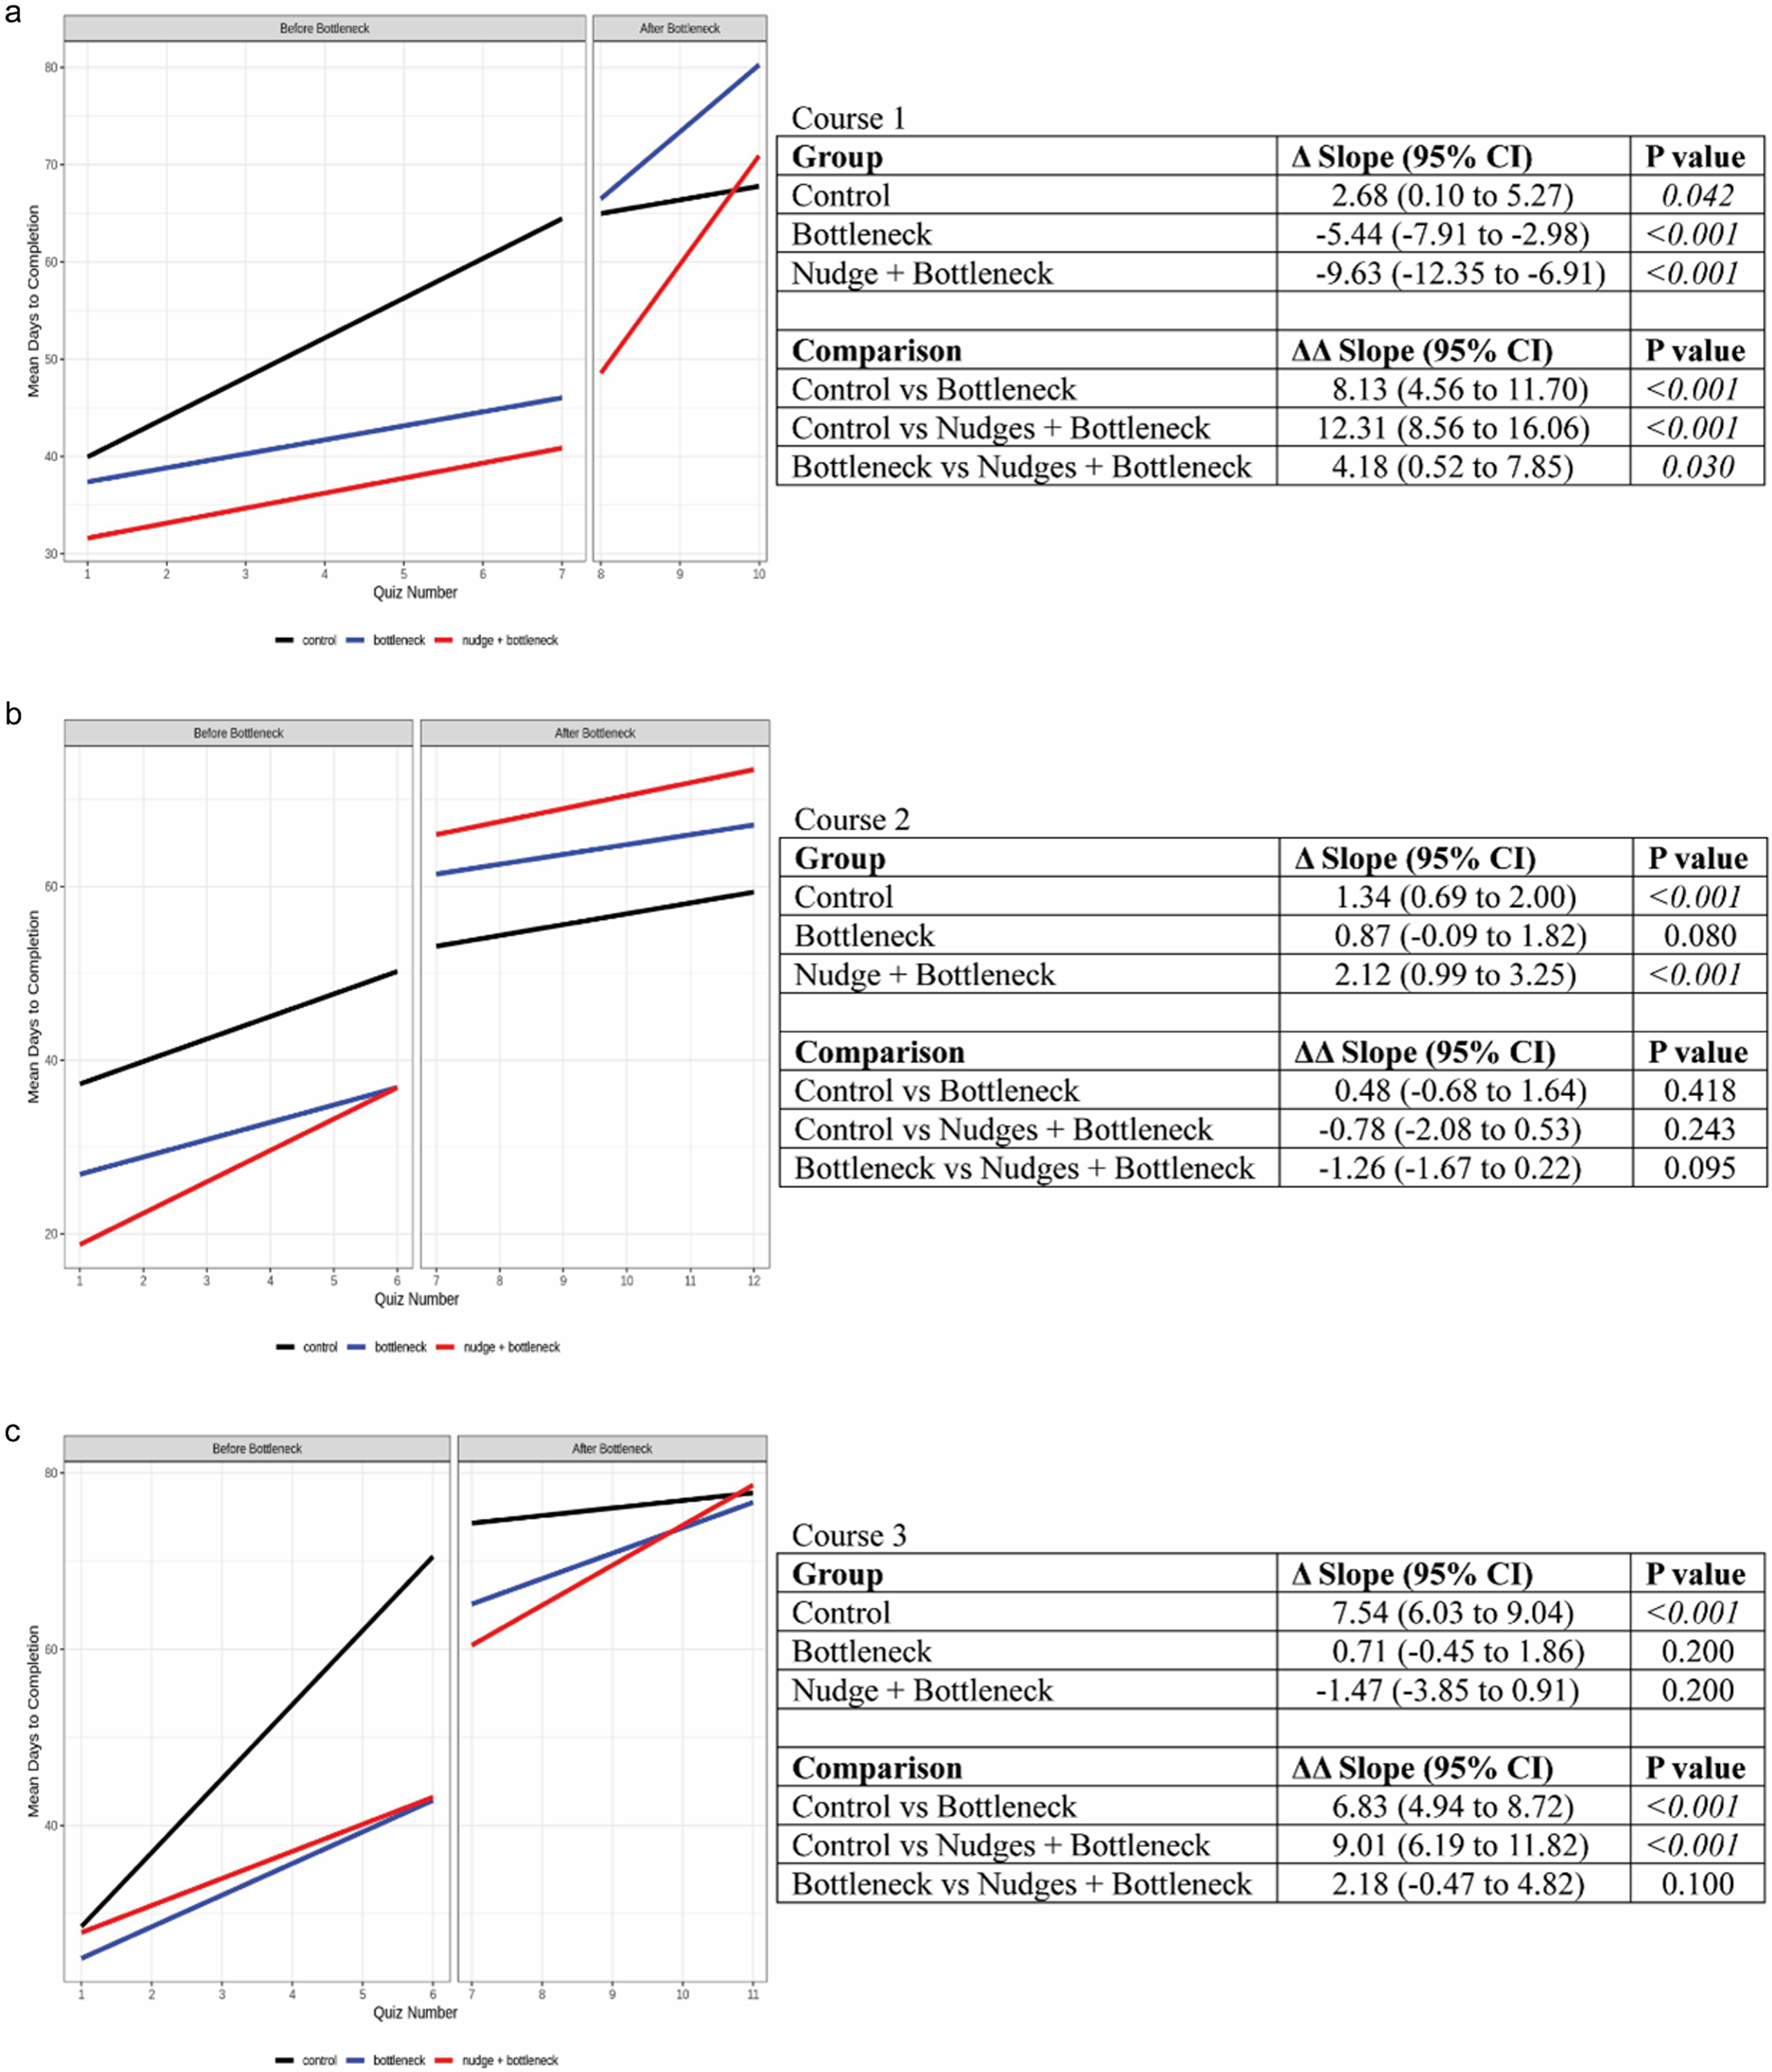
Time to quiz completion for all Courses. Linear slope models (left) are displayed along with data tables (right) showing Δ slope, Δ Δ slope, and 95% confidence intervals (95% CI) in (a) course 1, (b) course 2, and (c) course 3.

Figure 5. Long description
The table reports changes in slope (Δ slope with 95% confidence intervals and p-values) for three groups–control, bottleneck, and bottleneck plus nudges–across Courses 1–3. Additional rows compare differences between groups (ΔΔ slope). Nearby line graphs illustrate engagement trends over time for each condition. In Course 1, slopes decline with interventions; Course 2 shows small increases; Course 3 shows strong control growth but weaker or negative intervention trends. Several comparisons are statistically significant (p < 0.05).
In Course 1, the slope significantly decreased (p = 0.04) after the bottleneck in controls, significantly increased after the bottleneck in the bottleneck group (p < 0.001) and significantly increased after the bottleneck in the nudges + bottleneck group (p < 0.001) (Figure 5(a)). The change in slope (pre-to post-bottleneck) was significantly larger in the bottleneck group compared to controls (p < 0.001), significantly larger in the nudges + bottleneck group compared to controls (p < 0.001), and significantly larger in the nudges + bottleneck group compared to the bottleneck group (p = 0.03) (Figure 5(a)).
In Course 2, the slope significantly decreased after the bottleneck in controls (p < 0.001), did not significantly change after the bottleneck in the bottleneck group (p = 0.08), and significantly decreased after the bottleneck in the nudges + bottleneck group (p < 0.001) (Figure 5(b)). The change in slope (pre-to post-bottleneck) was not significantly different between the 3 groups (Figure 5(b)).
In Course 3, the slope significantly decreased after the bottleneck in controls (p < 0.001), did not significantly change after the bottleneck in the bottleneck group (p = 0.2), and did not significantly change after the bottleneck in the nudges + bottleneck group (p = 0.2) (Figure 5(c)). The change in slope (pre-to post-bottleneck) was significantly larger in both the bottleneck (p < 0.001) and nudges + bottleneck (p < 0.001) groups compared to controls. However, the change in slope was similar between the nudges + bottleneck and bottleneck groups and was not significantly different (p = 0.1) (Figure 5(c)). This data suggests that the effect of adding a bottleneck or nudges on time to quiz completion generally reduces time to quiz completion, but the effect size or whether the effect significantly impacts student time to quiz completion varies by course.
Discussion
This study compared the outcomes of three asynchronous courses utilizing two interventions with a control group over three academic quarters with the purpose of increasing student engagement in each course. Bottlenecks, enforced deadline(s) in which approximately half the course assessments were due, were deployed as a single intervention for the three courses. The goal of bottleneck implementation was to increase engagement prior to the enforced deadline. Nudges, automated reminders to encourage students to log in and complete course work, were deployed with the bottleneck in another group (Figure 1) to study the impact of a second intervention on sustained engagement. The two intervention groups (bottlenecks only and bottleneck + nudges) were compared against the control group with no interventions. Results were mixed as we saw an increase in course access across all three courses and both intervention groups, alteration of tool usage varying amongst the courses and intervention groups, and reduction in time to quiz completion for one course but mixed results in the others. The mixed results of the interventions align with evidence from the literature on student engagement, deadlines, and nudging in online education and may also be reflective of differences in intervention outcomes among courses with heterogeneity in course demands.
The control group for this study demonstrates the tendency of students to procrastinate when no bottlenecks or nudges are provided (Figures 2 and 5). Previous studies have shown that early and consistent engagement predicts higher grades within a course [Reference Hoffman, Furutomo, Eichelberger and McKimmy3]. The results in our intervention groups indicate the potential to influence student engagement. Understanding student engagement in the context of asynchronous online courses is essential to improving student learning and outcomes. Student engagement was assessed in this study by measuring daily course access, course tool usage, time to quiz completion, and grades. The overarching hypothesis was that interventions would increase student engagement amongst the three asynchronous courses. In reviewing LMS course access data, we found that course access increased among all intervention groups compared to respective controls in all courses (Figure 2), thereby supporting the hypothesis that interventions can improve engagement. In examining what students were clicking on once they accessed the course, course tool usage data showed that usage increased for some tools and decreased for others based upon the course (Figure 3) when comparing the intervention groups to the control group. The findings suggest an uptick in engagement; however, quantifying the depth or significance of this engagement poses challenges, echoing the conclusions of prior research [Reference Hoffman, Furutomo, Eichelberger and McKimmy3, Reference Kahu9, Reference Soffer and Cohen10].
Based on our hypothesis that implementing dual interventions would increase engagement, we expected a reduction in time to quiz completion for intervention groups, but the data showed mixed results. Course 1 demonstrated a synergistic benefit of interventions whereas the Course 2 results demonstrated no beneficial effects (Figure 5). In Course 3, both intervention groups showed significant benefit compared to control, but no synergistic effect was observed (Figure 5). Although evidence indicates that procrastination persisted against interventions for many students, others were positively influenced. Our study joins previous studies which have indicated the mixed impact on reducing procrastination [Reference Michinov, Brunot, Le Bohec, Juhel and Delaval20, Reference Miller, Asarta and Schmidt23].
Overall scores in courses were assessed comparing controls to intervention groups. We found an increase in course scores for Course 2 in the bottleneck-only group but found no impact in any other comparison group (Figure 4, ANOVA p = 0.011, pairwise bottleneck vs control p = 0.008). These results seem to show that the interventions utilized do not impact student scores for these courses and therefore score improvement should not be expected as an outcome. Previous studies found that low grades correlate to low engagement rates [Reference Morris, Finnegan and Wu12] but evidence from this study does not align. The courses in this study are all graduate-level introductory courses, and we have historically observed high grades in these courses. It is possible that because grades were already high in these courses that the impact of interventions on student scores was minimal, but previous studies in undergraduate populations suggest that the impact of interventions is greater in terms of effects on course grades [Reference Motz, Mallon and Quick33].
A possible explanation for mixed success in supporting our hypotheses is the concept of nudge fatigue or nag, when overuse tips the scales from encouraging to annoying [Reference Lawrence, Brown and Redmond32, Reference Brown, Basson, Axelsen, Redmond and Lawrence38]; indeed, the method in which behavioral interventions are employed can be of greater importance than the presence of interventions themselves. Students in all groups received regular automated announcements as part of course administration. The dual-intervention group (bottleneck + nudge) received four additional reminders to complete course assignments. Nudge fatigue, in which nudges turn into “nags” may have influenced mixed results in time to quiz completion. As a result, students may have disregarded the nudges reminding them to complete quizzes before the due date. These findings reinforce that nudges are not universally beneficial and must be carefully timed, targeted, and limited in frequency to avoid fatigue.
Our results demonstrate that the bottleneck + nudges approach is the most effective method for improving student engagement, particularly when it comes to increasing course access in asynchronous courses. To improve time to quiz completion, previous studies have shown earlier access is better [Reference Hoffman, Furutomo, Eichelberger and McKimmy3, Reference McElroy and Lubich24]. The evidence from this study shows implementing a bottleneck + nudges is a promising tool. If programming nudges prove to be onerous for educators, the data shows simply providing bottlenecks within asynchronous courses can be a valuable addition that takes minimal time to implement but resulting in a measurable impact on student engagement.
Implications and limitations
This study adds to a small body of research on this topic with rigorous statistical analysis as it measures multiple variables of engagement using LMS data [Reference Hoffman, Furutomo, Eichelberger and McKimmy3, Reference Soffer and Cohen10, Reference Weijers, de Koning, Scholten, Wong and Paas36]. Taken together, the use of research-based evidence to make iterative changes in course design can have an impact on student engagement within asynchronous courses.
Students who procrastinate can have lower grades than those who do not procrastinate [Reference Morris, Finnegan and Wu12]. Data shows the quiz scores of the intervention groups, who were required to complete assignments approximately halfway through the term due to bottlenecks, remained mostly unchanged when compared to controls. The observed results may be influenced by the diverse graduate and postgraduate student population in this study, which includes high-achieving scholars from various backgrounds. In addition, the courses within this study are introductory to this educational program, which may also influence the grade outcomes for a student group who are well-established in higher education environments. Studies comparing our results with those of asynchronous undergraduate students, much less seasoned in higher education, would be an interesting addition to the body of research.
Some features of the data collected and available also limited the study. Despite the semi-quantitative comparison of tool usage across courses (Figure 3), we were unable to determine statistical significance since the LMS did not provide student-level data with respect to tool access. Additionally in Course 3, statistical power was limited by the low number of participants in the control (N = 10) bottleneck + nudges group (N = 4) whereas other groups had greater statistical power with N>15 students/group. We also did not include a single variable control for nudges only; such a control could have provided more specific insights regarding how nudges alone affected the variables assessed within the study.
Another limitation could be the courses and how they are structured as well as timing and communication within the courses (i.e., heterogeneity in course demands). Course 1 has one 2-hour in-person session, but the remainder of the course is asynchronous. This could be a factor in how students within Course 1 were more receptive to interventions than students within Courses 2 and 3. While holidays were identified within the analysis, they were not planned around within the study design. Holidays could be a confounder in showing higher or lower engagement on a specific day than a different quarter that did not have the same holiday. Student engagement has been shown in other studies to decrease over holidays [Reference OldenBeek, Winkler, Buhl-Wiggers and Hardt37], but this wasn‘t observed in this student population perhaps due to the type of institution these students attend.
It is possible that a few of the students were in multiple courses included in the study and therefore experienced nudge fatigue as discussed earlier. This could contribute to greater nudge fatigue and a reduced amount of engagement overall. Students also receive regular course announcements in both control and intervention groups, but these additional communications could contribute to this type of fatigue as well. Students in the dual-intervention group received bottlenecks and nudges but were not formally introduced to their intent, which may have influenced how these nudges were perceived, potentially as monitoring rather than supportive guidance. In future studies, nudge fatigue could be studied in this context and perhaps be reduced by excluding those who have already completed the quizzes from the nudge, thus reducing the number of nudges received.
Conclusions
This study assessed student engagement in online asynchronous courses by assessing daily course access, changes in student tool usage, and time to quiz completion. We found that bottlenecks without and with nudges, as course interventions, increased student engagement and reduced time to quiz completion (under certain education contexts). We did not generally see an increase in student scores as a result of interventions, which may be a result of the student population, course design, purpose of the course or other confounding factors. Overall, this study demonstrates that interventions are an effective and easily implementable tool for increasing student engagement in the online asynchronous learning environment.
Supplementary material
The supplementary material for this article can be found at https://doi.org/10.1017/cts.2026.10752.
Acknowledgements
The authors declare none.
Author contributions
Damian N. Di Florio: Conceptualization, Data curation, Formal analysis, Investigation, Methodology, Project administration, Software, Visualization, Writing-review & editing; Kristina B. Nelson: Conceptualization, Data curation, Project administration, Writing-original draft, Writing-review & editing; Ryan C. Jimison: Conceptualization, Data curation, Project administration, Writing-review & editing; Ross A. Dierkhising: Data curation, Formal analysis, Methodology; Carmen J. Silvano: Resources, Supervision, Writing-review & editing; Felicity T. Enders: Methodology, Resources, Supervision, Writing-review & editing.
Funding statement
This publication was supported by Grant Number UL1 TR002377 from the National Center for Advancing Translational Sciences (NCATS). Its contents are solely the responsibility of the authors and do not necessarily represent the official views of the NIH.
Competing interests
The authors declare none.



 Open access

