

Introduction
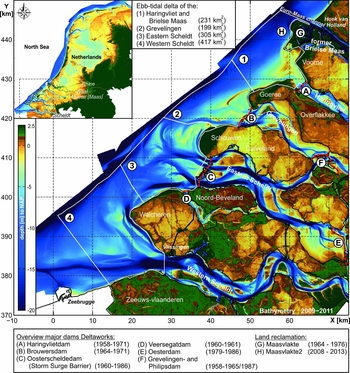
The estuaries in the SW Netherlands, a series of distributaries of the rivers Rhine, Meuse and Scheldt known as the Dutch Delta, have been engineered to a large extent as part of the Delta Project (see, e.g., Fig. 1 and Watson & Finkl, Reference Watson and Finkl1990, Reference Watson and Finkl1992 for an overview; background information is available via Delta Works Online, http://www.deltawerken.com/English/10.html?setlanguage=en). The Delta Project flood protection scheme was developed and executed after the dramatic storm surge disaster of 1 February 1953, that burst the dikes along all the estuaries and caused almost 1800 casualties, drowned tens of thousands of cattle and inflicted enormous economic damage. The project included separation of the respective estuaries with dams and subsequent damming of their seaward sides, in order to improve safety against flooding and to create freshwater basins as a resource for agriculture. Moreover, sluices were planned to be built in the Haringvliet dam in order to regulate the discharge of the rivers Rhine and Meuse in such a way that the freshwater outflow from the Nieuwe Waterweg (New Waterway), the other remaining river outlet, remains fairly constant. This is necessary to prevent saltwater intrusion that would otherwise ruin the extensive horticulture gardens in the neighbouring areas. In the original plans, only the Western Scheldt would remain an open estuary, since it is the entrance to the port of Antwerp. In the 1970s, after completion of the first projects of the programme, deterioration of the water quality in the closed basins became problematic. This triggered adaptation of the original plans. For example, a siphon was constructed in the Brouwersdam to flush the Grevelingen with ‘fresh’ seawater. This connection was completed in 1978. Moreover, opposition rose against the closing off of the Eastern Scheldt, a saltwater tidal basin with very low mud concentrations (due to the absence of a river connection) that supported an extensive and successful commercial shellfish culture. Damming of this basin would cause the disappearance of the valuable inshore tidal ecosystem. Opposition grew to such a level that the plans for damming of the Eastern Scheldt were abandoned and a storm-surge barrier was built in the inlet entrance. The complete or partial damming of the estuaries had an enormous impact on the ebb-tidal deltas: the strong reduction of the cross-shore directed tidal flow triggered a series of morphological changes that continue until today. Additionally, large-scale dredging in the Western Scheldt estuary and the shipping lane Wielingen, the southernmost channel of the ebb-tidal delta, has changed the hydrodynamics and morphology of its ebb-tidal delta.
Overview of the Dutch Delta and the estuaries that form the Voordelta, and major dams constructed as part of the Delta Plan (red dashed lines). The boundaries of the ebb-tidal deltas of the respective estuaries, as discussed in this paper, are indicated with white lines. Depths are given in metres relative to NAP (Normaal Amsterdams Peil), the Dutch ordnance datum which is about present-day mean sea level (MSL). Note that the latter holds for all bathymetric maps in this paper.
The so-called Delta area in the SW Netherlands, with its changing estuaries and rapidly migrating channels and shoals, was an Eldorado for coastal and estuarine geomorphologists. The processes and dynamics of this area in its more or less natural situation were studied for many years, for example by Johan van Veen, who published some of his more general but detailed observations (van Veen, Reference van Veen1950; van Veen et al., Reference van Veen, van der Spek, Stive and Zitman2005). In the course of the Delta Project a huge amount of data on tides, waves, currents, sediment transport, grain-size distributions, subsurface geology, etc. (see, e.g., Oomkens & Terwindt, Reference Oomkens and Terwindt1960; Terwindt et al., Reference Terwindt, Breusers and Svasek1968; Terwindt, Reference Terwindt1971, Reference Terwindt1973; van de Kreeke & Haring, Reference van de Kreeke and Haring1979; Nio et al., Reference Nio, van den Berg, Goesten and Smulders1980; Visser, Reference Visser1980; van den Berg, Reference van den Berg, Nio, Schüttenhelm and van Weering1981, Reference van den Berg1982) has been collected. Moreover, the morphological development of tidal channels, shoals, etc. has been systematically monitored and reported, on an almost (bi-)yearly basis (see Haring, Reference Haring1978, for a summary). The morphodynamic reaction of the ebb-tidal deltas to the decrease in estuarine tidal flow has been studied unsystematically and only for individual locations. The major part of these results has been reported in Dutch. Unfortunately, only a small portion of this extensive dataset has been published in the international literature, especially outside the coastal engineering community. Datasets comprising frequent observations of anthropogenically induced morphodynamic change are scarce. An additional goal of this paper is to ‘disclose’ the existing information that is hidden in this body of reports for an international audience.
This paper aims to give a concise overview of half a century of morphological changes, both for the individual ebb-tidal deltas and the Voordelta as a whole. Moreover, it will present a sediment budget for the area to illustrate these developments. Up till now, the impact of the Delta Project has been described for individual ebb-tidal deltas (see, e.g., Kohsiek, Reference Kohsiek, de Boer, van Gelder and Nio1988; Louters et al., Reference Louters, Mulder, Postma and Hallie1991; Tönis et al., Reference Tönis, Stam and van de Graaff2002; Eelkema et al., Reference Eelkema, Wang and Stive2012). This paper presents the first integral analysis for the complete Voordelta, addressing the morphodynamic interaction of adjacent ebb-tidal deltas. The analysis is based mainly on a digital database of repeated bathymetric surveys executed by Rijkswaterstaat, the water management authority of the Netherlands, covering the period 1964–2012.
Note that in this paper we will use Dutch names for tidal channels, shoals, etc. The majority of these names end with words that are easily recognised and translated: ‘plaat’ = shoal; ‘bol’ = (sand) bar; ‘geul’ = channel; ‘gat’ = channel or creek; ‘diep’ = deep (channel).
Study area
The coast of the SW Netherlands consists of a series of five (former) estuaries, from north to south Brielse Maas, Haringvliet, Grevelingen, Eastern Scheldt and Western Scheldt (see Fig. 1). The Brielse Maas, Haringvliet, Grevelingen and Eastern Scheldt are distributaries of the combined rivers Rhine and Meuse, whereas the Western Scheldt is the lower course of the river Scheldt. Only the Eastern Scheldt and Western Scheldt are still tidal basins, the former by means of a storm-surge barrier. The estuaries are separated by (former) islands that do not show the typical shore-parallel morphologies of barrier islands. Nevertheless, they are bounded on their seaward end by coalescing ebb-tidal deltas. The ebb-tidal deltas form a relatively shallow, up to 10 km wide offshore area that stretches from Hoek van Holland in the north, to below Zeebrugge in Belgium in the south (Fig. 1), an alongshore distance of almost 90 km and a total area of 1155 km2, and is known as the Voordelta (English: Fore Delta). The average depth increases and the surface area of the shallow shoals decreases when going from north to south. The sediments of the inlets and tidal deltas consist of fine to medium sand (Terwindt, Reference Terwindt1973). Since construction of the closure dams, local mud deposits have formed in closed-off channels (Piekhaar & Kort, Reference Piekhaar and Kort1983).
In the Voordelta, waves and tides are the dominant forcing mechanisms. Both vigorous tidal currents and heavy seas, especially during strong winds, create a highly dynamic environment that consists of rapidly shifting, shallow bars and shoals, dissected by both small and large and deep tidal channels. Only the discharge sluices in the Haringvliet dam (maximum capacity 25,000 m3 s−1) can create (temporary) significant density gradients during periods of peak river discharge that might affect the local morphology. The wave climate consists mainly of wind waves locally generated in the shallow North Sea basin. The mean significant wave height is 1.3 m from the west-southwest, with a corresponding mean wave period of 5 s (Roskam, Reference Roskam1988; Wijnberg, Reference Wijnberg1995). During storms, wind-generated waves occasionally reach heights of >6 m and additional water-level surges of >2 m have been measured. The semi-diurnal tide propagates in a northward direction parallel to the coast. The mean tidal range decreases from 3.86 m in Vlissingen (Western Scheldt) to 1.74 m in Hoek van Holland (just north of the Haringvliet).
Earlier work: ebb-tidal delta morphodynamics
Tidal inlets and their associated tidal deltas make up a major part of the world's barrier coastlines. Ebb-tidal deltas, or outer bars as they are called in the engineering literature, form where the sediment-laden ebb current leaves the comparatively narrow tidal inlet and enters the sea/ocean, and as flow segregates, velocities diminish beyond the sediment transport threshold. Hence, the sand is deposited and a shallow distal shoal called a terminal lobe is formed. This process is counterbalanced by waves that impact the shallow shoals and tend to move the sand back to the inlet and bounding shores. Hence, the morphology of the ebb-tidal delta is essentially determined by the relative importance of wave versus tidal energy. Wave-dominated ebb-tidal deltas are pushed close to the inlet throat, while tide-dominated ebb-tidal deltas extend offshore (see, e.g., Hayes, Reference Hayes and Cronin1975, Reference Hayes and Leatherman1979; Oertel, Reference Oertel and Cronin1975; Hubbard et al., Reference Hubbard, Oertel and Nummedal1979). Initially, the occurrence of ebb deltas at tidal inlets was related to meso-tidal ranges (Hayes, Reference Hayes and Cronin1975, Reference Hayes and Leatherman1979), but Davis & Hayes (Reference Davis and Hayes1984) showed that they are found in a wide spectrum of wave-height versus tidal-range combinations. Moreover, there is considerable variation in ebb-tidal delta morphology along stretches of coast where tidal and wave conditions hardly vary. They concluded that it is the relative effect of the tidal processes vs wave processes and not the absolute values that produces the typical ebb-tidal delta geometry and that variation in ebb-tidal delta morphology is better explained by variation in tidal prism (see also Davis, Reference Davis, van der Linden, Cloetingh, Kaasschieter, van de Graaff, Vandenberghe and van der Gun1989).
O'Brien (Reference O'Brien1931, Reference O'Brien1969) and Jarrett (Reference Jarrett1976) established that the cross-sectional size of an inlet is primarily governed by its tidal prism and also, to some extent, the sediment volume supplied by longshore transport. Walton & Adams (Reference Walton and Adams1976) determined outer bar volumes and inlet tidal prisms and cross-sectional areas for 44 inlets from highly, moderately and mildly exposed coasts from around the USA and found that the volume of sand stored in the outer bar and shoals correlates strongly with the tidal prism and the cross-sectional area. Moreover, their correlations show that the volume of material stored in the outer bar decreases with an increase in wave energy.
Hayes (Reference Hayes1980) presents a standard model for ebb-tidal delta morphology that is based on a number of studies along the Atlantic, Gulf and Pacific coasts of the USA: a main ebb channel flanked by channel-margin linear bars and with a terminal lobe at its end. Swash platforms, shallow areas with wave-built swash bars on top, flank the channel at both sides. Marginal flood channels separate the swash platforms from the bounding island coasts. The extent of the ebb-tidal delta and the size and orientation of the constituting elements is determined by the relative magnitudes of tidal and wave energy.
Davis & Hayes (Reference Davis and Hayes1984) and FitzGerald (Reference FitzGerald1996) suggest that wave and tidal processes are useful to describe the gross characteristics of inlet systems, but that there are additional important variables. These variables include geological parameters such as coastal physiography, regional stratigraphy (including bedrock outcrops) and basin geometry, and processes such as sediment supply, river discharge and sea-level changes. This range of additional forcing conditions contributes to a wide diversity in inlet morphologies, both in time and space. Elias & van der Spek (Reference Elias and van der Spek2006) and Elias et al. (Reference Elias, van der Spek, Wang and de Ronde2012) illustrate the large influence of anthropogenic change on the evolution of the ebb-tidal deltas of the Dutch Wadden Sea. The significant decrease in volume of Texel inlet's ebb-tidal delta, despite there being little change in tidal volume after closure of the Zuiderzee, illustrates that engineering works can significantly influence the inlet dynamics and can cause the inlet to develop differently from what would be derived from the generally accepted equilibrium relationships and conceptual inlet models.
The Voordelta
In general, following the classification of Davis & Hayes (Reference Davis and Hayes1984), the inlets of the Voordelta prior to damming would qualify as ranging from mixed-energy wave-dominated in the northern part, to mixed-energy tide-dominated and finally tide-dominated in the Western Scheldt mouth. However, the morphology of the major inlets shows tide-dominated characteristics such as a large ebb-tidal delta and deep channels. These result from large tidal prisms and relatively low wave energy.
Van de Kreeke & Haring (Reference van de Kreeke and Haring1979) give a concise description of the morphological and hydraulic characteristics of the Rhine–Meuse Delta. They present flood- and ebb volumes for the estuary mouths that were deduced from discharge measurements in 1933 and 1959, prior to the construction of the closure dams. Moreover, they established an empirical relationship between the cross-sectional area and measured flow characteristics at the mouth of the various estuaries in this area, in order to predict scour and shoaling associated with the various man-made modifications. They conclude that for the estuary mouths the maximum tidal velocity is constant: it equals 0.85 m s−1 for average tide conditions. For the estuaries with freshwater inflow this implies an approximately constant ratio between flood volume and cross-sectional area. For the estuaries with no freshwater inflow, there is a constant ratio between tidal prism and cross-sectional area. Martinius & van den Berg (Reference Martinius and van den Berg2011, p. 19) give a concise summary of the influence of estuarine geometry on tidal prism and the relationship between tidal prism and -volume.
Sha & van den Berg (Reference Sha and Van den Berg1993) presented a descriptive model to explain ebb-tidal delta morphology along the Dutch and German barrier islands. Note that the tidal wave travels parallel to these coasts. Variation in geometry is primarily related to wave direction, trends in tidal range along the coast and the resulting differences in interactions of offshore and inlet tidal currents. If the tidal range increases in flood direction, there will be no significant water surface gradients during high and low water and alongshore and inlet tidal currents coincide. Since the flood travels from left to right when looking seaward from the inlet, this enhances tidal currents at the left side of the ebb-tidal delta and an updrift orientation. Wave-induced longshore currents can only force the ebb-tidal delta in a downdrift direction if they are dominating the tidal currents. In the situation that the tidal range decreases in flood direction, as is the case between Vlissingen and Hoek van Holland, maximum flood- and ebb currents fall around high and low water respectively due to significant water surface gradients. Hence, maximum currents at sea coincide with slack tides in the inlet and vice versa, there is no interaction between longshore and inlet tides and tidal currents will radiate away from the inlet throat. Consequently, the ebb-tidal delta geometry will be more symmetric as is the case in the SW Netherlands (van den Berg, Reference van den Berg1987). The gradient in tidal range promotes the development of somewhat deeper tidal channels on the left side of the delta, which explains the slightly asymmetric geometry to the southwest of the ebb-tidal deltas in the Voordelta.
Terwindt (Reference Terwindt1973) discussed the sand transport in the Voor-delta. Based on the current patterns, he inferred a predominantly shore-perpendicular circulation in the channels and a negligible transport on the shoals. Sand transport by waves was predominantly to the northeast. Grain-size distributions show an overall fining to the northeast, also indicating a northeasterly net transport of fine sand in the Voordelta. This is supported by the result of sediment budgets based on comparison of bathymetric surveys by Haring (Reference Haring1955). Finally, the grain-size survey revealed mixing of fine ebb-tidal delta sand and coarse North Sea sand offshore of Haringvliet.
Historical evolution of the Voordelta
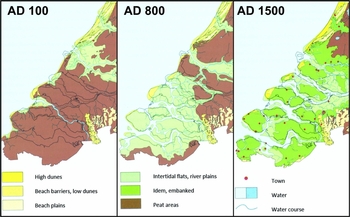
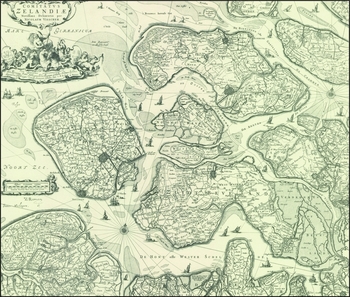
In Roman times, the Delta area was an extensive coastal peat bog that was dissected by distributaries of the river Rhine and by the lower parts of the rivers Meuse and Scheldt. The Rhine distributaries and the Meuse were debouching just north of the present-day Nieuwe Waterweg (Fig. 2), the main branch of the river Rhine was debouching further north near Leiden, whereas the Scheldt had its mouth in the northern part of the present-day Eastern Scheldt inlet (see Vos & van Heeringen, Reference Vos, van Heeringen and Fischer1997; Vos et al., Reference Vos, Bazelmans, Weerts and van der Meulen2011; Vos, Reference Vos2015, ch. 2). Small-scale local channel systems were likely to be present, the precursors of the large tidal systems that would develop later on. Increased drainage of the peat bog both by natural and man-induced causes, resulted in collapse of the land surface and rapid transgression by the sea. By AD 800, the layout of the estuaries can be recognised, although an extensive network of smaller channels is dissecting the landscape (Fig. 2). Over time, sedimentation resulted in accretion of intertidal areas to supratidal levels, after which they were embanked. The smaller channels silted up and disappeared, resulting in the growing together of the embanked areas and the formation of islands (see de Bruin and Wilderom (Reference de Bruin and Wilderom1961) and Wilderom (Reference Wilderom1964, Reference Wilderom1968, Reference Wilderom1973) for an extensive overview of the development of these polders in the province of Zeeland). With this island generation, the pattern of larger tidal channels and estuaries became more distinct. However, occasional storm surge disasters and deliberate military inundations during the Eighty Years’ War (AD 1568–1648) set back this development, led to renewed expansion of the estuaries and created new connections to distributaries of the major rivers. The trend of siltation followed by damming of the smaller channels and occasional expansion of the estuaries resulted in a landscape of islands separated by large estuaries (Fig. 2). Additionally, these estuaries developed distinct and extensive ebb-tidal deltas (see Figs 3, 4), despite the fact that the connected rivers did not supply significant amounts of sand. The sand supply of the Waal, the major distributary of the river Rhine, was caught in an inland lake that was formed by the flooding of a low-lying polder (see Kleinhans et al., Reference Kleinhans, Weerts and Cohen2010). The rivers Meuse and Scheldt had no significant sand transport to the coast. Hence, the most likely source of sand is scouring of the subsurface by the growing estuarine channels. The larger tidal channels in the estuaries threatened the dikes along the islands, especially where meanders were cutting into island shorelines. Van den Berg (Reference van den Berg1986, p. 17) describes the continued outer-bend erosion of the Hammen channel in the Eastern Scheldt that resulted in repeated landward relocation of the dike along the southern shore of the island of Schouwen. Also, the composition of the subsurface of the island shores played an important role in dike stability. An abundance of subrecent, fine-sandy channel fills would give rise to frequent bank failures that made a breach in the dike and sometimes resulted in the loss of the entire polder behind it (van Rummelen, Reference van Rummelen1960). For instance, the northern shore of the island of Noord-Beveland (Fig. 1) experienced over 150 dike falls since 1880 (Rijkswaterstaat, 1969, 1974). See De Bruin and Wilderom (Reference de Bruin and Wilderom1961) and Wilderom (Reference Wilderom1964, Reference Wilderom1968, Reference Wilderom1973) for a comprehensive overview of failures along this and other island shores and van den Berg et al. (Reference van den Berg, van Gelder and Mastbergen2002) for a discussion of the underlying failure mechanisms.
Palaeogeographic reconstructions for the southwestern Netherlands in AD 100, AD 800 and AD 1500. (From Vos et al., Reference Vos, Bazelmans, Weerts and van der Meulen2011.)
Historic map ‘Comitatus Zelandiae’ of the province of Zeeland, showing from north to south, the Grevelingen, Eastern Scheldt and Western Scheldt estuaries, the islands in between and the intertidal shoals in the estuaries and ebb-tidal deltas, compiled by Zacharias Roman and published by Nicolaas Visscher in Amsterdam, c.1650. (Source: Grooten, 1973.)
Historic chart ‘Carte réduite des Côtes des Pays-Bas (depuis Ostende jusqu’à Hellevoetsluis), levée et dressée par Beautemps-Beaupré, hydrographe de la marine . . . en 1817’, showing the Delta area, including estuaries, the islands and the Voordelta. The bathymetry in this chart is based on Beautemps-Beaupré’s surveys starting around the year 1800. The chart was published in 1817. It gives the first reliable overview of the geomorphology of the estuaries and their ebb-tidal deltas.
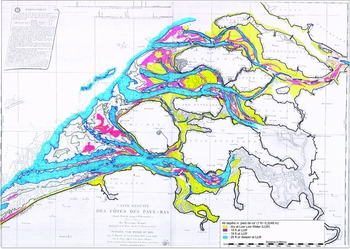
A gradual avulsion north of Antwerp between the 14th and 16th century connected the river Scheldt to the tidal basin of the Honte (see Vos, Reference Vos2015, pp. 88–89, for a detailed account), which created the Western Scheldt and thus a new mouth of the river, south of the former one. Around that time, the estuaries still had side branches, some of them tidal basins with dead ends, some of them channels connecting one estuary to another. Figure 3 is a map published around 1650 by Roman and Visscher that illustrates this layout. In the following centuries, these branches either silted up naturally or were dammed. This can be seen when comparing the 1650 map to the first hydrographic map of the estuaries and the Voordelta that was published in 1817 (Fig. 4). The latter is based on systematic surveys between 1799 and 1811 by the French hydrographer Charles-François Beautemp-Beaupré. The Kreekrak and Sloe, two shallow channel–tidal-flat areas that connected the Eastern Scheldt and Western Scheldt (Fig. 4), were blocked at the end of the 19th century. From then on, the distributaries of Rhine and Meuse and the mouth of the Scheldt were strictly separated.
Special attention should be paid to the evolution of the mouth of the Western Scheldt. In the medieval period the Honte channel, the precursor of the Western Scheldt, was a local tidal channel running to the east approximately at the northern part of the present-day Western Scheldt. However, south of it, a network of tidal channels was dissecting the western part of Flanders, with channels running as far inland as Brugge and channels connecting to the Honte. At the location of the eastern part of the present-day ebb-tidal delta several islands existed. The latter all disappeared by natural erosion when the ebb-tidal delta expanded, or by dredging of the remaining shallows when deepening the Wielingen channel.
The Voordelta and related basins since the late 19th century
By the end of the 19th century, the system of estuarine inlets along the Voordelta area comprised from north to south the Nieuwe Waterweg (Rotterdam Waterway, dug between 1866 and 1872 to make a shorter and more reliable connection between the North Sea and the harbour of Rotterdam); Brielse Maas (a former distributary of the river Meuse); Haringvliet; Grevelingen; Eastern Scheldt; Veerse Gat (a small channel separating the islands of Noord-Beveland and Walcheren); and the Western Scheldt (Figs 1, 4). Eastern Scheldt, Grevelingen and Haringvliet were connected on their landward ends by the channels Keeten-Mastgat, Zijpe, Krammer and Volkerak (Fig. 4). The tidal wave travelled through these channels to the northeast, arriving at the Hollandsch Diep about 40 min earlier than the tide travelling along the Haringvliet estuary. The expansion of the tidal currents in the Eastern Scheldt to the northeast since the 18th century, at the expense of the tidal prisms of both Grevelingen and Haringvliet, resulted in an increase of the tidal prism of this estuary and scouring of its tidal channels (Haring, Reference Haring1978; van den Berg, Reference van den Berg1986, Reference van den Berg1987). Part of this sediment was exported to and deposited on the ebb-tidal delta. With the decrease in tidal prism of Haringvliet and Grevelingen, their ebb-tidal deltas started to deteriorate.
Brielse Maas and the Zeegat van Goeree–Haringvliet shared an ebb-tidal delta that stretched from NW to SW of the island of Voorne. The Grevelingen ebb-tidal delta is situated SW of the island of Goeree. This ebb-tidal delta is not directly connected to the Haringvliet ebb-tidal delta. Sand that is transported from here to the NE moves along the coast of the island of Goeree, presumably as wave-driven longshore transport, and finally ends up in the southern part of the Haringvliet ebb-tidal delta, for example in the recurved spits of Kwade Hoek (van der Spek, Reference van der Spek1987). The Grevelingen ebb-tidal delta is bounded in the south by the island of Schouwen and the Eastern Scheldt ebb-tidal delta west of that island. The Brouwershavense Gat channel is directly influenced by developments on the Banjaard, which is part of the Eastern Scheldt ebb-tidal delta (see Fig. 7 further below for location). The Eastern Scheldt ebb-tidal delta is bounded by the Grevelingen ebb-tidal delta in the north and the coast of NW Walcheren in the south. The Eastern Scheldt ebb-tidal delta included the small tidal inlet Veerse Gat (see above, Fig. 4) that was dammed in 1961. The southern part of the Eastern Scheldt ebb-tidal delta, Domburger Rassen, is relatively deep and forms a gradual transition to the Western Scheldt ebb-tidal delta. The latter runs south to the shallow coastal zone of Flanders. The Western Scheldt ebb-tidal delta is relatively deep and has few shallow shoals.
Already in the 1930s the safety against flooding of the Delta area was studied. The general idea was to shorten the coastline by damming the smaller estuaries, in order to reduce the length of sea dikes and, hence, the risk of flooding during storm surges (Rijkswaterstaat, 1970, 1978). Additionally, increasing saltwater intrusion in the estuaries caused serious problems for agriculture and cattle rearing in the bordering low-lying polders. In the course of these plans, the Brielse Maas was closed off in 1950, as part of a plan to create a large freshwater supply. A plan for the other estuaries was still under study when the 1953 storm surge hit. Following this disaster, the Delta Project was quickly adopted by the Dutch Parliament, which included closing of the Haringvliet, with both a dam and sluices for letting out river water, complete damming of the Grevelingen and complete damming of the Eastern Scheldt, thus creating a tide-free shipping route between the harbours of Rotterdam and Antwerp. The dams reduced the length of dikes exposed to the sea by 700 km. The general idea of the Delta Project was to separate the Delta area into two subsystems: a northern basin consisting of Haringvliet and Nieuwe Waterweg that had to deal with the discharge of the rivers Rhine and Meuse and a southern basin consisting of the Eastern Scheldt and its northern tributary Mastgat–Zijpe-Krammer that would be dammed at a later stage. This was accomplished by building a dam in the Volkerak that kept the tide from penetrating northeastwards into the lower course of the rivers (Fig. 1). The Grevelingen had to be ‘decoupled’ from the Eastern Scheldt at an early stage to facilitate the building of the Volkerak dam. The Western Scheldt mouth was not included, to allow unhindered shipping to the important harbour of Antwerp, where dikes were heightened and strengthened. Plans for complete damming of the Eastern Scheldt were eventually abandoned to maintain the valuable inshore tidal ecosystem of this former estuary. Instead, the Eastern Scheldt storm-surge barrier was constructed (Rijkswaterstaat Deltadienst, 1979).
Recent development of the Voordelta: impacts of the Delta works
Data
The recent development of the Voordelta is studied using a series of bathymetric maps compiled from a variety of data sources. All data were collected by Rijkswaterstaat using the Vaklodingen protocol. Vaklodingen are surveyed and data is interpolated on a pre-designed grid that is divided into map sheets of 10 km × 12.5 km with a resolution of 20 m, covering the estuaries and ebb-tidal deltas up to the seaward −20 m contour. The map sheets are surveyed every couple of years. Data from 1985 onwards was recorded and stored digitally; older data predominantly consists of digitised analogue maps. An overview of bathymetric data collected by Rijkswaterstaat between 1965 and 2000 is given by de Kruif (Reference de Kruif2001). Vaklodingen data for the Voordelta and adjacent tidal basins is available from 1950 onwards. Bathymetric data for the Western Scheldt mouth is digitally available from 1964 onwards, but only since 1970 has the area been surveyed on a regular basis, with one- to three-year intervals. Data for the Eastern Scheldt and Grevelingen has been collected at one- to four-year intervals. The Haringvliet mouth has been surveyed more frequently.
The major part of the map sheets used in this study is composed of data of two complementary surveys in order to obtain complete coverage of the area. Each of the maps was visually inspected and obvious data outliers or missing (individual) data points were corrected. Maps with missing data along the island shores have been completed using Jarkus coastal profile data or linear interpolation between the nearest available data points. Jarkus surveys are executed every year since 1964, according to a grid of fixed, 800–1200 m long coastal transects perpendicular to the coastline, with a spacing of 200 m. Table 1 gives an overview of the available maps and the composing surveys that have been used in this study.
Overview of available bathymetric maps of the Voordelta used in this study. The ebb-tidal deltas have been surveyed in different years. Maps of larger areas are often composed of several consecutive surveys.
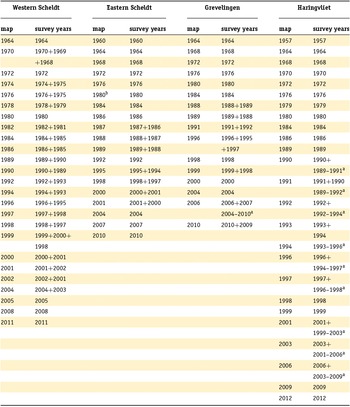
a Missing data in map supplemented with values interpolated over the given interval.
b The 1980 Eastern Scheldt measurements have been excluded from the analysis as this bathymetry was diagnosed with a systematic error by van den Berg (Reference van den Berg1986).
All data for the survey years are available in the Open Earth database, http://opendap.deltares.nl/thredds/dodsC/opendap/rijkswaterstaat/vaklodingen/catalog.html http://kml.deltares.nl/kml/rijkswaterstaat/vaklodingen.kml.
Changes in survey techniques and instruments, positioning systems and variations in correction and registration methods over time make it difficult to estimate the exact accuracy of the measurements and therefore of the maps. As a result of the large areas of the ebb-deltas a vertical difference of 10 cm results in a volume alteration of 23, 20, 30 and 40 million cubic metres (mcm) for Haringvliet, Grevelingen, Oosterschelde and Westerschelde respectively. Wiegmann et al. (Reference Wiegmann, Perluka, Oude Elberink and Vogelzang2005) and Perluka et al. (Reference Perluka, Wiegmann, Jordans and Swart2006) estimate the vertical accuracy of Vaklodingen to range between 0.11 and 0.40 m. Storm et al. (Reference Storm, Bollebakker, de Jong and Mol1993) indicate that errors depend on the morphologic unit surveyed. For intertidal areas, channels and flats and channel slopes stochastic (random) errors are respectively 0.23, 0.19 and 0.39 m, and systematic errors (bias) are −0.20, −0.10 and −0.25 m. Marijs and Parée (Reference Marijs and Parée2004) provide a detailed overview of possible measurement errors focused on the Western Scheldt datasets. These authors conclude that the Vaklodingen data contains three sources of error: (1) stochastic errors due to individual data outliers. Improvements in instruments, measuring techniques and protocols reduced the stochastic error from 0.48 m (1969–1983), to 0.44 m (1985–1989) and 0.36 m (1995–present). Bollebakker and van der Male (Reference Bollebakker and van der Male1993) prove that random errors may induce a volume error at local scale (low data density), but at higher data density (e.g. an entire Vaklodingen sheet) the cumulative volume errors are insignificant. (2) Systematic error introduced by the instruments. Analysis of Vaklodingen data in the Wadden Sea identified three sources of systematic errors: squat of the survey vessel due to motion through the water, local water-level models and false heave (Lekkerkerk et al., Reference Lekkerkerk, van Tooren, van Mierlo and van der Meulen2007). Both squat and false heave result from motions of the survey vessel. Prior to 2001 all the survey vessels obtained data relative to the local water level. Water levels relative to NAP (the Dutch ordnance level which is about mean sea level) were obtained through correction using estimates of the tide level. These estimates were originally based on measurements of nearby stations and tidal maps (so-called reduction charts); since 1989 tidal models have been used. Squat was not accounted for in these tidal corrections, and as a result all Western Scheldt measurements prior to 2001 have an approximate 15 cm overestimation of depths on the shoals and up to 25 cm in the channels (Marijs and Parée, Reference Marijs and Parée2004). This overestimation of depth results from the use of a hydro-jet survey vessel which lifts up while sailing. Since 2001, data has been obtained using Long Range Kinematic GPS positioning that accurately provides the ship's x, y and z position based on satellite altimetry and therefore effectively eliminates this error. (3) A third source of error is variable systematic errors that are introduced by ‘user errors’ in measuring and data handling. These errors introduce volume variations in a Vakloding sheet, ranging between 0.1 and 12 mcm. In general, both the stochastic and systematic errors have decreased since 1993 with the introduction of more accurate echo sounders and especially positioning systems.
Development of the Voordelta
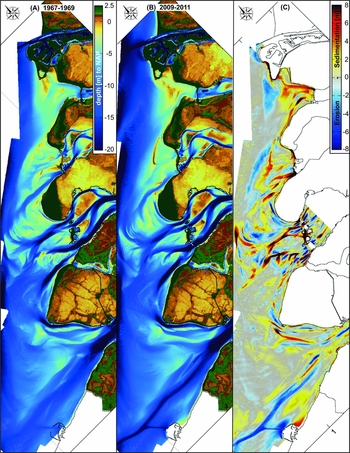
Figure 5 illustrates the large-scale morphological changes of the Voordelta over the period 1968–2010, which include the response to the damming of the estuaries. The effect of (partial) damming of the estuaries is a reduction of the tidal volumes of the inlets that results in a decrease in sand supply by the ebb current and, hence, wave-driven sand transport will increase relatively. This results in net sediment transport in landward direction, erosion of the delta front and building of sand bars on the outer rim of the ebb-tidal delta (for details see Van der Spek, Reference van der Spek1987; Kohsiek, Reference Kohsiek, de Boer, van Gelder and Nio1988). Moreover, with a reduction of the shore-normal tidal flow, shore-parallel currents will become more dominant, which promotes shore-parallel flow through the channels on the ebb-tidal delta. This caused adaptions in the ebb-tidal delta morphology and net transport of sediment to the neighbouring, downstream delta. The changes in the Eastern Scheldt ebb-tidal delta differ from those in the ebb-tidal deltas of both Haringvliet and Grevelingen. After completion of the storm surge barrier, the changing (reduced) tidal flow in the Eastern Scheldt ebb-tidal delta caused reorientation of channels and shoals. This is indicated by the pattern of adjacent sedimentation and erosion in Figure 5C. In contrast to this, the ebb-tidal deltas of both Haringvliet and Grevelingen show large-scale erosion of their seaward parts and sedimentation in the landward parts. The changes in the central part of the Western Scheldt ebb-tidal delta are relatively small. The sedimentation–erosion pattern near the SW shore of Walcheren is caused mainly by migration of channels and shoals. The large-scale dredging of the Wielingen channel and the entrance channel leading to the port of Zeebrugge, and scour around the extended harbour jetties of Zeebrugge considerably increased the depth in the southern part of the ebb-delta. The dredged material was subsequently dumped at selected sites on the ebb-delta and therefore did not introduce major changes in the overall volume of the ebb-delta (Haecon, 2006).
The bathymetry of the Voordelta for the representative years (A) 1968 (based on Vaklodingen 1967–1969) and (B) 2010 (based on Vaklodingen 2009–2011). The morphological changes over this interval are shown by the sedimentation–erosion patterns in (C). Note that for Haringvliet the 2009 bathymetry was used, prior to construction of Maasvlakte 2.
Western Scheldt ebb-tidal delta
The Western Scheldt ebb-tidal delta stretches from the island of Walcheren in the north into Belgian territorial waters in the south. The southern morphological boundary is not clearly defined as, to the south of the mouth of the Wielingen, the coastal zone merges into the Flemish Banks, a zone of shallow, shore-parallel sand ridges, separated by deep troughs. The present-day layout of the Western Scheldt mouth (Fig. 6), with the largest channel Wielingen in the south and a complex of tidal channels and shoals along the SW coast of Walcheren, came into existence about a century ago when the Deurloo, a third channel that dissected the large subtidal shoal Vlakte van de Raan, silted up. A process that must have started well before the 1800s, and relates to a change in relative importance of the channels as tidal prisms in the Western Scheldt estuary did not significantly increase (van den Berg, Reference van den Berg1987). With increasing discharge, the Wielingen enlarged in depth and this contributed to the erosion of the Zeeuws-Vlaanderen coastline. The formation of the two-channel system had a major impact on the morphodynamic processes in the northern part of the ebb-tidal delta where the main shoals and the channel Oostgat all rotated northward or moved landward (for details see among others van Enkevoort, Reference van Enkevoort1996; Van der Slikke, 1998).
Overview of the bathymetry of the Westerschelde ebb-tidal delta in (A) 1964 and (B) 2011. The sedimentation–erosion patterns and the summary of the volume changes summarise the morphological changes over this interval (C).
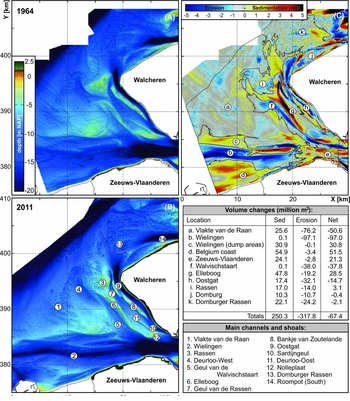
This two-channel system has persisted over the past 45 years, despite the partial closure of the Eastern Scheldt and the major changes in the Western Scheldt estuary (in which over 400 mcm of sediment has been moved by dredging and dumping, and 114 mcm of sand has been extracted since 1955; Haecon, 2006). Major changes in the ebb-tidal delta morphology between 1964 and 2011 occurred in and along the channels. The Wielingen channel continued to increase in depth, but now in major part due to, or enhanced by, dredging directly in the channel and in the Western Scheldt estuary. Dredging in the Western Scheldt, and removal of shallow sills, increased the hydraulic efficiency of the estuary, and tidal prisms increased by 5–7% (Gerritsen and de Jong, Reference Gerritsen and de Jong1983). Part of the dredged sediments contributed to the accretion directly north and south of the channel. A detailed overview of the morphodynamic changes on the Western Scheldt ebb-tidal delta is presented in Elias & Van der Spek (Reference Elias and van der Spek2015).
The increased depth of Wielingen must have contributed to the previously mentioned processes on the northern part of the ebb-tidal delta (Van den Berg, Reference van den Berg1987). In the present-day situation, three parallel channels occur along the SW coast of Walcheren: Oostgat, Geul van de Rassen–Deurloo Oost and Deurloo West–Walvischstaart, which are separated by two shoal complexes (Fig. 6B). The shoals Bankje van Zoutelande, Rassen-Elleboog and Nolleplaat, still separate shoals in 1964, have grown together today, forming an elongated shoal complex. To the southwest of these shoals the Geul van de Walvischstaart increased in depth and length, while in between the shoals and the island lies the channel Oostgat, rather stable in position. Its stability is (partly) due to the occurrence of Tertiary and Pleistocene erosion-resistant layers in the shoreface of SW Walcheren (Van der Spek, Reference van der Spek1997). Oostgat is deepening slightly over its entire length; its seaward part offshore of the western tip of Walcheren is extending to the north. This channel in close proximity to the coastline has resulted in coastal and channel-wall erosion and frequent nourishments of the adjacent beaches. Channel-wall erosion would in time lead to instability of the shoreface and foreshore and eventually to beach loss. The emplacement of a large volume of sand (2.8 mcm in 2005, 6.3 mcm in 2009) on the shoreface of SW Walcheren, which is also the northeastern channel wall of Oostgat, stabilised the shoreface and shifted the channel axis offshore (Nederbragt & Koomans, Reference Nederbragt, Koomans and Sanchez-Arcilla2006; Dekker, Reference Dekker2012). The Vlakte van de Raan, the central part of the ebb-tidal delta situated between Wielingen and the channel–shoal complex offshore of SW Walcheren, is eroding, with the delta front slowly migrating landward. A notable development is the formation of an almost continuous channel as Oostgat extends northward and Roompot, a major channel in the Eastern Scheldt ebb-tidal delta (see below), southward. Relatively small net changes are observed in the Domburger Rassen, the northern part of the delta (Fig 6C, polygon k).
Eastern Scheldt ebb-tidal delta
The Eastern Scheldt ebb-tidal delta consists of a complex, multiple channel pattern that is bounded to the north by a shallow area, Banjaard. The Banjaard shoal is dissected by smaller channels (Fig. 7A–C). The main channels Hammen and Geul van de Roggenplaat are found north of the Middelplaat shoal which has the main control buildings of the storm-surge barrier on top. Going seaward, these channels merge into the Westgat which has a southward and a northward outflow. The northward outflow is called Geul van de Banjaard and, as the name indicates, cuts through and divides the Banjaard shoal into a landward and seaward part. The southern part of the Eastern Scheldt ebb-tidal delta is dominated by the large channel Roompot. The west-running branch, which lies just offshore of the NW coast of the island of Walcheren, is called Roompot Zuid; the main branch runs to the WNW and is called Oude Roompot. This channel has an outflow into Westgat. Small side branches formed spill-over-type lobes to the SW; this area is called Hompels. Figure 7A–C shows the pattern of channels and shoals.
Overview of the bathymetry of the Oosterschelde ebb-tidal delta for (A) 1964, (B) 1984 and (C) 2010. The morphological development over the period 1964–1984 differs considerably from the development over the subsequent period 1984–2010 (see text for further explanation). The morphological changes over these intervals are shown by the sedimentation–erosion patterns (D) 1964–1984 and (E) 1984–2010 and the summaries of volume changes.
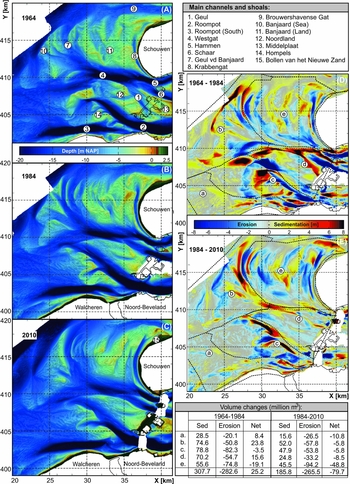
Prior to the completion of the storm-surge barrier, the sediment volume of the Eastern Scheldt ebb-tidal delta grew due to the increase in tidal prism that was caused by the interventions in the estuary. This is a continuation of the evolution that started in the preceding centuries and was caused by the developing connection of the Eastern Scheldt to the Hollands Diep. Van den Berg (Reference van den Berg1984) and Eelkema et al. (Reference Eelkema, Wang and Stive2012) indicate that the volume increase between 1965 and 1984 results from augmented sediment exports caused by the change in hydrodynamics due to the closure dams in the basin (Volkerak dam) and in the Grevelingen. Sedimentation of sand exported from the estuary on the terminal lobes of the tidal channels expanded the ebb-tidal delta seawards. It is not clear whether the Eastern Scheldt ebb-tidal delta was redistributing sand to its neighbouring tidal deltas at this stage. The tidal flow in the inlet concentrated in the main channels as the smaller channels were blocked by the construction of parts of the barrier, which caused these channels to scour deeper. Significant channel erosion of Westgat and Geul van de Banjaard reduced the volume of the landward Banjaard shoal between 1964 and 1984.
The completion of the storm-surge barrier did not result in major changes in the channel pattern on the ebb-tidal delta, since the tidal currents had largely remained intact. Only the channel Geul, that was blocked by the construction island Neeltje Jans, filled completely (Fig. 7A, 1 and Fig. 7D). However, the construction of the storm-surge barrier had reduced the active cross-sectional area of the tidal inlet (from 80,000 m2 to 17,900 m2) and the basin area reduced from 452 km2 to 351 km2, which resulted in a c.28% reduction in tidal volume with respect to 1983, shortly before the implementation of the Delta Project in the Oosterschelde. Louters & Van den Berg (Reference Louters and Van den Berg1998) indicate that the tidal prism initially increased prior to construction from 1130 mcm in 1959 to 1189 mcm in 1980, then reduced to 837 mcm in 1987 after completion of the barrier. Furthermore, the sediment export of the estuary was blocked completely by the barrier's elevated foundation, large sill beams connecting the pillars of the barrier, and the extensive scour pits that developed on both sides of the barrier. With decreased tidal currents and no sediment supply from the estuary, waves started to erode the ebb-delta front. Since the North Sea tidal currents and tidal range did not change, the eroded sediment was transported predominantly to the north, in the direction of dominant flood tidal currents. The Banjaard, west of the island of Schouwen, eroded, increasing the average depth of the area and the tidal channels cutting through this shoal area, reoriented into a more north–south direction. Krabbengat channel, directly off the western shore of Schouwen, extended to the north and built the flood ramp Bollen van het Nieuwe Zand to the north-northeast (Fig. 7C (15)). The outbuilding of this flood ramp constrained the channel Brouwershavense Gat north of it. In addition, Brouwershavense Gat relocated its outflow to the south, cutting a channel and building a terminal lobe on the Banjaard shoal. The erosion of the Banjaard shoal decreased the wave dissipation here, leading to a sustained wave attack on the Schouwen coast (Vermaas et al., Reference Vermaas, Elias, van der Spek, Wang, Rosati and Cheng2015).
Grevelingen ebb-tidal delta
Before the construction of the closure dam Brouwersdam, the Grevelingen ebb-tidal delta comprised the >30 m deep channel Brouwershavense Gat in the south, bordering the island of Schouwen, and the channel Springersdiep which merged into the channel Kous in the north (Fig. 8A, B). The channels were oriented east–west and separated by the shoals Middelplaat and Kabbelaarsbank (Fig. 8B).
Overview of the bathymetry of the Grevelingen ebb-tidal delta for (A) 1964 and (B) 2010. The morphological changes over this interval (C) and the cross-sections over the ebb-tidal delta (D) (see B for location).
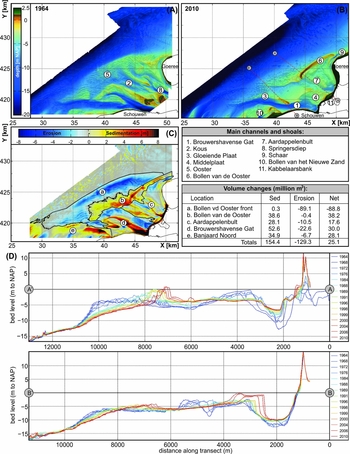
Already between 1933 and 1959, the Grevelingen estuary lost part of its tidal prism to the Eastern Scheldt (as described above). As a result, the cross-sectional area of the tidal channels Brouwershavense Gat and Springersdiep was reduced and the shoals in between the channels expanded. The channels became narrower and deeper (Haring, Reference Haring1978). A reduced tidal prism will have resulted in a diminished extent of the ebb-tidal delta. In 1965, the Grevelingen dam (Fig. 1) at the eastern end of the Grevelingen estuary was completed (construction 1958–1965), which separated the estuary from the Eastern Scheldt and turned Grevelingen into a tidal basin without connections to other estuaries. Subsequently, the tidal prism decreased by c.14% (Haring, Reference Haring1978) and the ebb-tidal delta started to adjust. During this interval, the construction of the Brouwersdam at the seaward end had started. In 1965 (construction 1962–1965) the first dam sections across the shoals Middelplaat and Kabbelaarsbank blocked the smaller tidal channels in the inlet. This caused an increase in depth of the remaining larger channels because of the reduced cross-section of the inlet. An additional dam section was built in the most northerly part of the inlet. In 1971 the remaining channels Brouwershavense Gat and Kous were dammed completely, separating Grevelingen from its ebb-tidal delta and changing the tidal basin into a saltwater lake. The tidal flow in the ebb-tidal delta was strongly reduced and, consequently, waves started to erode the ebb-tidal delta shoreface down to −10 m, bulldozing the sand upwards into a longshore bar called Bollen van de Ooster (van der Spek, Reference van der Spek1987; Kohsiek, Reference Kohsiek, de Boer, van Gelder and Nio1988) (Fig. 8B, 6). Part of the sand will have been transported to the northeast, along the coast of the island of Goeree and feeding the extension of the recurved spits at Kwade Hoek (Fig. 9; see also below). The ebb-tidal delta reduced in surface area, the former shoals were eroded by waves and the channels filled in. Note that despite the reduction in surface area of the ebb-tidal delta, the reduction of its volume is comparatively less than suggested by the Walton & Adams (Reference Walton and Adams1976) relationship, since the eroded sediment cannot be transported into the estuary because of the dam. The channel Brouwers-havense Gat filled in very rapidly, predominantly with mud; van den Berg (Reference van den Berg1986) reported mud deposits >7 m thick. The former shoal Middelplaat/Kabbelaarsbank was eroded by the waves since it was no longer maintained by tidal flow. The sand was deposited in front of the closure dam, forming a wide beach, and landward aeolian transport led to the building of an active dune row on the dam.
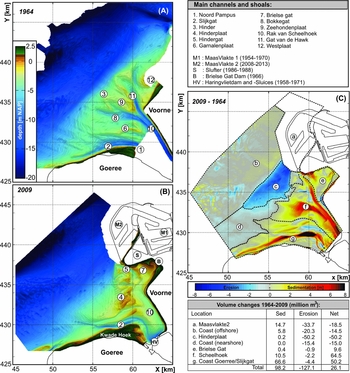
Bathymetry of the Haringvliet ebb-tidal delta for 1965 (A) and 2009 (B). The morphological changes over the 1964–2009 time frame are summarized in the sedimentation–erosion plot (C) and the volume changes over this interval.
Over the years, the sand bar Bollen van de Ooster increased in height and grew in longshore direction (i.e. parallel to the ebb-tidal delta front), first to the west-southwest and later also to the east-northeast (Fig. 8A, B). At present, the Bollen is still separated from the coast of Goeree by a (relatively shallow) short-cut channel. At the southern part of the ebb-tidal delta a shallow shoal area has been built by the Krabbengat channel (see above), locally forcing the Brouwershavense Gat channel to the north. The erosion of the seaward front of the ebb-tidal delta continues, as does the sedimentation in the landward part of the ebb-tidal delta. In total there is a small net gain of sediment. Part of this sediment must have been supplied by the eroding Banjaard shoal (see previous section) and was deposited along its northern edge and along the Schouwen coast (Fig. 8C, polygon e).
Haringvliet ebb-tidal delta
The Haringvliet ebb-tidal delta was originally connected to two tidal inlets: the Brielse Maas estuary to the north and the Zeegat van Goeree/Haringvliet inlet to the south. The comparatively small Brielse Maas estuary was dammed in June 1950, which led to drastic changes in the morphology of its ebb-tidal delta: within 10 years the channels had filled in with mud, their orientation had changed from east–west to north–south and the shoals had grown together into one big shoal, the Westplaat (Rijkswaterstaat, 1962; Terwindt, Reference Terwindt1964). Later, this area was changed completely due to the expansion of the harbour of Rotterdam directly north of it. The construction of, respectively, Europoort (1964–1966), Maasvlakte (1964–1976), Slufterdam (1986–1987) and Maasvlakte 2 (2008–2013) shifted the shoreline of the northern island Roozenburg 8 km seaward and covered the northern part of the ebb-tidal delta (Fig. 9a). In 1966 the remaining mouth of the Brielse Maas estuary was restricted further by the Brielse Gat dam, 3.8 km seawards of the 1950 dam. This stepwise reclamation increasingly sheltered the Haringvliet ebb-tidal delta from northwesterly waves, which must have significantly influenced the development of the southern part of the Haringvliet ebb-tidal delta.
Before the start of the Delta Project, the Zeegat van Goeree, at its narrowest point, consisted of two northwest-running, ebb-dominated channels, Rak van Scheelhoek in the north and Noord Pampus in the south (Fig. 9A). Going seawards, Noord Pampus continued as the channel Slijkgat, branching off to the west and following the coastline of Goeree. Rak van Scheelhoek split into two distributaries, Bokkegat running to the west and Gat van de Hawk running north. The Gat van de Hawk was bounded in the east by the Westplaat, part of the Brielse Maas ebb-tidal delta, and in the west by the Zeehondenplaat (‘Seal shoal’), which separated the channel from the Bokkegat. The shallow shoal between Bokkegat and Slijkgat was named Garnalenplaat (‘Shrimp shoal’).
Changes in the orientation of the shoals in the ebb-tidal delta, the shore-normal Zeehondenplaat changed into the shore-parallel Hinderplaat, were observed well before completion of the Haringvliet dam (Fig. 9A). The construction of an open pit by building cofferdams on the bed of the Haringvliet estuary from 1956 onwards and the subsequent (re)construction of the southern bank diminished the width of the estuary by over 50% by the early 1960s. In addition, the harbour expansion in the northern part further changed the ebb-tidal delta morphology: the Westplaat disappeared when the Maasvlakte was built on top of it. The remaining part of Haringvliet inlet was closed in 1970. In the following years the seaward edge of the ebb-tidal delta eroded and the shore-parallel Hinderplaat grew rapidly in both length and height (a development very similar to the observed formation of the Bollen van de Ooster on the Grevelingen ebb-tidal delta; see Van der Spek, Reference van der Spek1987). The long, spit-shaped Hinderplaat temporarily created a fairly stable state and sheltered the back-barrier area, and the channels filled in predominantly with mud. Piekhaar & Kort (Reference Piekhaar and Kort1983) report a thickness of up to 4.8 m of mud (with <10% sand) in Rak van Scheelhoek. More recent analyses indicate thicknesses of up to 7.5 m (van Heteren, Reference van Heteren2002). The ebb-tidal delta shrunk in surface area, the elevation of the shoals diminished and the channels filled in, which reduced the average depth of the ebb-tidal delta. As the Hinderplaat increased in height and length, it decreased in width. Around 1996 this resulted in breaching of the spit and a more dynamic system in which (multiple) small inlets formed (see Fig. 9B). The entire ebb-tidal delta was pushed landward due to wave action. Prior to 1976 the ebb-delta increased in volume (+26 mcm), but despite the large changes since, the net volume change over the total period is small; sediments are mainly redistributed from the offshore landward (Fig. 9C, polygons c → e–g). Similar to the Grevelingen ebb-tidal delta, the volume reduction is small since the eroded sediments cannot be transported into the estuary because of the dam.
Between 1986 and 1988 the Slufter, a storage basin for contaminated sediments dredged from Rotterdam harbour, was built partly over the northern part of Hinderplaat. The existing channel Gat van de Hawk disappeared in this operation and a new channel, Hindergat, was dredged further south. The recent construction of Maasvlakte 2, a new land reclamation to expand Rotterdam harbour even further west, reduced the northern part of the ebb-tidal delta even more. The erosion of the delta front continues, reducing the extent of the ebb-tidal delta, while the remaining area behind Hinderplaat is silting up. Hinderplaat is no longer a distinct bar but has spread out to the east, forming a tidal-flat-like area (Fig. 9B).
A large sediment supply from the southwest, fed by the erosion of the delta front of Grevelingen ebb-tidal delta and the sand nourishments on the coast of the island of Goeree, resulted in accretion of the shoreface and coast of Goeree and expansion of the recurved spits of Kwade Hoek (Fig. 9B). The only remaining tidal channel on Haringvliet ebb-tidal delta is Slijkgat (Fig. 9B, 2), the fairway to the fishing harbour of Stellendam which has to be dredged regularly to maintain its minimum depth of 5.5 m.
Summary and discussion of the morphologic developments
Damming (Grevelingen and Haringvliet) and partial damming (Eastern Scheldt) of the estuaries as part of the Delta Project, and large-scale harbour construction north of Haringvliet, have resulted in large morphodynamic changes in the Voordelta that continue until today. Most prominent is, in the northward direction, increasing rate of landward retreat of the ebb-tidal delta margins due to the reduction of the cross-shore directed tidal flow. Such strong retreat is not observed in the most southerly, Western Scheldt ebb-tidal delta. The latter retained a near-identical two-channel configuration with large tidal channels along the southern and northern margin, despite major dredging activities in the estuary. The landward (i.e. to the northeast) channel-shoal migration along the northern channel (Oostgat) is currently successfully balanced by large-scale channel-wall nourishments. The large shoal area Vlakte van de Raan in between the channels remains largely unchanged. Apparently systems such as the Western Scheldt ebb-tidal delta are robust to significant anthropogenic change as long as the relative contributions of the dominant processes (tides and waves) do not alter significantly.
Damming or partial damming reduced, but did not completely eliminate, the shore-normal tidal currents. Here we observe a difference in response of the Eastern Scheldt versus the Haringvliet and Grevelingen ebb-tidal deltas. Partial closure of the Eastern Scheldt has reduced the tidal prisms by c.28%, but tidal flows are sufficient to maintain the main channels on the ebb-tidal delta. With a reduction of the shore-normal tidal flow, shore-parallel currents became more dominant, which will promote shore-parallel flow through the channels on the ebb-tidal delta and, consequently, scouring of the north–south-running channels. This eroded and reshaped the Banjaard shoal. Its seaward part is pushed landward and northward by waves. Part of the eroded sediment is transported northward, to the neighbouring Grevelingen ebb-tidal delta.
Complete damming of the Grevelingen and Haringvliet estuaries resulted in strong shoreface erosion and landward sediment transport. Wave action has pushed the ebb-delta margin landward and built sand bars while the closed-off channels have filled in with sediments (both sand and mud). These observations correspond to existing conceptual models and knowledge. Reduction of the tidal prism of an inlet will result in a decrease in sand supply by the ebb current and, hence, wave-driven sand transport will increase relatively. This results in net sediment transport in the landward direction and erosion of the delta front. Since the dams block sediment transport into the estuaries, the volumes of the ebb-tidal deltas did not decrease as would be expected from the Walton & Adams (Reference Walton and Adams1976) relationship. Coast-parallel sand transport is the only means of volume reduction. Part of the sand eroded from the delta front was transported to and along the coast of Goeree island, towards the Haringvliet ebb-tidal delta. The latter does not have a clear outlet for sediment since it is blocked in the north by the harbour extensions.
Sediment budget of the Voordelta 1965–2010
Sediment budgets for the Voordelta have been published by several authors (see examples below). These budgets were calculated by comparing successive bathymetries and taking the volume change as a change in sediment volume. The derived budgets suggest large-scale volume changes that, when averaged to yearly volumes, indicate unrealistic net annual transport rates. Therefore, we systematically re-examined the available bathymetric data and broke the volume changes down to the level of individual morphological units such as channels and shoals. These volume changes were then assessed in the scope of the development of the morphological units, in order to gain a better understanding of the changes in the Voordelta. Note that the values presented here are not corrected for the contribution of mud deposition to the volume change.
Earlier work
Haring (Reference Haring1955) presented sediment budgets over the periods 1872–1933 and 1933–1952. The sedimentation–erosion pattern over the period 1872–1933 shows that the channels in the Eastern Scheldt and Western Scheldt inlets and ebb-tidal deltas were scouring their beds and that sand was deposited on the seaward ends, i.e. the terminal lobes of these channels. This response points towards an increase in the tidal prisms of both estuaries. Martinius & van den Berg (Reference Martinius and van den Berg2011, p. 20) indicate that the tidal volume at the Eastern Scheldt increased by c.5% between 1872 and the start of the Delta Works (coincidentally, this is more or less the same as the decrease due to friction by the storm surge barrier).
The mouths of the Grevelingen, Haringvliet and Brielse Maas estuaries were silting up, with some slight deepening of the central part of the Haringvliet estuary. Zooming in shows that the channels Bokkegat and Brouwershavense Gat in, respectively, the Haringvliet and Grevelingen mouth were also scouring their beds and depositing sand on their terminal lobes. Over the interval 1933–1952, the mouths of Brielse Maas, Haringvliet and Grevelingen and the Banjaard shoal in the Eastern Scheldt ebb-tidal delta were all silting up. The deepening of the channels and outbuilding of the delta front in the Eastern Scheldt ebb-tidal delta continued. Haring does not present data for the Western Scheldt for this period.
Walburg (Reference Walburg2005) published the first sediment budget study that used the digitally available bathymetric data of the Voor-delta in a coherent way. That study concluded that the change in sediment volume between 1964 and 1997 is very small, despite major changes through time (Fig. 10). The sand volume increased by c.200 mcm between 1968 and 1980, only to decrease by a similar volume between 1980 and 1997. Volume changes in the individual ebb-tidal deltas show similar patterns, except for the Haringvliet. The sediment volume loss of c.200 mcm between 1980 and 1997 implies an average annual loss of almost 12 mcm. However, it is not easily explained where this sediment would go to. That is even more true of the loss of c.130 mcm between 1980 and 1984. Part of this discrepancy may be related to the vertical (in)accuracy of the data (van den Berg, Reference van den Berg1986; Storm et al., Reference Storm, Bollebakker, de Jong and Mol1993; Marijs & Parée, Reference Marijs and Parée2004).
Development of the sediment volume of the Voordelta between 1964 and 1997 (after Walburg, Reference Walburg2005).
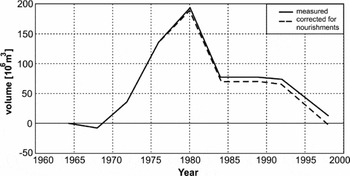
Cleveringa (Reference Cleveringa2008) addressed this problem in an extensive study. He not only re-evaluated the overall volume development, but also checked the volume changes for individual morphological elements of the ebb-tidal deltas. The latter makes clear how much individual elements contribute to the total volume change. Moreover, he used certain threshold values for vertical change in bed level (±0.5 m; ±1.0 m) to leave vertical changes that were too small out of the analysis and he removed unrealistic spikes from the data. He concluded that a major part of the calculated erosion and sedimentation is due to relatively small bathymetric changes (<1 m change), partly caused by inaccuracies in the data. After an evaluation of the effects of these inaccuracies on the sediment budget, Cleveringa corrected the budget and calculated the trend in annual volume change. The annual volume loss over the interval 1980–2004 came down from an uncorrected value of 3.6 mcm a−1 to an average loss of 2.2 mcm a−1 for the 0.5 m threshold and an average loss of 0.4–1.5 mcm a−1 for the 1.0 m threshold. The numbers for the volume increase over the period 1964–1980 changed less dramatically: from an uncorrected 14.6 mcm a−1 to 11.7 mcm a−1 for a 0.5 m threshold and 8.6 mcm a−1 for a 1.0 m threshold (both values including spike removal).
Volume changes of the ebb-tidal deltas 1965–2010
The sediment budget over the time frame 1965–2010 presented here is based on the volume changes that can be deduced from the changes in bathymetry indicated by the sequence of Vaklodingen sounding maps. The bathymetry of the shoreline runs up to NAP (the Dutch ordnance level) which is about mean sea level (MSL). The beach and dunes are excluded from the volume changes since the Vaklodingen are not fit for detailed analyses of these areas. Following construction, inspection and correction of the individual datasets, yearly maps for the period 1965–2010 were generated by linear interpolation between the available datasets, and the sedimentation–erosion trends between successive maps were determined. Since the yearly data are interpolated on the same grid, a straightforward comparison of the successive bathymetries with that of 1965 provides the sedimentation–erosion values for each of the deltas.
Top panel: cumulative sediment volume changes relative to 1965 for the Voordelta as a whole. Lower four panels: cumulative volume changes of the individual ebb-tidal deltas, wherein the red line represents volume corrected for nourishments and the red dashed line the cumulative nourishment volume (excluding dune nourishments) (see Table 3 for values).
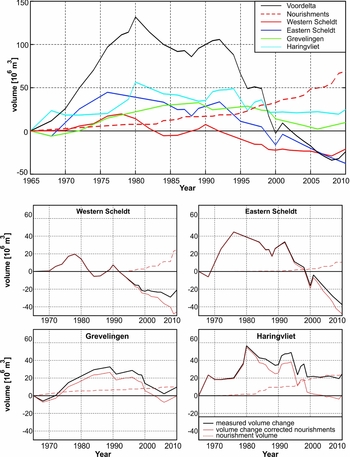
The volume changes of the ebb-tidal delta polygons depicted in Figure 1 (in white lines) are given in Figure 11 and Table 2. The figure shows that the sediment volume of the Voordelta decreased by 24 mcm a−1 over the period 1965–2010. A linear regression analysis of the time series yields an erosion trend of 0.5 mcm a−1. After correction for the volume of sand nourishments along the shorelines of the ebb-tidal deltas of 95 mcm, 25 mcm of that being extracted from the ebb-tidal deltas themselves (see Table 3), the natural volume change is a loss of 94 mcm.
Volume changes for polygons shown in Figure 1 and time series in Figure 11.
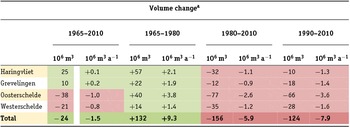
a Trend values are based on linear regression analysis over the given time frame.
Nourishment volumes for polygons shown in Figure 1 and time series in Figure 11.
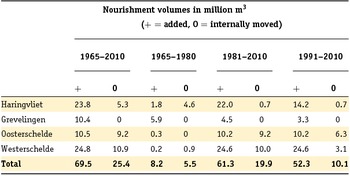
All ebb-deltas show an increase in volume up to approximately 1980 (and 1990 for the Grevelingen). A large volume increase of 45 mcm occurred on the Eastern Scheldt ebb-delta between 1965 and 1976. Major sediment deposition is observed in the closed-off channel (Geul) that by 1984 had completely filled in and along the distal part of Banjaard (Fig. 7E [d]). Since 1980, the volume of the ebb-tidal delta has reduced significantly by 77 mcm (Fig. 11), which is –2.6 mcm a−1. The major part of these losses occurred on the Banjaard shoal (−49 mcm; Fig. 7E [e]). Erosion along the adjacent coastline of Schouwen has necessitated repeated nourishments, and 8 mcm of sediment has been nourished since 1975. The convex shape of the island and the presence of the (developing) tidal channel Krabbengat directly offshore of the coast contributed to the observed erosion (Vermaas et al., Reference Vermaas, Elias, van der Spek, Wang, Rosati and Cheng2015). Significant sediment deposition is observed on the channel's flood ramp (as stated above).
Volume changes on the ebb-deltas of the Western Scheldt, Grevelingen and Haringvliet are smaller. Similar to the Eastern Scheldt, the Western Scheldt ebb-tidal delta shows erosion between 1980 and 2010 (−1.2 mcm a−1); after correcting for the nourishments that have been applied, the erosion rates increase to −2.0 mcm a−1. Only on the Vlakte van de Raan does erosion (–76 mcm) clearly dominate over accretion (26 mcm; see Fig. 6C [a]). Large morphodynamic changes, 185 mcm of gross change (Fig. 6C [f–i]), have taken place along the SW Walcheren coastline, but the resulting net change of +21 mcm accretion is limited. Part of this increase must be related to repeated nourishments that have been placed along the Walcheren coastline. Along the southwest coast of Walcheren, nourishments have been executed since 1952, although the bulk (80%) of the 17 mcm nourishment volume has been supplied since 1991. Originally these latter nourishments were executed as beach and dune nourishments, but since 2005 the erosion induced by Oostgat channel is successfully balanced with channel-slope nourishments (9.1 mcm in total). Additional nourishments along the northwest coast of Walcheren added another 10 mcm of sediment.
Large morphodynamic changes are also observed in the southern part of this delta along the coastline of Zeeuws-Vlaanderen. Major erosion occurred in the Wielingen channel (−97 mcm) as a result of channel deepening. However, large-scale deposition is observed on either side of the channel (Fig. 6 [cd]) and in the mouth of the estuary (Fig. 6 [e]). In total this results in a small net gain of 6.6 mcm (Fig. 6C [bcde]). This increase includes the 15.3 mcm of sand that has been added to the Zeeuws-Vlaanderen coastline since 1971. Major dune-, beach- and channel-wall nourishments (7.1 mcm) were executed in 2009 and 2010. Including the Belgian part of the ebb-tidal delta significantly increases the erosion values to −4.9 mcm a−1 (Elias & van der Spek, Reference Elias and van der Spek2015). These losses can be partly explained by dredging activities to maintain and increase the depth of the Zeebrugge entrance channel and Wielingen, and the subsequent dumping of the dredged deposits to the west, just outside the sediment budget polygon. In addition, extension of the harbour breakwaters to 4 km length (1972–1986) resulted in large-scale scour around the jetty tips (Elias & van der Spek, Reference Elias and van der Spek2015).
Since 1965, the ebb-tidal deltas of Haringvliet and Grevelingen have increased in volume (25 and 10 mcm respectively; Table 2), although more recently both inlets have shown sediment losses of approximately 1 mcm a−1. The 20 mcm increase in Haringvliet volume is questionable as this value results from the increase in volume between 1965 and 1968 only, while between 1965 and 1976 volumes are stable. Close analysis of the measurements taken between 1958 and 1968 shows a coherent trend of increasing volumes. Therefore we cannot conclude that the sediment volume change between 1965 and 1968 is invalid. However, this example clearly illustrates the sensitivity of the sediment budget (and its interpretation) relative to such small changes. The large-scale sedimentation at the Haringvliet delta between 1965 and 1980 may be the result of the formation of Hinderplaat (see Fig. 9B, [4]). Over this time frame over 22 mcm eroded from the shoreface and was deposited in the elongated bar Hinderplaat (16 mcm). The Hinderplaat sheltered the back-barrier and >20 mcm of sediment settled here. Consolidation of the thick mud deposits in Rak van Scheelhoek (see above) may explain the observed sediment volume loss between 1980 and 2000. Major sediment deposition was also observed along the northernmost part of the coastline of Goeree at Kwade Hoek. An increase in sediment volume of 7 mcm was observed between the dune foot and MSL. More recently, since 1999, the volume of Haringvliet has remained stable (Fig. 11). It seems likely that the construction of Maasvlakte 2 (2003–2008) contributes to this stability; to construct Maasvlakte 2, 240 mcm of sand was nourished directly north of the area. Regular beach and shoreface nourishments have added an extra 24 mcm of sediment to the system since 1970.
The Grevelingen ebb-delta shows an increase in volume between 1968 and 1989 (39 mcm), followed by erosion (30 mcm) until 2006 (Fig. 11). Part of the eroded volume will have been transported to the northeast, along the coast of Goeree. Hence, it is very likely that erosion of the Grevelingen ebb-delta is, at least partly, responsible for the observed sedimentation at Kwade Hoek. A similar phenomenon supplies sand to the south of the system along the coast of Schouwen where the flood ramp of Krabbengat channel expands into the former channel Brouwershavense Gat. Over 28 mcm of sedimentation is observed where this channel interacts with the Banjaard shoal (Fig. 8C, [e]). Since 1966 an extra 10.4 mcm of sand was added to this ebb-tidal delta, mostly by nourishing the western tip of the island of Goeree where small tidal channels between the coastline and the shoal complex Bollen van de Ooster caused erosion. The recent increase in sediment volume (2007–2010; Fig. 11) is not from an increase in accretion, but results from reduced erosion of the shoreface (Bollen van de Ooster) and infilling of Brouwershavense Gat during this period.
Further understanding of the observed volume losses and an overview of the sediment fluxes between the respective ebb-tidal deltas can be obtained by constructing a sediment box model that summarises the sediment budget of the Voordelta. To complete the box model we need to add estimates for the remaining source and sink terms. These include sediment supply by the estuaries, sediment in- or outflow at the open boundaries, dredging and dumping (including nourishments) and wind-blown transport to the dunes. Estimates for wind-blown transport to the dunes are based on Arens et al. (Reference Arens, van Puijvelde and Brière2010). That study investigated the effect of sand nourishments on the growth of dunes and concluded that roughly 40% of the nourished volume ended up in the dunes. In the Netherlands the −20 m NAP depth is considered to be the lower limit of the active coastal system (Mulder, Reference Mulder2000), therefore sediment exchange over the −20 m seaward boundary is assumed to be zero. In the north, the sand volumes dredged from the Euro-Maas deep-water shipping channel are used as a control volume, as a major part of these deposits is likely to be supplied by the Voordelta, given the net northward sediment transport (Terwindt, Reference Terwindt1973). This continuously dredged channel and the harbour jetties extending along the channel effectively block sediment exchange from the Voordelta to the Holland coast (van Rijn, Reference van Rijn1997). The sediment volumes dredged from the entrance channel are therefore a good indication of (maximum) longshore transports from the Voordelta to the north. Hoogervoorst (Reference Hoogervoorst2005) estimates that in the period 1966–1996, 83 mcm of sand alone is dredged from the channel, and additionally, 24 mcm of sand mining has taken place over the period 1974–2002. Combined, this results in a maximum net channel sedimentation of 3.7 mcm a−1. No sediment influx is accounted for at Grevelingen and Haringvliet. An estimate for the sediment influx from the Eastern Scheldt can be obtained from the observed increase in ebb-tidal delta volume (75 mcm between 1965 and 1980). An approximately similar value was given by van den Berg (Reference van den Berg1986), who estimated the sediment export at 4 mcm a−1 over the period 1959–1974, with increased rates during construction of the Delta Works. Since 1980, sand exchange through the barrier is assumed to be nil as the deep scour holes on either side form effective sediment sinks (Mulder, Reference Mulder2000; Geurts van Kessel et al., Reference Geurts van Kessel, Berrevoets, Consemulder, de Jong, Kater, van Maldegem, Prins, Stikvoort, Twisk, Wetsteyn and Withagen2004). An estimate for the sediment import rates at the southern boundary of the Voordelta is more difficult to obtain. Based on the dominant wave and wind direction from the southwest, a northeastward wave-driven longshore transport along the Flemish coast can be expected. Along the Holland coast, with similar wave forcing, these transports are estimated to range from 0.1 to 0.5 mcm a−1 (van Rijn, Reference van Rijn1997). However, with the extension of the harbour jetties at Zeebrugge to 4 km length in 1972, longshore transport along the coast was effectively blocked. Therefore, we assume a zero influx over the southern boundary. The largest uncertainty is related to sediment exchange with the Western Scheldt estuary. The most recent estimate for sediment import into the Western Scheldt estuary is provided by Cleveringa (Reference Cleveringa2013). That author concludes that sediment imports into the Western Scheldt estuary increased from 1 to 5 mcm a−1 over the period 1955–1976, decreased to 3 mcm a−1 between 1976 and 1994, and the most recent (1994–2010) sediment imports are estimated at 0.7 mcm a−1. Based on these import rates, the total sediment import into the estuary would be approximately 100 mcm over the period 1965–2010. However, by analysis of the individual contributions of sand and mud, Cleveringa also concluded that over the interval 1994–2005, sediment import prevails for mud (0.75 mcma−1) and sediment export for sand (0.52 mcm a−1). Triggered by this discrepancy we will compute the sediment import into the Western Scheldt estuary from our sediment box model and evaluate whether the derived import or export rate is feasible.
Figure 12 presents the sediment box model over the period 1965–2010. We observe relatively small changes in ebb-delta volumes with a 0.1 and 0.2 mcm a−1 increase in Haringvliet and Grevelingen, and a 1 mcm a−1 volume reduction in the Western Scheldt and Eastern Scheldt ebb-deltas. Erosion rates for ebb-deltas increase in recent times (Table 2), and the sediment transport direction reverses between Oosterschelde and Westerschelde. The model shows that both Haringvliet and Grevelingen are transit areas; the amount of sediment coming in through the southern border is similar to that going out through the northern border. Sediment exchange between the Eastern Scheldt and Western Scheldt ebb-tidal deltas reverses in recent years, with the Eastern Scheldt delivering sediment to the Western Scheldt. Based on this sediment budget, the sediment exchange between the Western Scheldt ebb-tidal delta and estuary is calculated to range between 0.4 and 4.9 mcm a−1 (sediment import). Note that for all time frames and scenarios, the sediment exchange between the ebb-tidal deltas in most cases is of the same order of magnitude as the net changes and in many cases significantly larger than the net change.
Sediment budget of the Voordelta and estimates of the fluxes between the individual ebb-deltas for the time period 1965–2010.
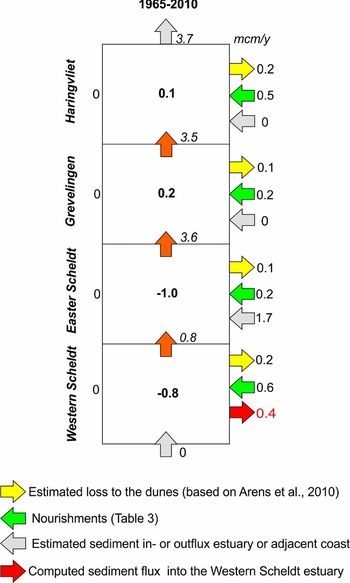
Discussion of the sediment budget
The sediment budgets in the studies of Walburg (Reference Walburg2005) and Cleveringa (Reference Cleveringa2008) as well as in this paper are dominated by an initial strong increase in volume. Between 1965 and 1980 the Voordelta volume increased by 132 mcm (+9.3 mcm a−1) and shows a constant decrease (−5.9 mcm a−1) in volume since. Over the entire period (1965–2010) the net volume change is limited: −24 mcm (–0.5 mcm a−1). The volume changes are of similar magnitude to the accuracy of the measurements.
The largest uncertainty arises in the data of the Eastern Scheldt ebb-tidal delta. Here the volume changes are largest, and the large volume increase between 1968 and 1976 raises some questions. Van den Berg (Reference van den Berg1986) already concluded that a clear positive bias exists in the 1980 bathymetric data. Excluding this dataset from the series reduced the observed peak in sediment volume by 35 mcm. The predominant accretion in the 1964–1984 sedimentation–erosion map (Fig. 7D) may indicate that there is a positive bias in the 1984 measurement as well. However, the observed patterns of sedimentation (on the Banjaard shoals) and erosion (deepening) of the main channels are coherent to the observed changes in hydrodynamics. Van den Berg (Reference van den Berg1984) and Eelkema (Reference Eelkema2013) indicated that the increase in sediment volume between 1965 and 1980 results from augmented sediment exports caused by the change in hydrodynamics due to the construction of closure dams in the basin (Volkerak dam) and Grevelingen. Temporarily increased flow velocities could have pushed the sediments seaward, contributing to the observed accretion on the distal parts of the ebb-tidal delta.
Note that the bathymetric information in the Vaklodingen is relative to ordnance level NAP. The use of a fixed reduction level makes the bathymetrical information independent of changes in (relative) sea level. Although water-level observations suggest a rise in MSL in the order of 0.10–0.15 m in the area over the period 1965–2010 (Dillingh et al., Reference Dillingh, Baart and de Ronde2012), this is not reflected in the morphological changes: the effects of the damming have overwhelmed any natural development. To keep pace with that rise in MSL, the Voordelta needed to gain 155 mcm of sediment over 1965–2010.
Concluding remarks
The Voordelta consists of a series of five contiguous (former) ebb-tidal deltas. Damming (Brielse Maas, Grevelingen and Haringvliet) and partial damming (Eastern Scheldt) of the estuaries as part of the Delta Project, and large-scale harbour construction north of the Haringvliet estuary, have resulted in large-scale morphodynamic changes that continue until today. Nevertheless, the net sediment volume changes over the entire period 1965–2010 are small: a 0.1–0.2 mcm a−1 increase in Haringvliet and Grevelingen, and an approximate 1 mcm a−1 volume reduction of both. The sediment volumes that are transported from one ebb-tidal delta to the next are in the same order of magnitude as, or larger than, the net changes.
The bathymetric measurements showed inaccuracies well beyond the range derived from theoretical estimates. Correction for measurement errors is not a trivial task. In this study, we reduced error by critically reviewing the field data for clear data outliers. A critical review of the data can seriously improve the sediment budget by removing morphologically unrealistic changes. This statement is especially valid for the Western Scheldt ebb-tidal delta. Confidence in the morphodynamic changes is obtained by detailed analysis of the sediment transport patterns. These patterns show consistency with the changes in forcing, such as the retreat in ebb-delta margin due to reduced cross-shore directed tidal flow. Accordingly, we believe that the established sediment budget for the Voordelta is the best practical result given the available dataset.
The well-monitored changes in the Voordelta, showing the differences in responses of the ebb-tidal deltas to reductions in tidal volume, provide clear insight into the underlying processes and allow us to refine existing general concepts and models of ebb-tidal delta dynamics. Despite anthropogenic dominance, existing conceptual models and knowledge, based on natural inlets, can still explain the observed developments. In essence, reduction of the tidal prism of an inlet will result in a decrease in sand supply by the ebb current, and, hence, wave-driven sand transport will increase relatively. This results in net sediment transport in the landward direction and erosion of the delta front (Grevelingen and Haringvliet). Since the sediment cannot be transported into the estuary because of the dams, the only way to export sediment is by lateral transport. Moreover, with a reduction of the shore-normal tidal flow, shore-parallel currents will become more dominant, which promotes shore-parallel flow through the channels on the ebb-tidal delta and increases the sediment exchange between the individual deltas. This will cause adaptations in the ebb-tidal delta morphology (Eastern Scheldt). Finally, the decreased tidal flow triggers infilling of the tidal channels, both with sand eroded from the shoals and mud imported from the North Sea.
The observed morphodynamic changes are related to the scale of the intervention. Complete damming of the three northern estuaries Brielse Maas, Haringvliet and Grevelingen resulted in a regime shift from mixed-energy to wave-dominated. At all inlets, a long but narrow, coast-parallel, sub- to intertidal bar developed as sediments were reworked by waves on the former ebb-delta margin and pushed landward. This bar temporarily acts as a coastal barrier, sheltering the area behind and thereby promoting sediment deposition. Destruction of the bar at the Haringvliet delta by breaching led to the development of several small, highly dynamic inlets. It is expected that frequent formation and closure of these small inlets will continue until eventually the ebb-delta deposits fill the basin completely, merging with the coast and thereby extending it. The changes in the Grevelingen ebb-tidal delta have not reached this state yet.
Partial closure of the Eastern Scheldt resulted in a reduced tidal volume, but the tidal flows have been sufficient to maintain the main channels on the ebb-tidal delta. The reduction of the shore-normal tidal flow resulted in (1) a dominance of shore-parallel currents on the nearshore Banjaard shoal promoting scour of the north–south-running channels, and (2) erosion of the ebb-delta margin due to wave attack. As a result, the largest sediment losses in the Voordelta occur on this ebb-tidal delta (−72 mcm since completion of the storm-surge barrier).
Only limited net change was observed on the Voordelta's most southerly ebb-tidal delta. The Western Scheldt ebb-tidal delta retained a near-identical two-channel configuration with large tidal channels along the southern and northern margins, despite major dredging activities in the estuary (>400 mcm of sediment was dredged and dumped) and channel deepening on the ebb-tidal delta. Apparently, tide-dominated systems such as the Western Scheldt ebb-tidal delta are robust and resilient to significant anthropogenic change, as long as the balance between tides and waves does not alter significantly.
The large morphodynamic changes make it difficult (if not impossible) to discern the effects of sea-level rise. With an observed rise in sea level of c.11 cm over the measurement time frame, a 155 mcm increase of sediment volume would be needed to keep the same relative depth in the Voordelta.
Acknowledgements
This paper is the result of the KPP Beheer en Onderhoud Kust programme (Deltares project nos. 1207724, 1209381, 1220040 and 1230043). This research programme aims at building a knowledge base for effective coastal management and maintenance in the Netherlands and includes data analysis to understand evolution of the Dutch coast. Quirijn Lodder (Rijkswaterstaat Traffic- and Watermanagement) is thanked for kind cooperation. Reviews by Janrik van den Berg and Duncan FitzGerald greatly improved the manuscript and are much appreciated.



