Introduction
Helicobacter pylori is one of the most prevalent global pathogens, the strongest known biological risk factor for gastric cancer (about a sixfold increase of risk) and is responsible for 80% of gastric ulcers [1]. H. pylori is a Gram-negative, microaerophilic bacterium commonly found in the epithelial lining of the human stomach [2].
The mode of transmission of H. pylori remains unclear. Transmission appears to occur through close personal contact, such as oral–oral or faecal–oral, particularly within the family and typically in early childhood [1, Reference Goodman3–Reference Malaty10]. Once infected with H. pylori, individuals will experience life-long infection in the absence of antibiotic treatment [Reference Kim11, Reference Wroblewski, Peek and Wilson12]. The global burden of disease is substantial, with H. pylori present in the stomach of half of the world's population; however, H. pylori most heavily burdens low- and middle-income countries (LMICs) where the proportion of people infected is approximately 70% [Reference Goss13, Reference Torres, Backert and Yamaoka14]. For example, a prevalence study in Mexico showed that 66% of the Mexican population was infected with H. pylori, and that this prevalence increases with age, reaching up to 80% in adults 25 years old and older [Reference Torres15]. This study also found significant variation in the prevalence by age, socio-economic status and geography (e.g. state-level prevalence ranged from 48% to 85%).
The force of infection is the instantaneous rate at which susceptible individuals acquire infection. It is an important epidemiological quantity and a key parameter for mathematical models of disease transmission, which are used to estimate disease burden and the effectiveness and cost-effectiveness of infectious disease treatment and prevention [Reference Hens16, Reference Brisson, Edmunds and Gay17]. Like many infectious diseases, it is infeasible to directly measure the force of infection of H. pylori [Reference Anderson and May18–Reference Rupnow20]. However, under certain assumptions, it can be estimated using population-level seroprevalence data [Reference Hens16, Reference Farrington21, Reference Muench22]. Despite the existence of seroprevalence data of H. pylori, it has not been used previously to estimate the force of infection.
In this paper, we estimate the age-specific force of infection of H. pylori from national seroprevalence data in Mexico (a middle-income country with a high prevalence of infection). We used data from a nationally representative seroepidemiology survey conducted in Mexico in 1987–1988, prior to widespread antibiotic treatment of H. pylori, with rich geographical variation. Given the large heterogeneity in the number of samples obtained in each state, we used a non-linear Bayesian hierarchical catalytic model that allows us to estimate the force of infection in each state in Mexico while simultaneously estimating the national average force of infection. We demonstrate that this method dramatically stabilises estimation by shrinking the state-specific force of infection towards the national estimate, particularly on states with low data.
Methods
Force of infection as a catalytic model
The force of infection is the key quantity governing disease transmission within a given population and is defined as the instantaneous per capita rate at which susceptible individuals acquire infection (i.e. the hazard of infection). It reflects both the degree of contact between susceptible and infected individuals and the transmissibility of the pathogen per contact. In cases where contact is age dependent, the force of infection is itself a function of age analogous to the hazard being a function of time in a survival model [Reference Farrington21].
Formally, let P(a) denote the probability that an individual susceptible at birth is still susceptible (i.e. uninfected) at age a; this is identical to the cumulative survival function in a survival analysis. Let λ(a) denote the force of infection at age a, which represents the rate of infection of the susceptible population P(a). In terms of a survival model, the force of infection λ(a) represents the instantaneous infection hazard. Therefore, for lifelong infections (or infections conferring lifelong immunity) that do not significantly affect mortality, λ(a) can be defined as:
 $$\lambda (a) = - \displaystyle{1 \over {P(a)}}\displaystyle{{dP(a)} \over {da}}$$
under the assumption that the population is in dynamic equilibrium (meaning that P(a) is constant over calendar time and not changing by birth cohort).
Equation (1) specifies a so-called catalytic epidemic model, first defined by Muench [Reference Muench22]. The term catalytic model derives from its origins in chemistry, where these models were used to study chemical reaction kinetics. Catalytic epidemic models have been widely used to estimate the force of infection of different infectious disease such as measles, rubella, mumps, hepatitis A and yellow fever using seroprevalence epidemiological data from settings where these diseases do not significantly affect mortality [Reference Hens16].
Catalytic models can easily be written in terms of the cumulative probability of infection by age a, F(a) = 1 − P(a), which more directly corresponds to how seroprevalence data are collected [Reference Farrington21, Reference Muench22]. In terms of F(a), the force of infection, λ(a), becomes:
 $$\lambda (a) = \displaystyle{1 \over {1 - F(a)}}\displaystyle{{dF(a)} \over {da}}.$$
Note that rearranging Equation (2) we can solve for F(a) as a function of λ(a), which is equivalent to a survival model where the probability of infection by age a is the cumulative distribution function of the time to infection:
 $$F(a) = 1 - {\rm exp}\left[ { - \mathop \int \limits_0^a \lambda (s)ds} \right].$$
Seroprevalence data of H. pylori in Mexico
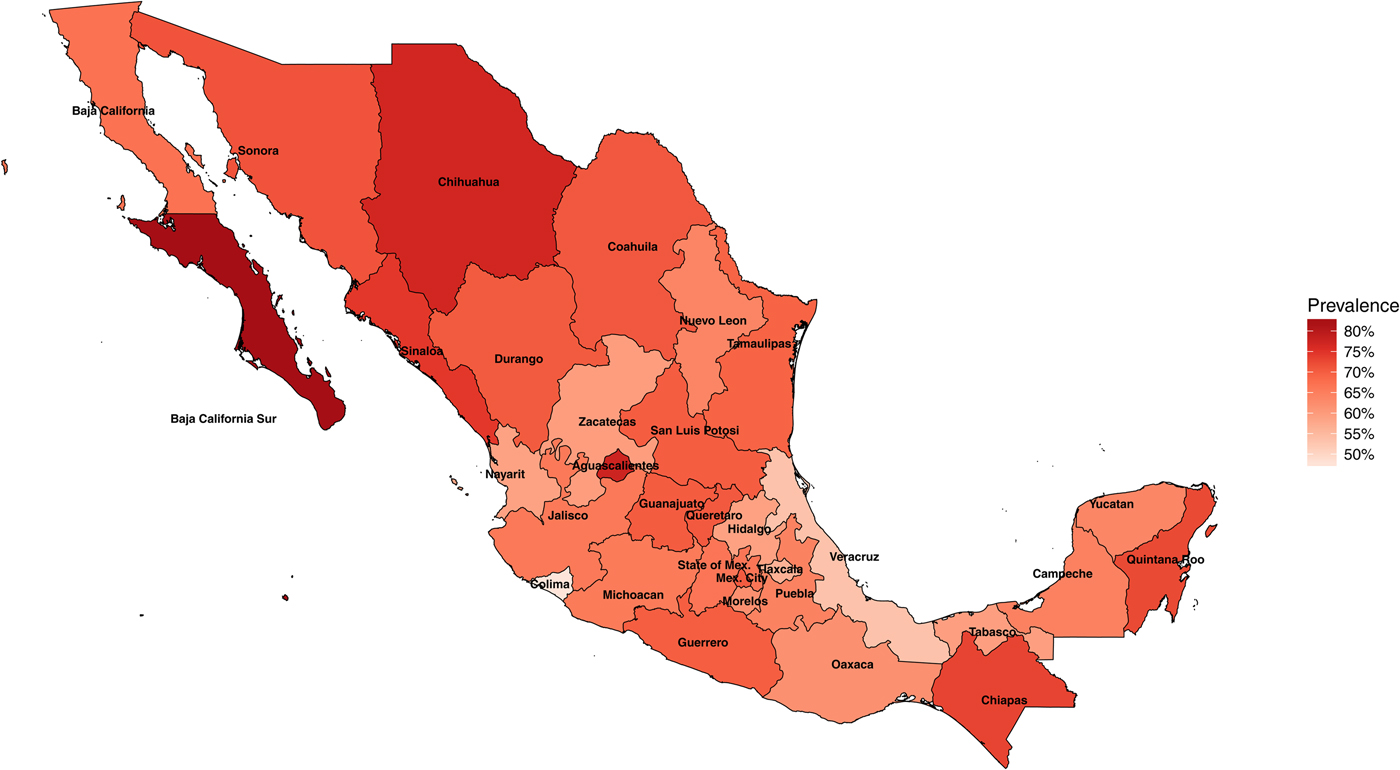
In 1987–1988, the National Seroepidemiological Survey was conducted in Mexico as a nationally representative seroprevalence study of H. pylori infection [Reference Torres15, Reference Tapia, Gutiérrez and Sepúlveda23]. The survey was designed to represent the country by including all 32 states of Mexico, all ages, all socio-economic levels and both sexes [Reference Tapia, Gutiérrez and Sepúlveda23]. In total, 32 200 households were surveyed and more than 70 000 serum samples were collected. Of these samples, 11 605 individuals were used for H. pylori testing, and out of these, 7 720 (66%) were seropositive for H. pylori. H. pylori infection was determined by ELISA detection of IgG antibodies to specific H. pylori antigens. H. pylori prevalence in Mexico varies by state and can be as low as 48% in the state of Colima and as high as 83% in the state of Baja California Sur (Fig. 1).
Map of Mexico with observed prevalence of Helicobacter pylori by state in 1987–88.

Functional form of H. pylori infection in Mexico
The National Seroepidemiological Survey was collected prior to widespread antibiotic treatment of H. pylori in 1991, so we can assume that the population is in dynamic equilibrium. The age-specific prevalence measured nationally is shown in Figure 2 and it is clear that the trend is monotonically non-decreasing.
Empirical prevalence of Helicobacter pylori in Mexico by age nationally and in three different states with different amount of data.

Based on the shape of these data, we assume that the state-specific cumulative probability of H. pylori infection, F i(a), for each state i follows a modified exponential functional form:
 $$F_i(a) = \alpha _i(1 - e^{ - \gamma _ia}),$$
where 0 ⩽ α i ⩽ 1 and γ i ⩾ 0 are the state-specific asymptote and rate parameters of the catalytic model. The asymptote parameter α is often interpreted as the proportion of the population that can be infected (i.e. the susceptible population), if it is assumed that it is the exhaustion of susceptible individuals that leads to the eventual plateau in the proportion infected at older ages [Reference Hens16]. With this interpretation, the rate parameter γ is then the constant rate at which these susceptible individuals become infected. We allow α and γ to vary by state to reflect the heterogeneity in H. pylori prevalence trends resulting from differences in socio-economic and environmental factors. Note that for all states, we assume that no children are infected at birth (F(0) = 0) since there is no biological evidence for vertical transmission of H. pylori from mother to child during pregnancy, labour or delivery [Reference Espinoza Monje and Marin Vega24].
Based on this functional form for the cumulative probability of infection, we used Equation (3) to solve for the state-specific force of infection, λ i(a), in terms of α i and γ i:
 $$\lambda _i(a) = \displaystyle{{\alpha _i\gamma _ie^{ - \gamma _ia}} \over {1 - \alpha _i(1 - e^{ - \gamma _ia})}}.$$
Note that if the entire population is eventually infected in a given state (i.e. α i = 1), λ i(a) = γ i and Equation (4) reduces to a traditional exponential model in survival analysis.
Estimation of the force of H. pylori infection
We used statistical methods to estimate the parameters α and γ that best fit the cumulative probability of infection in each state and then calculated the corresponding force of infection. Due to the high degree of variation in sample composition for each state in the National Seroepidemiological Survey, traditional non-linear least-squares estimation yielded imprecise, unstable or unrealistic estimates of α and γ. This could translate into estimates of force of infection that are implausibly high or low with wide confidence intervals (CIs) when only a small number of people are sampled (and, for instance, none are infected). For example, some states had individuals sampled at all ages while others had limited data for certain ages. In Figure 3, we show the observed prevalence in four different states with varying amounts of data and the predicted prevalence for these states using the estimates from non-linear least-squares estimation (in blue solid lines). Nuevo Leon and Mexico City have more data and less variability in terms of disease status compared with the states of Baja California Sur and Nayarit. The state of Baja California Sur is a state where all adults sampled older than 20 years old (n = 24) are positive for H. pylori. The resulting parameter estimates are implausibly high based on our current knowledge of H. pylori.
Empirical prevalence of Helicobacter pylori in Mexico by age in four different states with different amount of data, together with model-predicted prevalence using non-linear least-squares (NLS) and hierarchical Bayesian estimation methods. The upper two reflect states with data for all ages and the lower two reflect states with limited amount of data for some ages. The red solid line denotes the model-predicted posterior mean and the red dashed lines denote the 95% credible bounds. The black dotted horizontal line shows the average national H. pylori prevalence.

To solve these issues, we instead implemented a hierarchical Bayesian non-linear model that ‘borrows’ information from all states when estimating state-specific effects. Such models have been described in detail elsewhere [Reference Gelman and Hill25–Reference Witte27] and are known to reduce mean squared error of model estimates in some settings. We are unaware of these models having been applied to catalytic models to estimate force of infection. We first used hierarchical Bayesian non-linear models to estimate the posterior distribution of the α and γ parameters of model (4) for each of the 32 states. We then estimated the aggregated and state-specific force of infection of H. pylori in Mexico.
Hierarchical non-linear Bayesian model
We assume that for each state i = 1, …, 32 the number of infected individuals y i(a) at age a follows a binomial distribution where n i(a) is the sample size and p i(a) is the cumulative probability of infection (i.e. F i(a)) in state i:
 $$\matrix{ {y_i(a)} & { \sim {\rm Binomial(}n_i(a),p_i(a))} \cr {\,p_i(a)} & { = F_i(a) = \alpha _i(1 - e^{ - \gamma _ia})} \cr {\left[ {\matrix{ {{\rm logit(}\alpha _i{\rm )}} \cr {{\rm log(}\gamma _i{\rm )}} } } \right]} &\!\!\!\!\!\! \sim { {\rm MVN}\left( {\left[ {\matrix{ {\beta _1\; } \cr {\beta _2} } } \right],\Sigma } \right)} \cr \Sigma & { \sim {\rm IW}\left( {\left[ {\matrix{ {{10}^3} & 0 \cr 0 & {{10}^3}} } \right],2} \right)}} .$$
Note that each of the 32 states has its own set of parameters α i and γ i, but these state-specific parameters ‘borrow’ information from each other by assuming that they collectively follow a multivariate normal (MVN) distribution centred at β 1 and β 2. To compute the average national-level proportion of susceptibles and infection rate, α 0 and γ 0, we applied a logit and log transformation to the β 1 and β 2 parameters, respectively.
For the covariance matrix, we used an inverse Wishart (IW) distribution of two degrees of freedom. The IW is a widely used prior distribution for covariance matrices; the large diagonal entries and the zero off-diagonal entries in the matrix represent a weakly informative prior on the variances and no prior correlation between α and γ parameters [Reference Gelman and Hill25]. Weakly informative normal prior distributions (μ = 0 and σ = 103) were specified for β 1 and β 2 parameters.
Parameters of model (6) were estimated through Gibbs sampling, using Just Another Gibbs Sampler (JAGS) [Reference Plummer, Hornik, Leish and Zeileis28]. We ran two Markov chain Monte Carlo (MCMC) chains. For each chain, 50 000 iterations were used to generate a posterior distribution after a 10 000 iterations burn-in period. The mean estimates and 95% credible intervals (CR) were derived from posterior distributions. For each chain, we used starting values computed from the solution of model (4) using non-linear least-squares. We checked each parameter's chains to assess convergence. To confirm whether the model provides a reasonable fit of the data, we plotted the observed prevalence by age with 95% CIs, together with the model-predicted prevalence.
The force of H. pylori infection was estimated within the MCMC model by evaluating Equation (5) at each parameter set drawn from the posterior distribution, respectively. We then calculated their posterior predicted mean and 95% CR. All statistical modelling was conducted in JAGS [Reference Plummer, Hornik, Leish and Zeileis28] and R version 3.2.4 (http://www.r-project.org).
Results
Table 1 presents the posterior summaries of the national-level α 0 and γ 0 parameters of the hierarchical non-linear Bayesian model. The posterior mean of the asymptote parameter (α 0) is 0.859 (95% CR 0.843–0.875). The posterior mean of the rate parameter (γ 0) is 0.092 (95% CR 0.084–0.100).
Posterior mean estimates, standard deviation (SD) and lower and upper bounds of the 95% credible interval of the national-level proportion of susceptibles (α 0) and rate of infection (γ 0), which correspond to the asymptote and rate parameters of the catalytic epidemic model of Helicobacter pylori in Mexico

Figure 4 shows the state-specific estimates of the asymptote (α) and infection rate (γ) parameters. Parameter estimates exhibit substantial heterogeneity between states. More than a third of the states have posterior means of the asymptote parameter outside the 95% CR of the national average (95% CR 0.843–0.875). Six states (Baja California Sur, Coahuila, Sinaloa, San Luis Potosi, Sonora and Mexico City) have posterior means above the upper bound of the national average, while seven other states (Nayarit, Hidalgo, Tlaxcala, Tabasco, Oaxaca, Puebla and Veracruz) have estimates below the lower bound of the national average. More than half of the states have posterior means of the rate parameter outside the 95% CR of the estimated national average (95% CR 0.084–0.100). Ten states (Chihuahua, Chiapas, Baja California Sur, Guerrero, Aguascalientes, Queretaro, Sonora, Guanajuato, Sinaloa and Tamaulipas) have posterior means above the upper bound of the national average and eight other states (Morelos, Yucatan, Zacatecas, Oaxaca, Nayarit, Hidalgo, Colima and Veracruz) have lower estimates than the lower bound of the national average.
State-specific posterior mean and 95% credible interval for the asymptote and rate parameters. Solid and dashed vertical lines represent the national-level posterior mean and 95% credible interval, respectively.
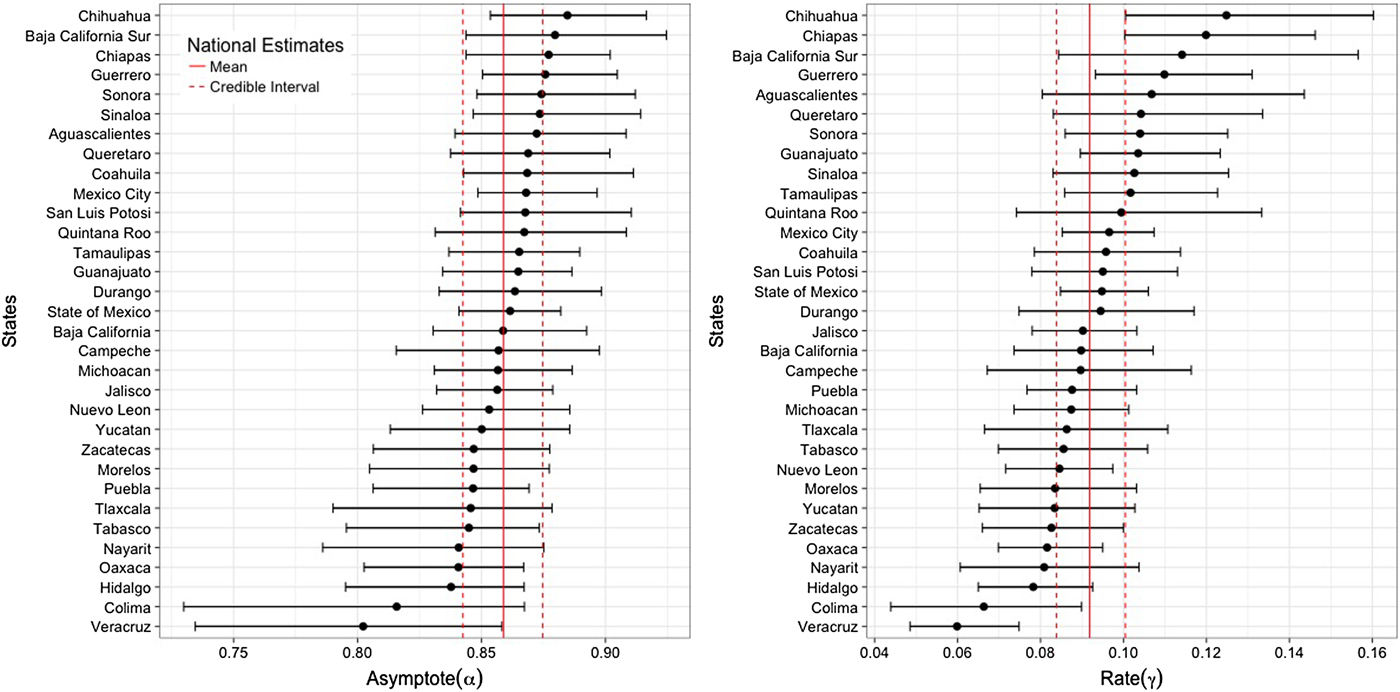
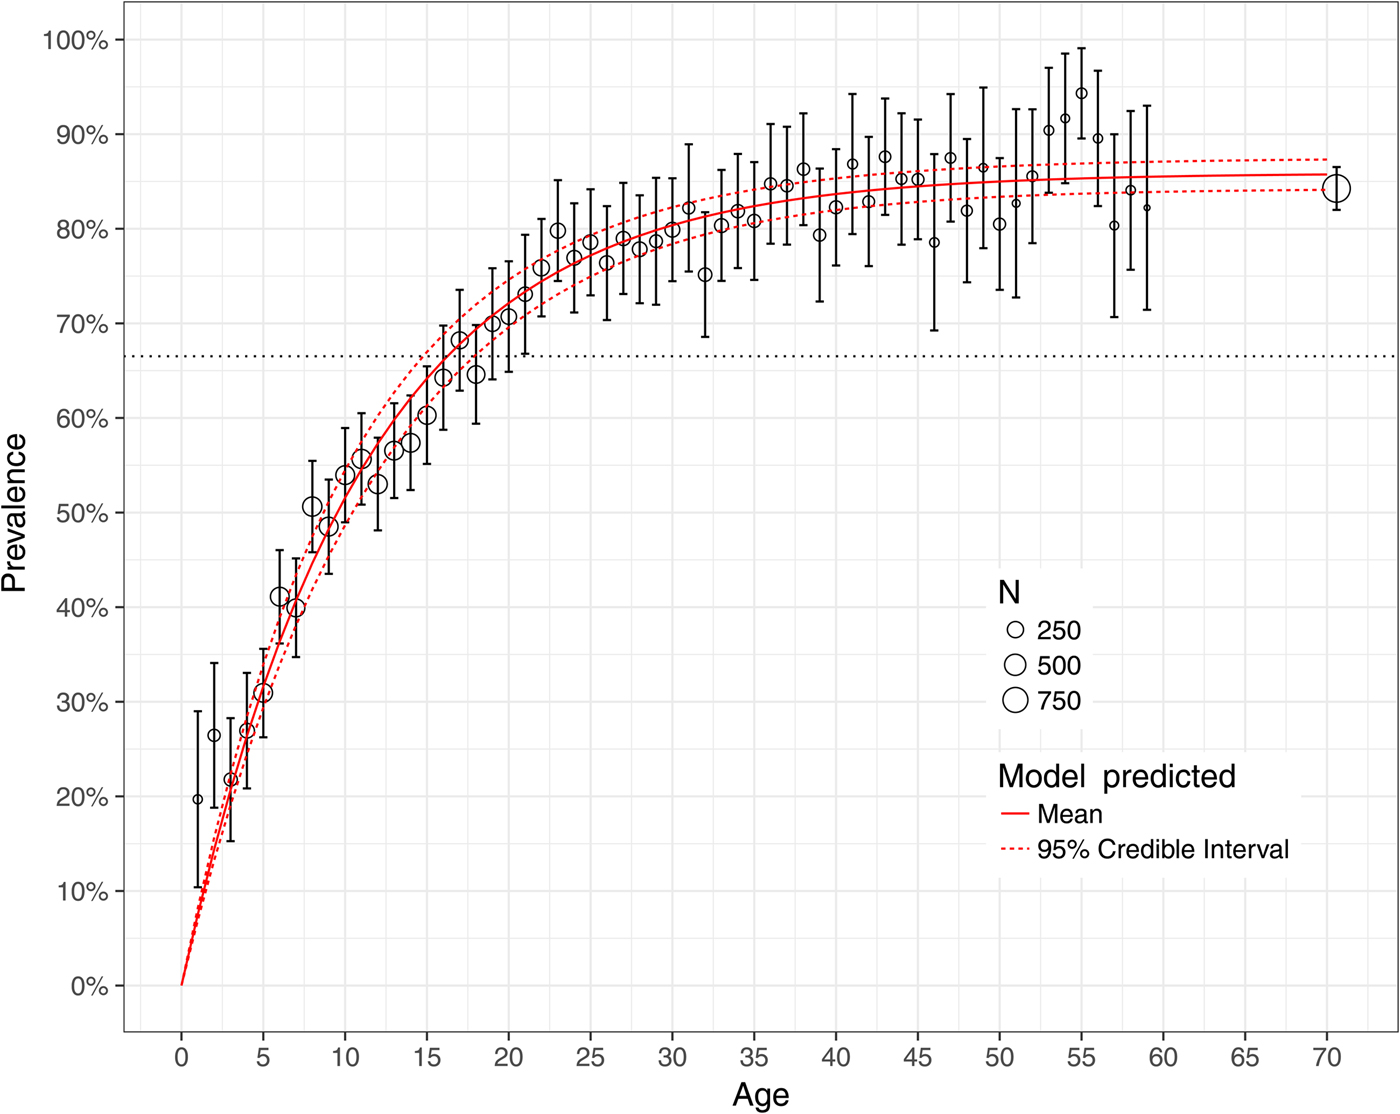
Figure 5 shows the observed national prevalence of H. pylori by age in Mexico, together with the model-predicted prevalence. All but three model-predicted prevalence lie between the 95% confidence bounds of the empirical data. For 1- and 2-year olds, the model-predicted prevalence lies below the bounds, favouring lower prevalence than those observed for these ages. Figure 3 shows the observed and model-predicted prevalence of H. pylori by age in four different states with varying amounts of data using both the hierarchical Bayesian and the non-linear least-squares estimation methods. The width of the model-predicted credible bounds is a function of the amount of data used to estimate the state-specific prevalence. States for which more data are available have tighter credible bounds than states with limited data. The predicted prevalence from the non-linear least-squares model are sensitive to small sample sizes overestimating the prevalence on ages for which data are skewed towards infection (state of Baja California Sur) and underestimating the prevalence on ages for which data are skewed towards no infection (state of Nayarit). The hierarchical Bayesian model shrinks the estimated prevalence for states with limited data towards the overall mean. The observed and model-predicted prevalence using both the hierarchical Bayesian and the non-linear least-squares estimation methods for all the geographical states in Mexico is shown in Figure 6.
Model fit to the national prevalence of Helicobacter pylori by age in Mexico in 1987–88. Grey circles denote empirical prevalence with size proportional to sample size, and 95% confidence interval per 1-year age group. The red solid line denotes the model-predicted posterior mean and the red dashed lines denote the 95% credible bounds.
Model fit to the state-specific prevalence of Helicobacter pylori by age in Mexico in 1987–88. Grey circles denote empirical prevalence with size proportional to sample size and 95% confidence interval. The red solid line denotes the model-predicted posterior mean and the red dashed lines denote the 95% credible bounds. The black dotted horizontal line shows the average national H. pylori prevalence.

Force of infection
Figure 7 shows the model-predicted national force of infection of H. pylori by age in Mexico. The force of infection starts at 0.08 right after birth and decreases to zero as age increases. Like α and γ, the state-specific force of infection varies considerably across states (Fig. 8). At birth, estimates of the force of infection were as high as 0.10 (Chiapas and Chihuahua) and as low as 0.04 (Colima and Veracruz).
Model-predicted national force of infection of Helicobacter pylori by age in Mexico in 1987–88. The solid line denotes the model-predicted posterior mean and the dashed lines denote the 95% credible bounds.

Model-predicted state-specific force of infection of Helicobacter pylori by age in Mexico in 1987–88. The solid line denotes the model-predicted posterior mean and the dashed lines denote the 95% credible bounds.

Discussion
In this study, we used a catalytic model to estimate the force of infection of H. pylori in Mexico at the national level, but also at the state level. Catalytic models have been previously used to estimate the force of infection of other diseases but have not been previously applied to H. pylori. We found that age-specific prevalence of H. pylori varies greatly by state. The hierarchical Bayesian approach used to estimate the catalytic model of H. pylori allowed us to account for state-specific heterogeneity in the force of infection. Specifically, by borrowing information between states, we obtained better inference for undersampled states and quantified the variation across states. In addition, we found great variation in the proportion of the population that can be infected (i.e. the asymptote parameter α) and the constant rate of infection among the susceptible population (i.e. the rate parameter γ). These contrasting differences translate into high variation in the force of infection, which can have implications in the prevention and treatment strategies and highlights the need of state-specific interventions.
The model-predicted force of infection is comparable with the results seen in previous research. For example, the estimated force of infection at 8 years old is 7% (95% CR 6.4%–7.5%) and at 11 years old is 6.4% (95% CR 6.0%–6.9%), which are similar estimates to the annual incidence rates of 6.56% (95% CI 4.6%–8.53%) in 5–8 years old and 6.01% (95% CI 3.52%– 8.5%) in 9–13 years old obtained by observing H. pylori incidence over time in Mexican school children who initially tested negative for the infection [Reference Duque29]. Another study estimated an annual infection rate of 19.84% (95% CI 16.43–23.25%) from birth to 2 years old in a cohort of children in El Paso, Texas, and Ciudad Juarez (Chihuahua), which is consistent with our assumption that the force of infection is highest at birth and decreases with age [Reference Goodman30].
Our study has several limitations. We imposed a constrained exponential functional form on the cumulative probability of infection, which may have overly restricted our parameter estimates and the predicted force of infection. For example, the model-predicted H. pylori prevalence consistently falls below observed prevalence for children under 2 years old, nationally and for many states, which may indicate that the force of infection at these ages is being underestimated. A more flexible catalytic model, such as a piecewise or a spline model, could have provided a better fit to the data [Reference Hens31]. However, by using these more flexible models, we lose the ability to link the model parameters directly to the disease process. We also assumed that the Mexican population is in endemic equilibrium with respect to H. pylori infection, which means that the force of infection does not change over time. While antibiotic treatment for H. pylori was not widespread prior to 1991 [Reference González-Piñera32, Reference Sacre Hazouri33], this assumption could still be violated if other factors related to H. pylori transmission, such as improved sanitation, have changed prior to 1987 (the year when the National Seroepidemiological Survey started collection). However, if new seroepidemiological data were collected in Mexico, we could apply our model to assess if the force of infection of H. pylori has changed over time because of antibiotic treatment, cohort effects or changes in other socio-demographic variables. In addition, we assumed that disease-related mortality is negligible compared with all-cause mortality. This would seem reasonable in the case of H. pylori, but because it is a carcinogenic agent, there is a small fraction of the infected population that will develop gastric cancer and face an elevated mortality risk. However, out of the total number of deaths in Mexico between 1987 and 1988 (819 900 deaths), 8143 deaths were attributed to gastric cancer, which only accounted for <1% of all deaths in Mexico in that period [34]. Since the proportion of the population that can be infected and the constant rate at which they become infected vary by state, such variation could reflect some degree of spatial autocorrelation. However, in an exploratory evaluation of spatial autocorrelation using the global Moran's I test [Reference Moran35, Reference Bivand, Pebesma, Gómez-Rubio, Gentleman, Hornik and Parmigiani36], we estimated a Moran's I statistic of 0.06 (P = 0.18), suggesting little spatial autocorrelation. Furthermore, state-specific risk factors (such as level of sanitation, education, etc.) might be stronger predictors of these state-level variations than the spatial configuration of the states. However, we plan to address these limitations in future work. Despite these limitations, we believe that our estimates of the force of infection are reasonable interpretations of the national seroepidemiological data.
Although we found and quantified the high variation across states, we did not explain potential sources for this variation. Some of the state-level explanatory variables might include level of socio-economic development, sanitation, education and percentage of population living in rural areas. These factors could be used to model both the asymptote (α) and the rate of infection (γ) parameters. Mexico has high socio-demographic variation in its states, so the estimated influence of state-level characteristics on the force of infection might be relevant to other Latin American countries. This, however, is a topic of further research.
While our analysis relied on data specifically from Mexico, there are many other LMICs that face a similar burden of H. pylori and gastric cancer [Reference Peleteiro37, Reference Pounder and Ng38]. Many of these countries are in Latin America and likely have similar transmission dynamics [1].
Serological data for other types of infections have been used to estimate the parameters of dynamic transmission models [Reference Metcalf39, Reference Brisson40] that are then used to estimate the effectiveness and cost-effectiveness of different treatment or vaccination strategies [Reference Brisson and Edmunds41, Reference Edmunds, Brisson and Rose42]. The methodology and results of our study could be used to estimate the transmission parameters for dynamic transmission models of H. pylori to evaluate different screen-and-treat strategies or estimate the benefits of potential vaccines, which are currently under development [Reference Blanchard and Czinn43]. Identifying populations at greatest risk of H. pylori infection will further the development of appropriately targeted prevention, screening and treatment strategies.
Acknowledgements
Financial support for this study was provided in part by a grant from the National Council of Science and Technology of Mexico (CONACYT) and a Doctoral Dissertation Fellowship from the Graduate School of the University of Minnesota as part of Dr Alarid-Escudero's doctoral program. Dr Enns was supported by a grant from the National Institute of Allergy and Infectious Disease of the National Institutes of Health under award no. K25AI118476. The funding agencies had no role in the design of the study, interpretation of results or writing of the manuscript. The content is solely the responsibility of the authors and does not necessarily represent the official views of the National Institutes of Health. The funding agreement ensured the authors’ independence in designing the study, interpreting the data, writing and publishing the report.
Declaration of Interest
None.
Disclaimers
None.