

Introduction
Climate change does not only threaten species, but also world food security (Rosenzweig and Parry, Reference Rosenzweig and Parry1994). Major crops are already becoming severely affected by climate change-induced events such as droughts, floods, new pests and diseases (Kang et al., Reference Kang, Khan and Ma2009; FAO, 2016) and having considerable impacts on agricultural production (IPCC, Reference Field, Barros, Dokken, Mach, Mastrandrea, Bilir, Chatterjee, Ebi, Estrada, Genova, Girma, Kissel, Levy, MacCracken, Mastrandrea and White2014). The arctic, boreal and alpine regions, which cover most of the Nordic land area, are particularly vulnerable to effects of climate change on biodiversity and agriculture and the spread of pests and pathogens northwards (IPCC, 2007; Lindner et al., Reference Lindner, Maroschek, Netherer, Kremer, Barbati, Garcia-Gonzalo, Seidl, Delzon, Corona, Kolström, Lexer and Marchetti2010; Bebber et al., Reference Bebber, Ramotowski and Gurr2013; Juhola et al., Reference Juhola, Kleinc, Käyhkö and Schmid Neset2017).
Part of the solution to these challenges is provided by wild species related to crops, which harbour useful traits for food and forage crop improvement (Maxted and Kell, Reference Maxted and Kell2009; Helgadóttir et al., Reference Helgadóttir, Østrem, Collins, Humphreys, Marshall, Julier, Gastal, Barre, Louarn, Roldán-Ruiz, Baert and Reheul2016; Dempewolf et al., Reference Dempewolf, Baute, Anderson, Kilian, Smith and Guarino2017). However, many crop wild relatives (CWR) themselves are threatened and under-represented in species conservation programmes as their potential importance is not known or recognized (Ford-Lloyd et al., Reference Ford-Lloyd, Schmidt, Armstrong, Barazani, Engels, Hadas, Hammer, Kell, Kang, Khoshbakht, Li, Long, Lu, Ma, Nguyen, Qiu, Ge, Wei, Zhang and Maxted2011), and are themselves susceptible to climate change (Jarvis et al., Reference Jarvis, Lane and Hijmans2008a). The importance to conserve Plant Genetic Resources for Food and Agriculture (PGRFA) and their CWR has been recognized in many international treaties such as the CBD Strategic Plan for Biodiversity 2011–2020 (CBD, 2010), the International Treaty on Plant Genetic Resources for Food and Agriculture (FAO, 2001) and the Global Plan of Action for Plant Genetic Resources for Food and Agriculture (FAO, 2011).
The Nordic region consists of five countries in Northern Europe: Denmark, Finland, Iceland, Norway and SwedenFootnote 1. The region has relatively low species diversity with approximately 3580 vascular plant taxa (Dyntaxa, 2016). However, wild species of the region are likely to harbour unique traits due to the extreme climate conditions and remote location. Several species growing in the Nordic region are at the edge of their distribution range, with distinct subspecies occurring in the area. Peripheral populations such as these can be genetically distinct from central populations and may have traits allowing adaptation to environmental change, as Lesica and Allendorf (Reference Lesica and Allendorf1995) suggest. The numerous isolated islands of the region may contain unique intraspecific diversity, as described by Whittaker and Fernandez-Palacios (Reference Whittaker and Fernandez-Palacios2007) and Hargreaves et al. (Reference Hargreaves, Maxted, Hirano, Abberton, Skøt and Ford-Lloyd2010).
The Nordic region has a long history of collaboration strengthened by the formation of the Nordic Council in 1952. One example of Nordic cooperation is the Nordic Genetic Resource Center (NordGen), which houses regional plant genetic resource collections. Although NordGen secures regional genetic resources ex situ, further efforts to secure regional CWR in situ are warranted. The aim of this study was to build on Nordic synergies to conserve wild species related to agricultural crops in situ. Regional conservation planning provides complementary and cost-efficient solutions for Nordic CWR conservation along with networking opportunities that benefit both regional and national activities. The rationale for taking a regional approach for CWR conservation has previously been discussed by Maxted (Reference Maxted2003) and Kell et al. (Reference Kell, Ford-Lloyd, Magos Brehm, Iriondo and Maxted2017). We present here the methods and results of regional CWR conservation planning which included preparation of a CWR checklist and priority lists, an in situ conservation analysis and suggestions for regional in situ conservation of CWR taxa.
Methods
Regional CWR species checklist
When planning the conservation of Nordic CWR diversity, we prepared a consolidated checklist of Nordic CWR taxa (Fitzgerald et al., Reference Fitzgerald, Aronsson, Asdal, Endresen, Kiviharju, Lund, Palmé, Rasmussen, Weibull and Þorbjörnsson2017a) by matching crop genera with Nordic vascular plant genera. We applied a broad definition of CWR (Maxted et al., Reference Maxted, Ford-Lloyd, Jury, Kell and Scholten2006), where all the species in the same genus as a crop are given CWR status. We matched the Nordic vascular plant genera with a global crop genera list because all countries are interdependent on the use and conservation of plant genetic resources and most countries are dependent on crops whose primary regions of diversity are elsewhere (Maxted and Kell, Reference Maxted and Kell2009; Khoury et al., Reference Khoury, Achicanoy, Bjorkman, Navarro-Racines, Guarino, Flores-Palacios, Engels, Wiersema, Dempewolf, Ramírez-Villegas, Castañeda-Álvarez, Fowler, Jarvis, Rieseberg and Struik2013). The Nordic flora includes genetic resources of wild species related to crops used in other parts of the world and likewise many crops cultivated in Nordic countries have not originated from the area.
The Nordic vascular plant list was compiled from national sources, but follows common taxonomy from Dyntaxa (2016). The national sources were Dyntaxa (2016) for Sweden, Lid and Lid (Reference Lid and Lid2005) for Norway, Lampinen and Lahti (Reference Lampinen and Lahti2016) for Finland, Atlas Florae Danica (Hartvig, Reference Hartvig2015) for Denmark and the ‘List of flowering plants and ferns on Island’ (Kristinsson, Reference Kristinsson1998) for Iceland. The crop genera list came from several sources: lists of medicinal, ornamental and forestry crops (IPK, 2003), food crops (FAO, 2001, 2005; Groombridge and Jenkins, Reference Groombridge and Jenkins2002; EU, 2016) and forage crops Feedipedia, 2016; NordGen, 2016). The lists were taxonomically harmonized. The Nordic CWR checklist was reduced by removing hybrid and temporary species as well as those recently introduced species present in the Nordic region for <10 generations. Taxonomic experts were consulted to determine whether the species were established <10 generations. The indigenous, naturalized and temporary species status was found from the national and regional floras. Taxa considered indigenous or naturalized in at least one of the five countries were included.
Prioritization among CWR
The Nordic regional CWR checklist was subsequently prioritized by selecting wild relatives of food and forage crops with the greatest use potential. Fig. 1 illustrates the prioritization steps. Widely used prioritization criteria such as ‘socio-economic value of crops’ and ‘potential value of wild relatives for variety improvement’ (Kell et al., Reference Kell, Ford-Lloyd, Magos Brehm, Iriondo and Maxted2017) formed the basis for prioritization. First, wild species related to ornamental, forestry and medicinal crops were removed from the analysis, and species related to food and forage crops were selected for the prioritization process. The wild species related to food and forage crops were selected due to their role in food security as a source of traits when developing new varieties and adapting crop species to changing conditions such as climate change or new pests and diseases (Maxted and Kell, Reference Maxted and Kell2009; Dempewolf et al., Reference Dempewolf, Baute, Anderson, Kilian, Smith and Guarino2017).
Nordic region crop wild relative prioritization process.

The second prioritization step was carried out separately for food and forage wild relative groups. The food wild relatives were prioritized based on global monetary values derived from FAO production values (FAO, 2015) for an average 10-year period. Both global and Nordic regional average gross production values in million US$ for the years 2004–2013 were calculated and applied to all wild species related to the food crop genera. Those crop genera having an average global gross production value more than US$200 million, were selected.
Data for the prioritization of the forage crops were collected in consultation with experts. A questionnaire was sent to breeders and other experts from each country, setting a priority for each forage genus in relation to importance and value in breeding and the scale of cultivation at a national level. National priority was estimated by breeders/experts for each Nordic country according to the following procedure. Top priority (Group 1) was given to genera with forage species that are commercially very important, are subject to active breeding in that country and are extensively cultivated. High priority (Group 2) was given to genera with forage species that are important, may be subject to active breeding in that country and are actively cultivated, but not included in Group 1. Low priority (Group 3) was given to genera with forage species which are considered less important for forage production and where there is no active breeding. A regional priority level was calculated from the countries’ responses and those species having the highest average across Nordic countries were selected.
The third part of the prioritization included applying the gene pool (GP) (Harlan and de Wet, Reference Harlan and de Wet1971) and taxon group (TG) (Maxted et al., Reference Maxted, Ford-Lloyd, Jury, Kell and Scholten2006) concepts. GP and TG group data were obtained from the Harlan and de Wet Crop Wild Relative inventory (Vincent et al., Reference Vincent, Wiersema, Dobbie, Kell, Fielder, Castaneda, Guarino, Eastwood, Leon and Maxted2013; Crop Trust, 2016) and GRIN Global Taxonomy, World Economic Plants Database (USDA, 2016). Those wild species belonging to the primary (GP1b) and secondary (GP2) GPs of the crop and those in primary (TG1b) and secondary (TG2) TGs were prioritized. The taxa of the tertiary GP (GP3) or tertiary TG (TG 3 and 4) with proven use or potential use in plant breeding were also prioritized.
Complementarity conservation analysis
The aim of the in situ conservation analysis was to find potential genetic reserve sites (Maxted et al., Reference Maxted, Hawkes, Hawkes, Williams, Maxted, Ford-Lloyd and Hawkes1997) for in situ conservation of priority CWR species in the Nordic countries. We used a method that combined a complementarity analysis, described by Rebelo (Reference Rebelo and Huntley1994), with an ecogeographic land characterization (ELC) map of the region (Parra-Quijano et al., Reference Parra-Quijano, Iriondo and Torres2012). The complementarity analysis is used to identify the minimum number of sites where a maximum number of target species occur (Maxted et al., Reference Maxted, Dulloo, Ford-Lloyd, Iriondo and Jarvis2008).
An ELC map is produced by multivariate analysis and delineates areas with similar environmental characteristics. ELC maps can therefore be used for various purposes in agrobiodiversity conservation to provide information on ecogeographic scenarios to assess plant adaptation in relation to the prevailing environmental conditions (Parra-Quijano, Reference Parra-Quijano, Iriondo and Torres2012). The idea behind combining the complementarity conservation analysis and the ELC map is that by conserving sites that reflect the ecogeographic variation of a species geographic distribution, we are conserving a broad range of genetic diversity that has adaptive importance. This potentially conserves the variation of genes of most interest for crop improvement (Maxted et al., Reference Maxted, Magos Brehm and Kell2013). As a part of the ecogeographic analysis, multi-species taxon richness and sampling bias maps were also created to provide additional information on the distribution data used. The maps were created using distribution data of priority species on DIVA-GIS (Hijmans et al., Reference Hijmans, Guarino and Mathur2012), with a cell size of 0.1 degrees.
Relevant climatic, ecological and geographical data influencing target species adaptation were selected. Altogether nine variables from edaphic (HWS Database, 2012), geophysical (Reuter et al., Reference Reuter, Nelson and Jarvis2007; Jarvis et al., Reference Jarvis, Reuter, Nelson and Guevara2008b) and bioclimatic (Hijmans et al., Reference Hijmans, Cameron, Parra, Jones and Jarvis2005; Worldclim, 2016; Fick and Hijmans, Reference Fick and Hijmans2017) categories were selected to represent the target species adaptation (Table 1). The selection was based on variable selection used in the Norwegian diversity analysis (Phillips et al., Reference Phillips, Asdal, Magos Brehm, Rasmussen and Maxted2016) and modified by national experts’ advice to suit the entire Nordic region. The selected variables included average annual rainfall, average annual temperature, soil depth, organic carbon content in surface soil, pH in soil water solution of surface soil, elevation (asl.), slope and aspects (North and East). The ELC map was created using the Capfitogen ELC map tool (Parra-Quijano, Reference Parra-Quijano2016). The parameters selected included latitude, elbow method, 5 arc-minute and four clusters allowed by each bioclimatic, edaphic and geophysical component, following the description in Parra-Quijano et al. (Reference Parra-Quijano, Torres, Iriondo and López2014). For those cells where an ELC category was not assigned due to lack of variable data, the ELC category was assigned by extracting values from the nearest cell. This was done with a maximum distance of 15 km to the border of the nearest cell.
Environmental variables used for creating ELC map for the Nordic priority CWR

Several tools were used in the complementary conservation analysis for analysing data and displaying results: Capfitogen tools (Parra-Quijano, Reference Parra-Quijano2016), DIVA (Hijmans et al., Reference Hijmans, Guarino and Mathur2012) and ArcGIS (ESRI, 2015). Target species distribution data were obtained from the Global Biodiversity Information Facility (GBIF), and national sources. These included GBIF (2016a) for Norway, GBIF (2016b) for Sweden, Lampinen and Lahti (Reference Lampinen and Lahti2016) for Finland, GBIF (2016c) for Denmark and GBIF (2016d) and the database of the Icelandic Institute of Natural History (2016) for Iceland. The occurrence data were filtered by removing duplicate records, setting the georeferenced quality to a maximum of 1 km and checking for outlier locations. For each species occurrence point, only the most recent observation record was selected. Observations dated before year 1990 were discarded if the species had not been observed in that location since. The occurrence data types included observation, herbarium and gene bank data. Analysis was made on a species level. Altogether 971,633 occurrence records of priority species from the five Nordic countries were standardized into the Capfitogen format (Parra-Quijano, Reference Parra-Quijano2016), based on FAO/Bioversity Multi-Crop Passport Descriptors (Alercia et al., Reference Alercia, Diulgheroff and Mackay2012).
The Finnish plant distribution records were available on a 1 km2 grid system instead of a coordinate format. Therefore, centroids of the grid squares had to be calculated and transferred into coordinate points. If the grid square was only partly inside the country boundary and the species distribution point was near the edge of the boundary, the observation points were inadvertently not included in the analysis. This was a particular problem on the Southern coastline and archipelago species-rich areas. The solution was to assign new coordinates to the closest land point.
For the ecogeographic complementary analysis, the Capfitogen Complementary tool (Parra-Quijano, Reference Parra-Quijano2016) was used with the ELC map to find potential genetic reserve locations. Two separate analyses were performed. First, a grid cell complementarity analysis for the whole land area of the Nordic countries was performed on a resolution of 5 arc-minutes (approximately 10 km grids). Second, a protected area (PA) complementarity analysis was carried out by selecting sites within PAs, using the data from World Database of Protected Areas (UNEP-WCMC and IUCN, 2016) on resolution of 30 arc-seconds (1 km2). All types of PAs were included in the analysis (i.e. National Parks, National Reserves and protected landscapes).
Results
CWR inventory and prioritization
A regional CWR checklist for the Nordic countries was created including 2553 CWR taxa (Fitzgerald et al., Reference Fitzgerald, Aronsson, Asdal, Endresen, Kiviharju, Lund, Palmé, Rasmussen, Weibull and Þorbjörnsson2017a), which is about 70% of the total Nordic vascular plant flora. The final checklist consists of native, archaeophyte and established neophyte vascular plant species occurring in the Nordic region. According to Kalliola (Reference Kalliola1973), the species introduced to the Nordic region before 17th century are considered archaeophytes and afterwards neophytes. Approximately one-third of the regional checklist taxa are related to food and forage crops only. However, the majority of CWR taxa are related to multiple crop types, for example, apple (Malus) and cherry (Prunus) species which are related to medicinal, food, forestry and ornamental crop categories.
Altogether the Nordic CWR priority list includes 114 taxa (online Supporting information 1). These include 83 species from 35 genera representing wild relatives of eight crop groups: vegetables, cereals, fruits, berries, nuts, and grass and legume forages. The vegetable group includes species related to Brassica, onion, lettuce, carrot and field/broad bean. The cereals include wild relatives of oat and millet. The fruit group includes wild relatives of fruit trees such as apple, pear, cherry, apricot, almond and plum. Wild relatives of cultivated berries are one of the largest groups, and include strawberry, raspberry, blackberry, blueberry, lingonberry, cloudberry, black currant and red currant. Nut relatives include wild hazelnut and walnut. The forage wild relatives can be divided into forage legumes and forage grasses and include species from many genera such as Trifolium, Poa, Festuca, Phleum, Lolium and Medicago. The priority taxa crop GP and TG concepts and the distribution classes in Nordic countries are listed in Fitzgerald et al. (Reference Fitzgerald, Aronsson, Asdal, Endresen, Kiviharju, Lund, Palmé, Lund, Rasmussen, Weibull and Þorbjörnsson2017b).
Species richness and sample bias maps
Multi-species taxon richness and sampling bias maps were created for the 83 priority species. The species richness map (online Supporting information 3) shows a pattern of higher richness in the southern parts of the region and lower richness in the northern parts. Naturally species-poor areas include Vatnajökull glacier in Iceland and Jostedalsbreen glacier in Norway along with many larger lakes and mountainous areas of the region. The sampling bias map (online Supporting information 4) shows fewer sampled areas in the Northern parts of Norway, Finland and Sweden, particularly in Finnmark County and highly sampled areas around larger cities such as Copenhagen, Helsinki, Oslo, Oulu and Stockholm.
ELC maps
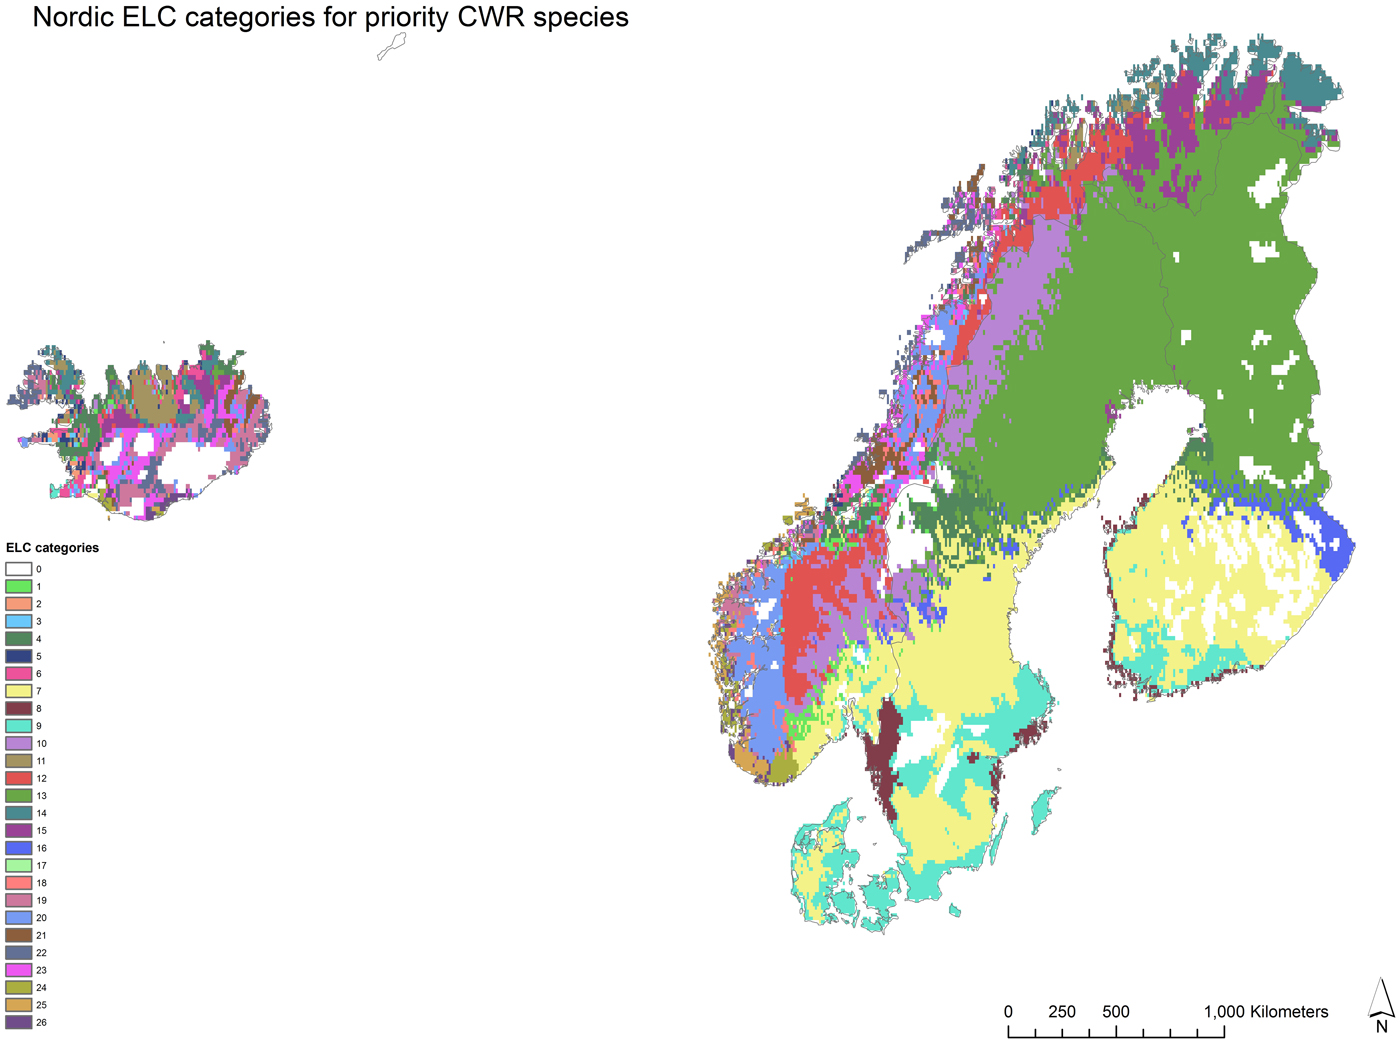
The Nordic ELC map contains 26 ecogeographic categories (Fig. 2 and online Supporting information 2). These zones reflect potential adaptation of the priority species in the Nordic region based on bioclimatic, geophysical and edaphic characteristics. The ELC map was used in Capfitogen's Complementary tool to find complementary in situ conservation areas that potentially reflect the intraspecific variation of the priority CWR based on the genetic adaptation to different environments.
The Nordic region ecogeographic land characterization (ELC) map with 26 ELC categories. The ELC categories represent different environments based on bioclimatic, geophysical and edaphic characteristics. Ecogeographic diversity is used as a proxy for genetic diversity of the priority CWR species in the complementarity conservation analysis. The ELC data analysis was undertaken with Capfitogen ELC map tool, DIVA (Hijmans et al., Reference Hijmans, Guarino and Mathur2012) and ArcGIS 10.3.1. (ESRI, 2015).
Complementarity conservation analysis
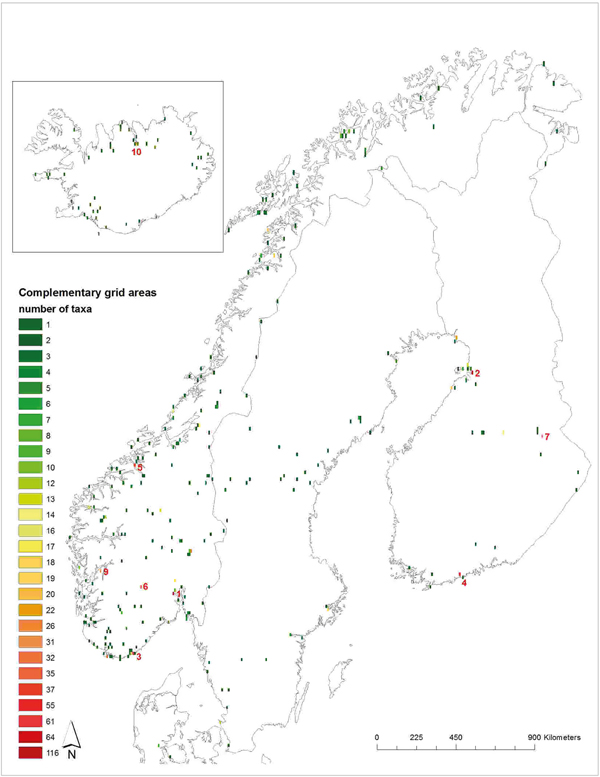
Altogether 971,633 occurrence records of the 83 priority species were analysed in Capfitogen's Complementary tool to find potential genetic reserve locations complementing each other. The results of the grid cell analysis show a network of 299 grid cells (Fig. 3 and online Supporting information 5) needed to conserve all the taxon–ELC zone combinations in at least one location. By using the ELC zones, the within-species diversity is taken into account in the conservation planning. The first complementary cell is closely located to Oslo in Drammen, Norway, and contained 116 priority taxa–ELC combinations. The second cell, in Oulu, Finland, had 64 complementary taxa–ELC combinations which were not found in the first site. The third cell near Kristiansand, Norway, had 61 and the fourth cell is on the border of Helsinki and Espoo cities, while Finland had 55 priority taxa–ELC combinations.
The grid cell complementary network map for the Nordic priority CWR. This map shows the lowest number of geographical grids that can conserve the intraspecific diversity of the target taxa when the ecogeographic diversity is taken as a proxy for genetic diversity. The top 10 cells, containing the largest number of complementary taxa, are labelled. The colour represents the number of CWR priority taxa found in each grid. Detailed information of the sites and species numbers in each location can be found in Supporting information 6. The ELC data analysis was undertaken using Capfitogen ELC map tool, DIVA (Hijmans et al., Reference Hijmans, Guarino and Mathur2012) and ArcGIS 10.3.1. (ESRI, 2015). The Nordic region boundary layers are from Natural Earth data (2016).

The results of the PA complementary analysis showed a network of 162 complementary genetic reserves within existing conservation areas (Fig. 4 and online Supporting information 6 and 7) with altogether 8164 observations of the target species. The first complementary PA site, covering the highest number of target species per ELC zone, was in Aalborg Kommune, Denmark. It contained 88 target species in two ELC zones. Each species is counted separately in different ELC zones, representing the unique ecogeographic diversity of the species in that zone. The second site was the area of the Tornio and Muonio rivers in Northern Finland, a large natural-state river system bordering Sweden. The PA had three ELC zones with 59 complementary target taxa not present in the first site. The third was the Lista Wetlands system, Norway with 46 complementary taxa in two ELC zones. The fourth site was in the Tammisaari and Hanko Archipelago and Pojo Bay marine protection area, Finland, and included three ELC zones containing 42 complementary taxa not present in previous sites. The total number of target taxa in the site was 86.
The protected area complementary network map for the Nordic priority CWR. This map shows the protected areas where the intraspecific diversity of the target taxa could be conserved when the ecogeographic diversity is taken as a proxy for genetic diversity. The sites are marked in a complementary order, starting from the site which has highest number of species–ELC combinations. Detailed information on the sites and species numbers in each location can be found in Supporting information 6. The colours represent the number of complementary taxa per ELC zone ( = ELC category as seen in Fig. 2). The ELC data analysis was undertaken with Capfitogen ELC map tool, DIVA (Hijmans et al., Reference Hijmans, Guarino and Mathur2012) and ArcGIS 10.3.1. (ESRI, 2015). The Nordic region boundary layers are taken from Natural Earth data (2016).

The 83 target species have altogether 822 taxon–ELC zone combinations (online Supporting information 7). The number of target species observations varied from 1 to 25,779, depending on the distribution of the species in the PAs and the ELC zones. The importance of ensuring that viable populations are conserved and maintained in genetic reserves is described by Iriondo et al. (Reference Iriondo, Maxted, Kell, Ford-Lloyd, Lara-Romero, Labokas, Magos Brehm, Maxted, Dulloo, Ford-Lloyd, Frese, Iriondo and Pinheiro de Carvalho2012). With a sufficient number of populations, a taxon is less likely to be destroyed when facing possible adverse effects in situ. If observations are counted as populations and a minimum number of target species populations in in situ conservation is set for five populations (Brown and Briggs, Reference Brown, Briggs, Falk and Holsinger1991; Dulloo et al., Reference Dulloo, Labokas, Iriondo, Maxted, Lane, Laguna, Jarvis, Kell, Iriondo, Maxted and Dulloo2008), 554 out of 822 taxon–ELC zone populations in this study fulfil these criteria. When looking at numbers of species populations in all of the 26 ELC zones, there are only six species (Brassica nigra (L.) W. D. J. Koch, Lactuca quercina L., Lactuca tatarica (L.) C. A. Mey., Prunus mahaleb L., Rubus allegheniensis Porter ex L. H. Bailey, Rubus spectabilis Pursh) having fewer than five populations present in the complementary PAs.
Discussion
Advantage of Nordic regional planning
The results of the floristic analysis of the checklist showed that the same species were largely shared across the Nordic countries and a majority of the prioritized CWR have a wide distribution in the Nordic region. Approximately 80% of the priority taxa are distributed in four or five of the Nordic countries. Similar climate zones and photoperiodic conditions are found across the Nordic countries and the breeding activities and interests are relatively similar. The existence of a working regional administrative body, the Nordic Council of Ministers, as well as a regional gene bank for ex situ conservation, NordGen, adds to the rationale for the Nordic regional approach for planning in situ conservation of CWR. However, the integration of national, regional and global CWR conservation strategies, as described by Maxted et al. (Reference Maxted, Avagyan, Frese, Iriondo, Magos Brehm, Singer and Kell2015), is important. Ideally, these levels should complement and reinforce each other. Other conservation approaches have previously been successfully integrated into a multi-level system, such as the Natura 2000 network in Europe.
Nordic species checklist and priority list
The Nordic species checklist is an extensive list including all CWR species connected to food and fodder crops in the region (Fitzgerald et al., Reference Fitzgerald, Aronsson, Asdal, Endresen, Kiviharju, Lund, Palmé, Rasmussen, Weibull and Þorbjörnsson2017a). It is publically available and can be used both for national planning in each of the Nordic countries and regional planning on the Nordic level as well as into larger scale regional (European) and global conservation planning and analysis.
Prioritizing among taxa on the checklist provided a more cost-effective way to plan in situ conservation on both national and regional levels. The most important CWR species of the region, regarding value and utilization potential, have been included in the priority list. We argue that the Nordic region has a collective responsibility to conserve the priority CWR growing in the region. These are, for example, the wild relatives of cultivated berries, forages and vegetable species.
Identifying Nordic in situ conservation sites
The results from the complementarity conservation analysis suggest how priority CWR could be conserved in situ. A complementarity approach in conservation planning and reserve selection is a widely used method in designing conservation area networks (Rebelo, Reference Rebelo and Huntley1994; Margules and Pressey, Reference Margules and Pressey2000; Kukkala and Moilanen, Reference Kukkala and Moilanen2012). Genetic reserves are conservation areas set up with the specific purpose of long-term conservation of genetic diversity, and quality standards have been set up on how to best conserve CWR in genetic reserves (Iriondo et al., Reference Iriondo, Maxted, Kell, Ford-Lloyd, Lara-Romero, Labokas, Magos Brehm, Maxted, Dulloo, Ford-Lloyd, Frese, Iriondo and Pinheiro de Carvalho2012). We took two approaches in planning the regional in situ genetic reserve network for Nordic countries: the grid cell complementary network and the PA complementary network. In both options, we used the ELC map of the region to identify not only complementary areas to conserve target CWR species, but to maximize ecogeographic diversity, to better capture and conserve potential intraspecific diversity based on presumed adaptation to diverse environments.
In the grid cell complementary analysis, many top cells (geographic areas having the highest CWR diversity) were situated near larger cities, a partial result of an observation bias. Overall, the cells were situated relatively evenly over the region. However, the number of cells in southern and western Norway exceeded the number of cells in other countries. Even the least observed area Finnmark, northern Norway, had several complementary cells. This can be attributed to the distribution pattern of ELC zones over the region and Norway having more ELC zones. This may be further explained by Norway demonstrating more variation in the selected climatic, ecological and geographical variables than other countries. Iceland had more ELC categories than either Denmark, Finland or Sweden. Iceland had a relatively large number of complementary cells considering that fewer target species occur in Iceland than in other countries. This was at least partly due to several unique ELC categories. Whereas the land areas of Sweden and Finland were more homogeneous, there was still a distinct division into several different ELC zones. Denmark, however, is covered by only one ELC zone. In conclusion, it is not possible to aim for even geographic distribution of complementary cells in the analysis as the bioclimatic conditions along with the observation level and distribution of species determine the locations of the cells. If the grid cell approach was to be developed further, a closer look at the urbanization and land use would show where the genetic reserves could be situated since many high diversity cells are located within, or in the vicinity of, larger cities.
The goal of the PA complementary network analysis was to identify sites for genetic reserves within existing PAs. The genetic reserve sites were located relatively evenly around the region. However, the southern and western parts of Norway and Sweden seemed to have a dense network of complementary sites. While the top sites had the highest number of complementary species, the entire network of sites is important because each ELC class represents a specific environment, thus valuable for capturing specific ecotypic variation. Some sites with fewer complementary species nevertheless had a large total number of species. Furthermore, the proposed sites were located within designated PAs. The PA network approach had the advantage that it identified CWR species in already established conservation sites and therefore no new conservation areas need to be established. However, if a PA is to be established as a genetic reserve, a more detailed study would need to be conducted to determine the most appropriate PAs to support such a reserve, validate and inventory CWR species within the PA, identify the most appropriate populations to conserve and establish management and monitoring plans for the populations according to available guidelines (such as Iriondo et al., Reference Iriondo, Maxted, Kell, Ford-Lloyd, Lara-Romero, Labokas, Magos Brehm, Maxted, Dulloo, Ford-Lloyd, Frese, Iriondo and Pinheiro de Carvalho2012).
Conservation recommendations
In conclusion, based on the results of the analysis, we suggest the following conservation measures for Nordic CWR:
• Investigate how to continue to harmonize future regional and national conservation actions in the Nordic countries with an aim of implementing more efficient conservation actions;
• Increase efforts to collect distribution data of target species, especially in insufficiently sampled areas and for species which have fewer than five populations in the complementary PA network;
• Assess the suitability of the PAs found to be complementary sites for CWR species, for establishment of genetic reserves;
• As a first step, establish one genetic reserve per Nordic country to gain experience, evaluate currently suggested management plans and policy constraints; and
• Ensure free and open access to CWR data sources for open validation and reuse of species occurrence data for other purposes through platforms such as the GBIF.
Currently, there is an ongoing process to produce a common Nordic report on conservation planning, including recommendations on future in situ as well as ex situ actions to safeguard the CWR genetic resources in the region. It will be available via the Nordic CWR homepage (http://www.nordgen.org/cwr) where other CWR information and conservation planning tools can be found. A policy brief has been produced focusing on CWR and actions needed in the Nordic region to assure long-term conservation of CWR (http://www.nordgen.org/ngdoc/NordicCWR_2016/Policy%20brief.pdf).
Supplementary material
The supplementary material for this article can be found at https://doi.org/10.1017/S147926211800059X.
Acknowledgements
We would like to thank the Nordic Council of Ministers for providing funding; Mora Aronsson for providing taxonomic data and assistance; Raino Lampinen, Pawel Wasowicz and GBIF for providing species distribution data; Mauricio Parra-Quijano for technical assistance with Capfitogen tools and Jade Phillips for assistance in diversity analysis.


 Open access