


Introduction
For the past decades there has been extensive research on the development of metaphorical abilities (e.g., Di Paola et al., Reference Di Paola, Domaneschi and Pouscoulous2020; Pouscoulous, Reference Pouscoulous2011; Vosniadou, Reference Vosniadou1989; Vosniadou et al., Reference Vosniadou, Ortony, Reynolds and Wilson1984; Winner et al., Reference Winner, Rosenstiel and Gardner1976). At the core of this research is the question of the earliest age at which children have the necessary skills to appropriately interpret a metaphor. While older studies claimed that this ability developed relatively late (10 to 12 years old) (Asch & Nerlove, Reference Asch, Nerlove, Kaplan and Wapner1960; Cometa & Eson, Reference Cometa and Eson1978; Smith, Reference Smith1976; Winner et al., Reference Winner, Rosenstiel and Gardner1976), recent studies have challenged this idea and shown that even 3-year-olds are able to understand (certain types of) metaphors (Di Paola et al., Reference Di Paola, Domaneschi and Pouscoulous2020; Pouscoulous & Tomasello, Reference Pouscoulous and Tomasello2020).Footnote 1 Pouscoulous (Reference Pouscoulous and Matthews2014) argues that what brought about the results in the earlier literature was a mix of task-induced complexity (e.g., experimental paradigms that were not child-friendly), uneven test materials (e.g., mixing idioms and metaphors or testing both novel and conventional metaphors together), uneven conceptual knowledge requirements (e.g., testing both psychological and perceptual metaphors together), and a lack of adequate context. This reasoning led Pouscoulous and Tomasello (Reference Pouscoulous and Tomasello2020) to show that simple perceptual metaphors such as the tower with the hat (said of a tower with a pointy roof) are mostly interpreted in the correct metaphorical way by 3-year-olds when using an age-appropriate task.
Despite this critical finding, several questions remain unanswered. For example, can the non-perceptual novel metaphors typically investigated in the older literature such as the prison guard is a rock (so-called predicative nominal metaphors of the form ‘X is a Y’) also be grasped at a younger age when using child-appropriate tasks and materials, or is metaphor interpretation at a younger age bound to simple perceptual metaphors? Further, beyond investigating the earliest point of success, what does the developmental trajectory of metaphor interpretation look like? Few studies have systematically tested an age range sufficient to probe a developmental trajectory of metaphor. This question is of renewed importance considering recent findings on the interpretation of novel metonymy (e.g., The hat is sitting in the corner) suggesting a non-lineal (U-shaped) developmental trajectory, in which 3-year-olds apparently outperform more literally-oriented 4- and 5-year-olds when tested on this particular type of figurative language use (Köder & Falkum, Reference Köder and Falkum2020). Finally, beyond selecting the correct (metaphorical) image at the end of a trial, how does the online processing of metaphor interpretation develop with age, and what is the relationship between processing and the explicit behavioral response? The importance of this question also relates to the findings of Köder and Falkum (Reference Köder and Falkum2020) on the comprehension of metonymy, where they reported a disassociation in the pattern of results for an online processing measure (gaze behavior time-locked to an unfolding utterance) and the explicit behavioral response at the end of a trial (i.e., picture selection).Footnote 2
We believe that answering these three questions will bring us closer to understanding not just when children are able to successfully deal with metaphorical meaning, but also which types of metaphors (or metaphorical mappings) are the easiest for them and how their interpretation changes ontogenetically. The goal of the current study is thus to tackle these three issues. We developed a child-friendly experimental task to investigate the development of comprehending novel predicative nominal metaphors in Spanish that go beyond perceptual similarities, such as the one illustrated in (1) below.
(1) Grasshoppers jump a lot. That kid is a grasshopper.Footnote 3
By using an eye-tracking, Visual World paradigm (Cooper, Reference Cooper1974; Huettig et al., Reference Huettig, Rommers and Meyer2011; Tanenhaus et al., Reference Tanenhaus, Spivey-Knowlton, Eberhard and Sedivy1995), we were able to capture both children’s (ages 3-9) online metaphor processing as well as their explicit response in a picture selection task. The current work therefore builds a bridge between the older and the more recent studies in metaphor research and provides further avenues of investigation going forward. Before presenting our experiment, we first briefly review the existing literature on the development of metaphor interpretation.
Metaphor interpretation: a developmental overview
The literature on the development of metaphor interpretation is made up of vast variability in experimental tasks and types of metaphors studied. The wide range of results can therefore be challenging to interpret. A recent review of the literature (Falkum, Reference Falkum2022) has done so by distinguishing between (at least) two positions with regards to how young children (younger than 10) interpret novel metaphors: the ‘literal-first’ and the ‘early-bird’ positions.
The literal-first view claims that children have a tendency to interpret metaphors literally, and that it is not until a later age (typically 10 or 12) that they are capable of correctly understanding them. This view is based on various empirical findings (e.g., Asch & Nerlove, Reference Asch, Nerlove, Kaplan and Wapner1960; Cometa & Eson, Reference Cometa and Eson1978; Smith, Reference Smith1976; Vosniadou et al., Reference Vosniadou, Ortony, Reynolds and Wilson1984; Winner et al., Reference Winner, Rosenstiel and Gardner1976). For example, in Vosniadou et al. (Reference Vosniadou, Ortony, Reynolds and Wilson1984), an action metaphor like the little girl was a bird flying to her nest was claimed to be interpreted literally as a girl pretending to be flying. Winner et al. (Reference Winner, Rosenstiel and Gardner1976) asked children to explain psychological metaphors (such as the prison guard was a hard rock) and reported that young children understood them literally (e.g., as describing a fantasy world in which rocks could be prison guards). These and further similar conclusions from the above cited studies are for the most part based on explanation/paraphrasing methodologies. This methodology has since been criticized because it is arguably a task which recruits skills above and beyond those that might be strictly necessary for successful metaphor interpretation (see Pouscoulous, Reference Pouscoulous2011). This is particularly true of tasks involving verbal reasoning, which young children typically struggle with. To this effect, Vosniadou (Reference Vosniadou1987) cites several studies in which children younger than 10 show some grasp of metaphorical language (usually based on perceptual or physical similarity) when tested with multiple choice tasks (Nippold et al., Reference Nippold, Leonard and Kail1984) or enactment tasks (Vosniadou et al., Reference Vosniadou, Ortony, Reynolds and Wilson1984) that do not rely heavily on verbal reasoning abilities. Further, children seem to even be able to explicate the meaning of metaphors when these are based on physical or perceptual similarity (Malgady, Reference Malgady1977). This latter finding is in line with more recent studies suggesting that psychological metaphors such as Dad was a volcano seem to be harder to interpret relative to perceptual metaphors (Lecce et al., Reference Lecce, Ronchi, Del Sette, Bischetti and Bambini2019).
In contrast, the more recent ‘early-birds’ view states that young children (even 3-year-olds) are capable of apprehending metaphors (Deamer, Reference Deamer2013; Di Paola et al., Reference Di Paola, Domaneschi and Pouscoulous2020; Pouscoulous & Tomasello, Reference Pouscoulous and Tomasello2020). Pouscoulous and Tomasello (Reference Pouscoulous and Tomasello2020) showed that in a simple object selection task, 3-year-olds consistently preferred the metaphorical interpretation of the tower with the hat (a tower with a red pointy roof) over the distractor (a tower with a red balcony). Importantly, Pouscoulous and Tomasello made sure that children had the relevant world knowledge skills to interpret these metaphors as such. This design did not include a literal option, and so does not tap into a possible tendency for literal interpretation in young children when facing metaphors. It shows, alongside with the other cited studies, that very young children already possess some of the inferential skills necessary to interpret metaphors.
A critical feature of this study as well as that by Di Paola et al. (Reference Di Paola, Domaneschi and Pouscoulous2020) is the type of metaphors used, which are based on simple perceptual features (e.g., the tower with the hat, the car with the backpack). These are conceptually similar to the type of overextensions and loose uses of language characteristic of toddlers and young children (such as a toddler referring to every old man they meet as grandpa, Vosniadou, Reference Vosniadou1987; or referring to all round things as ball, Clark, Reference Clark and Moore1973; Rescorla, Reference Rescorla1980). Some theoretical accounts treat overextensions as being in a continuum of phenomena together with metaphor which involves lexical broadening resulting in a communicated ad hoc concept (Wałaszewska, Reference Wałaszewska2011; see Wilson & Carston, Reference Wilson, Carston and Burton-Roberts2007, for an outline of the theory of metaphor as ad hoc concept construction). Others see overextensions as early precursors to fully-fledged metaphors – in both cases a broadened concept is constructed based on properties associated with the conventional denotation of the chosen expression (which are typically perceptual in the case of overextension and early metaphors) – the main difference between the two being whether the speaker’s violation of the conventional category boundary is intentional or not (Falkum, Reference Falkum, Scott, Clark and Carston2019; Pouscoulous, Reference Pouscoulous2011). An important question is how children cope with metaphors that are not directly based on perceptual features, and which have less of an affinity with overextension – will they be more difficult for children to handle?
In a recent study looking at perceptual metaphors, children were asked to choose between the picture of a girl who looks like a parrot (metaphorical target), a distractor, and a picture of a parrot (literal competitor) when hearing an utterance such as Lucy is a parrot (Long et al., Reference Long, Shukla and Rubio-Fernández2021). When including such a literal competitor, results point to a literal bias from 3 to 6 years old, which is not observed for thirteen year olds, who served as an older comparison group. Importantly, this is still a child-friendly task which does not involve the complexities mentioned in the previous section, tentatively suggesting that there might be differences brought on either by the morphosyntactic properties of the metaphorical expression or by methodological differences, such as the presence of a literal competitor (Winner, Reference Winner1997).
Besides the earliest age of comprehension, it is important to elucidate the developmental trajectory of metaphor interpretation. Few studies to date have assessed a wide range of ages sufficient for evaluating the developmental trajectory of metaphor comprehension. Deamer (Reference Deamer2013) evaluated three-, four-, and five-year-old children and Long et al. (Reference Long, Shukla and Rubio-Fernández2021) evaluated children aged 3-6 and thirteen-year-olds. Performance of participants in Deamer (Reference Deamer2013) suggest a linear maturation, in which metaphor understanding strengthened in each tested age group. Young participants aged 3-, 4-, 5- and 6-years old in Long et al. (Reference Long, Shukla and Rubio-Fernández2021) did not succeed on the metaphor task, potentially due to reasons discussed above. As such the developmental trajectory of predicative metaphors remains underexplored. Recently, Falkum and collaborators (Falkum et al., Reference Falkum, Recasens and Clark2017; Köder & Falkum, Reference Köder and Falkum2020) have suggested the possibility of a U-shaped development of understanding metonymic expressions such as the helmet rides her bike and goes home, or the beard is happy. According to their findings, 3-year-olds show some signs of novel metonymy comprehension, while 4- and 5-year-olds display a preference for literal interpretations of the same utterances, with 6-year-olds reverting to a metonymic interpretation. Falkum and collaborators speculate that these results could be due to an increased sensitivity to the conventional meanings of the constituents of the metonymies. Younger children have flexible category boundaries (Vosniadou, Reference Vosniadou1987), which might allow them to accept metonymic or metaphoric interpretations. As children grow older, they become more sensitive to conventional meanings, i.e., to the fact that there are “correct” and “incorrect” uses of words, rendering the literal option more salient as the “correct” answer. As they continue to develop, children become more aware of how people may use language creatively (and often tend to purposely deviate from the literal-conventional), thus becoming able to grasp figurative meaning. This raises the question of whether such a developmental trajectory would also be present for metaphor interpretation.Footnote 4
Importantly, Köder and Falkum (Reference Köder and Falkum2020) did not rely on a simple object selection task in their study but used a Visual World paradigm. Here, children’s eye-movements were tracked while they heard the target sentences unfold. With this paradigm, they were able to find that 4- and 5-year-old children show a preference for the metonymic interpretation (judging by the proportion of looks to the metonymic picture relative to looks to the literal one), but end up choosing the literal one. This amounts to a degree of dissociation between their online processing (indexed by their gaze behavior) and their end-result interpretation (indexed by the picture they point to at the end of a trial). Considering how such a paradigm has never (to our knowledge) been used to study metaphor development, it is important to investigate differences between processing and final interpretation of metaphor comprehension in order to understand not just the earliest age of adult-like metaphorical interpretation, but also how children’s processing strategies more generally develop with age.
The present study
In the current study, we investigate the developmental trajectory of comprehension of predicative nominal (‘X is a Y’) metaphors that involve an explicit category clash, such as that kid is a grasshopper. We deployed a Visual World, eye-tracking paradigm, which allowed us to test both children’s final interpretation of a metaphor as well as their developing online metaphor processing skills. The goal of our study was three-fold. First, we aimed to investigate how children aged 3-9 comprehend such metaphors when the task is age-appropriate. Are the youngest children able to comprehend them, or is the degree of difficulty something that only older children can master? Second, we aim to describe the developmental trajectory of metaphor interpretation. Do children get better at comprehending metaphors in a lineal way, or can their development best be described as a U-shape, as has been claimed to be the case for metonymy? Third, we seek to determine how explicit behavioral measures (that tap into the final stages of interpretation) map onto implicit behavioral measures that index online sentence processing. Do these two measures go hand in hand, or do they vary in a way that can be revealing of a change in processing strategy with age?
Participants
We recruited 80 participants between the ages of 3 and 9. Distribution of participants for each age group was as follows: 3 year olds (5 children), 4 year olds, (8), 5 year olds (22), 6 year olds (16), 7 year olds (14), 8 year olds (10), 9 year olds (3). Participants were selected from two public elementary schools in the Vitoria-Gasteiz (Álava, Basque Country) area. Legal guardians of the participants provided their explicit informed consent prior to testing. All participants were bilingual Basque-Spanish. Only children without special educational needs, diagnoses or behavioral issues were included in the study. No participants were excluded based on our pre-determined exclusion criteria. The distribution of the number of participants per age bracket is shown in Table 1 below. Ethical approval was issued by the University of the Basque Country’s Ethics Committee for research with human beings.
Familiarity rating of novel metaphor test items and conventional metaphor control items
Materials and design
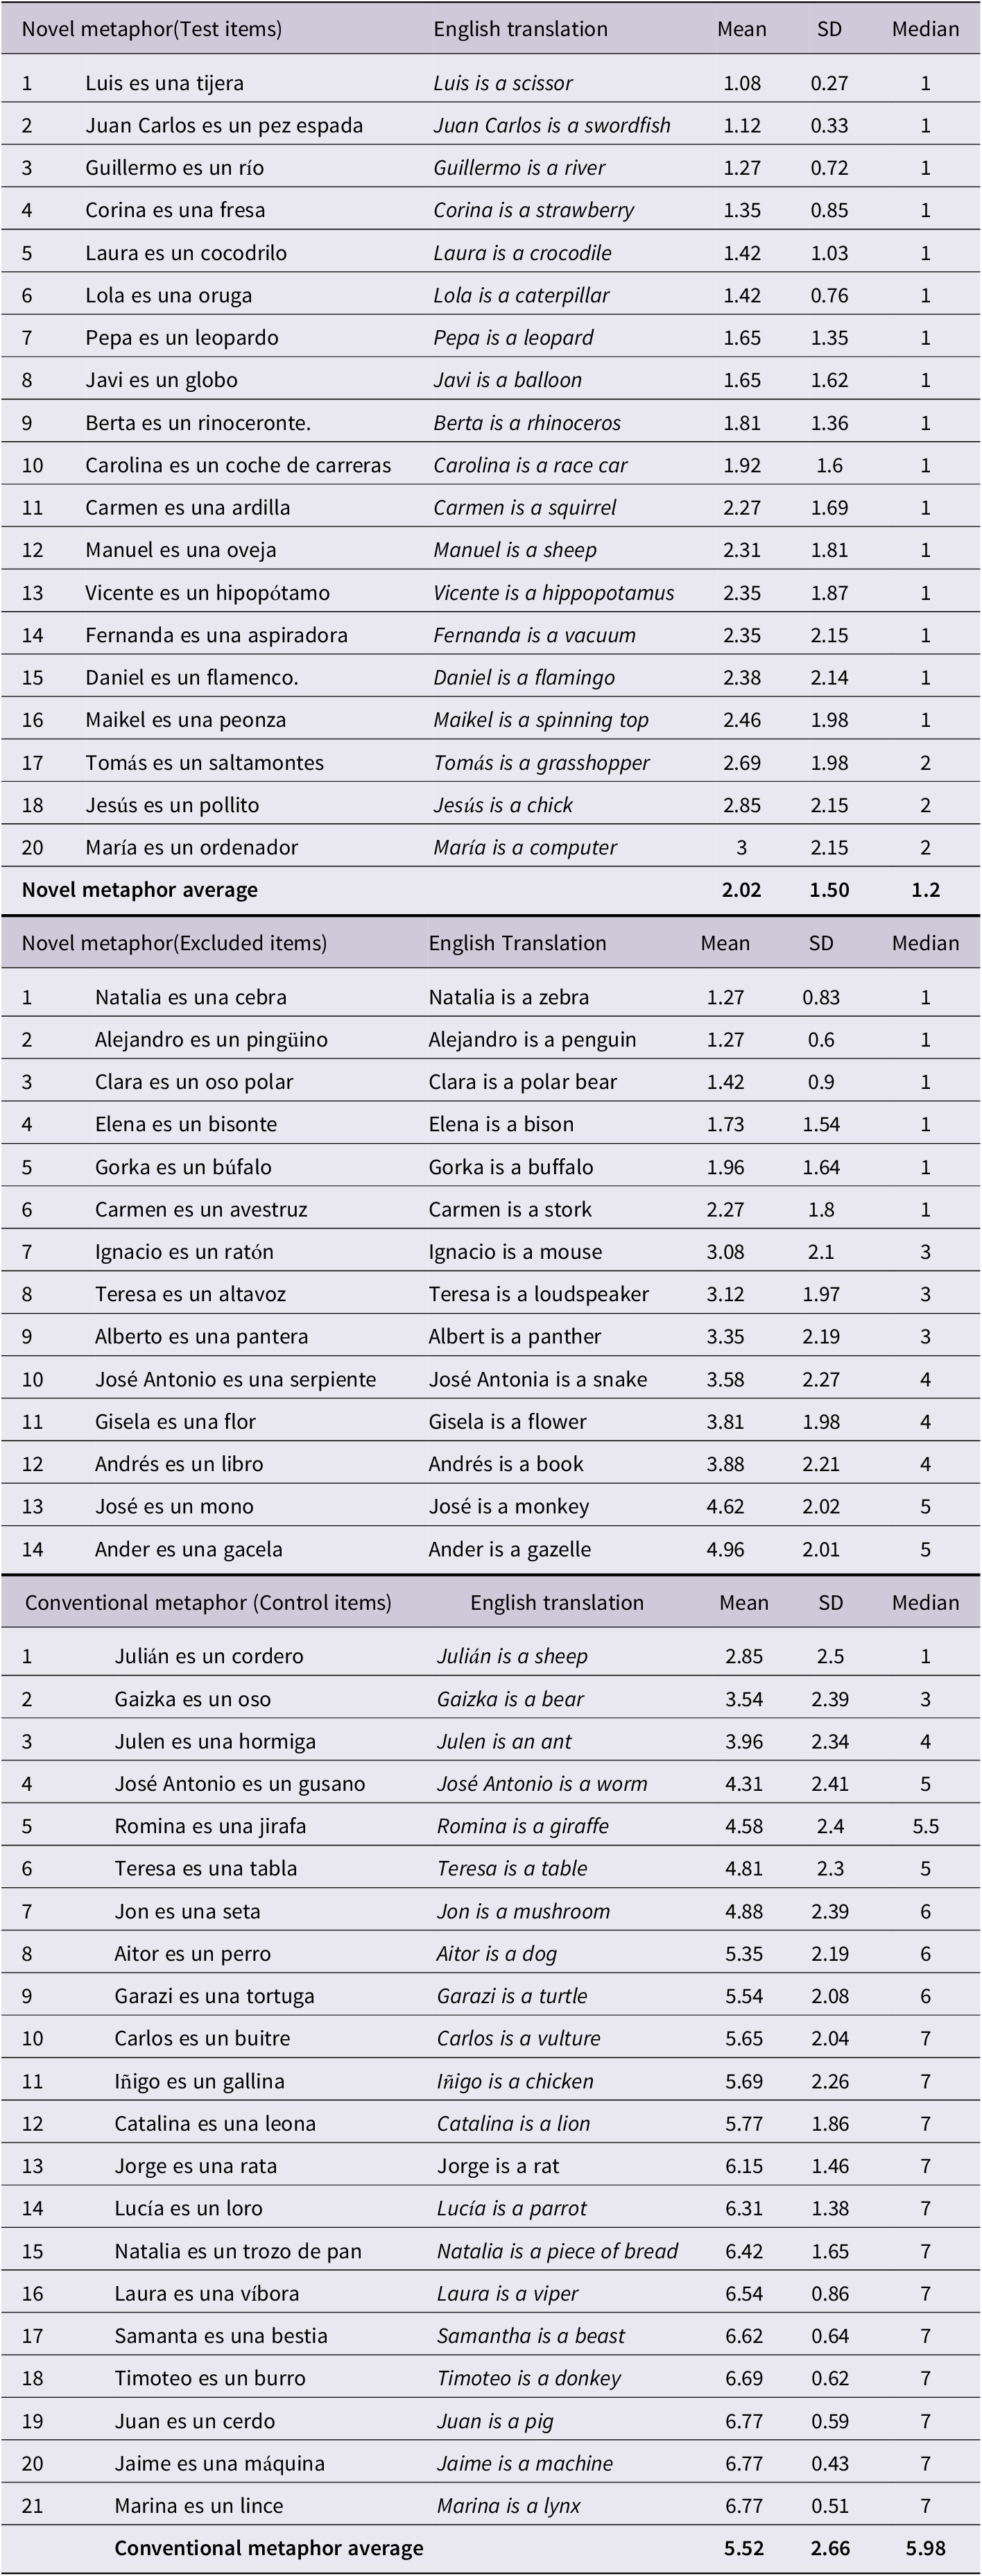
Our experimental items contained purely novel metaphors. To ensure these metaphors were novel in Spanish we conducted a small survey in which we included several novel metaphors and a Likert Scale (1 to 7). We asked adult natives (N = 21) whether the metaphoric expression was familiar to them. We intertwined control items with conventional metaphors in Spanish. For this experiment, we selected metaphors whose mean score was under 3.5. Items used in this study and the corresponding novelty ratings are included in Appendix 1.
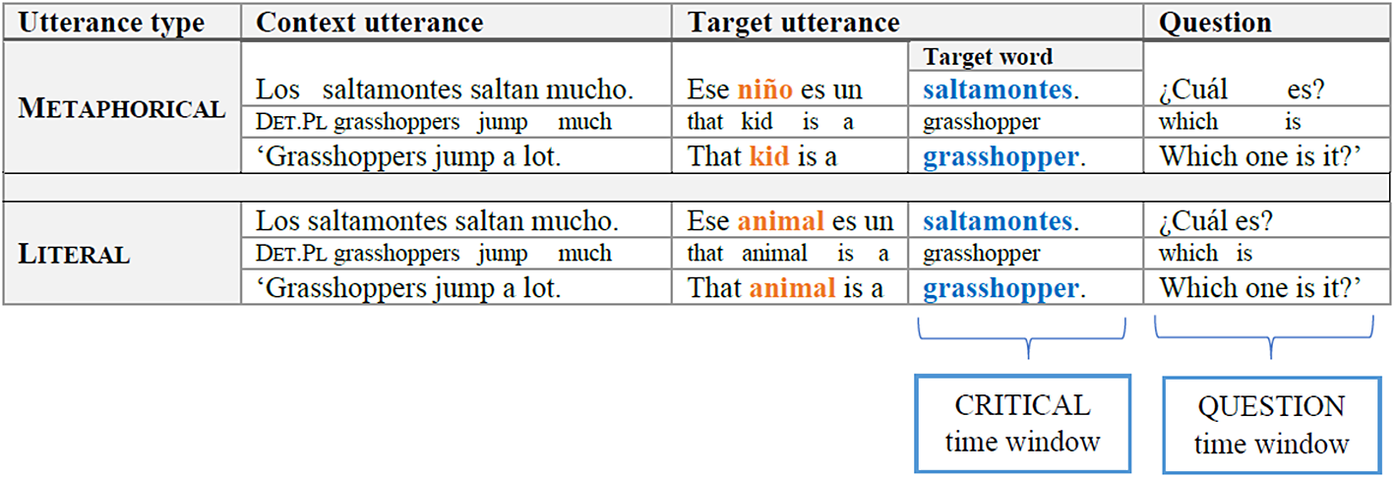
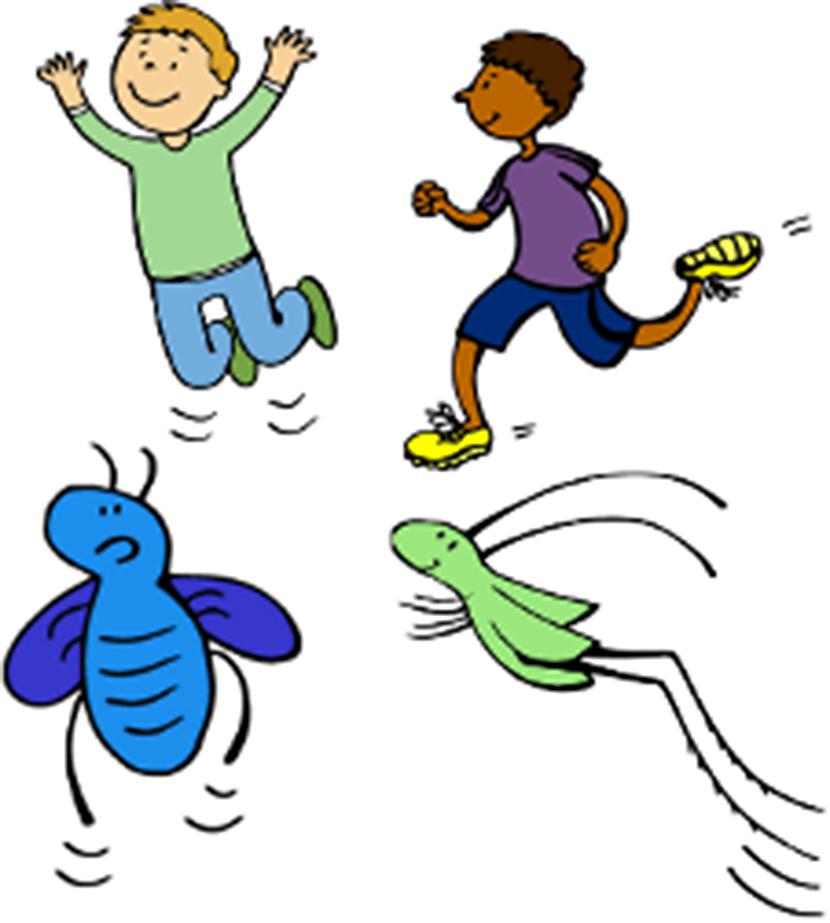
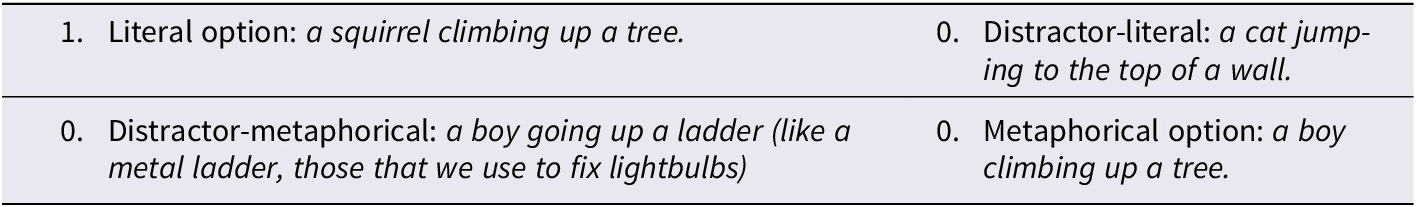
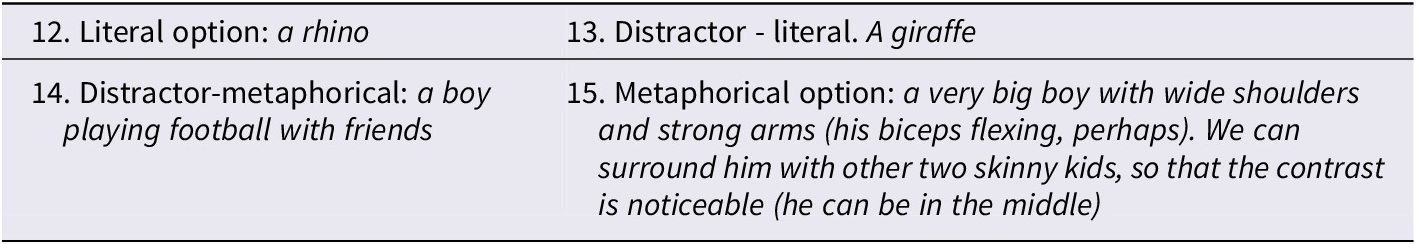
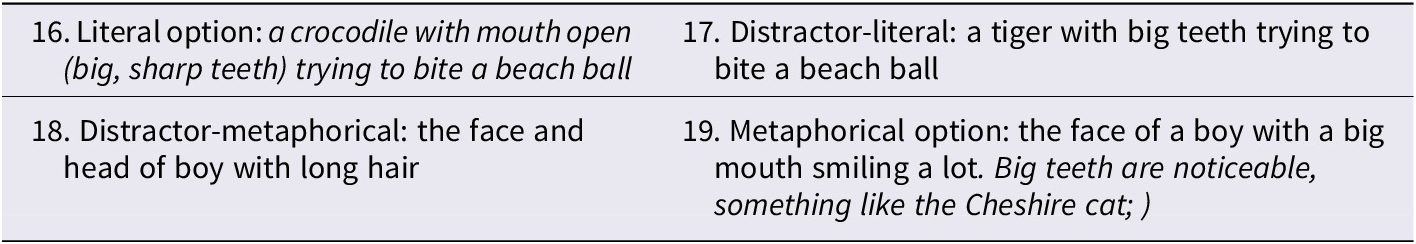
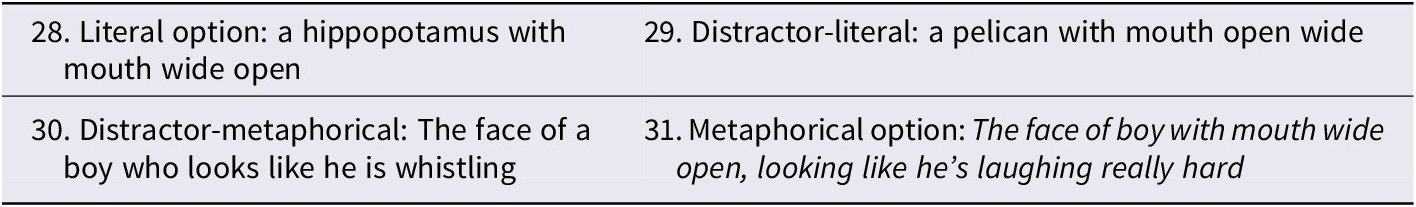
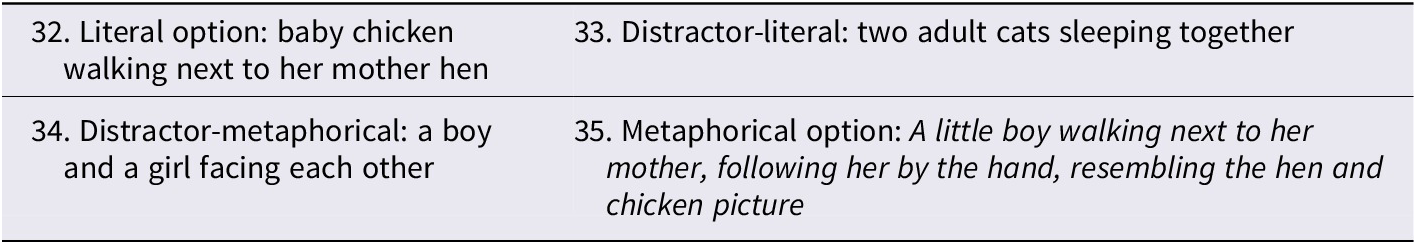
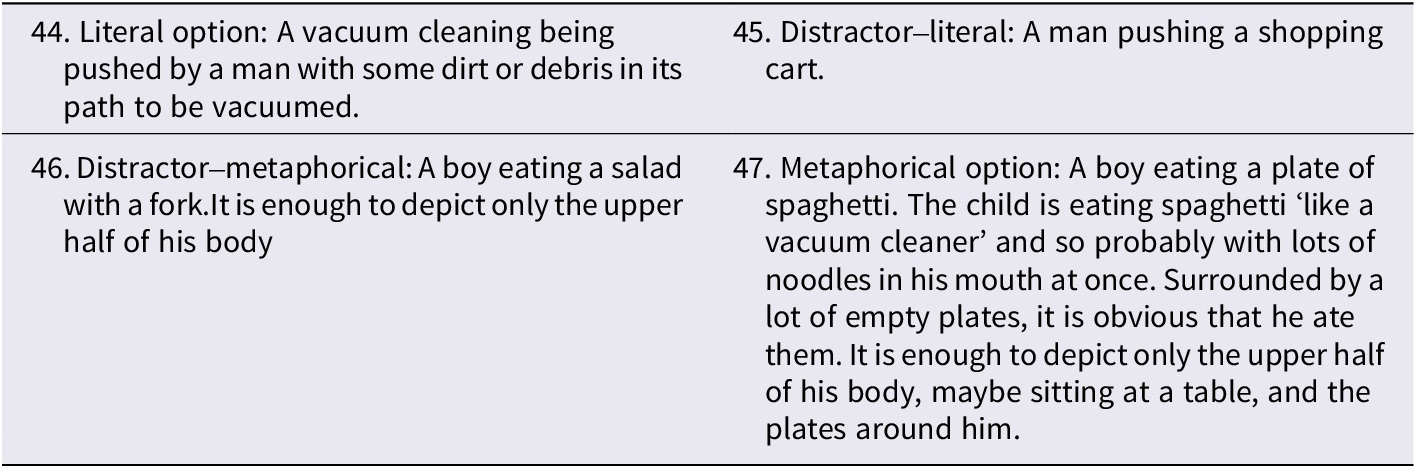
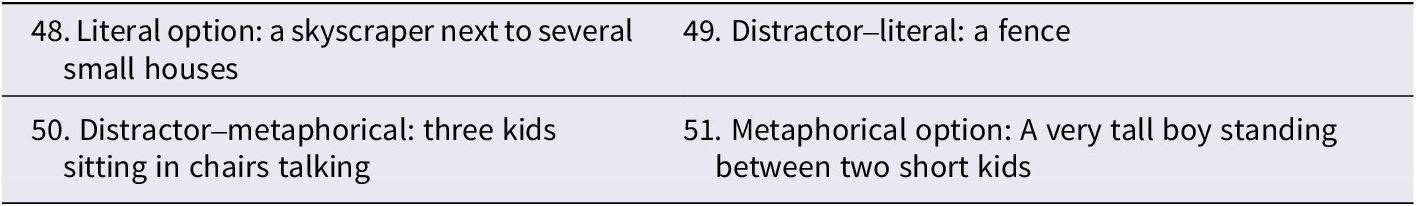
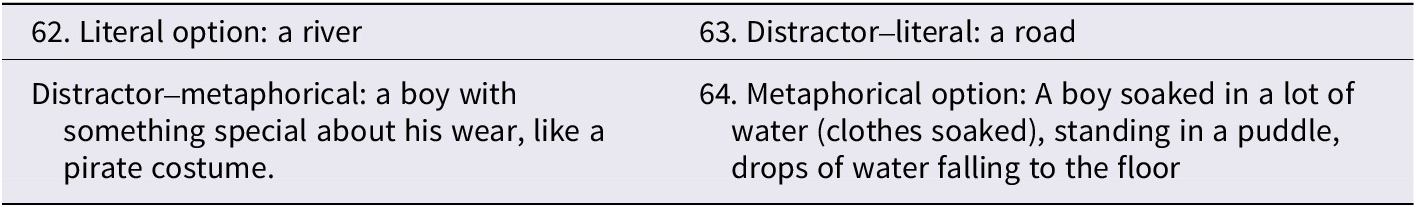
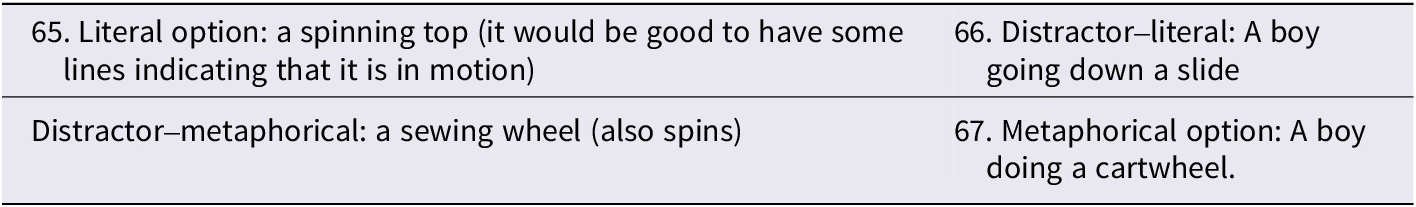
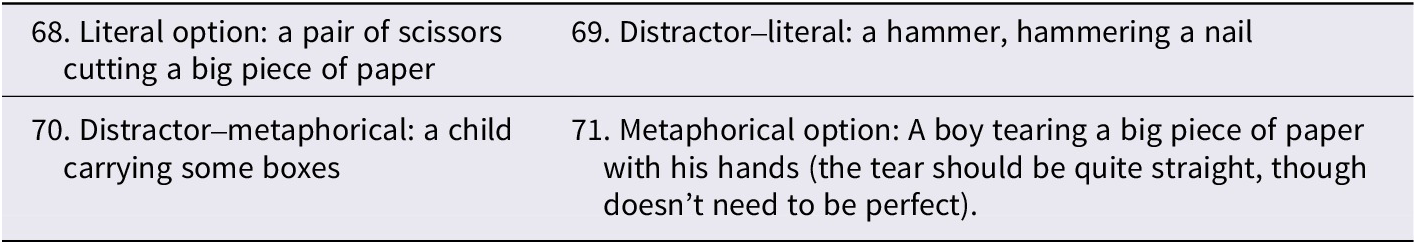
The study used a Visual World, eye-tracking paradigm. In each trial, participants heard two utterances: A context and a critical utterance (see Figure 1). After this, they heard a question prompting them to select one of the four pictures that they saw on the computer screen in front of them. The pictures represented a literal and a metaphorical interpretation of the final word in the critical sentence, together with two distractors (one human figure and one animal/object figure, depending on the type of metaphor)Footnote 5 (see Figure 2). Participants’ eye-movements were recorded as they heard both utterances in a trial.
Example of a critical trial in the metaphorical and critical conditions.
Example of the visual display for a critical trial.
The study had two independent variables. The first one was the categorical variable utterance time with two levels: ‘metaphorical’ and ‘literal’. This factor refers to whether the critical utterance that participants heard in a trial was intended to be interpreted metaphorically or literally. The context utterance was the same in both conditions; it is the target utterance that comes right afterwards that makes the difference. In the literal condition, the target utterance refers to either an animal, or an object, and predicates a feature about them. In the metaphorical condition, the target utterance refers to a human being, and (metaphorically) predicates a feature about them. In the metaphorical condition, the context sentence provided children with information about which property associated with the meaning of the metaphorical vehicle was relevant to appropriately interpret the metaphor.
The literal condition served as a baseline for children’s capability to both integrate two sentences together when the meaning expressed is not figurative, as well as to ensure that children understood the literal meaning of the critical metaphorical vehicles (e.g., ‘grasshopper’). An example of a critical trial in both conditions is shown in Figure 1, including the distribution of relevant time-windows.
The second independent variable was the continuous variable age, measured in days. This referred to the age of the participant on the day of testing.
We created 20 items, with two versions each (for each condition). Items in both conditions were counterbalanced across two experimental lists. All items, as well as a description of the pictures accompanying them, are included in Appendix 2.
Procedure
All participants were tested in a quiet room. They sat next to one of the experimenters, in front of a screen that was connected to the eye-tracker computer. Eye movements were recorded with a SMI RED250MOBILE portable eye tracker with a sampling rate of 250 hz. The experimenter set the eye tracker and then started the experiment with a 5-point calibration and validation phase. The experiment only continued if deviation of both eyes from the focus point was under 0.5 degrees. Afterwards, participants went through three practice trials to ensure their attention and understanding of the task. The practice trials were similar to critical ones but did not use any figurative language. Participants then continued with the 20 critical trials. After the experimental session, they were given stickers as compensation.
Analysis
We analyzed two types of data collected from the experiment: The gaze behavior of participants during a trial (i.e., which of the pictures they were looking at as a function of the unfolding utterance) as well as the explicit picture selected at the end of each trial. Our analysis script, data and list of materials are freely accessible on the project’s OSF page: https://osf.io/2qfpx/?view_only=8de767c6dfb348b0af66afbe181a2565.
Gaze behavior
Gaze behavior was analyzed using log-gaze probability ratios (Arai et al., Reference Arai, van Gompel and Scheepers2007) of proportion of looks to metaphorical picture divided by the proportion of looks to the literal picture, as previously done in a similar experiment on adult metaphor comprehension (Ronderos et al., Reference Ronderos, Guerra and Knoeferle2022). We analyzed log-gaze probabilities across two time-windows. The first was time-locked from the onset to the offset of the metaphorical vehicle (e.g., grasshopper), i.e., the critical word (critical region). The second was time-locked from the onset until the offset of the final question (question region). These two analyses can tell us whether there is a preference for viewing the literal or metaphorical picture immediately upon hearing the metaphorical vehicle (critical time window) or shortly after, but before explicitly selecting a final interpretation (question time window).
To analyze the gaze data we fitted a linear mixed-effects model including utterance time, age and their interaction as predictors. This model was meant to assess the developmental trajectory of metaphor processing. To better understand the potential interaction between age and utterance time, we coded utterance time using treatment contrast coding, fitting the model first with the ‘metaphorical’ condition as the intercept of the model, and then re-fitting it with the ‘literal’ condition as the baseline. This way, we could answer the question of whether age affected the comprehension of metaphorical or literal utterances (or both). The random effects structure of the model was maximal (in the sense of Barr et al., Reference Barr, Levy, Scheepers and Tily2013), with random intercepts and slopes for age, utterance time, and their interaction by items and random intercepts and slopes for utterance time by participants.
Picture selection
Picture selection behavior was analyzed by first removing instances where participants selected one of the distractor images at the end of a trial (which occurred in 3% of all trials). We then coded the remaining trials based on whether participants had accurately selected the target image (coded as 1) or incorrectly selected the competitor image (coded as 0). We then fitted two different types of models to this resulting data. The first and main model was a logistic mixed-effects regression model including utterance time, age, and their interaction as predictors. Similar to the model used for analyzing gaze data, this model evaluated the developmental trajectory of metaphor comprehension. Critically, this model included age as a centered linear predictor as well as a quadratic predictor (using second-order orthogonal polynomials), a procedure known as growth curve analysis (Mirman, Reference Mirman2017). This was done to investigate whether metaphor processing in our task could be best described as having a linear or a non-linear (U-shaped) developmental trajectory. utterance time was treatment-contrast coded with the ‘metaphorical’ condition coded as the baseline, and the model had a ‘maximal’ random effects structure, with random intercepts and slopes for age, utterance time, and their interaction by items and random intercepts and slopes for utterance time by participants.
The second type of model was identical to the first but included age as a categorical predictor with four levels: 3-4 year-olds, 5-year-olds, 6-year-olds and 7-9 year-olds.Footnote 6 This complementary model was used in order to obtain a coarse estimate on the earliest age bracket in which, on average, metaphors are understood correctly. Importantly (given how the age groups have varying number of participants), the groups are not compared to each other statistically, and are used only to evaluate whether for each of the groups the probability of selecting the correct image is significantly higher than chance. To do this, we fitted this model three times, varying the baseline level of the categorical predictor utterance time in order to evaluate if the intercept is significantly different than zero in the ‘metaphorical’ condition.
Results
Gaze data
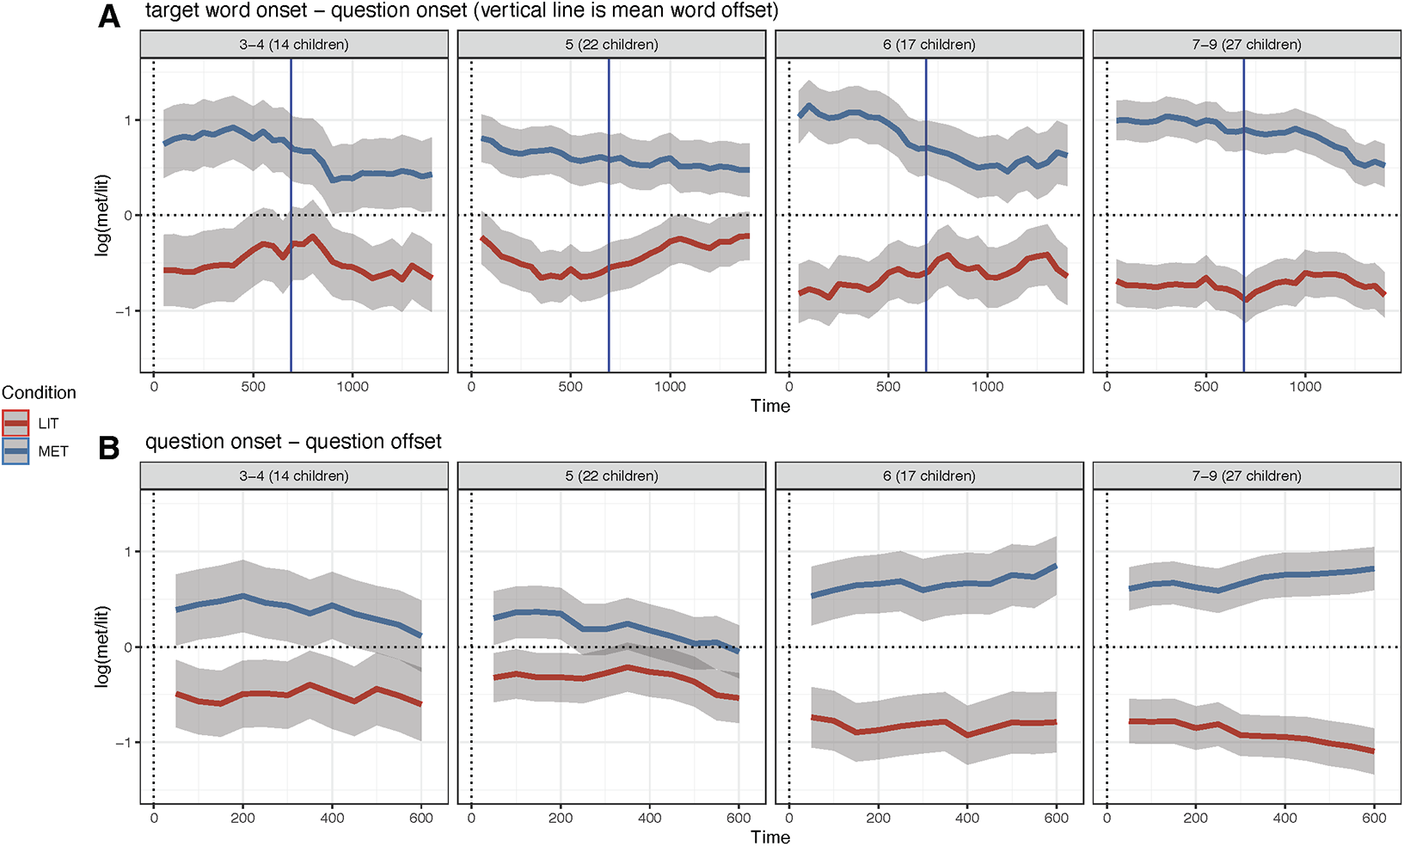
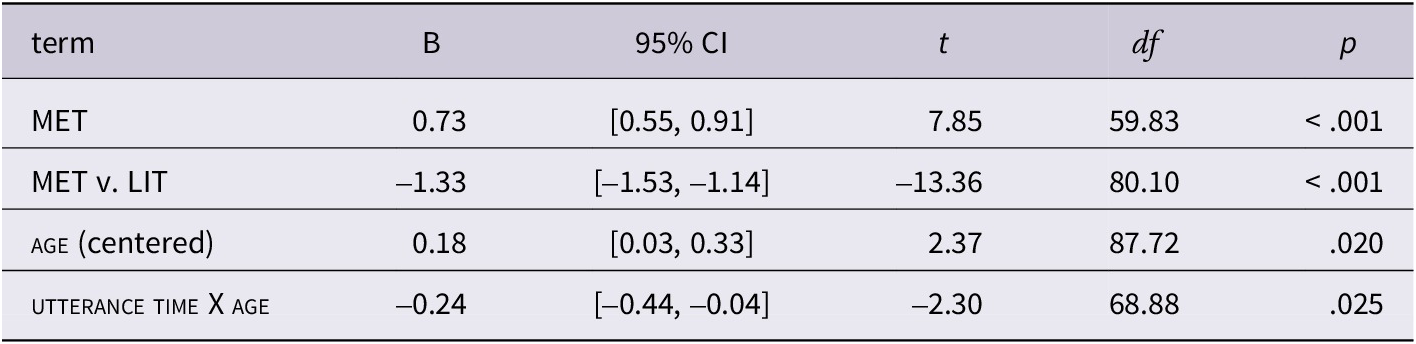
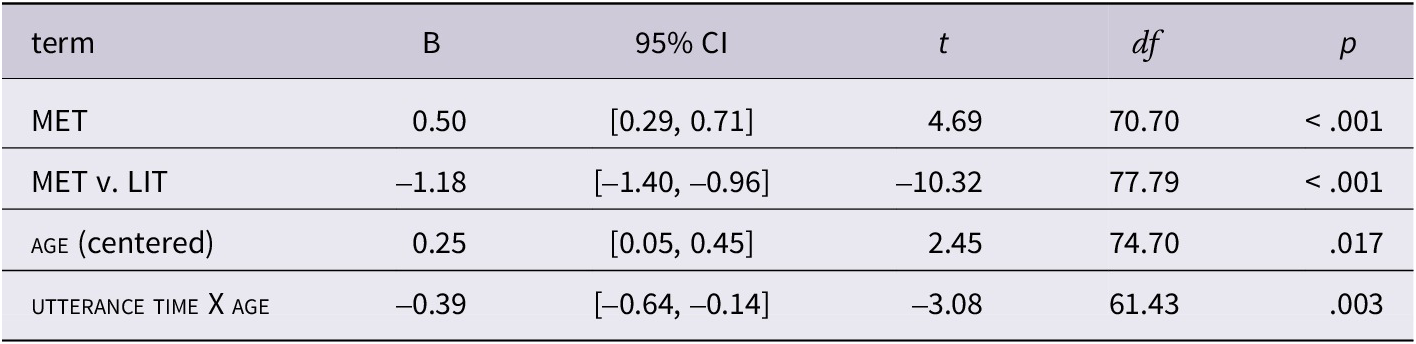
The results are shown in Figure 3 and the relevant model output summary can be seen in tables 2 and 3 and tables I and II in Supplementary materials (displaying results with a different reference level in the variable CONDITION). Our plots depict the preference for one picture or the other in both conditions. The preference for the metaphorical picture would be represented in the positive area (0 to 1) whereas the preference for the literal picture would be represented in the negative area (0 to -1). The younger the children, the closer both lines are to zero, therefore, the less clear their preference for the metaphorical picture in the metaphorical condition. In terms of statistical comparisons, both time windows show a similar pattern: First, there is a significant effect of utterance time, with more looks to the metaphorical picture (i.e., larger log-gaze probability ratios) in the metaphorical condition relative to the literal condition (tables 2 and 3; critical time-window: t-value =13.36, p < 0.001; question time-window: t-value = 10.32, p < 0.001). This means that children of all ages preferred to look at the metaphorical picture in the metaphorical condition compared to the literal one. Further, there is a significant effect of age on the metaphorical condition (tables 2 and 3; critical time-window: t-value = 2.37, p < 0.05; question time-window: t-value =2.45, p < 0.05), but not on the literal condition (tables I and II in supplementary materials; critical time-window: t-value = 0.7, p = 0.45; question time-window: t-value = 1.34, p = 0.18). This resulted in an interaction between utterance time and age in both time-windows (tables 2 and 4; critical time-window: t-value = 2.3, p < 0.05; question time-window: t-value = 3, p < 0.005). This result suggests that, as they get older, participants in our experiment show an increased preference for viewing the metaphorical picture in the metaphorical condition. However, the preference for viewing the literal picture in the literal condition remains relatively constant with age.
Time-course of critical (panel A) and question (panel B) time windows. Error ribbons show 95-percent confidence intervals. Age groups are shown for the purpose of clarity: statistical analyses were conducted using age as a continuous variable.
Eye-tracking results with metaphorical condition as baseline, critical time-window
Note. First row shows condition coded as intercept.
Eye-tracking results with metaphorical condition as baseline, question time-window
Note. First row shows condition coded as intercept
Picture selection results with metaphorical condition as baseline
Note. First row shows condition coded as intercept; age is a continuous predictor measured in days
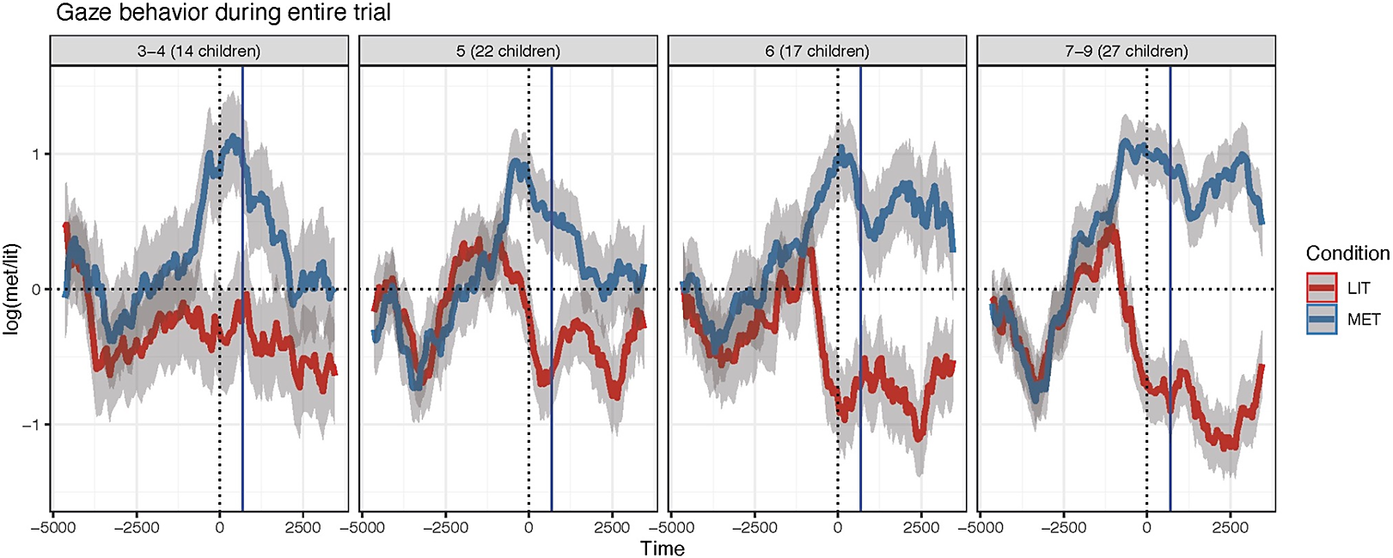
Finally, Figure 4 shows children’s gaze behavior during the entire trial in both conditions. The first half of both lines (until approximately 3500-4000 ms.) corresponds to the context time window, i.e., when children hear “Grasshoppers jump a lot”. In this window, we see that all participants are inclined to look towards the literal picture (i.e., to prefer it), which corresponds to the fact that they are hearing the context phrase which directs attention to the literal picture (in this example, the grasshopper). Gradually, in the metaphorical condition (indicated by the blue line) the preference trends towards the metaphorical picture, as the blue line dives deeper in the “positive” area of the graph. Importantly, children start looking more towards the metaphorical referent even before they hear the metaphorically used target word grasshopper (the beginning of which is depicted by the dotted line, in the figure), likely as a result of their hearing the noun phrase That child, and combining it with the information provided by the verb in the context utterance, ‘Grasshoppers jump a lot’. This preference in children’s gaze behavior remains present also during the first milliseconds of the question region (cf. Figure 3). However, while the older children hold on to this preference in their choice of metaphorical picture option, the younger children seem to finally disregard it in the picture selection task, as we will see in the next section.
Gaze behavior during the entire trial (‘Grasshoppers jump a lot. That child/animal is a grasshopper. Which one is it?’). The data is time-locked to the onset of the critical word (‘grasshopper’). Error ribbons show 95-percent confidence intervals. Dotted line shows the beginning of the critical word, and the blue vertical line shows the offset of the critical word.
Picture selection
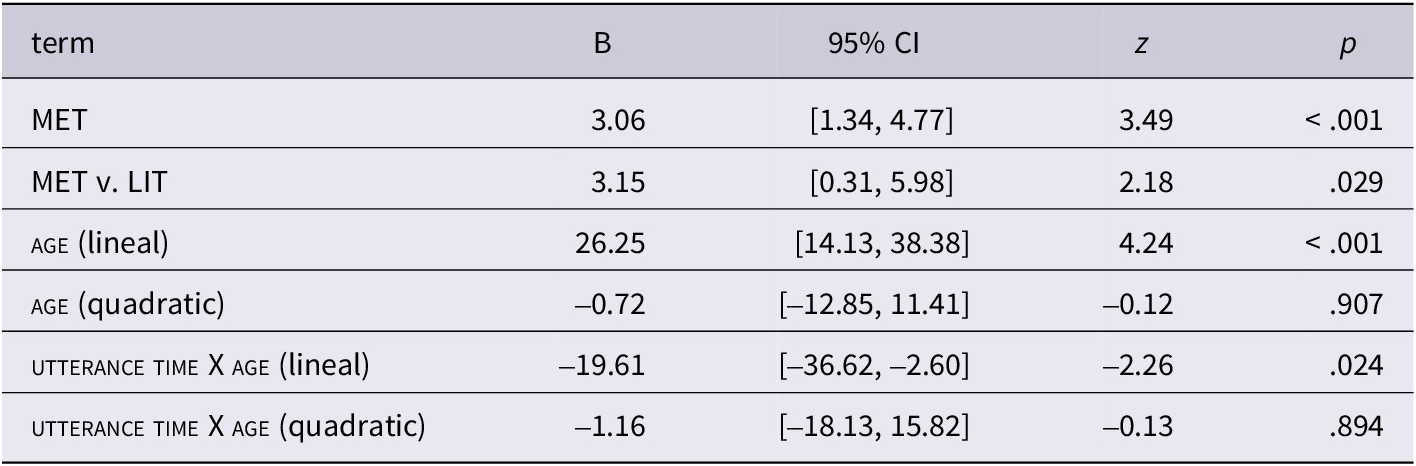
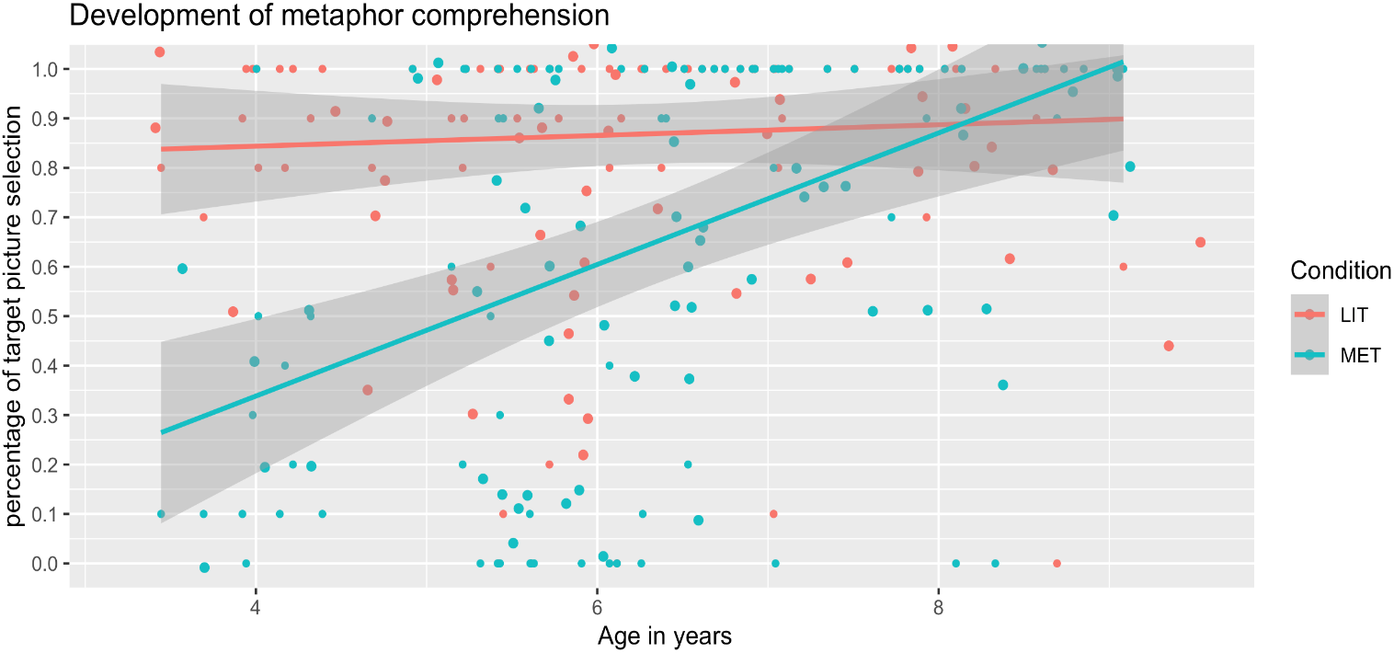
Results of the picture selection task can be seen in Figure 5, while the relevant model output is displayed in table 4. The model shows a significant effect of utterance time on picture selection, with participants choosing the target picture significantly less often in the metaphorical relative to the literal condition. Parallel to the gaze data, there was a significant effect of age on the metaphorical but not on the literal condition (see table III in supplementary materials), resulting in an interaction between age and utterance time. Critically, we did not find a significant effect of the second-order polynomial of age on picture selection (table 4). This suggests that the developmental trajectory of selecting the target picture in the metaphorical condition is better described as linear and not U-shapedFootnote 7.
Results of picture selection task with age as a continuous predictor and a superimposed regression Line. Error ribbons show 95-percent confidence intervals.
The complementary models including age as categorical predictor showed that when the ‘3-4-year-olds’ and the ‘5-year-olds’ age brackets were coded as the baseline conditions of the model (table IV and table V in supplementary materials), the intercepts were not significantly different from zero (‘3-4-year-olds’: beta-coefficient: -0.410, z-value: -0.232, p-value: 0.817; ‘5-year-olds’: beta-coefficient: 0.595, z-value: 0.351, p-value: 0.726). This was the case only for the older age brackets (‘6-year-olds’: beta-coefficient: 5.116, z-value: 2.748, p-value<0.01; ‘7-9-year-olds’: beta-coefficient: 6.877, z-value: 5.482, p-value < 0.001).
General discussion
In the present study, we aimed to contribute to the debate on the development of metaphor interpretation in three ways. First, we set out to test the earliest age in which children comprehend predicative nominal metaphors that display an overt category clash using a child-friendly paradigm that does not impose particular world knowledge or metalinguistic demands on the participants. Second, we aimed to evaluate the developmental trajectory of metaphor interpretation, in order to assess whether it can be best described as a linear or a U-shaped development. Finally, we probed both the end-result of the interpretative process (using picture selection) as well as the incremental online processing of metaphors (using eye-tracking) in order to examine potential dissociation patterns between these two measures. Throughout this section, we will discuss in detail how our results could relate to the theoretical views set out in the Introduction, introducing different hypothesis. Besides, we will mention some limitations of our proposed experimental design (i.e. the demands the task might pose), as we also recommend interpreting our results for the youngest age groups with caution, since our sample included only five 3-year-olds and eight 4-year-olds, due to availability constrains at the schools we worked with.
In terms of our first goal, the results of the picture selection task suggest that children under the age of 6 seem to not comprehend our metaphors. In the 3-4 and 5-year-old age brackets we failed to find a significant preference for either selecting the incorrect – literal or the correct – metaphorical picture in the metaphorical condition, judging by the non-significant intercept of the models for which these age groups were used as the reference level (see tables IV and V in supplementary materials). Only the older age brackets (6 and 7-8 year-olds, table VI) displayed a significant preference for selecting the metaphorical picture in the metaphorical condition, suggesting that they were overall able to grasp the figurative meaning of our test items.
In terms of our second goal, the results suggest that the developmental trajectory of metaphor comprehension is best described as being lineal and not U-shaped: Using growth curve analysis, we found that the second-order polynomial of the predictor age did not have a significant effect on metaphor comprehension. The first order polynomial, however, did have a significant effect on the interpretation of metaphorical but not on that of literal expressions, resulting in an interaction pattern. This suggests that, with age, participants in our experiment became better at correctly identifying the metaphorical target picture in a lineal way (and correspondingly became less likely to choose the literal picture), whereas grasping the literal meaning was something they were able to do consistently regardless of their age. This falls in line with what we may gather from the current body of literature on metaphor (e.g., Deamer, Reference Deamer2013; or a classic study by Vosniadou et al., Reference Vosniadou, Ortony, Reynolds and Wilson1984), who similarly found a linear maturation in picture selection.
Finally, the results of the eye-tracking experiment showed that, in general, participants preferred to look at the metaphorical picture in the metaphorical condition, and at the literal picture in the literal condition. This pattern was visible both as the target metaphorical vehicle was heard (critical time window) as well as immediately after (question time window). Further, both time windows showed an interaction between age and utterance time, suggesting that older children tended to look more at the metaphorical picture in the metaphorical condition relative to younger children, whereas looks to the literal picture in the literal condition remained relatively stable with age.
In sum, we find linear developmental trends in both gaze and picture selection data. However we see that children’s ‘preference’ differs between measures in function with age. For children aged 6 and older there is strong evidence for successful comprehension of novel nominal predicative metaphors: these children both look towards the metaphoric referent in the unfolding of the target sentence and successfully select the correct metaphoric referent when prompted. Children aged five and under present a different pattern, looking significantly towards the metaphoric referent during the unfolding of the target sentence while ultimately mainly selecting the literal option. We will first situate our picture selection results among relevant previous findings and then reflect potential interpretations for the discrepancy between gaze and picture selection measures for our youngest participants.
Concerning the debate about development (“literal stage” or “early birds”), to which we intended to contribute; recall that advocates of the literal stage claimed that children would not be able to comprehend metaphors until the age of 10-12 years old, while the “early birds” view defended that children as young as 3 should be able to do so. Our results somewhat question the developmental claim of the literal stage hypothesis. It is clear that young children (6-year-olds and some 5-year-olds at least) are capable of comprehending novel metaphors that include violation of conventional category boundaries in a predicative nominal form, when considering children’s picture selection. Importantly, this was the first study to shed light on the developmental trajectory of predicative metaphor, capturing the transitional age at which children succeed in explicit measures. Long et al. (Reference Long, Shukla and Rubio-Fernández2021) also tested a similar age range, however participants did not demonstrate an understanding of the metaphors tested. Both studies are similar in that the metaphors used are nominal predicative metaphors in Spanish (as an example from Long et al.’s: ‘Lucía es un loro’; lit: Lucy is a parrot, for a girl looking like a parrot), and some of our chosen metaphors are also animal-human. However, there are key differences between the current study and Long et al.’s, besides their metaphors being more perceptually-based. One such difference is the type of literal competitor included; while the “literal” picture in Long et al.’s study depicted the interpretation of the whole statement (e.g., a picture of a parrot for ‘Lucy is a parrot’, which would amount to a parrot named Lucy) our literal competitor represented the literal meaning of the metaphor vehicle (e.g., a grasshopper). Compared to Long et al.’s (Reference Long, Shukla and Rubio-Fernández2021), our choice of literal competitor is in line with theoretical accounts which take metaphors to be interpreted through a process of pragmatic adjustment of the concept encoded by the metaphorical vehicle (e.g., so-called ad hoc concept construction; Sperber & Wilson, Reference Sperber, Wilson and Gibbs2008; Wilson & Carston, Reference Wilson and Carston2006). In our paradigm, if this adjustment is not performed, the literal interpretation of the whole utterance is absurd or impossible (i.e, a child being literally a grasshopper), whereas in Long et al.’s design, such an interpretation is possible – and indeed, plausible). The second difference between Long et al.’s design and the current study is that, as the authors themselves point out, one crucial aspect to disambiguate between Lucy being a girl or a parrot in the example is that, in Spanish, ‘Lucía’ (Lucy) is not usually a name for a pet. This means that older children may have accessed a piece of knowledge about linguistic conventions that younger children do not have at their disposal. Results from the present study suggest that comprehension of predicative metaphor may develop earlier than previously known.
Regarding 3-year-olds being early birds in understanding metaphors, it seems that this may apply to a certain type of metaphorical statements. Reviewing the studies which indicated correct picture selection by the age of three (Deamer, Reference Deamer2013; Di Paola et al., Reference Di Paola, Domaneschi and Pouscoulous2020; Pouscoulous & Tomasello, Reference Pouscoulous and Tomasello2020), we find a similar pattern in that the metaphorical mappings included are strongly based on perceptual similarity between objects (e.g., the tower with the hat for a tower with a pointy roof; the car that has a bad foot, for a car with a flat tire). As stated in the introduction, the type of metaphorical mapping arguably influences performance. Although our metaphors possess imaginable elements, our mappings are not based on perceptual similarity, but rather on actions and functions that both the metaphorical target and the vehicle can perform. Besides, our metaphors are all nominal predicates in form and as such, less similar to overextensions and renamings that children spontaneously perform. It might be that our metaphors are more difficult to solve than the ones traditionally included in “early birds” supportive studies. Other relevant methodological differences should also be considered: in some design contexts no other potentially relevant interpretation option was available (cf. Pouscoulous & Tomasello, Reference Pouscoulous and Tomasello2020), and some experimental contexts focused attention on the correct human referent prior to the target metaphoric statement (Deamer, Reference Deamer2013); both things likely posing low demands on inhibitory control. Conversely, in our task, children had to use the property of the metaphorical vehicle provided verbally in the context sentence (Grasshoppers jump a lot) to arrive at a metaphorical interpretation, suppressing other associated features. They lacked other clues that would make the interpretation depicted by the correct picture more salient. In fact, given that the vehicle term is heard twice (in the context and in the metaphorical statement), its literal meaning likely receives strong activation and may make feature suppression harder for some children. I.e., our task might be more demanding for children’s general executive function and in particular inhibitory control. As general executive function improves with age, it has been proven to have a significant effect on metaphor comprehension (see Deamer, Reference Deamer2013). This might be viewed as a limitation of the current design with regard to testing the competence of our youngest participants. At the same time, this feature of the current design also provides strong evidence of older children’s (but still young to the literal stage hypothesis) capability of suppressing literal meaning to reach the correct, metaphorical interpretation, regardless of the activation received through the context.
Across paradigms, evidence suggests that from a young age, children are prepared to solve and grasp metaphorical meanings. What accounts for differences among ‘early birds’ (i.e., whether we witness competence in picture selection from three to six years old) may depend on specifics of the methodology selected. This may be a relevant point for future research to address directly what may account for variability among the earliest of ages: type of metaphor assessed, how the relevant trait is made salient (perceptually or verbally) as well as the role of cognitive factors such as inhibitory control, which is rapidly maturing during this time span (see Deamer, Reference Deamer2013, for a correlation between metaphor comprehension and inhibitory control in children from these age spans).
As we note in the introduction, there are likely differing levels of metaphor comprehension and we cannot attest to whether participants in our study have a comprehension of metaphor in the fullest sense, such that the metaphor could be explained, reused or used in reasoning. That noted, taking into consideration both gaze and picture selection performance of participants aged six and older gives us confidence to infer successful comprehension for these age brackets. Moreover, there is recent evidence that children as young as 4 years old can use novel metaphorical meaning in their reasoning (Zhu & Gopnik, Reference Zhu and Gopnik2023), so that would speak in favor of our six-year-olds being capable of understanding metaphors in a deeper way. But how can we understand the performance of children who are five and under who prefer the metaphoric referent according to their gaze behavior at least until question onset, yet tend to select the literal picture? Considering both eye-tracking and picture selection results together, our findings are compatible with more than one interpretation. Both interpretations to be developed have to do with the notion of confidence and take into account how task properties might be affecting results.
One possible interpretation is that young children are sensitive to the metaphor yet for some reason exhibit a literalist picture selection behavior. This interpretation would parallel that developed in Köder and Falkum (Reference Köder and Falkum2020) with regard to their results on novel metonymy, which share some similarities in gaze-selection patterns for children five and under: a dissociation between looks towards the non-literal referent in the gaze data while selecting the literal option for 4- and 5-year-olds in Köder and Falkum (Reference Köder and Falkum2020) and for our 3-4 and 5-year-old age brackets in the present metaphor study. As commented in the introduction, a similarity in metaphor and metonymy is a deviation from the conventional meaning of the metaphoric or metonymic vehicle. Köder and Falkum (Reference Köder and Falkum2020) propose that a growing sensitivity to linguistic sense conventions may result in a literalist bias in picture selection, overriding a sensitivity to the non-literal interpretation. In this sense, one could interpret that all participants have some sensitivity to the metaphoric meaning of the utterance, yet the younger participants are less confident in their interpretation as it involves a clash with the conventional meaning of the metaphoric vehicle and thus ultimately opting for what they take to be the safest bet.
An alternative view would grant a weaker interpretation to their significant gaze towards the metaphoric referent - looking at the dynamic unfolding gaze behavior in terms of predictive processing and maturation of inhibitory control. Recall that all children first attend to the image of the grasshopper during the unfolding of the context sentence, and then shift their gaze to the metaphoric referent even prior to hearing the target word grasshopper in the target sentence that child is a grasshopper. Children may be integrating the relevant properties of the context sentence to restrict their gaze to the relevant person option, who shares the key property of jumping. However, one might take a more muted stance as to whether this unfolding sequence is indicative of a true sensitivity to the metaphoric meaning. Older children may be more confident about their choice because they are able to effectively suppress features of the metaphorical vehicle, while younger children may be in the process of learning to do it, thus they don’t fully succeed in processing the metaphor, and this is the reason why they don’t finally choose the correct picture. According to this interpretation, both types of data would blend in their linear trajectories, showing that with age, children get better at understanding metaphors.
In sum, our results suggest that children aged 6 and above reliably understand nominal predicative metaphors, given the specifics and constraints of our design.
We witness a linear maturation in picture selection, with 3-4-year-olds overwhelmingly selecting the literal referent, 5-year-olds in a transitional phase selecting the literal or metaphoric referent equally, and 6-year-olds demonstrating their comprehension in picture selection, despite a context that emphasizes the metaphoric vehicle. When considering gaze and picture selection data together, we see that there is a general alignment in terms of trajectory – both gaze behavior and selection behavior presenting a more or less linear development. With regard to children aged 5 and under, we see an apparent dissociation between gaze and picture selection, however it is uncertain to what extent this gaze behavior implies sensitivity to the metaphor as children are shifting their gaze to the correct referent even prior to hearing the metaphor in full. This is not to discount what younger children are doing however – they indeed appear sensitive to the context to restrict their gaze to the relevant human referent who shares key traits with the metaphoric vehicle. What we may infer is that all children prefer the human referent which shares relevant traits with the referent of the context sentence, however this preference may be more fragile for younger participants, specifically when asked to make an explicit choice. Younger children’s tendency towards selecting the literal picture may have differing potential causes such as growing sensitivity to conventional meanings of words which make them less confident selecting a referent which clashes with the conventional meaning of the word or potentially a less mature inhibitory control capacity which affects their ability to fully process the metaphor.
Conclusion
In this paper, we investigated the development of metaphor interpretation using an eye-tracking, Visual World paradigm. Our study allowed us to both shed light on the moment-to-moment processing of predicative nominal metaphors, as well as on how this ability develops with age. Our results reveal a lineal development in metaphor comprehension both in terms of their online processing (judging by the eye-tracking record) and of their overall interpretation (judging by the picture selection data). It seems that only after six years of age can we say that children exhibit a level of comprehension of predicative nominal metaphors that allows them to choose the right picture – at least in the current set-up – and consistently display behavior compatible with the derivation of metaphor comprehension, in contrast with previous findings showing that even 3-year-olds are able to comprehend simple perceptual metaphors also in a forced choice paradigm. Our study therefore adds to the existing literature on metaphor comprehension by providing results about the development of comprehension of non-perceptual metaphors.
Supplementary material
The supplementary material for this article can be found at http://doi.org/10.1017/S0305000924000187.
Acknowledgements
We would like to warmly thank all the families who agreed to their child’s participation in this study, as well as the schools in Vitoria-Gasteiz (Basque Country) which made contacting with the families possible and facilitated everything for us to comfortably test the children: thank you Adurtza Ikastola and Arantzabela Ikastola (eskerrik asko!).
Thank you to the amazing DEVCOM group who gave important feedback and interesting commentaries to an early version of this work on several occasions: specially to Nick Allot, and Mary-Beth Neff.
Also thank you to Inge-Marie Eigsti and Michael Kissine for their insights, which also contributed to the advancement of this work.
Thank you to the International Pragmatics Association IPRA-Conference in 2023 in which a close version of this paper was presented and obtained useful feedback for the forthcoming revisions. And the same goes for XPRAG Conference in 2023 (Paris) and everyone who made it possible.
Lastly, we are indebted to two anonymous reviewers and the Action Editor of this Journal for their valuable insight and thorough revisions, which have unquestionably contributed to making this paper better, clearer, and more transparent to readers. We take all responsibility for any remaining mistakes.
Funding
This research has been partially supported by project FUNLAT (PID2021-122233OB-I00), and the grant no. PRE2019-089758, funded by the Ministry of Science and Innovation (MICIU)/Spanish Research Agency (AEI)/ 10.13039/501100011033, the European Regional Development Fund (FEDER, EU), the grant IT1537-22 for the Theoretical Linguistics Research Group (funded by the Basque Government) and by BBVA Foundation Grant for Scientific Research Projects 2021 (RILITEA). The BBVA Foundation takes no responsibility for the opinions, statements and contents of this project, which are entirely the responsibility of its authors. This research is also supported by project DEVCOM (grant no. 853211), funded by the European Research Council Starting Grant program (2019) and the Centre of Philosophy and Science’s (Department of Philosophy, Classics, History of Art and Ideas, University of Oslo) Visiting Scholar Scholarships (June - 2022).
Competing interest
The authors declare no competing interests.
Appendix 1
Novelty control study
A total of 21 adult participants responded to an online familiarity rating task. Participants were native speakers of Spanish. They were asked to rate how familiar they were with each metaphorical expression on a 7-point scale (1: very unfamiliar and 7: very familiar).
Overall, the mean familiarity score for our 20 experimental items is 2.02 (SD=1.5; median=1). Fourteen novel metaphor items were excluded either for having a familiarity score of 3 or above or for other considerations.
The table below lists the mean familiarity score for our 20 included novel metaphor test items, 14 excluded novel metaphor items, and 21 conventionalized metaphors, which served as control items for familiarity rating.
Appendix 2
Experimental materials
Squirrels climb up trees. That boy is a squirrel.
1a. Las ardillas suben árboles. Ese niño es una ardilla. ¿Cuál es? 1
1b. Las ardillas suben árboles. Ese animal es una ardilla. ¿Cuál es? 2
Swordfishes swim fast. That boy is a swordfish.
2a. Los peces espada nadan rápido. Ese niño es un pez espada. ¿Cuál es? 2
2b. Los peces espada nadan rápido. Ese animal es un pez espada. ¿Cuál es? 1

Grasshoppers jump a lot. That boy is a grasshopper.
3a. Los saltamontes saltan mucho. Ese niño es un saltamontes. ¿Cuál es? 1
3b. Los saltamontes saltan mucho. Ese animal es un saltamontes. ¿Cuál es? 2

Rhinos are strong. That boy is a rhino.
4a. Los rinocerontes son fuertes. Ese niño es un rinoceronte. ¿Cuál es? 2
4b. Los rinocerontes son fuertes. Ese animal es un rinoceronte. ¿Cuál es? 1
Crocodiles have big teeth. That boy is a crocodile.
5a. Los cocodrilos tienen los dientes grandes. Ese niño es un cocodrilo. ¿Cuál es? 1
5b. Los cocodrilos tienen los dientes grandes. Ese animal es un cocodrilo. ¿Cuál es? 2
Sheeps have a lot of wool. That boy is a sheep.
6a. Las ovejas tienen mucha lana. Ese niño es una oveja. ¿Cuál es? 2
6b. Las ovejas tienen mucha lana. Ese animal es una oveja. ¿Cuál es? 1
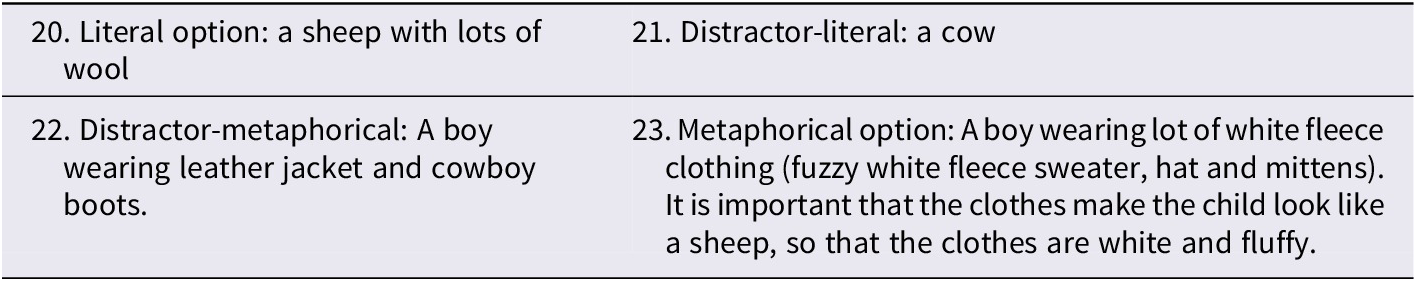
Leopards have a lot of dots. That boy is a leopard! (kid with noticeable freckles)
7a. Los leopardos tienen muchos puntos. Ese niño es un leopardo. ¿Cuál es? 1
7b. Los leopardos tienen muchos puntos. Ese animal es un leopardo. ¿Cuál es? 2
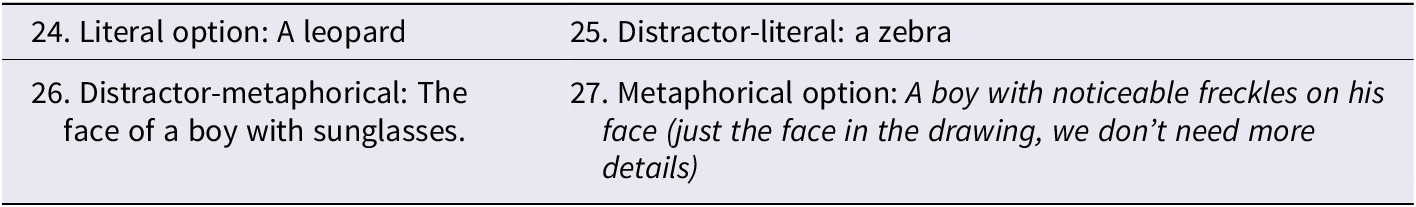
Hippos have a very big mouth. That kid is a hippo!
8a. Los hipopótamos tienen la boca muy grande. Ese niño es un hipopótamo! 2
8b. Los hipopótamos tienen la boca muy grande. Ese animal es un hipopótamo! 1
Chickens always follow their mum. That boy is a chicken!
9a. Los pollitos siempre van con su mamá. Ese niño es un pollito. ¿Cuál es? 1
9b. Los pollitos siempre van con su mamá. Ese animal es un pollito. ¿Cuál es? 2
Flamingos are pink. That kid is a flamingo!
10a. Los flamencos son rosa. Ese niño es un flamenco. ¿Cuál es? 2
10b. Los flamencos son rosa. Ese animal es un flamenco. ¿Cuál es? 1
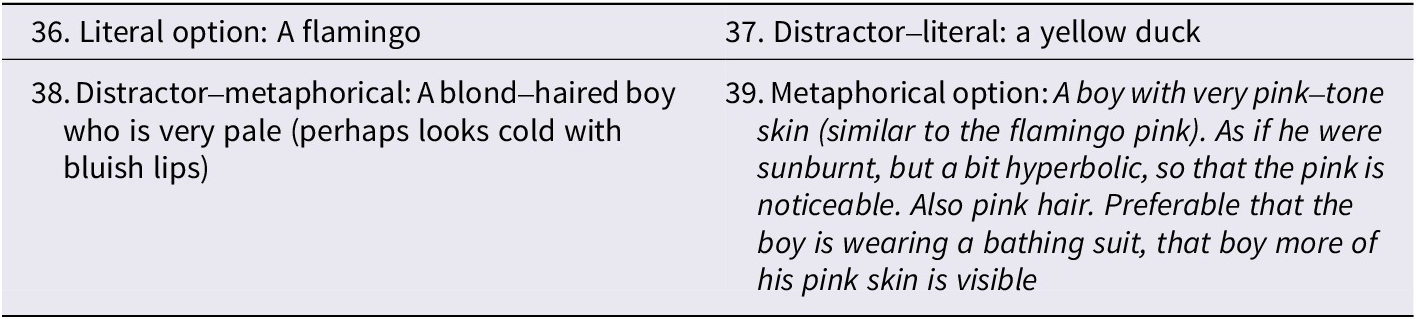
Caterpillars move (slither, squirm) on the ground. That kid is a caterpillar!
11a. Las orugas van por el suelo. Ese niño es una oruga. ¿Cuál es? 1
11b. Las orugas van por el suelo. Ese animal es una oruga. ¿Cuál es? 2
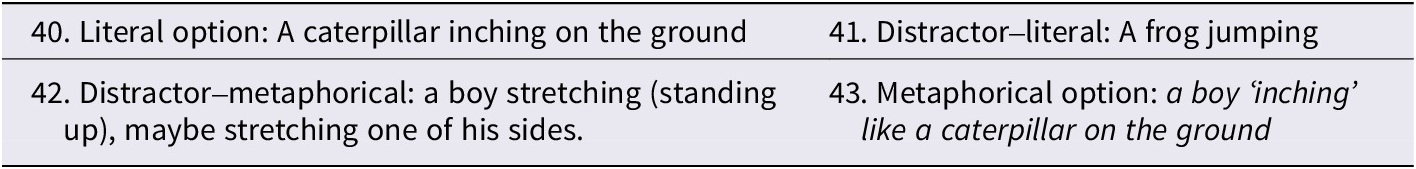
Vacuum cleaners absorb everything. That kid is a vacuum cleaner!
12a. Las aspiradoras absorben todo. Ese niño es una aspiradora. ¿Cuál es? 2
12b. Las aspiradoras absorben todo. Esa cosa es una aspiradora. ¿Cuál es? 1
Skyscrapers are tall. That kid is a skyscraper!
13a. Los rascacielos son altos. Ese niño es un rascacielos. ¿Cuál es? 1
13b. Los rascacielos son altos. Esa cosa es un rascacielos. ¿Cuál es? 2
Balloons are round. That kid is a balloon.
14a. Los globos son redondos. Ese niño es un globo. ¿Cuál es? 2
14b. Los globos son redondos. Esa cosa es un globo. ¿Cuál es? 1
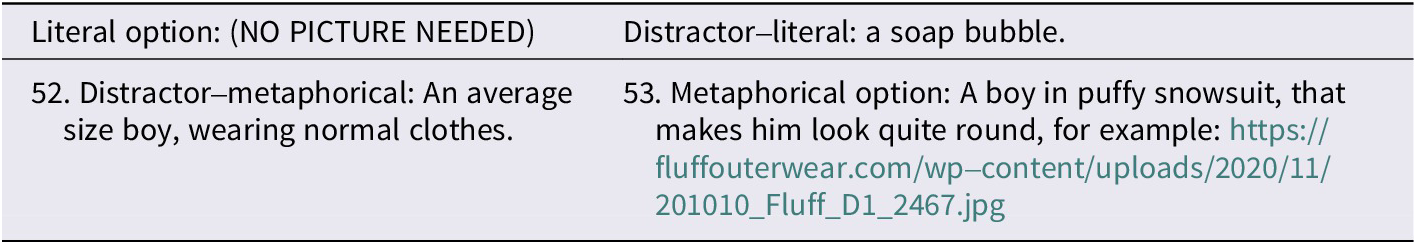
Computers do math very fast. That kid is a computer!
15a. Los ordenadores hacen mates muy rápido. Ese niño es un ordenador. ¿Cuál es? 1
15b. Los ordenadores hacen mates muy rápido. Esa cosa es un ordenador. ¿Cuál es? 2
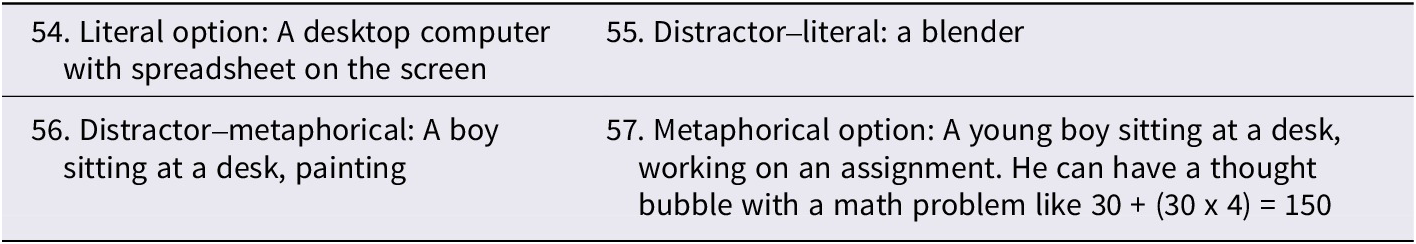
Las fresas son rojas. Ese niño es una fresa! [kid with red cheeks]. Strawberries are red. That kid is a strawberry.
16a. las fresas son rojas. Ese niño es una fresa. ¿Cuál es? 2
16b. Las fresas son rojas. Esa cosa es una fresa. ¿Cuál es? 1
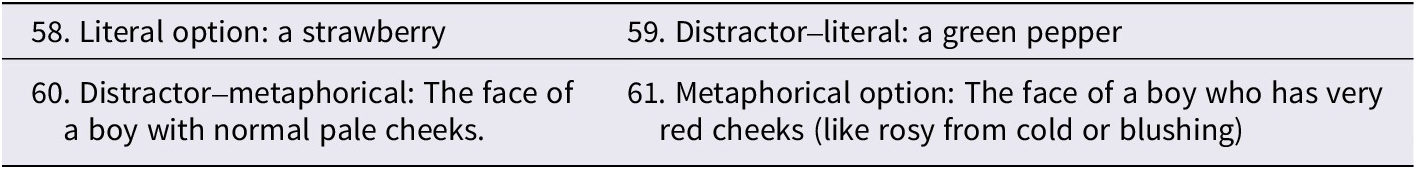
Los ríos tienen mucha agua. El niño es un río! (a kid soaked in water). Rivers have tons of water. That kid is a river. [kid soaked in water]
17a. Los ríos tienen mucha agua. Ese niño es un río. ¿Cuál es? 1
17b. Los ríos tienen mucha agua. Esa cosa es un río. ¿Cuál es? 2
Spinning tops spin a lot. That kid is a spinning top.
18a. Las peonzas dan muchas vueltas. Ese niño es una peonza. ¿Cuál es? 2
18b. Las peonzas dan muchas vueltas. Esa cosa es una peonza. ¿Cuál es? 1
Scissors cut stuff. That kid is a scissor!
19a. Las tijeras cortan cosas. Ese niño es una tijera. ¿Cuál es? 1
19b. Las tijeras cortan cosas. Esa cosa es una tijera. ¿Cuál es? 2
Racing cars go very fast. That kid is a racing car!
20a. Los coches de carreras van muy rápido. Ese niño es un coche de carreras. ¿Cuál es? 2
20b. Los coches de carreras van muy rápido. Esa cosa es un coche de carreras. ¿Cuál es? 1


 Open access