


Introduction
Dairy heifers undergo critical developmental transitions from birth to first calving that significantly affect their health, growth and future lactation performance (Steele et al, Reference Steele, Penner, Chaucheyras-Durand and Guan2016; van Niekerk Jk et al, Reference van Niekerk Jk, Fischer-Tlustos, Wilms, Hare, Welboren, Lopez, Yohe, Cangiano, Leal and Steele2021). The gastrointestinal (GI) tract follows a defined developmental trajectory, beginning with microbial colonization of a pseudo-monogastric system that relies on colostrum and milk intake at birth (van Niekerk Jk et al, Reference van Niekerk Jk, Fischer-Tlustos, Wilms, Hare, Welboren, Lopez, Yohe, Cangiano, Leal and Steele2021; Diddeniya et al, Reference Diddeniya, Ghaffari, Hernandez-Sanabria, Guan and Malmuthuge2024). With the gradual introduction of solid feed, the rumen undergoes an anatomical and functional maturation characterized by microbial stabilization, increased fermentation and a dietary shift from milk-based to solid feed (Steele et al, Reference Steele, Penner, Chaucheyras-Durand and Guan2016; Ghaffari et al, Reference Ghaffari, Hammon and Koch2025a). The transition to solid feed triggers significant microbial and metabolic reprogramming, including increased production of short-chain fatty acids, which promotes rumen epithelial development and remodels the microbial ecosystem along the GI tract (Meale et al, Reference Meale, Li, Azevedo, Derakhshani, Plaizier, Khafipour and Steele2016; Fischer et al, Reference Fischer, Villot, van Niekerk Jk, Yohe, Renaud and Steele2019; Diddeniya et al, Reference Diddeniya, Ghaffari, Hernandez-Sanabria, Guan and Malmuthuge2024). Postnatal rumen maturation, especially during the transition from pre-weaning to weaning and solid feed intake, is characterized by rapid growth and functional development of the rumen epithelium (Pokhrel and Jiang, Reference Pokhrel and Jiang2024). Meanwhile, shifts in gut microbiota composition and activity induce changes in the faecal metabolome that reflect adaptations in nutrient digestion, development and metabolic balance (Malmuthuge and Guan, Reference Malmuthuge and Guan2017; Amin et al, Reference Amin, Schwarzkopf, Tröscher-Mußotter, Camarinha-Silva, Dänicke, Huber, Frahm and Seifert2023; Ghaffari et al, Reference Ghaffari, Hammon and Koch2025a). Microbial fermentation products and faecal metabolites serve as biomarkers of gut development and host-microbiome interactions (Osorio, Reference Osorio2020; Shi et al, Reference Shi, Wang, Yan, Ma, Duan, Hassan, Wang and Deng2023). These findings underscore the importance of stage-appropriate nutritional management, as key developmental transitions are characterized by distinct shifts in metabolite profiles and gut microbiota, which are closely linked to microbial resilience, gut health and future productivity (Van Amburgh et al, Reference Van Amburgh, Soberon, Meyer and Molano2019; NASEM, 2021).
Faecal metabolites (i.e., amino acids [AA], biogenic amines, bile acids and lipids) provide non-invasive indicators of GI tract function by capturing the interplay between microbial fermentation, nutrient metabolism and host physiology (Zierer et al, Reference Zierer, Jackson, Kastenmüller, Mangino, Long, Telenti, Mohney, Small, Bell, Steves, Valdes, Spector and Menni2018; Ghaffari et al, Reference Ghaffari, Sauerwein, Sadri, Schuchardt, Martín-Tereso, Doelman and Daniel2025b,c). While faecal metabolomics has been investigated in a few studies with steers and cows (Malheiros et al, Reference Malheiros, Correia, Ceribeli, Cardoso, Colnago, Junior, Reecy, Mourão, Coutinho, Palhares, Berndt and Regitano2021; Kim et al, Reference Kim, Kim, Eom, Choi, Lee, Lee, Chung and Lee2021; Ghaffari et al, Reference Ghaffari, Sauerwein, Sadri, Schuchardt, Martín-Tereso, Doelman and Daniel2025b), its application to dairy heifers remains limited and represents a critical gap in the understanding of their developmental transitions. In adult cows, the increase in Glu, Met, β-alanine and methionine sulfoxide in feces during the transition from the dry period to lactation is likely due to changes in nitrogen metabolism caused by a combination of physiological transitions (such as cessation or onset of lactation) and concurrent changes in the nutrient composition of the diet (Ghaffari et al, Reference Ghaffari, Sauerwein, Sadri, Schuchardt, Martín-Tereso, Doelman and Daniel2025b). Increased polyamine levels, including spermidine and putrescine, were observed after parturition and may reflect both enhanced cell growth and tissue regeneration, as well as the transition to a cereal-rich, nutrient-dense diet (Ghaffari et al, Reference Ghaffari, Sauerwein, Sadri, Schuchardt, Martín-Tereso, Doelman and Daniel2025b). Elevated γ-aminobutyric acid (GABA) concentrations during lactation further indicate increased microbial activity associated with greater dietary nutrient availability (Ghaffari et al, Reference Ghaffari, Sauerwein, Sadri, Schuchardt, Martín-Tereso, Doelman and Daniel2025b). These results highlight the potential of faecal metabolite profiling as a valuable tool for monitoring gut function and metabolic adaptations, particularly during key physiological transitions, improving the precision of nutritional management strategies.
Despite these insights, there are no longitudinal studies that have characterized the dynamics of faecal metabolites throughout the developmental trajectory of dairy heifers, leaving critical gaps in understanding their stage-specific role. To address this gap, the present study aimed to characterize the faecal profiles of amino acids, biogenic amines, and other metabolites at key developmental stages, including immediately after birth, pre-weaning (week 6), at weaning (week 14), post-weaning (months 8), and calving. It was hypothesized that faecal metabolite profiles would exhibit distinct, stage-specific patterns associated with calf age and management transitions such as weaning and dietary changes, providing new insights into the temporal evolution of the gastrointestinal metabolome associated with heifer development.
Materials and methods
The study was conducted at the Educational and Research Centre for Animal Husbandry, Hofgut Neumühle (Münchweiler an der Alsenz, Germany). This study followed the guidelines of the German Law for Animal Welfare by permission of the local authority in charge (G23-23-089; Landesuntersuchungsamt Rheinland-Pfalz, Koblenz, Germany). As part of a companion study to Ostendorf et al (Reference Ostendorf, Ghaffari, Cohrs, Koch and Sauerwein2025), a total of 10 female Holstein calves were enrolled for metabolic profiling of faeces. Newborn calves received an average of 3.8 L of colostrum via oesophageal tube feeding within 2 h of birth. After a second colostrum feeding (∼11.5 h after birth), the calves received fresh maternal transition milk (6 L twice daily for 5 days; Fig. 1A). After colostrum feeding, each calf was given 7 mL of oral iron suspension (Ursoferran 150 mg/mL, Serumwerk Bernburg AG, Germany) and the navels were disinfected with 10% povidone-iodine solution (Vet-Sept Solution, aniMedica GmbH, Germany). After the first 5 d of life, calves received 6 L of milk replacer (MR) twice daily. On day 14 (±3 days), the calves were moved to group housing with open straw pens. Throughout the pre-weaning period, calves had unrestricted access to pelleted starter concentrate (up to 9.8 kg/calf per day), hay, and water, in addition to the milk replacer feeding. An automatic feeding system (VARIO smart Kombi, Förster-Technik GmbH, Engen, Germany) supplied the calves with up to 12 L/day of MR and pelleted starter concentrate. From week 8, the MR supply was gradually reduced until the calves were fully weaned at week 14. After weaning, the calves had ad libitum access to hay, water, and TMR, and group housing was continued from the age of months 8 until the first calving (Fig. 1A). Detailed nutrient composition and ingredient information for colostrum, transition milk, and MR are presented in Table 1, while the composition of the pelleted calf concentrate and TMR (DM basis) is provided in Table 2.
Schematic representation of the study design and the analytical workflow. (A) Overview of the experimental design and faecal sampling including immediately after birth, pre-weaning (week 6), at weaning (week 14), post-weaning (months 8) and calving (mean age 26 ± 2.3 months). (B) Summary of faecal sampling time points (n = 10 calves), metabolomic profiling using the MxP® Quant 500 kit (Biocrates Life Sciences AG, Innsbruck, Austria), and subsequent analysis by liquid chromatography–electrospray ionization–tandem mass spectrometry (LC-ESI-MS/MS) and statistical data interpretation.

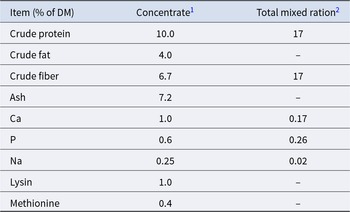
Composition of colostrum, transition milk and milk replacer

1 Measured with the Bradford assay (Bradford, Reference Bradford1976)
2 Fat content was measured using the Mojonnier method (Kleyn et al, Reference Kleyn, Trout and Weber1988)
3 Lactose concentrations were measured at the Research Unit Nutritional Physiology, Leibniz Institute for Farm Animal Biology (FBN), Dummerstorf, Germany, using the protocol of Görs et al (Reference Görs, Kucia, Langhammer, Junghans and Metges2009), modified for bovine milk (Uken et al, Reference Uken, Schäff, Vogel, Gnott, Dannenberger, Görs, Tuchscherer, Tröscher, Liermann and Hammon2021)
4 Calculated according to the equation from NRC (2001): (0.057 × Crude protein [%] + 0.092 × Fat [%] + 0.0395 × Lactose [%]) × 0.97 × 0.96
5 Milk replacer ingredients: 50.0% skim milk powder, vegetable oil, whey powder, whey powder (partly desugared)
Composition and ingredients of pelleted calf concentrate and total mixed ration

1 Concentrate ingredients: 35% maize, 18.7% soy extraction meal, 13.0% beet molasses pulp, 7.6% rapeseed extraction meal, 7.5% wheat, 4.9% barley, 4.8% linseed, 3.5% beet molasses, 3.2% wheat gluten, 3.2% wheat bran, 1.2% calcium carbonate, 0.3% natrium chloride, 0.06% magnesium oxide.
2 Total mixed ration ingredients: 38.88% grass (2nd cut), 35.49% corn silage, 9.05% straw, 7.32% concentrate meal mix, 0.37% mineral mix.
The heifers were integrated into the lactating herd 3 weeks before expected calving to adapt them to the milking system (GEA Farm Technologies GmbH). The heifers were moved to the calving pen at the first sign of parturition. Faecal samples were collected from the rectum of a subset of heifer calves (n = 10) after birth (12 h), before weaning (week 6), at weaning (week 14), after weaning (months 8) and at first calving (mean age 26 ± 2.3 months). At 12 h after birth, faecal samples were taken immediately after the second colostrum feeding. At weeks 6 and 14, samples were taken at similar times of the day in the morning; however, these times were not directly related to feeding events as the calves had unrestricted access to an automated feeding system. Faecal samples at 8 months of age were taken approximately 3 h after morning feeding. At the time of calving, samples were taken within 12 hours of parturition. The same 10 heifers were sampled at each stage of development to ensure a longitudinal study. All faecal samples were immediately frozen at − 80°C and transported on dry ice for subsequent extraction and metabolomic analysis (Fig. 1B).
Metabolomics analysis
Faecal concentrations of AA, biogenic amines and AA-related metabolites were quantified using the MxP® Quant 500 XL kit (Biocrates Life Sciences AG, Innsbruck, Austria) according to the manufacturer's protocols as already explained in our previous study (Ghaffari et al, Reference Ghaffari, Sauerwein, Sadri, Schuchardt, Martín-Tereso, Doelman and Daniel2025b). For extraction of metabolites, 100 mg of the faecal sample were homogenized in extraction buffer (85:15 ethanol:phosphate buffer, 20 mM) at a ratio of 1:3 (weight/volume). For this purpose, 2-mL Precellys CK14 tubes and a Precellys 24 homogenizer (Bertin Technologies SAS, France) were used. Homogenization was performed in three 20-s cycles at 5500 rpm with cooling intervals, followed by cooling on ice and double centrifugation at 10 000 × g for 5 min at 4°C. The supernatants were stored at −80°C until further analysis. Targeted metabolomics analysis was performed at the Fraunhofer Institute for Toxicology and Experimental Medicine (Hanover, Germany) using LC-MS/MS with a 1290 Infinity II liquid chromatograph and a Sciex 5500 QTrap mass spectrometer. Internal standards were pre-spotted onto 96-well plates, and analytes were derivatized using phenyl isothiocyanate. Quantification was performed using stable isotope dilution and multipoint calibration for LC-MS/MS analytes. Limits of detection (LOD) were determined using PBS blanks, and analytes with concentrations below the LOD or > 20% missing values were excluded from further analysis.
Statistical analyses
Statistical analyses were performed using MetaboAnalyst 6.0 (www.metaboanalyst.ca; Fig. 1B). Data matrices were first checked for numerical integrity and formatting standards, with outliers removed using the interquartile range method (>1.5 × IQR) and missing values imputed by the minimum observed value. For variance normalization and improvement of the data distribution, a cube root transformation with subsequent Pareto scaling was performed. Partial least squares discriminant analysis (PLS-DA) was performed and the significance of class discrimination was assessed using permutation tests (Pang et al, Reference Pang, Chong, Zhou, de Lima Morais Da, Chang, Barrette, Gauthier, Jacques, Li and Xia2021). To investigate stage-specific metabolite patterns, heat maps and hierarchical clustering for faecal metabolites were created using MetaboAnalyst 6.0. Faecal metabolite concentrations were analysed using linear mixed-effects models implemented with the PROC MIXED procedure in SAS version 9.4 (SAS Institute Inc., Cary, NC, USA). Prior to the analysis, the normality of the residuals was tested with the Shapiro–Wilk test and the homogeneity of variance with the Levene test. Both tests were performed with the UNIVARIATE procedure in SAS. As the data did not meet the assumptions of normality, a log10 transformation was performed before modelling. In the final model, time of sampling (age) was defined as a fixed effect and individual calf as a random effect. The Tukey HSD post hoc test was used to adjust for multiple comparisons. The threshold of significance was set at P ≤ 0.05; trends were declared at 0.05 < P < 0.10.
Results and discussion
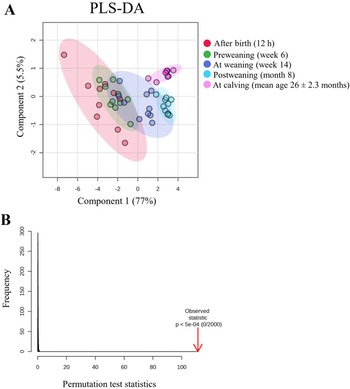
The faecal AA profiles of dairy heifers showed significant temporal variation across the developmental stages from birth to first calving (Fig. 2). The PLS-DA score plot (Fig. 2A) showed a clear clustering of faecal AA profiles across different time points, with the first principal component explaining 77% and the second 5.5% of the total variance. Permutation tests (P = 0.001, 2000 permutations; Fig. 2B) confirmed the robustness of these separations. The temporal dynamics of the individual metabolites were further investigated using linear mixed-effects models. Table 3 summarizes the P-values for the influence of sampling time (developmental stage) on faecal concentrations of AA, biogenic amines and related metabolites. The heat map of 17 AA (Fig. 3) showed significant temporal shifts. At 12 h after birth, AA concentrations in faeces were generally higher than at later time points (week 14, month 8, and calving), although certain AA (e.g., Ala, Met, Pro) peaked in pre-weaning (at week 6). These patterns likely reflect both physiological maturation and major dietary changes during development. The high AA levels in the feaces after birth likely reflects the ingestion of protein- and peptide-rich colostrum in conjunction with the immature digestive capacity of the neonatal GIT (Baldwin RL et al, Reference Baldwin RL, McLeod, Klotz and Heitmann2004; Rey et al, Reference Rey, Enjalbert and Monteils2012; Baldwin and Connor, Reference Baldwin and Connor2017). The limited activity of proteolytic enzymes and underdeveloped mucosal structures contribute to inefficient protein digestion and absorption (Huber et al, Reference Huber, Jacobson, Allen and Hartman1961; Huërou I et al, Reference Huërou I, Guilloteau, Wicker, Mouats, Chayvialle, Bernard, Burton, Toullec and Puigserver1992; Guilloteau et al, Reference Guilloteau, Zabielski and Blum2009; Rey et al, Reference Rey, Enjalbert and Monteils2012), resulting in increased AA excretion in the faeces. At 6 weeks of age, faecal AA concentrations remained elevated but decreased slightly, reflecting the initial maturation of intestinal enzymatic function. This pattern likely corresponds to increased activity of brush border enzymes, particularly aminopeptidase N and maltase, in conjunction with modulation by intestinal regulatory peptides such as cholecystokinin and secretin, which coordinate digestive efficiency and nutrient absorption during early intestinal development (Huërou I et al, Reference Huërou I, Guilloteau, Wicker, Mouats, Chayvialle, Bernard, Burton, Toullec and Puigserver1992; Guilloteau et al, Reference Guilloteau, Zabielski and Blum2009). After weaning, a marked and progressive decrease in faecal AA concentrations was observed, indicating progressive rumen functionality and improved overall digestive competence. At 8 months of age and at calving, faecal AA concentrations had significantly decreased (Fig. 3), clearly indicating improved nutrient absorption capacity and efficient microbial nitrogen metabolism within the established rumen ecosystem (Baldwin RL et al, Reference Baldwin RL, McLeod, Klotz and Heitmann2004; Meale et al, Reference Meale, Chaucheyras-Durand, Berends, Guan and Steele2017).
Longitudinal changes in faecal amino acids in dairy heifers. (A) PLS-DA score plot showing distinct clustering at 12 h, week 6, week 14, months 8, and calving. (B) Permutation test confirming model validity.

Longitudinal heatmap of faecal amino acid profiles in dairy heifers from birth to first calving. Normalized metabolite abundance (Z-score) is shown for each sampling time point: after birth (12 h), preweaning (week 6), at weaning (week 14), postweaning (month 8) and at calving. Rows represent individual amino acids; columns indicate developmental stages. Asterisks (*) denote amino acids with significant changes over time (P < 0.05; linear mixed model with post hoc correction). Blue indicates lower, and red higher, relative abundance compared to the mean.

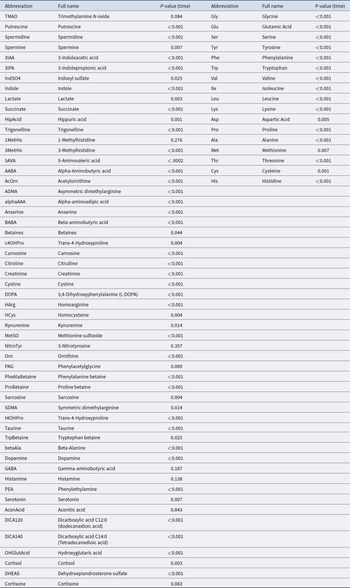
P-values for the effect of developmental stage on faecal amino acids, biogenic amines and related metabolites in dairy heifers as determined by linear mixed-effects model

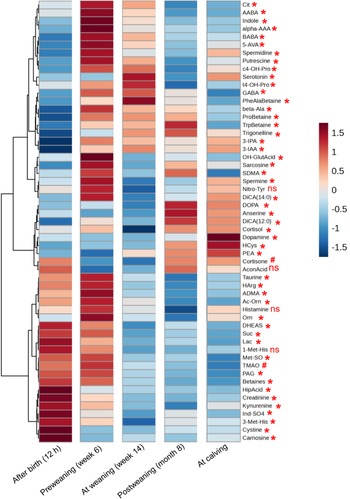
The PLS-DA analysis based on biogenic amines, amino acids–related compounds and other metabolites showed a clear separation of samples by time point, with components 1 and 2 explaining 44.2% of the variance (Fig. 4A). The faecal profiles clustered clearly by developmental stage, particularly between the pre-weaning and post-weaning periods. However, there was notable overlap between the post-weaning and post-calving samples (Fig. 4A), indicating a gradual metabolic change in the later developmental stages of the heifers. Of the 55 metabolites analysed, 48 metabolites showed significant differences across developmental stages, 2 metabolites (cortisone, P = 0.06; trimethylamine N-oxide [TMAO], P = 0.08) showed a trend, and 5 metabolites (histamine, GABA, 1-methylhistidine, 3-nitrotyrosine, aconitic acid) showed no significant changes over time (Fig. 5; Table 3). Heatmap analysis identified distinct temporal trends for several faecal metabolites including citrulline, alpha-aminobutyric acid (AABA), beta-aminobutyric acid (BABA), indole, alpha-aminoadipic acid (α-AAA), 5-aminovaleric acid (5-AVA), spermine, spermidine, and putrescine (Fig. 5). These metabolites showed low levels immediately after birth, peaked at week 6 (pre-weaning), and declined sharply post-weaning. This trajectory likely reflects both the maturation of the digestive tract during the transition from milk to solid diets and the concurrent change in diet (Malmuthuge and Guan, Reference Malmuthuge and Guan2017; Ghaffari et al, Reference Ghaffari, Hammon and Koch2025a), in particular the increasing intake of grain-rich starter feed prior to weaning, followed by a transition to a forage-based TMR post-weaning.
Longitudinal changes in faecal metabolites in dairy heifers. (A) PLS-DA score plot showing distinct clustering at 12 h after birth, week 6, week 14, months 8 and calving. (B) Permutation test confirming model.

Longitudinal heatmap of faecal metabolite profiles in dairy heifers from birth to first calving. Normalized metabolite abundance (Z-score) is shown for each sampling time point: after birth (12 h), pre-weaning (week 6), at weaning (week 14), post-weaning (month 8), and at calving. Rows represent individual metabolites; columns indicate developmental stages. Blue colour represents lower, and red color higher, abundance relative to the mean. Metabolites marked with asterisks (*) show significant changes over time (P < 0.05), # indicates a trend (0.05 < P < 0.10), and "NS" denotes no significant change (P > 0.05) based on linear mixed-effects models with post hoc correction.

Hierarchical clustering showed a distinct temporal pattern in a subset of metabolites, including citrulline, α-aminobutyric acid (AABA), β-aminobutyric acid (BABA), γ-aminobutyric acid (GABA), indole, α-aminoadipic acid (α-AAA), 5-aminovaleric acid (5-AVA), spermine, spermidine and putrescine, the concentrations were lowest at birth, peaking during the pre-weaning phase (week 6), and declining significantly at weaning (Fig. 5). This trajectory coincides with the transition from a milk-based to a solid diet and reflects the critical remodeling of the GI tract (Malmuthuge and Guan, Reference Malmuthuge and Guan2017; Ghaffari et al, Reference Ghaffari, Hammon and Koch2025a). Elevated levels of polyamines (spermine, spermidine and putrescine) prior to weaning indicate increased cellular activity in the gut, consistent with their role in promoting epithelial proliferation, differentiation, apoptosis and macromolecule synthesis during mucosal development (Pegg, Reference Pegg2016). The subsequent decline in faecal polyamines at 8 months of age and at calving likely reflects both maturation of the gastrointestinal tract and changes in diet composition, which together improve digestive efficiency and reduce excretion of these metabolites. Although diet can influence polyamine synthesis, the observed decrease is most likely due to the combined effects of improved digestive capacity and dietary changes during development. These interpretations remain speculative and require further investigation.
Although we did not directly measure citrulline synthesis in the small intestine, the observed increase in faecal citrulline concentrations may indirectly reflect enhanced enterocyte function, increased protein turnover and maintenance of intestinal integrity, as suggested by previous research (Uyanga et al, Reference Uyanga, Amevor, Liu, Cui, Zhao and Lin2021). Elevated faecal concentrations of aminobutyric acid isomers, including AABA, BABA and GABA during milk feeding likely reflect microbial fermentation of dietary amino acids, supporting previous evidence of milk-associated microbial metabolism and co-regulation between host and microbiota (Zhang et al, Reference Zhang, Zhu, Li, Chen, Li, Li, Zhao, Xiao, Tang, Bi, Zhang, Zhang, Zhang, Li, Zhu, Zhang and Kong2024). The biosynthesis of GABA by Lactobacillus and Bifidobacterium via glutamate decarboxylation (Pokusaeva et al, Reference Pokusaeva, Johnson, Luk, Uribe, Fu, Oezguen, Matsunami, Lugo, Major, Mori-Akiyama, Hollister, Dann, Shi, Engler, Savidge and Versalovic2016) and the production of AABA via threonine, methionine and serine catabolism (Chiarla et al, Reference Chiarla, Giovannini and Siegel2011) are other microbial pathways that characterize the faecal metabolome. Although BABA is usually considered a plant-derived compound (Baccelli and Mauch-Mani, Reference Baccelli and Mauch-Mani2016), its consistent occurrence and correlation with the abundance of Lactobacillus in calves suggest a possible microbial origin in the developing bovine intestine (Wang et al, Reference Wang, Du, Huang, You, Zheng and Liu2021a). Taken together, these metabolite profiles highlight the concurrent metabolic and microbial adaptations associated with dietary transition and gut maturation of dairy calves in early life.
As shown in Fig. 5, the faecal concentrations of serotonin, β-alanine, phenylalanine-alanine-betaine (PheAlaBetaine), proline-betaine (ProBetaine), tryptophan-betaine (TrpBetaine), trigonelline, 3-indolepropionic acid (3-IPA) and 3-indoleacetic acid (3-IAA) were low at birth, increased by weeks 6 and 14 and decreased after weaning and at calving, indicating stage-specific metabolic responses to nutrition and microbial maturation. The increase in serotonin corresponds with increased microbial tryptophan metabolism and supports intestinal motility and epithelial integrity during early gut development (Sikander et al, Reference Sikander, Rana and Prasad2009; Nunzi et al, Reference Nunzi, Pariano, Costantini, Garaci, Puccetti and Romani2025). Increased β-alanine levels around weaning likely reflect its role in enhancing antioxidant capacity and intestinal barrier function during a period of physiological stress (Chen et al, Reference Chen, Zhong, Ouyang, Wang, Yin, Huang, Li, Wang, Xie, Huang, Yang and Yin2022). The concomitant increase in betaine derivatives (PheAlaBetaine, ProBetaine, TrpBetaine) is consistent with their role as osmolytes and methyl donors (Lever and Slow, Reference Lever and Slow2010), suggesting improved cellular homeostasis during the dietary transition. Importantly, these metabolites are recognized as products of microbial metabolism in the intestine. Previous studies have shown that the microbiota actively converts dietary amino acids into betaine derivatives through fermentation in the large intestine. In a previous study, both in vivo mouse models and an in vitro faecal fermentation system in humans confirmed the microbial origin of these metabolites (Koistinen et al, Reference Koistinen, Kärkkäinen, Borewicz, Zarei, Jokkala, Micard, Rosa-Sibakov, Auriola, Aura, Smidt and Hanhineva2019). The observed increase in faecal betaine derivatives thus likely reflects both the physiological adaptation of the host and the dynamic activity of the microbiome during gastrointestinal development. Trigonelline, a microbial and host-derived NAD⁺ precursor, increases during weaning to support energy metabolism and muscle function (Calvani et al, Reference Calvani, Miccheli, Capuani, Tomassini Miccheli, Puccetti, Delfini, Iaconelli, Nanni and Mingrone2010; Membrez et al, Reference Membrez, Migliavacca, Christen, Yaku, Trieu, Lee, Morandini, Giner, Stiner, Makarov, Garratt, Vasiloglou, Chanvillard, Dalbram, Ehrlich, Sanchez-Garcia, Canto, Karagounis, Treebak, Migaud, Heshmat, Razi, Karnani, Ostovar and Feige2024), while the indole metabolites 3-IPA and 3-IAA, known to maintain mucosal homeostasis, reflect the increased activity of tryptophan-metabolizing bacteria during intestinal maturation (Alexeev et al, Reference Alexeev, Lanis, Kao, Campbell, Kelly, Battista, Gerich, Jenkins, Walk, Kominsky and Colgan2018).
A specific group of metabolites in faeces, i.e., 3,4-dihydroxyphenylalanine (DOPA), anserine, dodecanedioic acid (DiCA 12:0), cortisol, dopamine, homocysteine (HCys) and phenylethylamine (PEA) remained at low level through birth, pre-weaning, and weaning (weeks 6 and 14), but increased significantly after weaning and peaked at calving (Fig. 5). The post-weaning increase in dopamine likely reflects microbial conversion of DOPA by Enterococcus species expressing tyrosine decarboxylase (Wang et al, Reference Wang, Tong, Ma, Zhao, Pan, Cong, Han, Peng, Yu, Lin, Gao, Shou, Li, Zhang, Zhang, Fu, Wen, Yu, Cao and Jiang2021b), suggesting enhanced microbial neuroactive metabolism. Similarly, increased PEA levels indicate increased microbial decarboxylation of phenylalanine (Bose et al, Reference Bose, Mandal, Khan, Maji and Ashique2024), a shift potentially relevant to gut–brain signaling (Miri et al, Reference Miri, Yeo, Abubaker and Hammami2023; Sudo, Reference Sudo2019). The concomitant increase in HCys is consistent with activation of the trans-sulfuration pathway, which supports cysteine biosynthesis and antioxidant defenses during late gestation (Kalhan and Marczewski, Reference Kalhan and Marczewski2012; Sbodio et al, Reference Sbodio, Snyder and Paul2019). In contrast, the faecal concentrations of taurine, homoarginine (HArg), asymmetric dimethylarginine (ADMA), acetyl-ornithine (Ac-Orn), ornithine (Orn), dehydroepiandrosterone sulfate (DHEAS), succinate, methionine sulfoxide (Met-SO), creatinine, 3-methylhistidine (3-Met-His), cystine, and carnosine were highest during the neonatal and early pre-weaning period, followed by a steady decline after weaning (Fig. 5). This pattern reflects a gradual shift in metabolic priorities and substrate utilization as the calf's digestive physiology and microbial ecosystem mature. Taurine, which is critical for bile acid conjugation and redox homeostasis in early development, is particularly abundant during the milk feeding phase (Huxtable, Reference Huxtable1992). Ornithine, Ac-Orn and HArg are intermediates of the urea cycle and arginine metabolism, pathways associated with nitrogen disposal and enterocyte proliferation during intestinal growth (Bauchart-Thevret et al, Reference Bauchart-Thevret, Stoll, Chacko and Burrin2009). ADMA, an endogenous inhibitor of nitric oxide synthase, accumulates under oxidative stress and impairs nitric oxide production, indicating increased methylation activity and redox imbalance during rapid tissue growth (Böger, Reference Böger2004; Wang et al, Reference Wang, Strandgaard, Iversen and Wilcox2009). Similarly, increased Met-SO levels reflect oxidative modifications of methionine residues and serve as a marker for oxidative stress and protein turnover (Lai et al, Reference Lai, Sun, Tarafdar, Liu, Murphy, Kim and Levine2019). Creatinine and 3-Met-His serve as indicators of muscle mass development and myofibrillar protein breakdown (Sadri et al, Reference Sadri, Ghaffari, Sauerwein, Schuchardt, Martín-Tereso, Doelman and Daniel2025), respectively, and their decline postweaning suggests reduced muscle remodeling and a shift toward more efficient protein utilization.
In addition, differences in faecal water content, excretion and nutrient density at each developmental stage may contribute to the observed metabolite concentrations. These factors should be considered when interpreting the temporal patterns identified in this study.
Conclusion
Overall, the faecal amino acid and metabolite profiles in dairy heifers exhibit distinct, stage-specific shifts that reflect metabolic and microbial adaptations during development. However, the functional implications of these dynamics should be further investigated through integrative approaches that link faecal profiles to gut physiology, microbial composition and long-term performance outcomes.
Acknowledgements
This study was part of the ‘Calf and Heifer Net’ project funded by the German Federal Ministry of Food and Agriculture (Bonn, Germany). This publication was supported by the Open Access Publication Fund of the University of Bonn. The authors have not stated any conflicts of interest.


 Open access