

Introduction
Research on Arctic soils and soil formation has gained increasing attention over the past decade, leading to numerous studies on soil formation processes (Blaud, Lerch, Phoenix, & Osborn, Reference Blaud, Lerch, Phoenix and Osborn2015; Klaminder et al., Reference Klaminder, Krab, Larsbo, Jonsson, Fransson and Koestel2023; Wackett, Yoo, Olofsson, & Klaminder, Reference Wackett, Yoo, Olofsson and Klaminder2018; Wieder, Sulman, Hartman, Koven, & Bradford, Reference Wieder, Sulman, Hartman, Koven and Bradford2019). The effects of anthropogenic and socio-economic activities on soil development, particularly in relation to the accumulation of elements, have also been explored (Barbel, Todisco, & Bhiry, Reference Barbel, Todisco and Bhiry2020; Couture, Bhiry, Monette, & Woollett, Reference Couture, Bhiry, Monette and Woollett2016; Knudson, & Frink, Reference Knudson and Frink2010). When studying human impact on soils and the spatial extent of this influence, Arctic regions, where modern societal expansion has been limited, serve as valuable baselines for evaluating chemical inputs (Barbel et al., Reference Barbel, Todisco and Bhiry2020; Butler, Lopez-Forment, & Dawson Reference Butler, Lopez-Forment and Dawson2018; Couture et al, Reference Couture, Bhiry, Monette and Woollett2016; Jerand, Linderholm, Hedman, & Olsen, Reference Jerand, Linderholm, Hedman and Olsen2016; Knudson, & Frink, Reference Knudson and Frink2010).
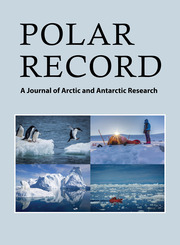
This study investigates two high-altitude sites in the Arctic Scandinavian Mountains (Fig. 1), where Arctic soil conditions influence both soil formation and chemical alteration (Egelkraut, Reference Egelkraut2017; Klaminder et al., Reference Klaminder, Krab, Larsbo, Jonsson, Fransson and Koestel2023). The sites differ in environmental regimes and land-use history, providing comparative examples to examine how sampling strategies and soil formation contribute to understanding human impact on soils, sites, and landscapes.
(A) The study area (marked with a yellow dot) in relation to Sweden and Scandinavia. (B) Regional overview of Lake Torneträsk and the two larger villages Abisko and Björkliden, with the extent of map C as a white rectangle. (C) Satellite image combined with an elevation model displays the local topography, with contour lines representing elevation (m a.s.l.) and white rectangles marking the extent of map D and E. (D) The Snuvrejohka settlement site, with the studied hearths marked in white and sampling points in orange. (E) The Maiva site with orange sampling points. Buildings and archaeological features are marked in white: (1) Peat goahti (Sámi hut), (2) The Maiva cabin, (3) Outbuilding, (4) House foundation, (5) Reindeer herder cabin, (6) Peat goahti remains, (7) House foundation and (8) House foundation.
The study area is located in the Arctic region surrounding Lake Torneträsk in northern Sweden. Until the early 20th century, this landscape remained largely undisturbed, with low levels of human impact. However, the construction of the Iron Ore Line, a railway linking the mining districts of northern Sweden to the Norwegian coast, marked a turning point for intensified anthropogenic influence (Andersson, Reference Andersson and Boheman1904; Hellner, Reference Hellner and Berg1911; SCB, 1907, 1912). The railway’s construction, use, and maintenance had direct physical consequences on the landscape, while also facilitating migration and tourism. In contrast, smaller-scale activities, such as homestead construction, land cultivation, grazing, and fodder collection, often go unrecognized in environmental assessments. These activities also contributed to environmental change but left subtler imprints that are often difficult to detect.
However, human influence in the Torneträsk region predates these modern developments. This landscape has long been an important area for Sámi land-use, with a history of reindeer herding, hunting, and fishing. For centuries, mobile Sámi settlements have shaped the landscape through seasonal movements and land-use practices. By the 18th century, reindeer husbandry had become increasingly central, though traditional foraging and hunting remained important subsistence strategies (Lundmark, Reference Lundmark1982). Today, the study area is used by two Sámi villages: Talma to the north of the lake and Gabna to the south. The Snuvrejohka site is part of this historical Sámi landscape, containing hearths and settlement remains that reflect a long-term presence. In contrast, the Maiva site represents a later phase of land-use, linked to 19th - and 20th-century homesteads and small-scale farming. The contrasting land-use histories of these sites provide an opportunity to examine how different forms of human activity influence soil development over time.
The aim of this paper is to describe the signs of human occupation in the soils of two sites with different human activities. Specifically, the study examines (1) how spatial sampling relates to anthropogenic features such as hearths and buildings and (2) which soil horizons show signs of human activity and how soil development is influenced by human impact.
Site presentations
The Snuvrejohka settlement site (ID L1993:368 in the Swedish National Heritage Board’s archaeological database) is located between the river Snuvrejohka and a smaller mountain stream. It was discovered during an archaeological survey in 1999 (Edbom, Reference Edbom2000) and registered as a Sámi viste, a settlement site typically dating from the Middle Ages to modern history. The site consists of six hearths and the remains of a lávvu, a temporary tent-like Sámi dwelling.
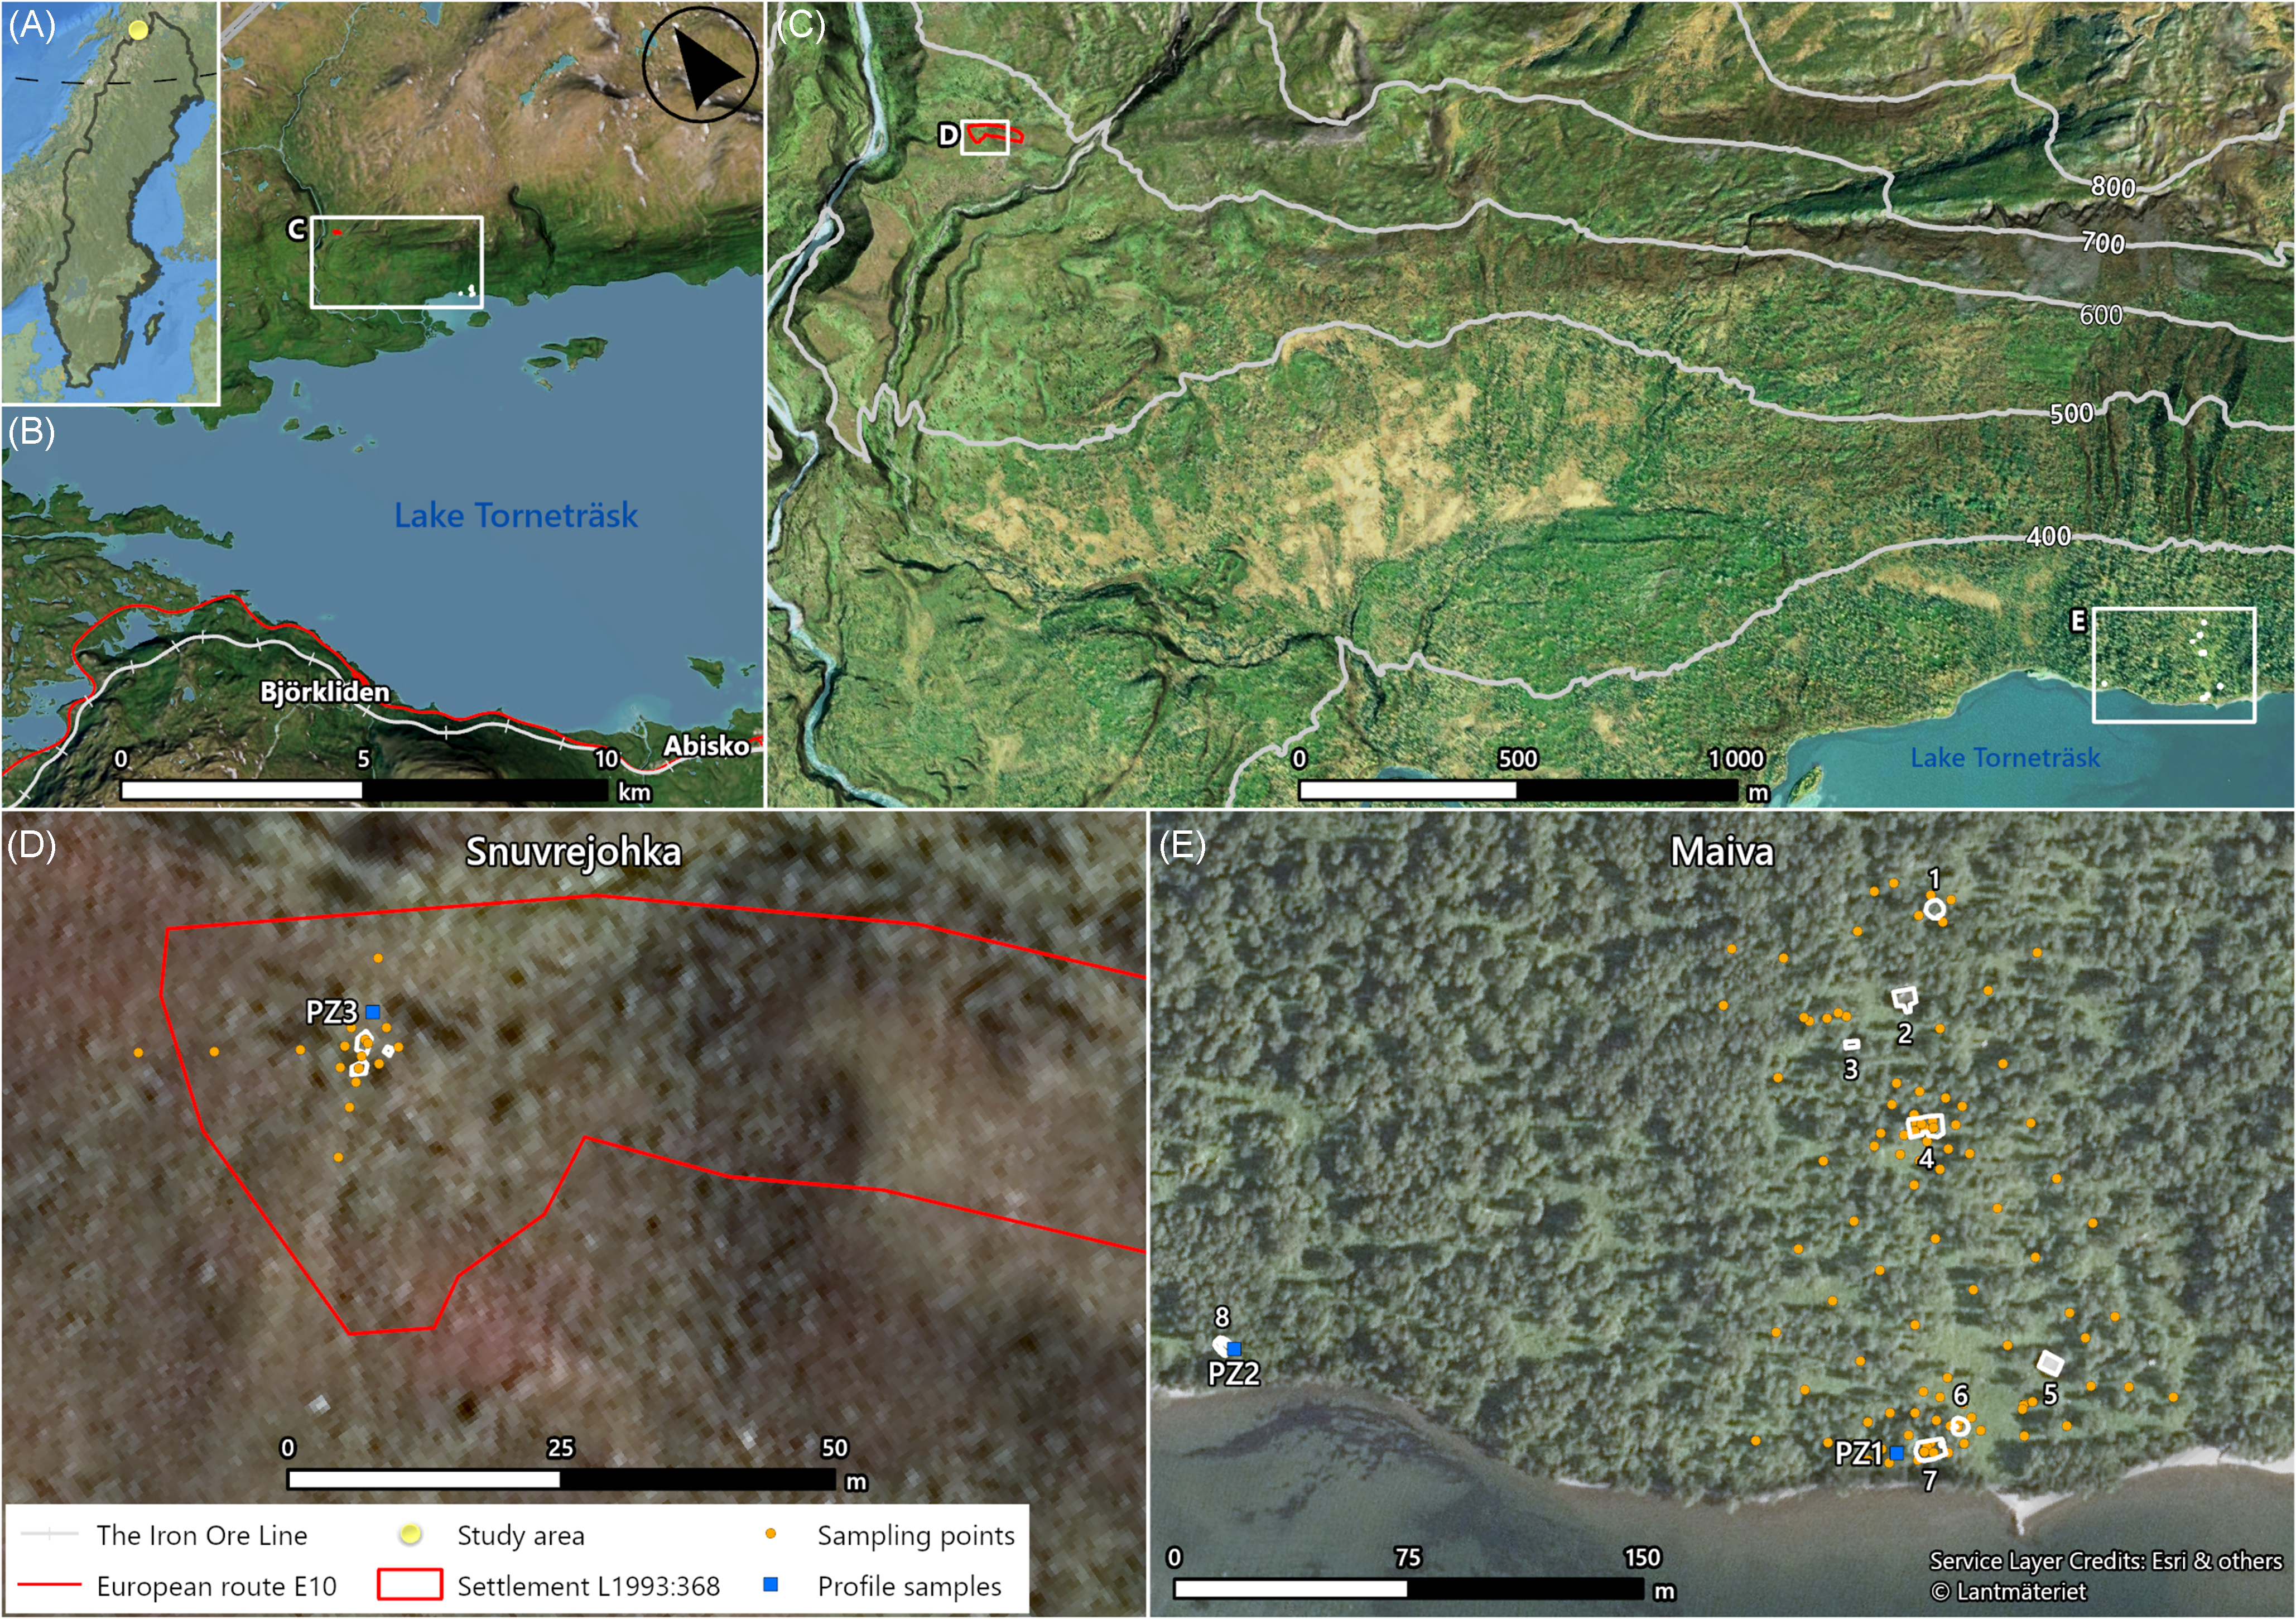
Situated at the edge of the tree line in a distinctly mountainous environment (575–578 m a.s.l.), the area primarily consists of dry moorland with scattered mountain birches, as shown in Figure 2 (Nordiska ministerrådet, 1984). The settlement is located on the moraine, which extends between the mountain Riksovárážat to the northwest and Jiebrenčorru to the east (SGU, 2023b). Glaciofluvial deposits are present approximately 100 m southwest of the site, continuing south along the Snuvrejohka river (SGU, 2023b). The underlying bedrock consists of limestone, which runs along the river and beneath the entire settlement area (SGU, 2023a). This limestone zone is surrounded by a larger unit of phyllite, with Riksovárážat and Jiebrenčorru partially composed of graphitic phyllite (SGU, 2023a). The dominant soil type is podzol (Jones et al., Reference Jones, Stolbovoy, Tarnocai, Broll, Spaargaren and Montanarella2010).
View of the surroundings at the Snuvrejohka site north of Lake Torneträsk, showing vegetation and grazing reindeer. Photograph by Johan Linderholm.
The surrounding landscape has long been used by Talma Sámi village. In 1906, a skiljesgärde (reindeer separation pen) was built approximately 500 m west of the settlement, on the opposite side of the Snuvrejohka river. Circa 1 km further northwest, a seasonal settlement was used for calf marking during the mid-20th century (Svonni, Reference Svonni1999:29).
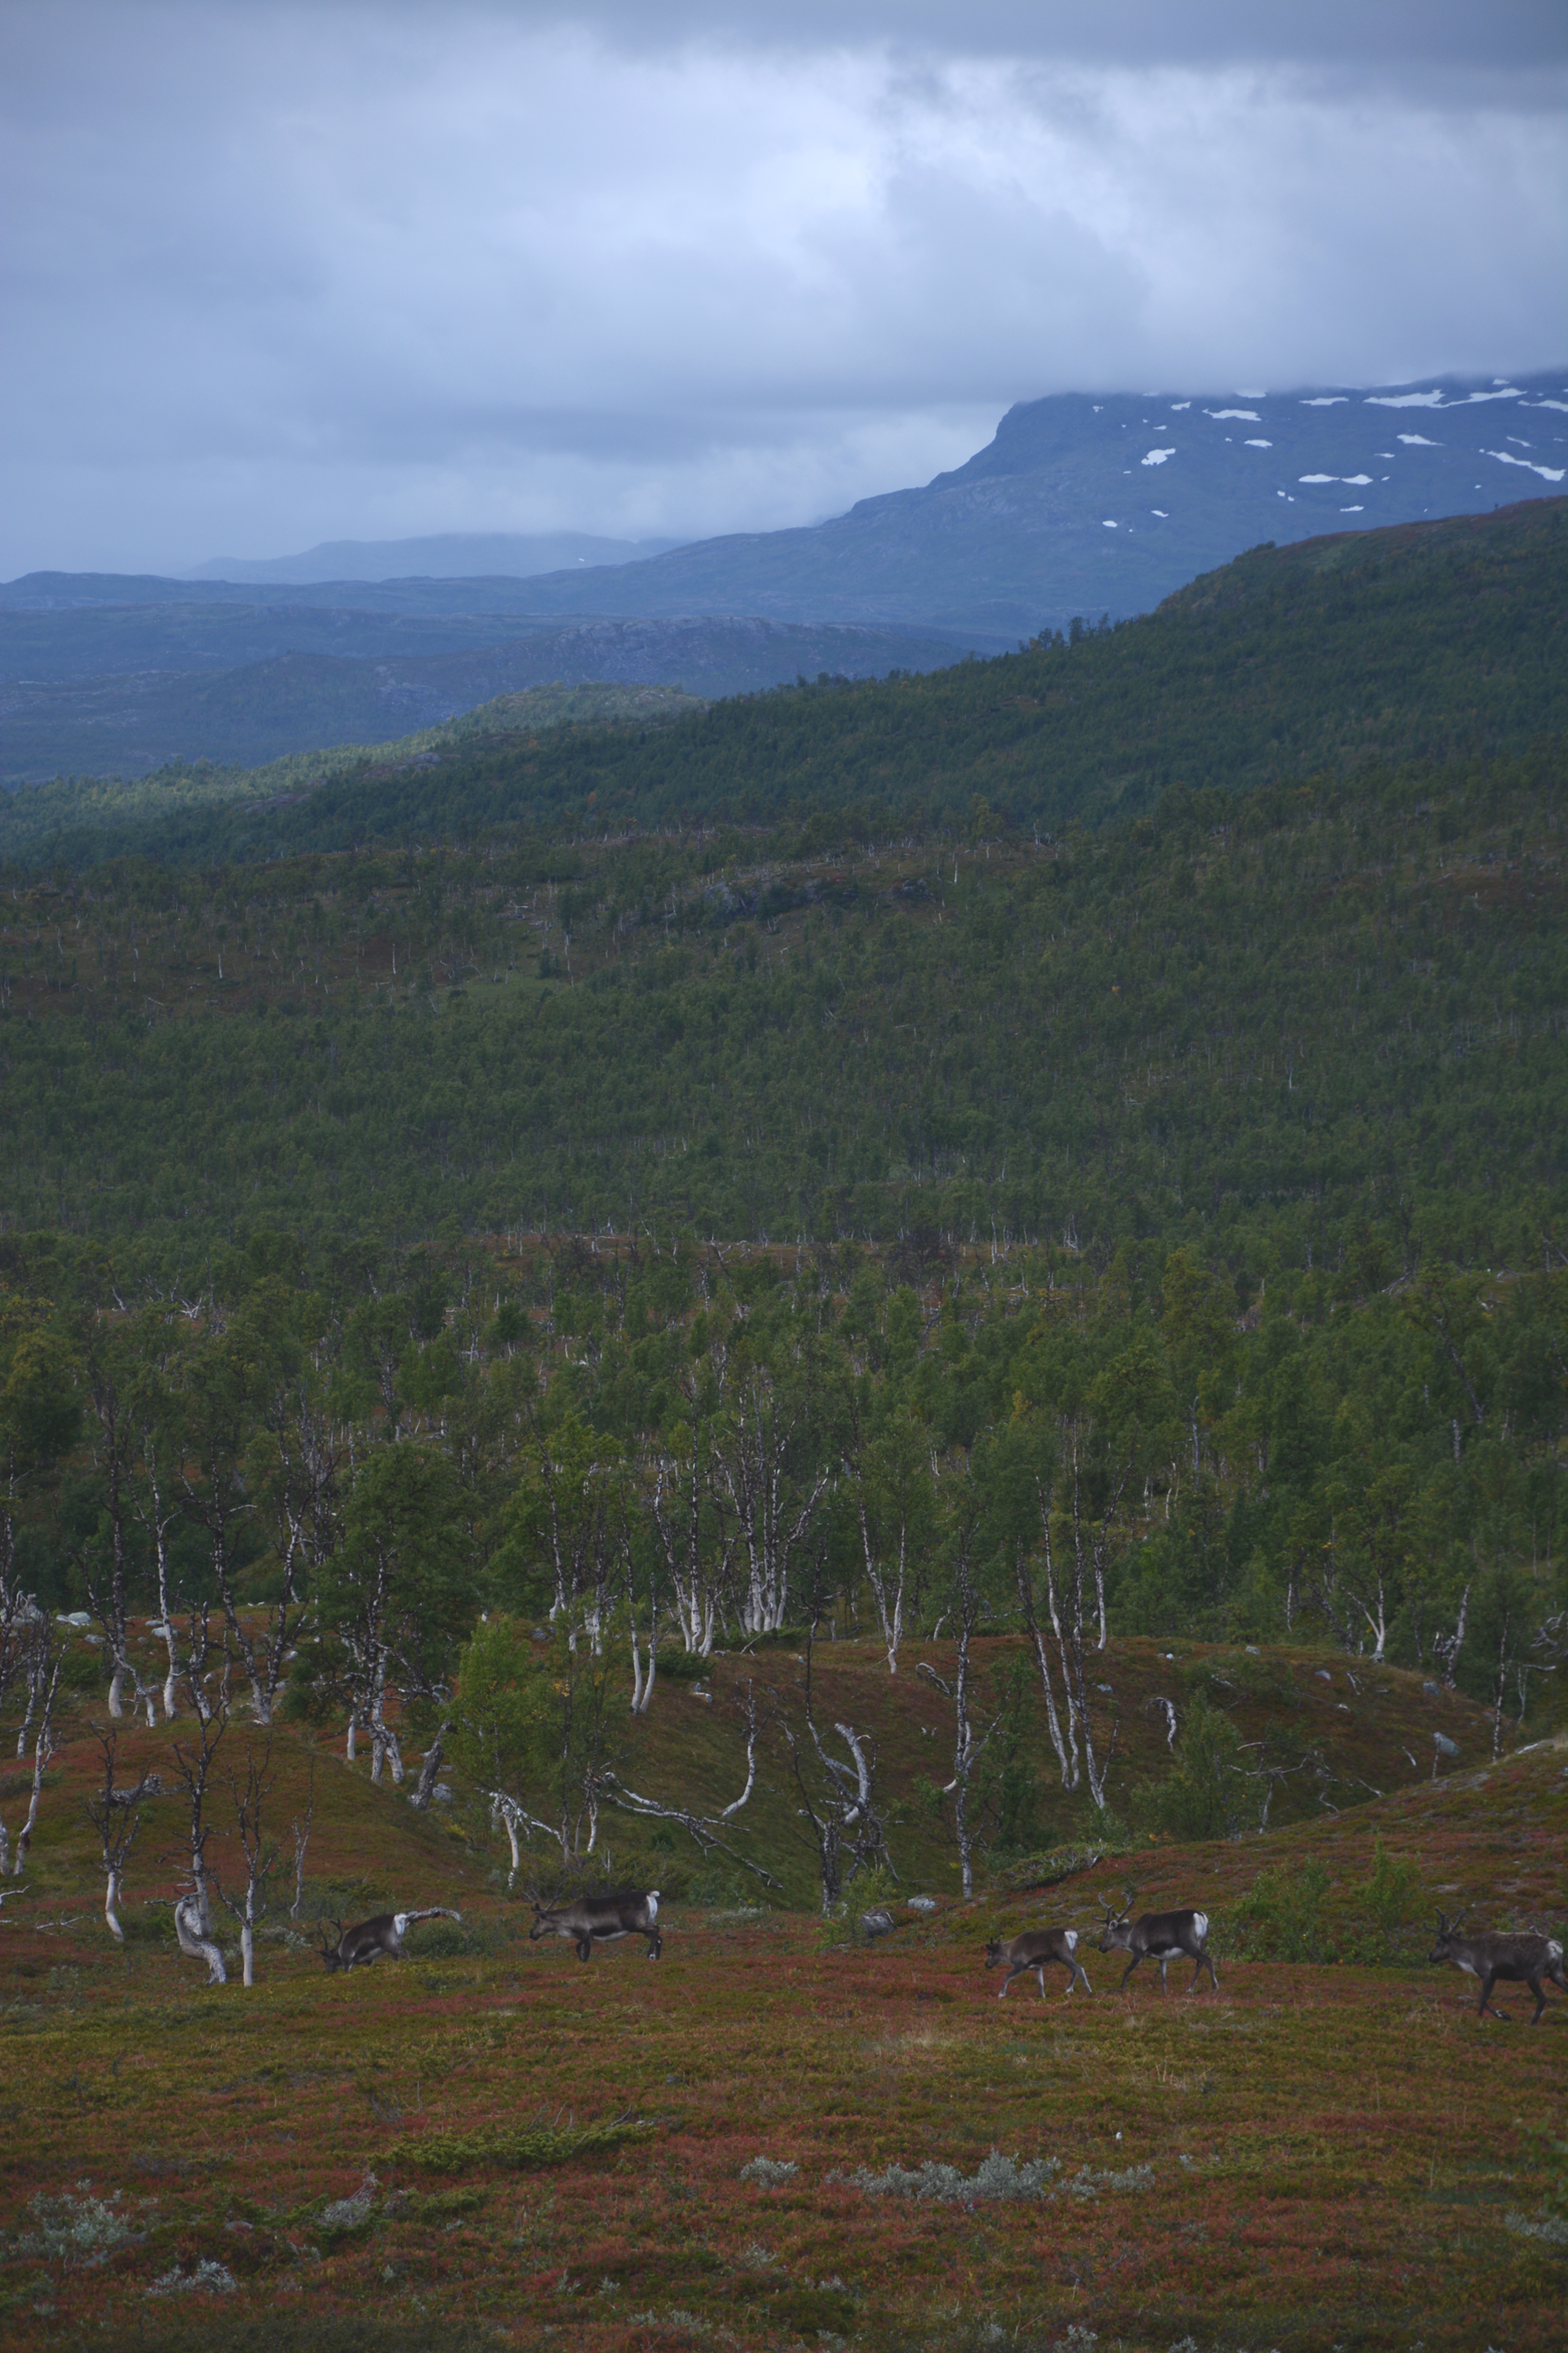
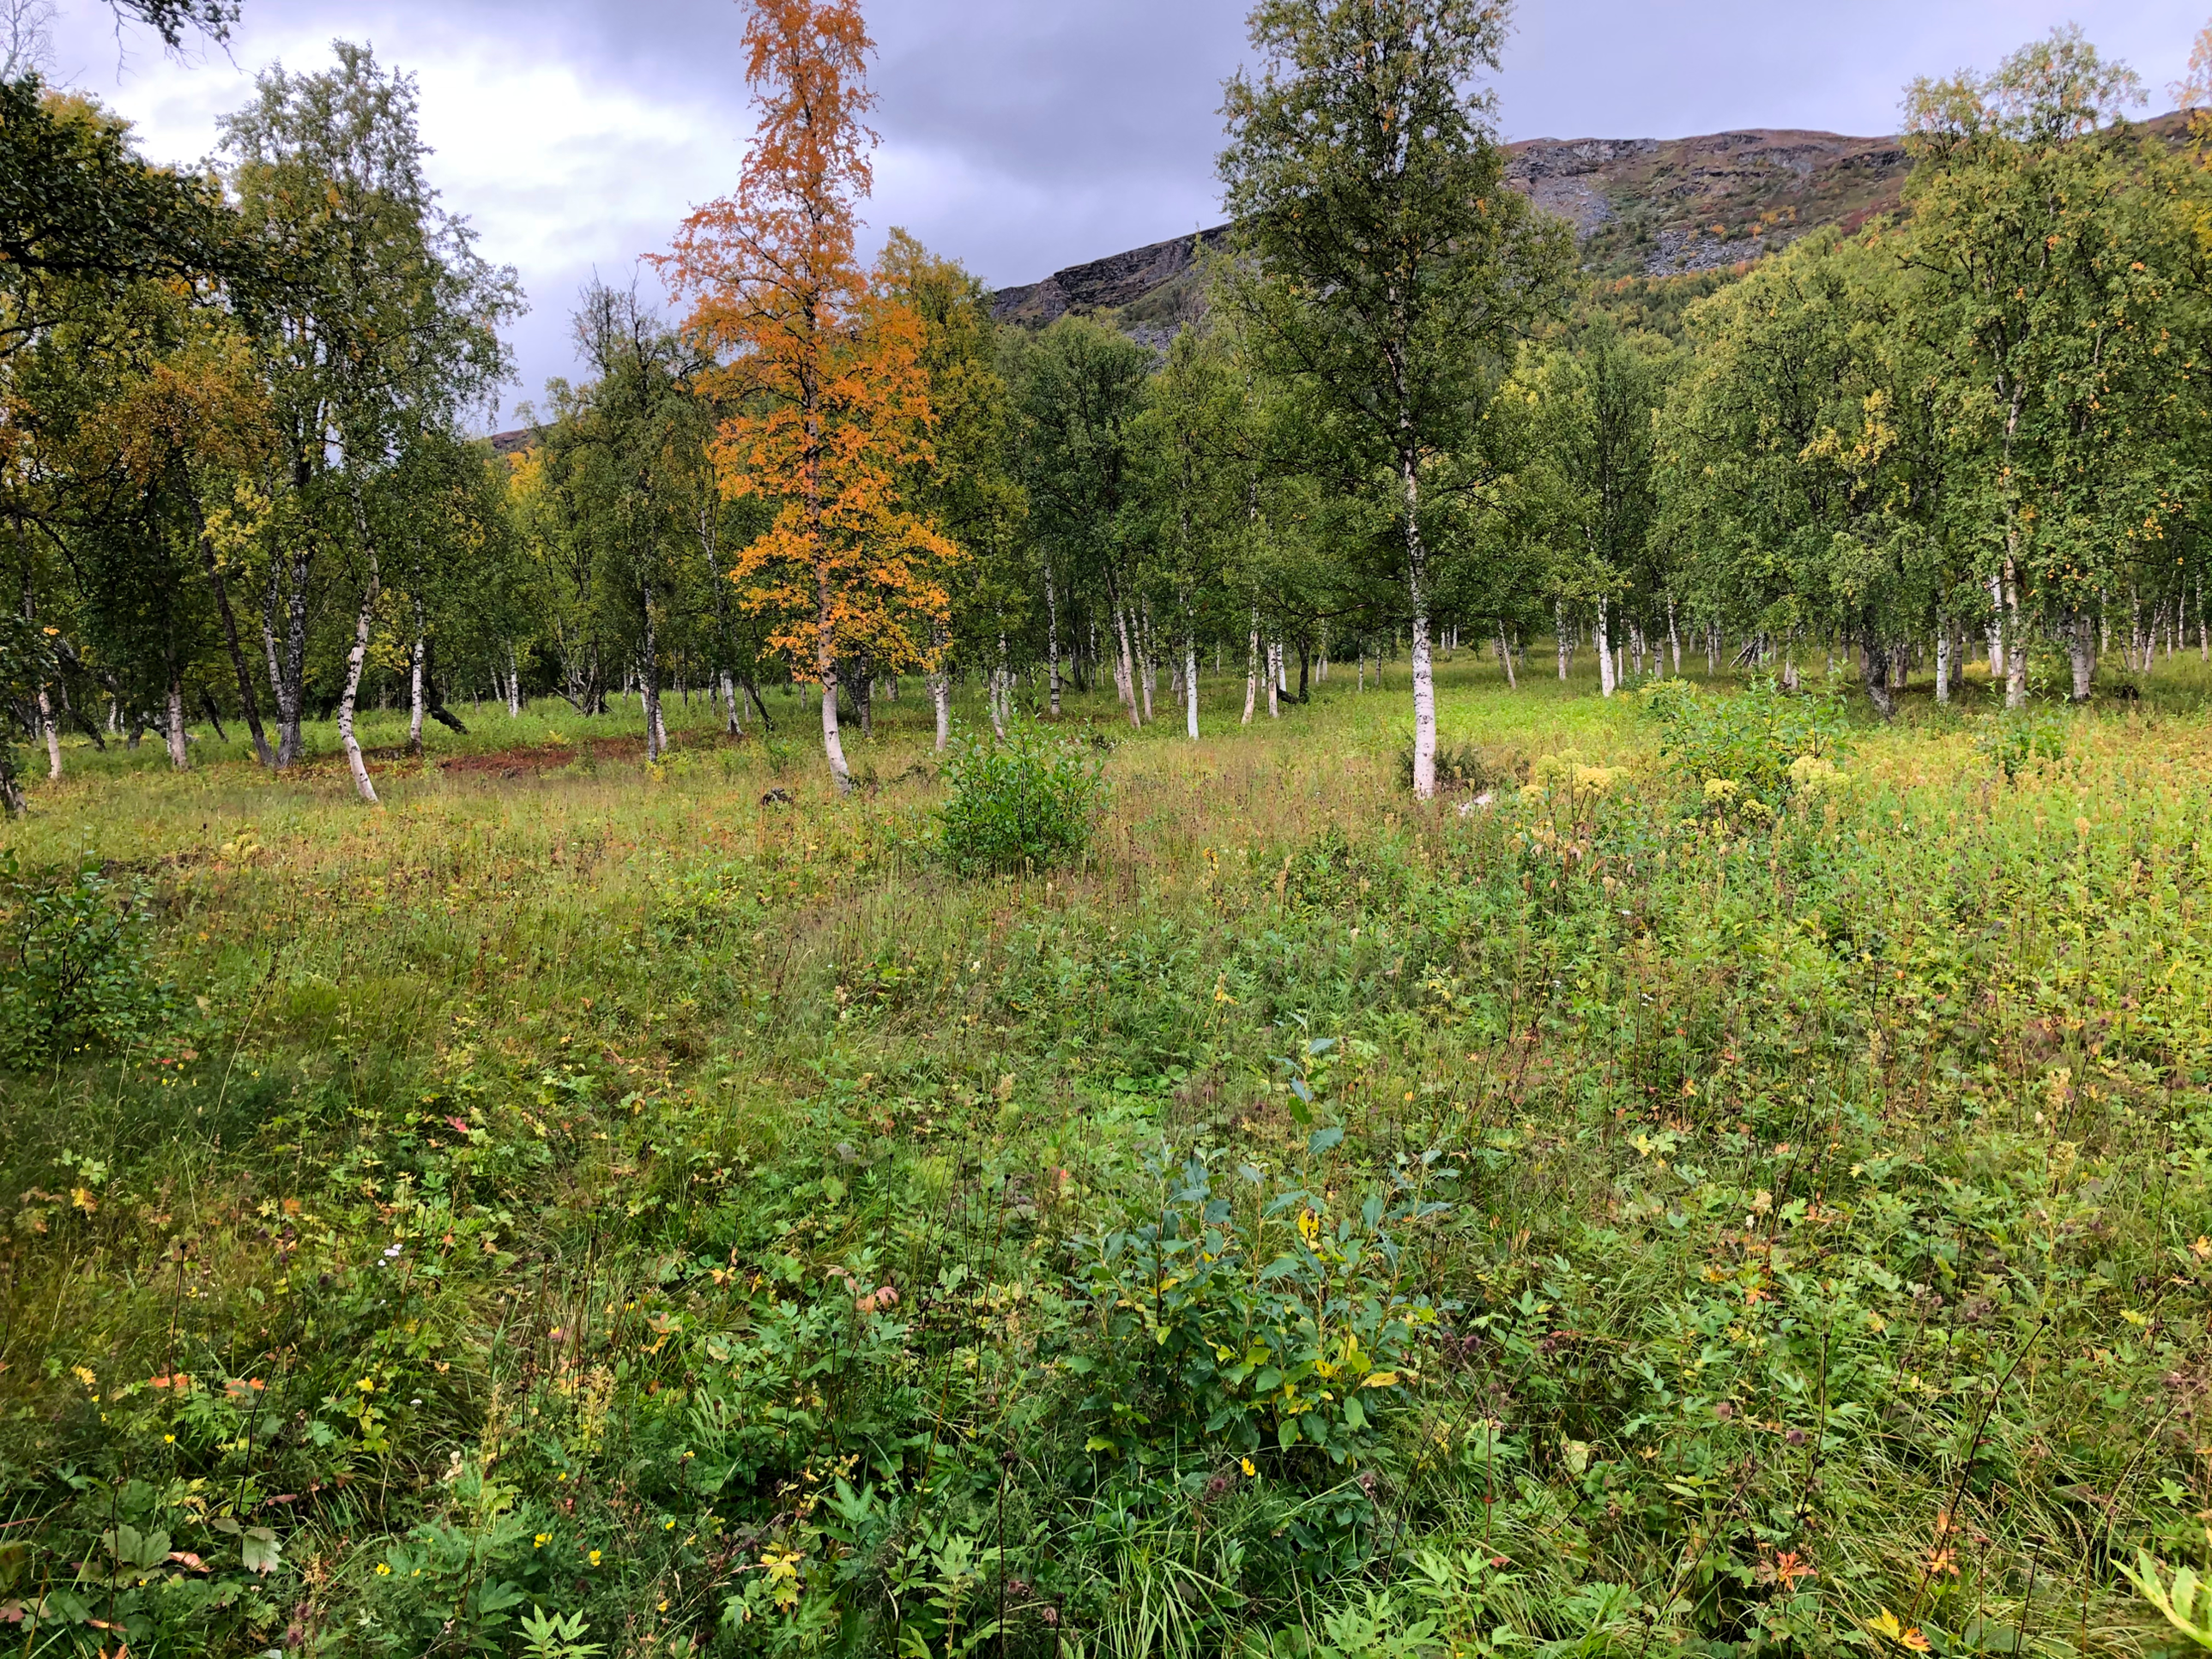
The Maiva site is located on the northern shore of Lake Torneträsk, south of Jiebrenčorru mountain, within a sub-alpine Arctic birch forest (Fig. 3). The site spans an elevation of 345–370 m a.s.l. and is situated on a landform named Jebrenkedde or Jèbrènkèddē (Wiklund, Reference Wiklund1910:58). The term kèddē can refer to a meadow, camping ground, reindeer corralling/milking ground, or an abandoned milking site with ample pasture (Collinder, Reference Collinder1964:84). The bedrock is predominantly phyllite, while the soil consists mainly of peaty cambisol with patches of podzol (Jones et al., Reference Jones, Stolbovoy, Tarnocai, Broll, Spaargaren and Montanarella2010) formed in postglacial moraine (SGU, 2023a, b).
The Maiva site on the shore of Lake Torneträsk, showing the surrounding vegetation and landscape. Photograph by Philip Jerand.
The Maiva site has historically served as an important pastureland for Talma Sámi village. Today, it hosts a research cabin belonging to the Abisko Scientific Research Station. In the 1940s and 1950s, this cabin was used as a sports cabin and tourist station (Jerand, Klaminder, & Linderholm, Reference Jerand, Klaminder and Linderholm2023). In the mid-1950s, a lávvu was also present at the site, serving as a stopover during journeys to the calf marking at Snuvrejohka (Svonni, Reference Svonni1999). During breaks in the calf marking, it was common for some Sámi to return to Maiva for fishing or travel across Lake Torneträsk to Abisko and Björkliden for shopping and visiting friends (Svonni, Reference Svonni1999).
Between 1900 and 1919, Maiva was used as a farmstead with cows and goats, where farming, hunting, and fishing were the primary occupations. Historical records indicate that a short-term farmstead may have existed at the site as early as 1871 (Jerand et al., Reference Jerand, Klaminder and Linderholm2023). These early agricultural activities introduced earthworms into the environment (Jerand et al., Reference Jerand, Klaminder and Linderholm2023).
Although Maiva and Snuvrejohka are broadly contemporary, they differ in altitude, environmental conditions, and socio-economic history.
Material and methods
Soil sampling was conducted using an open-end soil probe (3.5 cm bore diameter and 30 cm length). Soil profile classification was conducted according to Macphail and Goldberg (Reference Macphail and Goldberg2018).
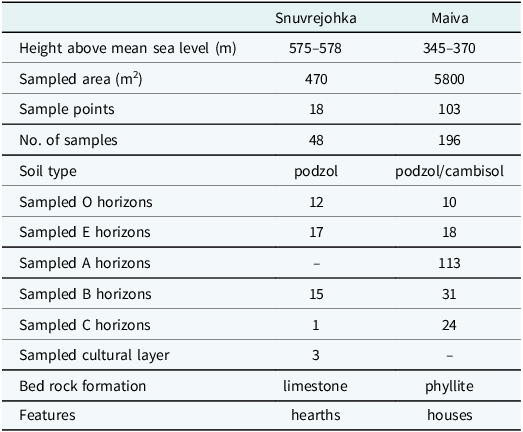
Three hearths of “irregular” shape and between 1.2–0.8 m × 0.9–0.6 m in size, located in the north-western part of the Snuvrejohka settlement, were investigated. Forty-eight samples were collected from 18 sample points, 17 from E horizons, where the results of human impact would be most expected, 12 from O horizons, 15 from B horizons, and 1 C horizon, to obtain information on soil formation. Three sample points located in or close to hearths contained a horizon with distinct remnants of human habitation in the form of charcoal and burnt bones. Samples collected from this horizon were labelled as pertaining to a “cultural layer.”
At the Maiva site, 196 soil samples were collected from 103 sample points. The site comprised two soil types: podzol and cambisol. Soil formation was influenced by both earthworm and human activity, resulting in a diverse composition. The samples were distributed across different horizons: 10 from O, 18 from E, 113 from A, 31 from B, and 24 from C. In many cases, the transition between the A and B horizons was diffuse, leading to the lower part of the A horizon being sampled separately, and this explains why the number of A horizon samples exceeds the number of sample points. Site and sampling information can be seen in Table 1.
Site context information. Sample points include both spatial and profile samples. Soil type according to Jones et al. (Reference Jones, Stolbovoy, Tarnocai, Broll, Spaargaren and Montanarella2010)
To investigate the influence of human activity on soil profile development, three “type profiles” (PZ1-PZ3) were selected for stratigraphic (vertical) sampling. These profiles were chosen based on variations in soil formation observed during field surveys at the two study sites (Fig. 1D-E).
At the Maiva site, two profiles (PZ1 and PZ2) were sampled from a podzol with vegetation dominated by low herbs, including alpine yellow-violet (Viola biflora L.), dwarf cornel (Cornus suecica L.), wood cranesbill (Geranium sylvaticum L.), and various grasses (Fig. 3). PZ1, located near the former stables, represents a podzol influenced by both human activity and earthworm bioturbation. In contrast, PZ2, sampled near a house foundation west of Maiva, serves as an example of a podzol in a cultural landscape where no earthworms were present due to a small stream acting as a natural barrier. The third profile, PZ3, was sampled above the tree line at Snuvrejohka. The vegetation in this area included blueberry (Vaccinium myrtillus L.), crowberry (Empetrum nigrum L.), lingonberry (Vaccinium vitis-idaea L.), and various grasses (Fig. 2).
These “type profiles” illustrate the influence of altitude, land-use, and biological activity on soil horizon development, allowing for a direct comparison and visualization of soil formation under different conditions.
Samples were dried at 30 °C in a drying room, then homogenized and sieved through a 1.25 mm sieve. The following parameters were analysed:
-
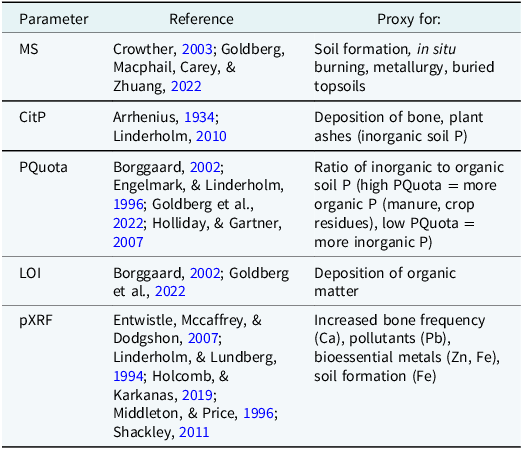
Phosphate fractions: Inorganic phosphate (CitP, mg P/kg dry matter, parts per million (ppm)) and total phosphate (CitPOI, mg P/kg dry matter, ppm), and the sum of inorganic and organic phosphate were determined by following standard methods (Engelmark, & Linderholm, Reference Engelmark and Linderholm2008). The phosphate data were used to calculate the PQuota (CitPOI/CitP), which indicates the relative proportion of organic phosphate in circulation.
-
Magnetic susceptibility (MS): Measured using a Bartington MS2/MS3 system on 10 g samples.
-
Soil organic matter: Determined by loss on ignition (LOI) at 550 °C (Carter, Reference Carter1993).
-
X-ray fluorescence spectroscopy (XRF): Conducted with a Thermo Scientific Niton XL5 Analyzer mounted on a portable test stand. The “Soil Mode” calibration was used for element quantification. In this study, Ca (calcium) and Fe (iron) are reported as percentages (%), while Zn (zinc) and Pb (lead) are presented in ppm. XRF has been widely applied in geoarchaeological studies (Frahm et al., Reference Frahm, Monnier, Jelinski, Fleming, Barber and Lambon2016; Schneider et al., Reference Schneider, Cancès, Breton, Ponthieu, Morvan, Conreux and Marin2016; Shackley, Reference Shackley and Shackley2011), with particular interest in lead due to its historical accumulation in Scandinavian soils from Roman times onward (Brännvall, Reference Brännvall2000).
These methods are adapted for soil prospection and bulk analysis of occupation soils and features (Engelmark & Linderholm, Reference Engelmark and Linderholm2008) and are summarized in Table 2. The analyses provide insights into soil formation and human activity. Phosphate quantification and fractionation help assess past manuring practices, while LOI estimates crude organic matter content. Magnetic susceptibility informs on soil iron rotation, shifting redox potential, and past fire use (Dearing, Reference Dearing1994; Grabowski & Linderholm, Reference Grabowski and Linderholm2022; Linderholm et al., Reference Linderholm, Macphail, Buckland, Östman, Eriksson, Wallin, Engelmark and Ystgaard2019).
List of analytical parameters and type of proxy
The spatial distribution of CitP, MS, PQuota, and Pb are visualized using Inverse Distance Weighted (IDW) interpolation. This method estimates values at unsampled locations by calculating a weighted average of nearby known values. Closer points have a greater influence, and the average cannot be greater than the highest or less than the lowest input.
At Snuvrejohka, interpolation was based on samples from E horizons, whereas at Maiva, both E and A horizon samples were included due to the site’s more complex soil composition. This difference does not affect the results, as the interpolated maps are used to identify spatial patterns within each site rather than for geostatistical analysis or direct comparison of absolute values between sites.
Charcoal from birch, collected from a hearth at Snuvrejohka, was radiocarbon dated by The Tandem Laboratory, Uppsala University. Calibration was performed using atmospheric data from Reimer et al. (Reference Reimer, Austin, Bard, Bayliss, Blackwell, Bronk Ramsey and Talamo2020).
Results
In general, the soil depth at the high-altitude site (Snuvrejohka) is half that of the site situated at a lower altitude (Maiva). At Snuvrejohka, the strata are also thinner. The resulting volumetric differences within soil horizons have implications for the overall accumulation and translocation of elements, and thus, direct comparison of elemental concentrations between sites should be undertaken with caution.
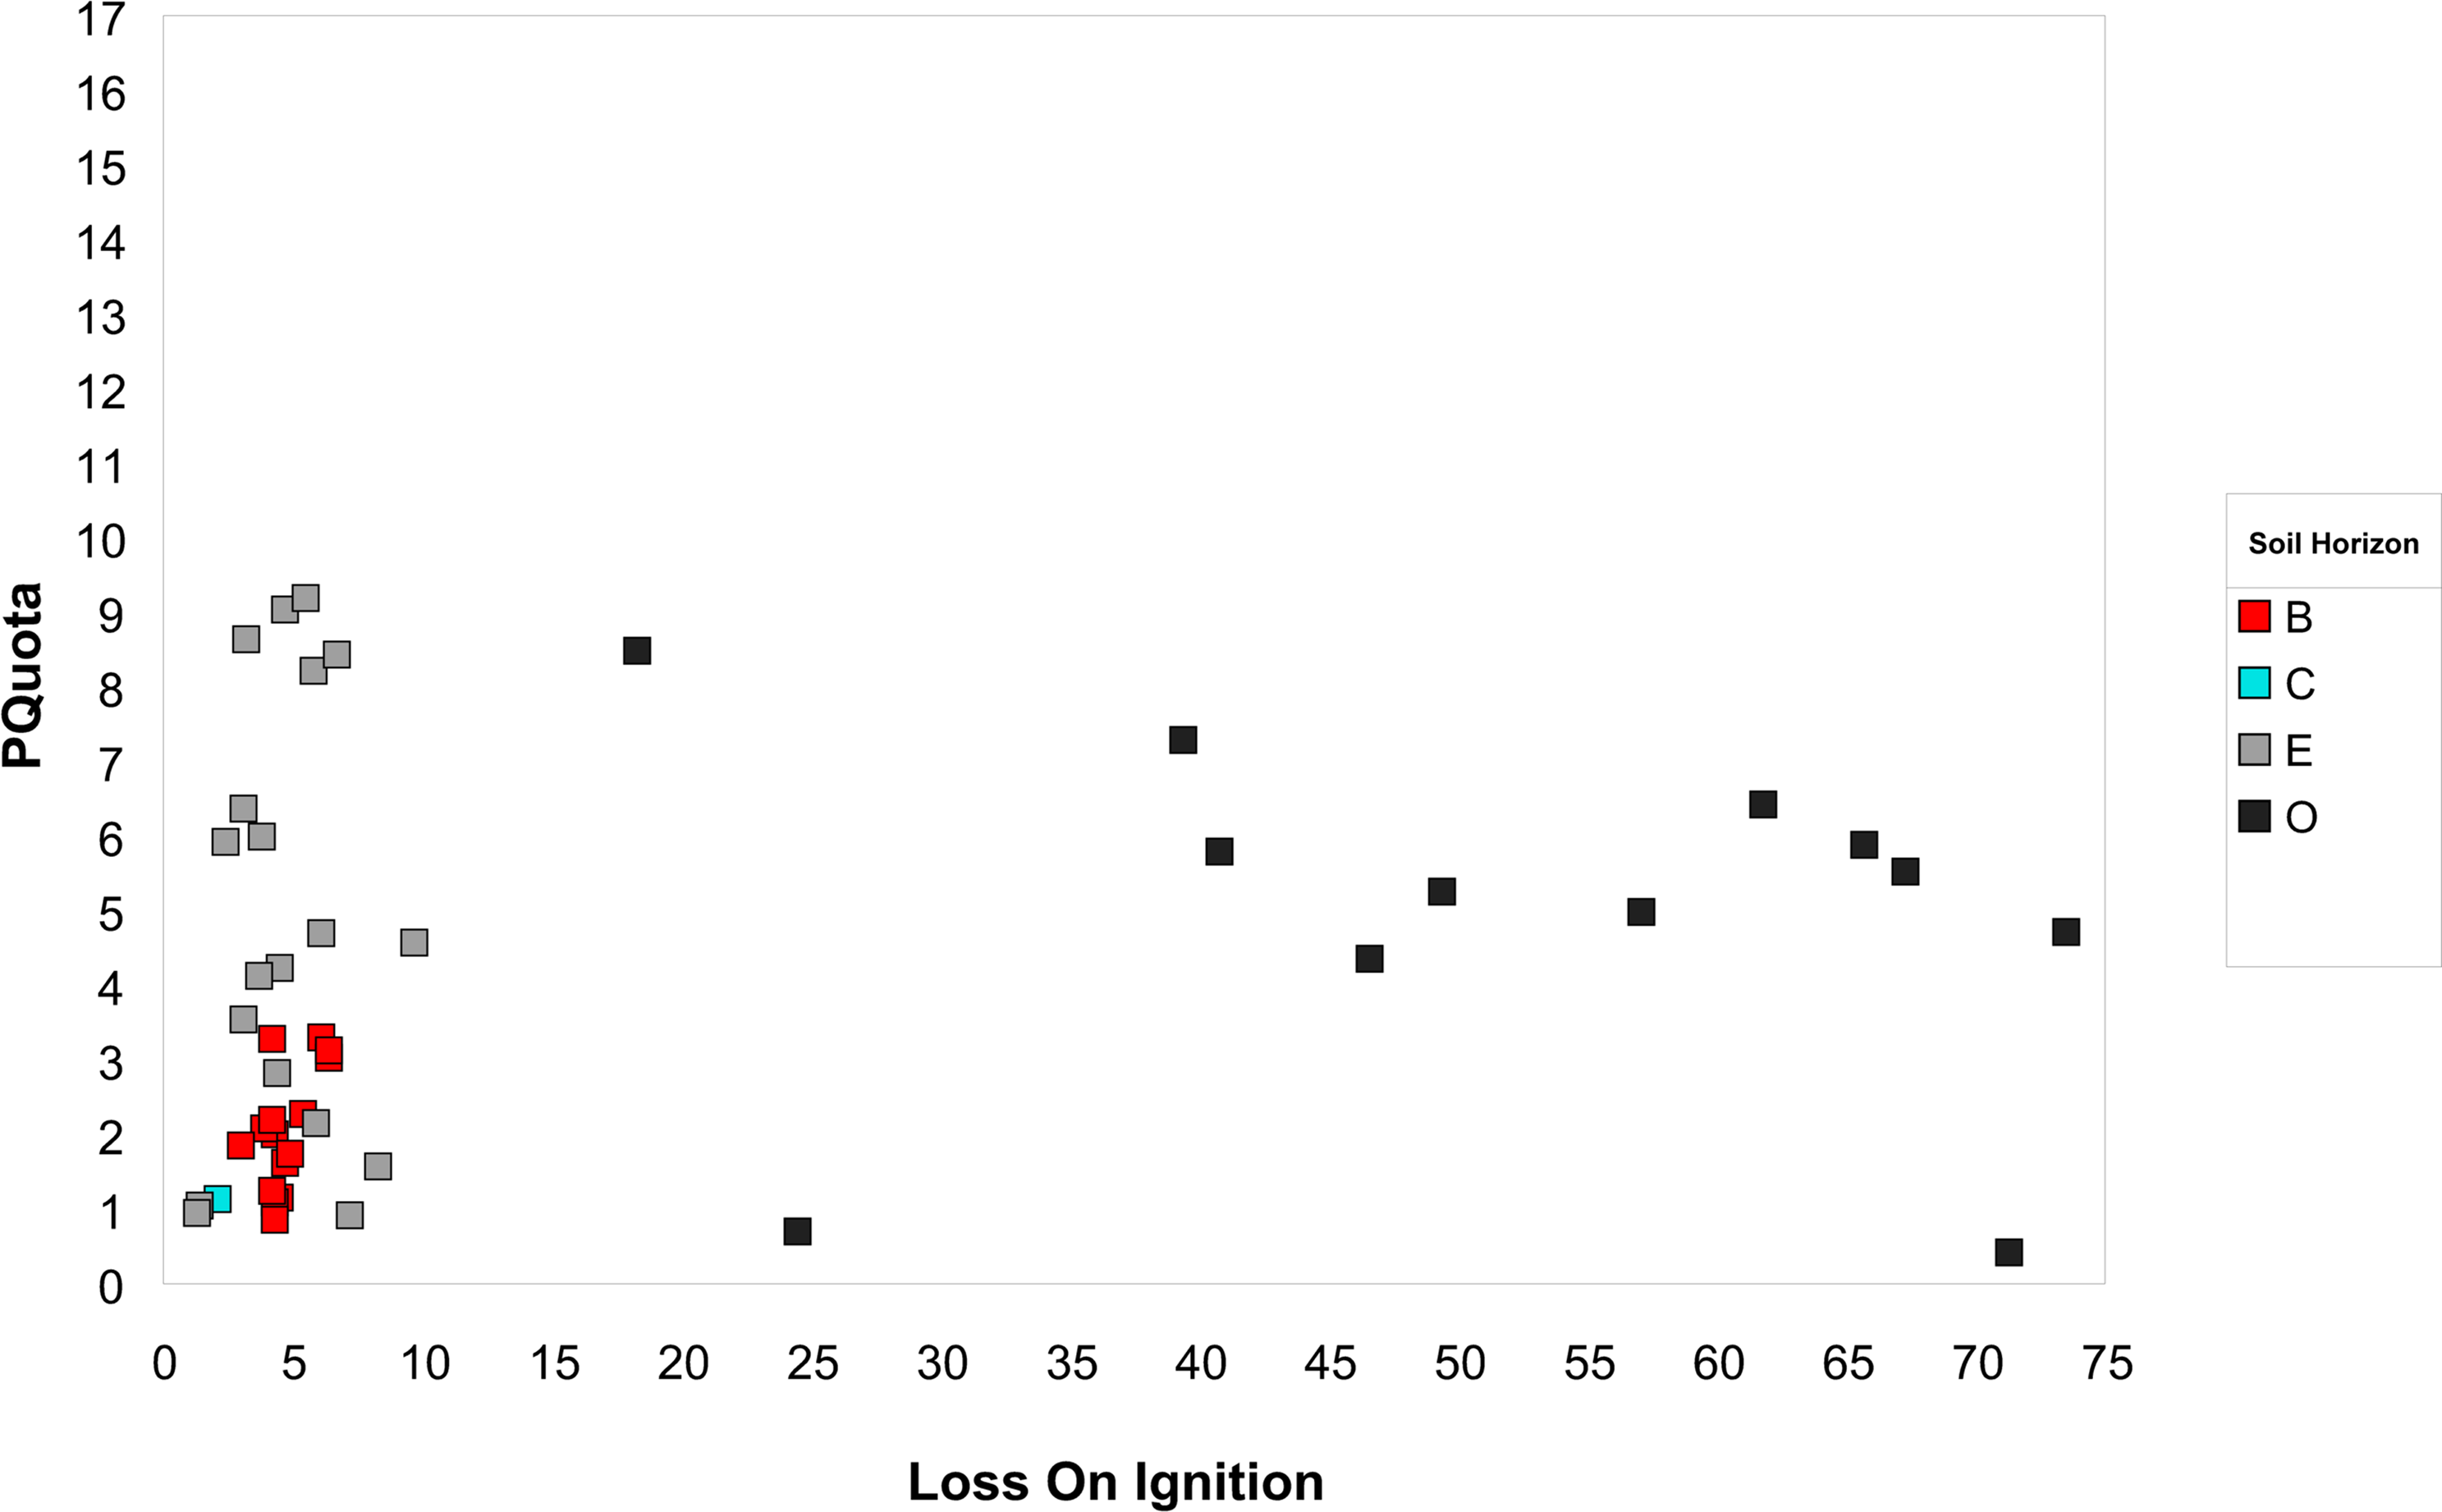
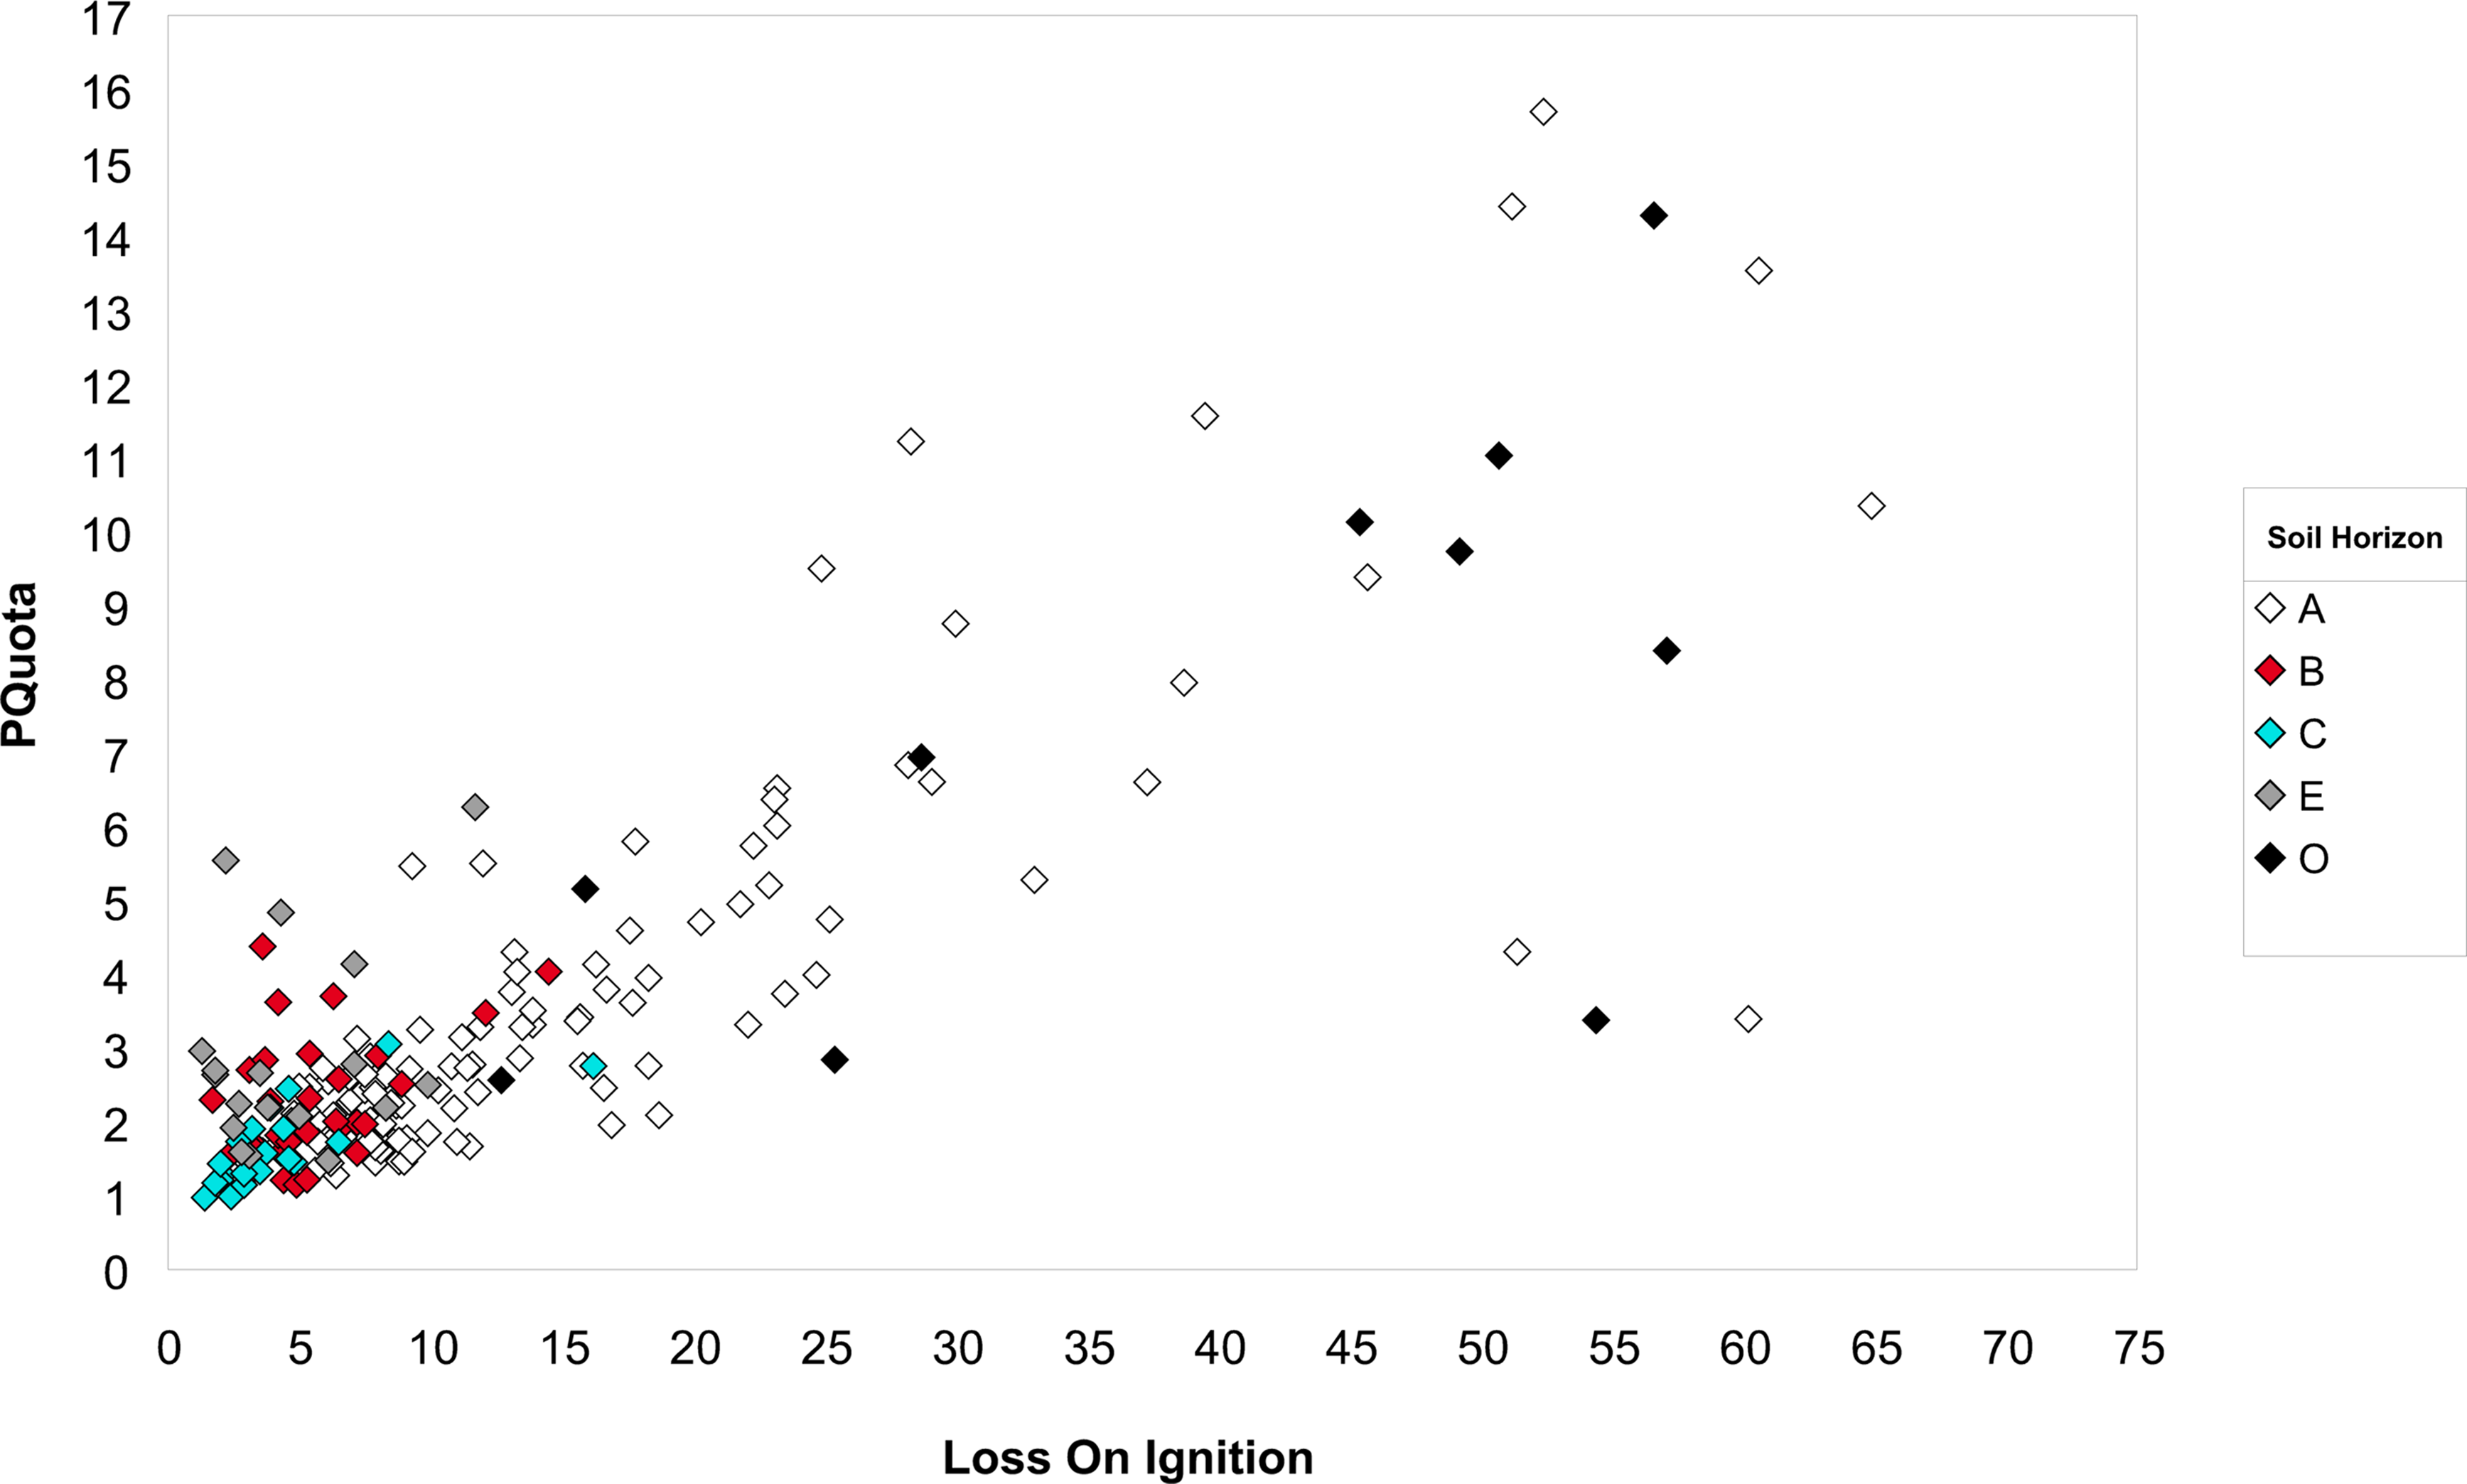
Figures 4 and 5 plot the PQuota (CitPOI/CitP) against soil organic matter (LOI), reflecting the range of organic matter content across sampled horizons. LOI values ranged from 1–75%. Samples with LOI >20% were predominantly associated with O and A horizons (Ah and Ap). Samples from B horizons at Snuvrejohka (Fig. 4) showed LOI and PQuota values comparable to samples from C horizons at Maiva (Fig. 5). PQuota values were generally lower at Snuvrejohka than at Maiva.
The relative presence of organic phosphate (PQuota) to organic matter (LOI) in soil samples from the Snuvrejohka site. Colours indicate the different soil horizons identified at the site. N = 47 (one outlier with 361,5 PQuota was excluded).
The relative presence of organic phosphate (PQuota) to organic matter (LOI) in soil samples from the Maiva site. Colours represent identified soil horizons, where A denotes both Ah and Ap. N = 196.
At Snuvrejohka, a stratified soil profile consistent with podzolization was observed. E horizons contained measurable concentrations of both organic matter and phosphate. No signs of mechanical soil disturbance (e.g. ploughing) were recorded. At Maiva, both Ah and Ap horizons were present, with Ap horizons exhibiting a thickness of approximately 20–25 cm and a distinct boundary with the subsoil. Soil colouration in these horizons was typically dark brown. O horizons at both sites displayed high LOI values.
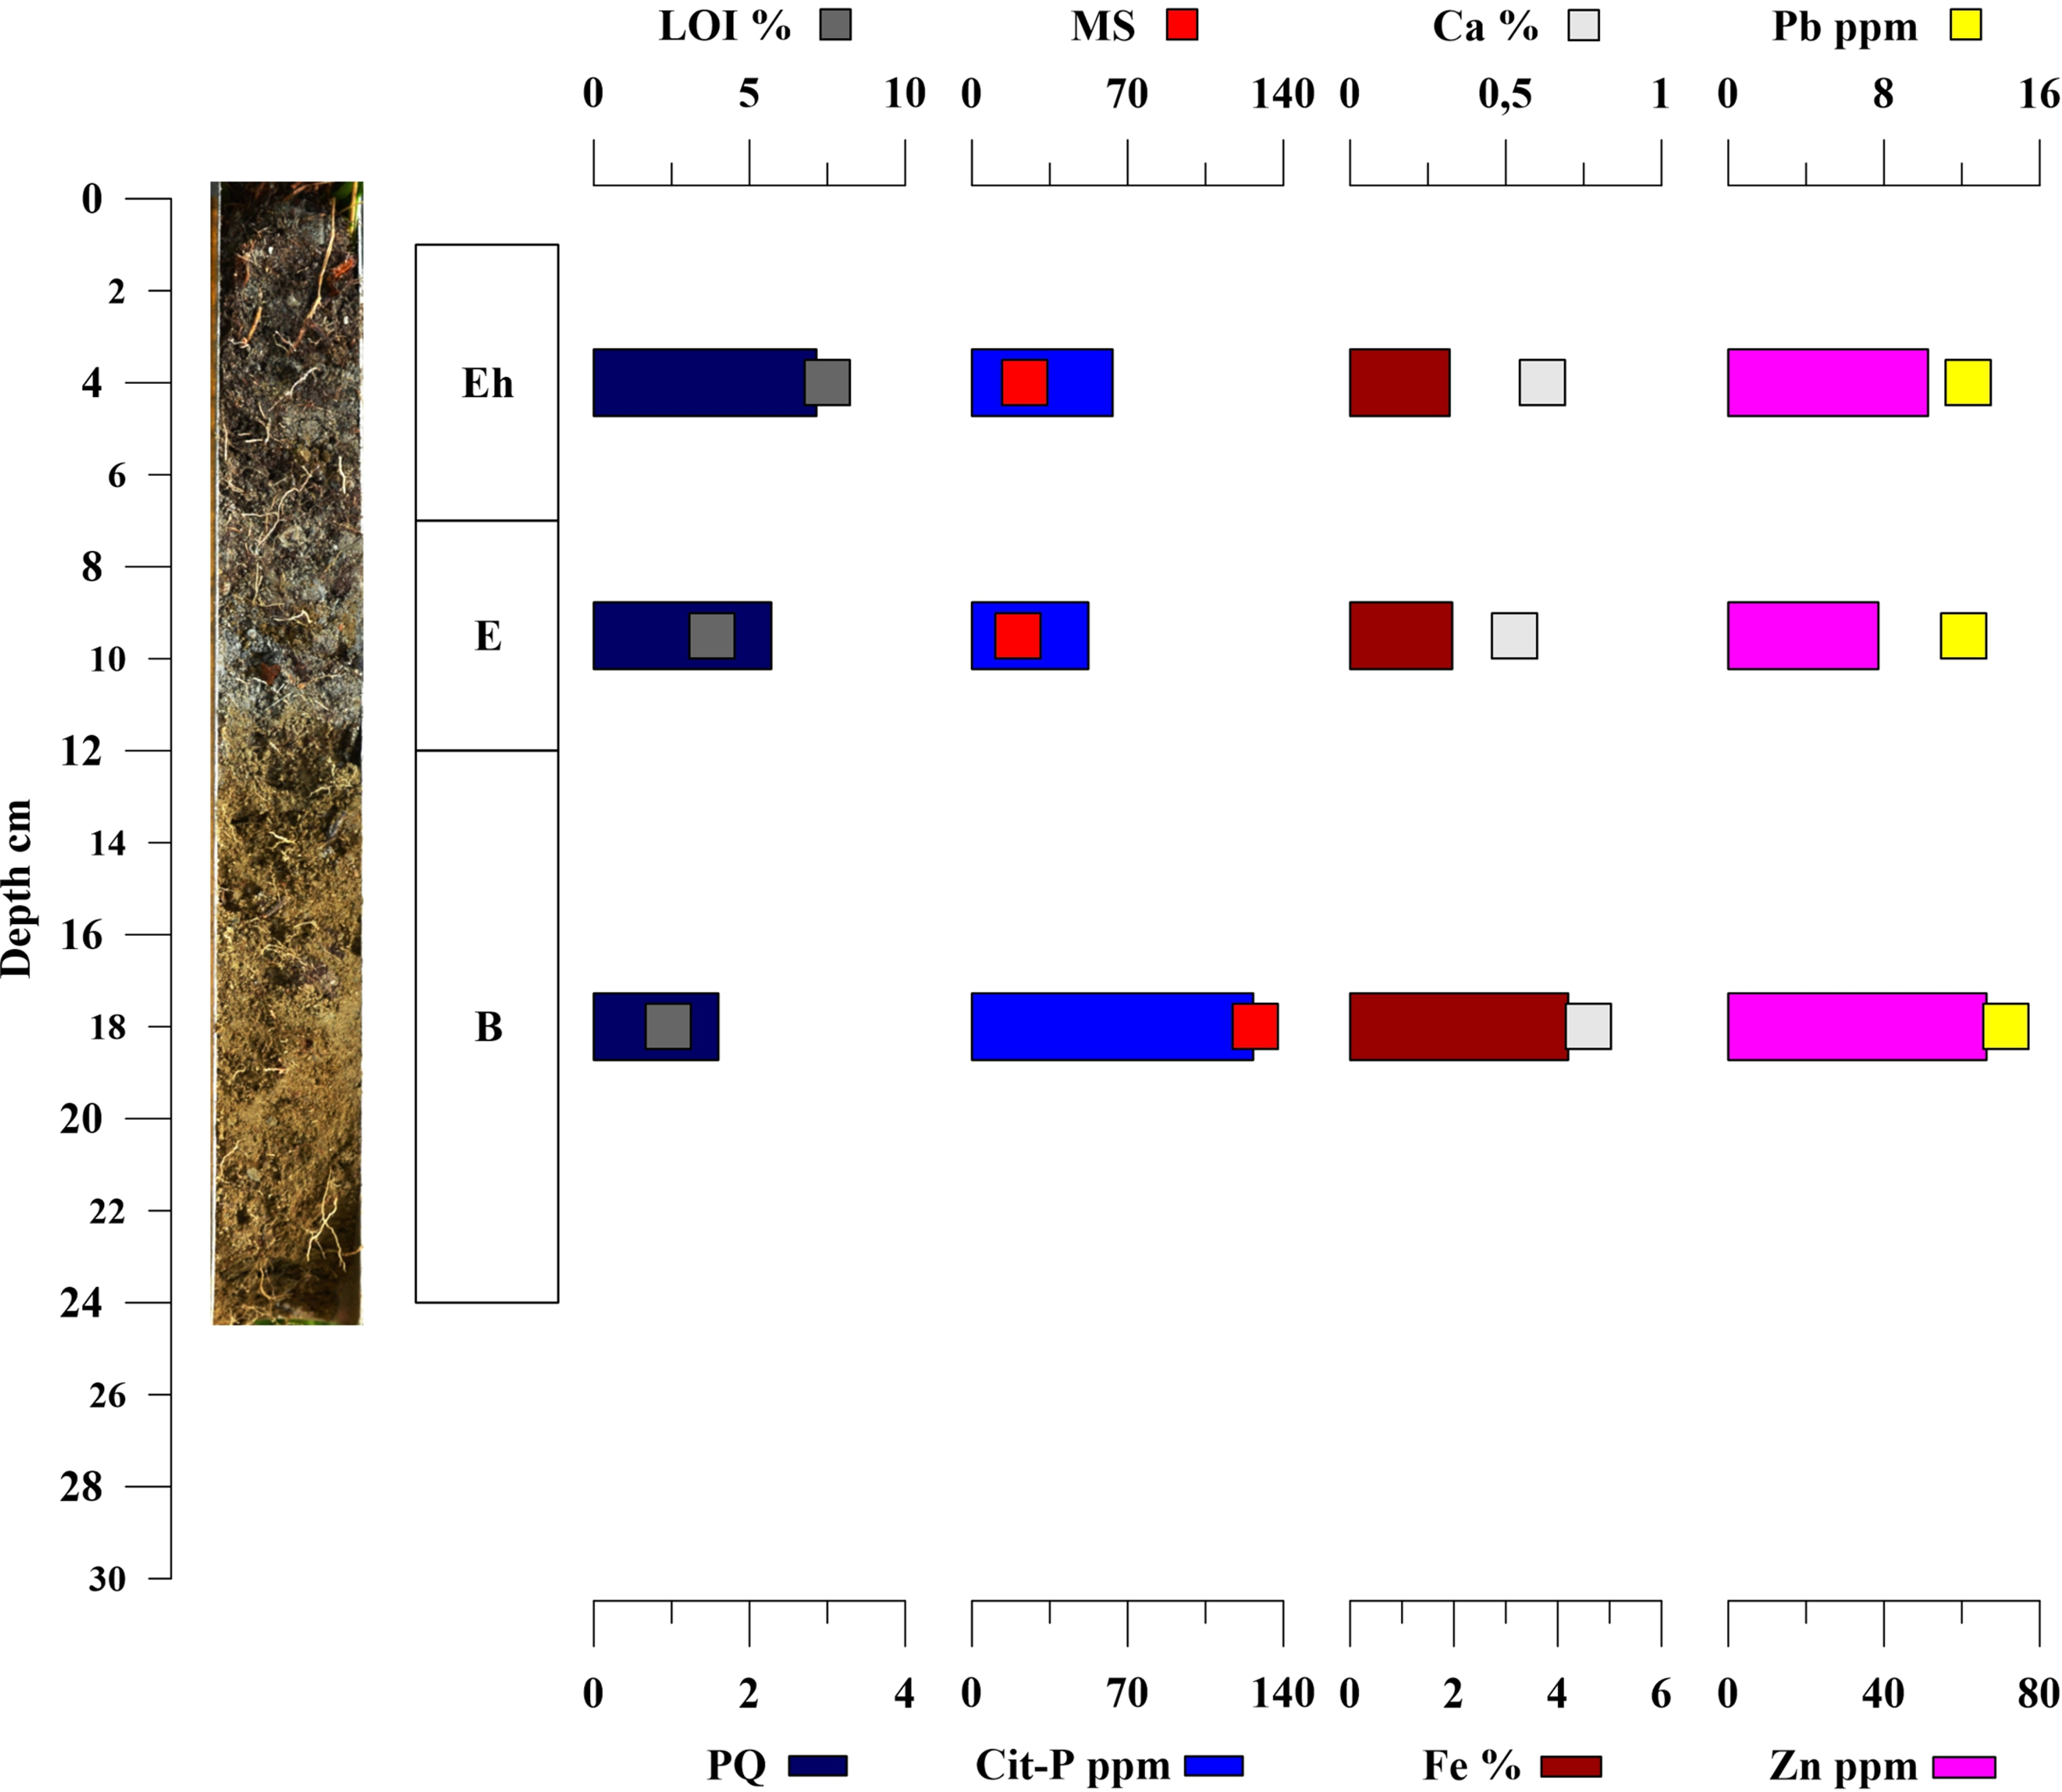
The vertical profiles from Maiva (Figs. 6 and 7) show contrasting horizon development. Profile PZ2 had sharply defined layers typical of podzolic soils, whereas in PZ1, the O horizon was thin, and the E horizon appeared diffuse and more organic in texture.
Podzol soil profile PZ2, sampled at the edge of Lake Torneträsk near house foundation 8 (see Fig. 1), approximately 240 m west of the Maiva cabin.
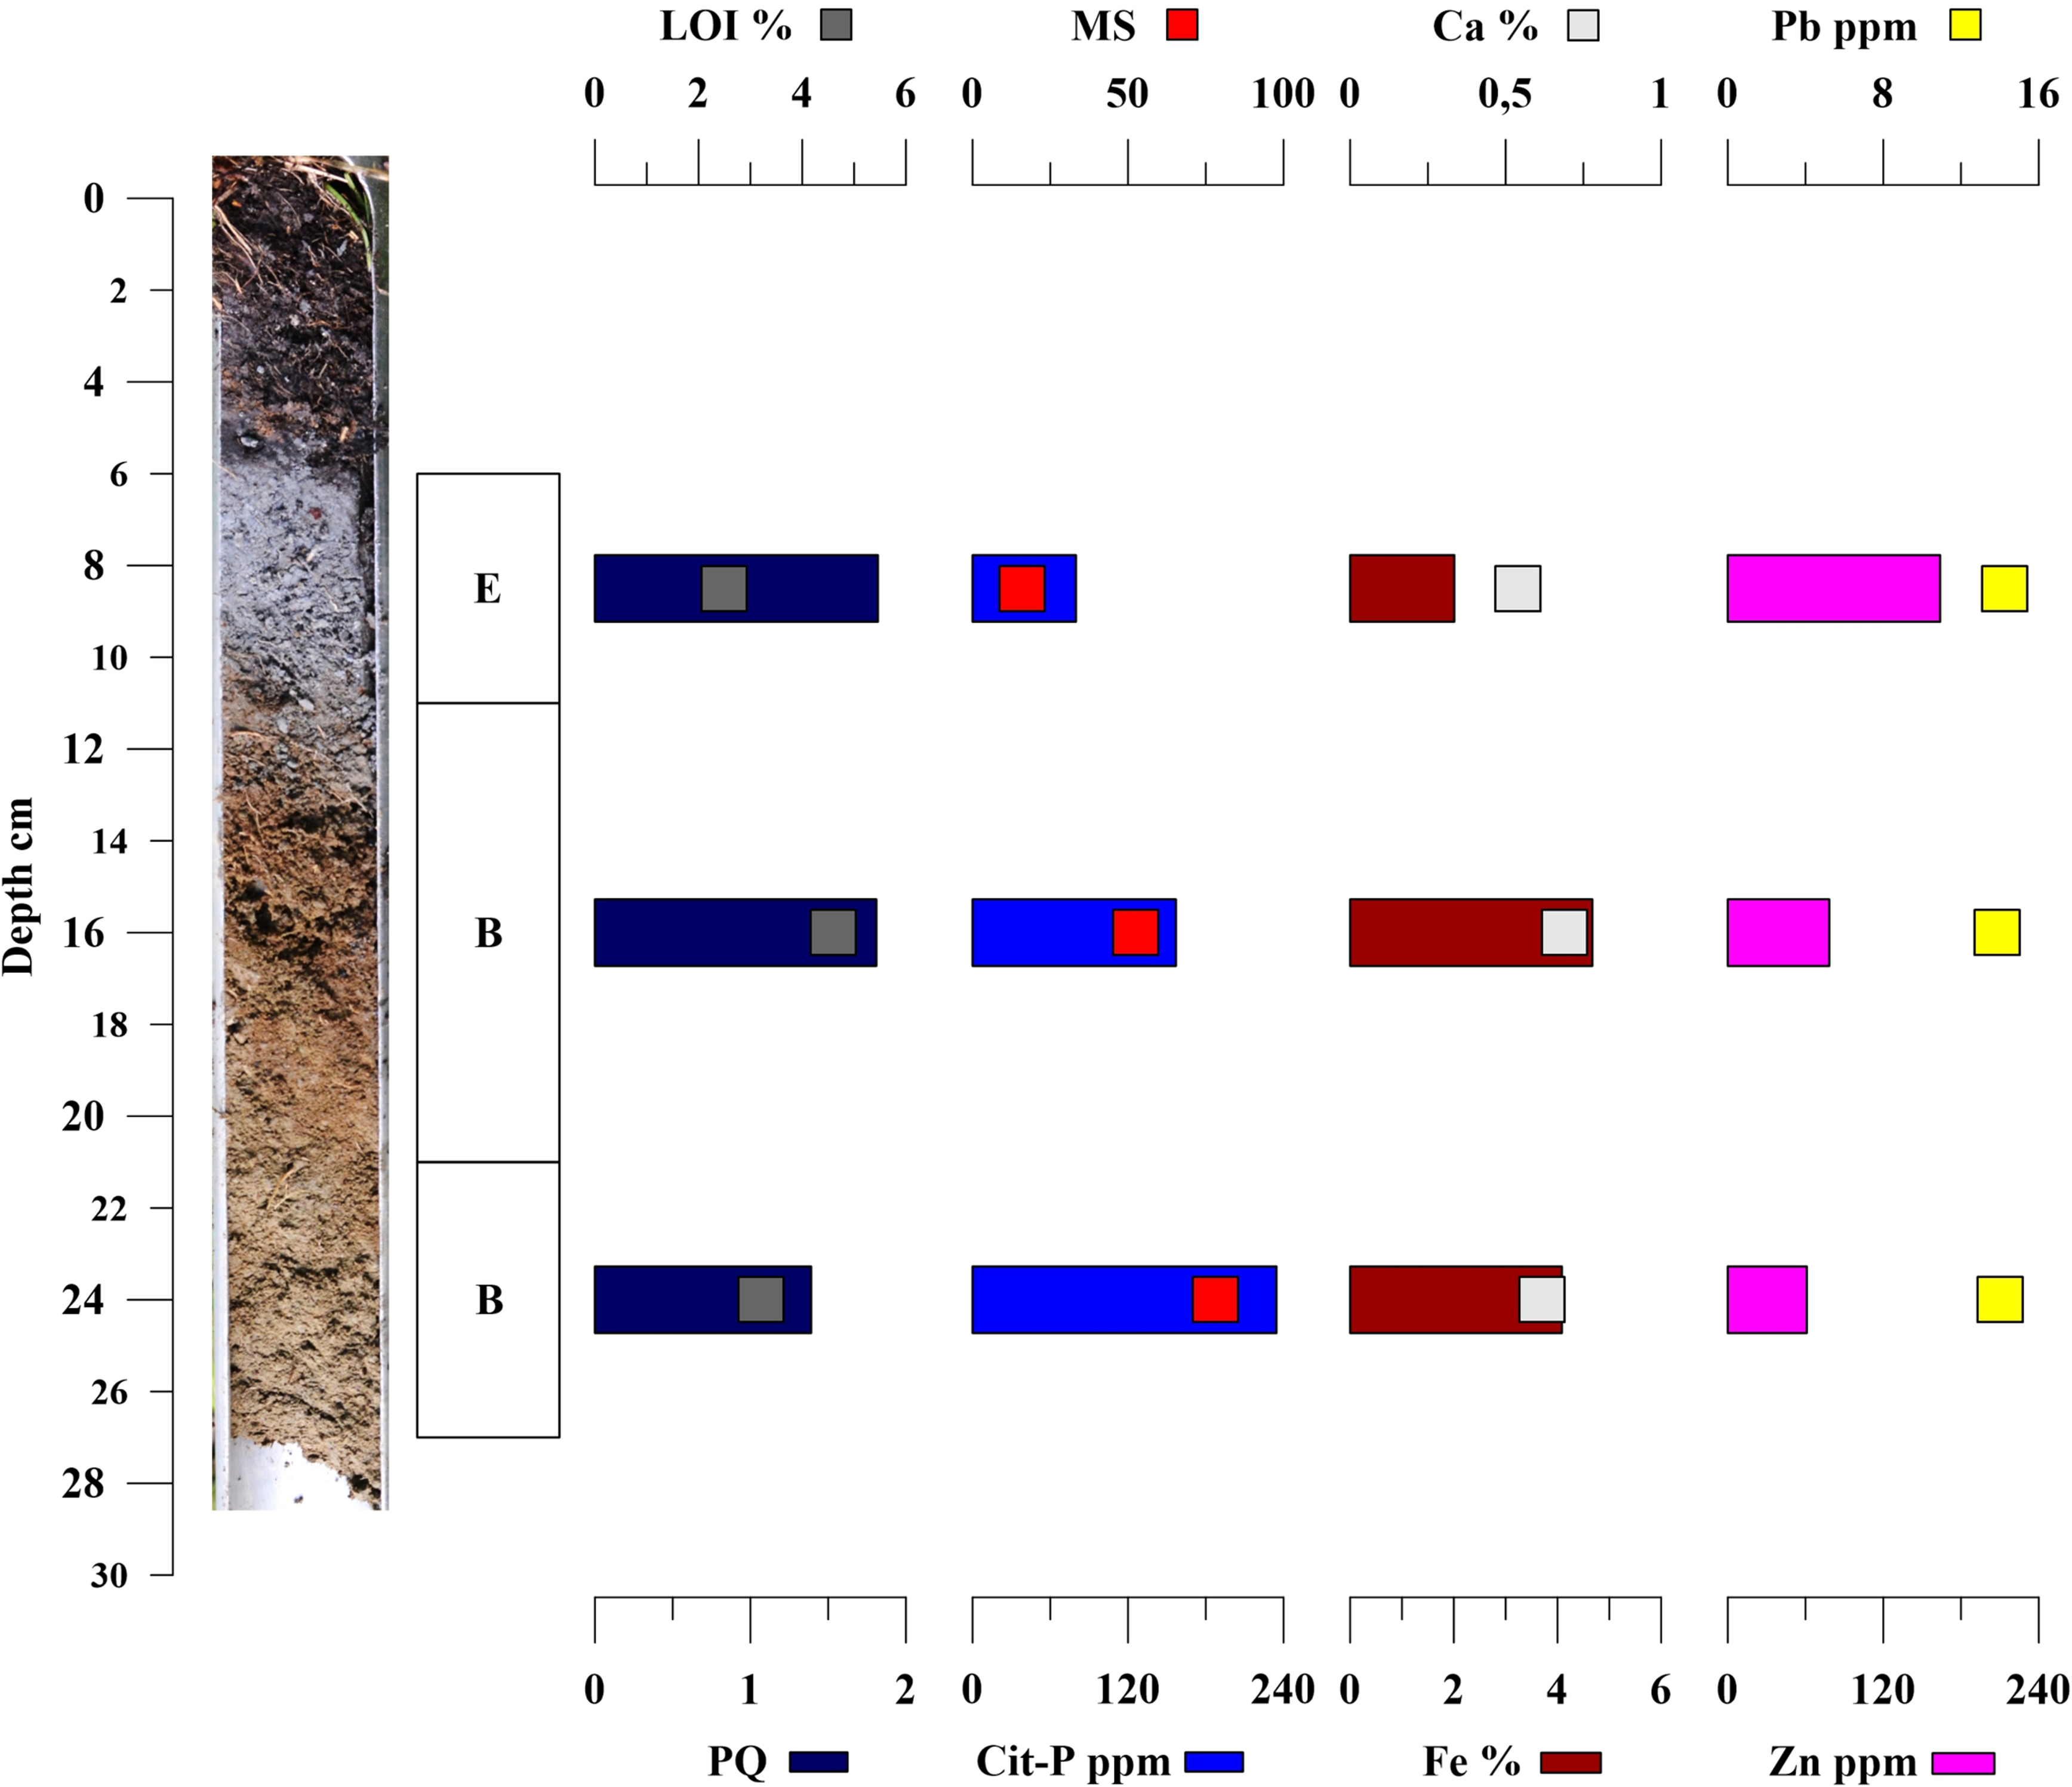
Podzol soil profile PZ1, sampled at the edge of Lake Torneträsk approximately 7 m west of house foundation 7 (see Fig. 1), a structure that functioned as a stable for the tourist station in 1947.
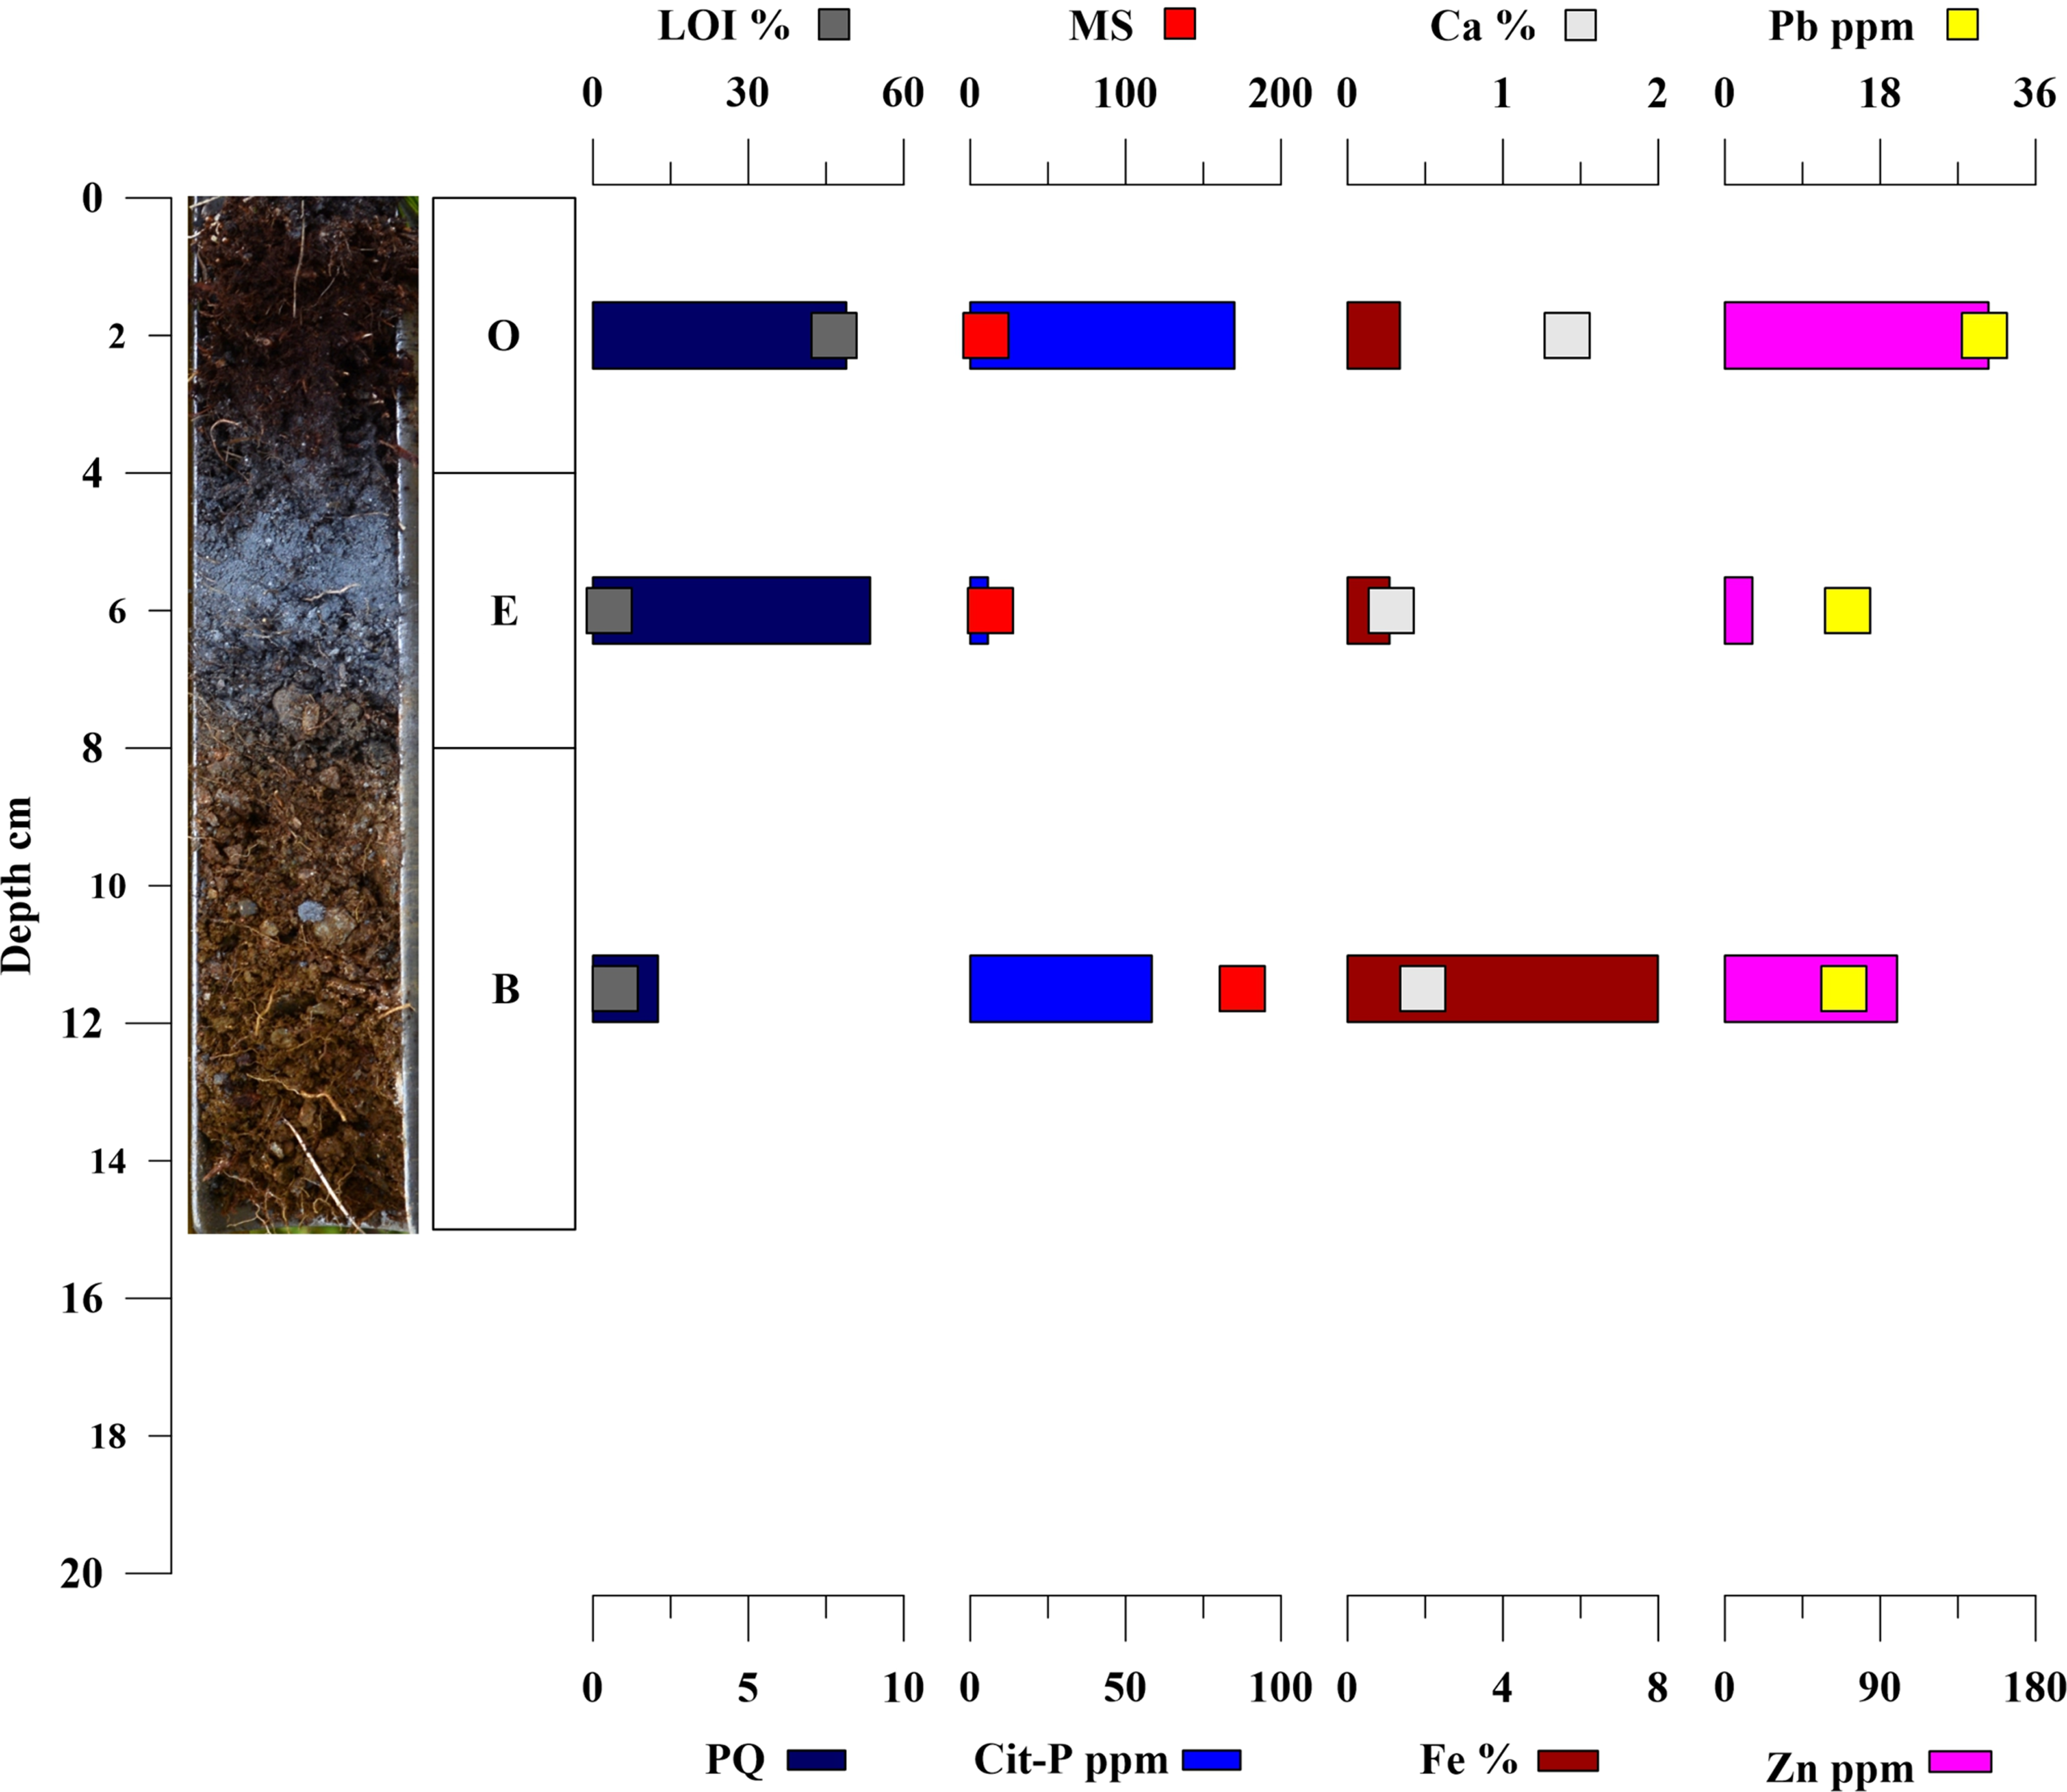
At Snuvrejohka, the profile PZ3 (Fig. 8) showed a thick O horizon with high LOI and PQuota values in both the O and E horizons. MS was low in the upper layers but increased in the B horizon. CitP concentrations were highest in the O horizon. Ca and Pb displayed similar vertical distributions, as did Fe and Zn.
Podzol soil profile PZ3, sampled adjacent to a hearth at the Snuvrejohka Sámi settlement site (see Fig. 1).
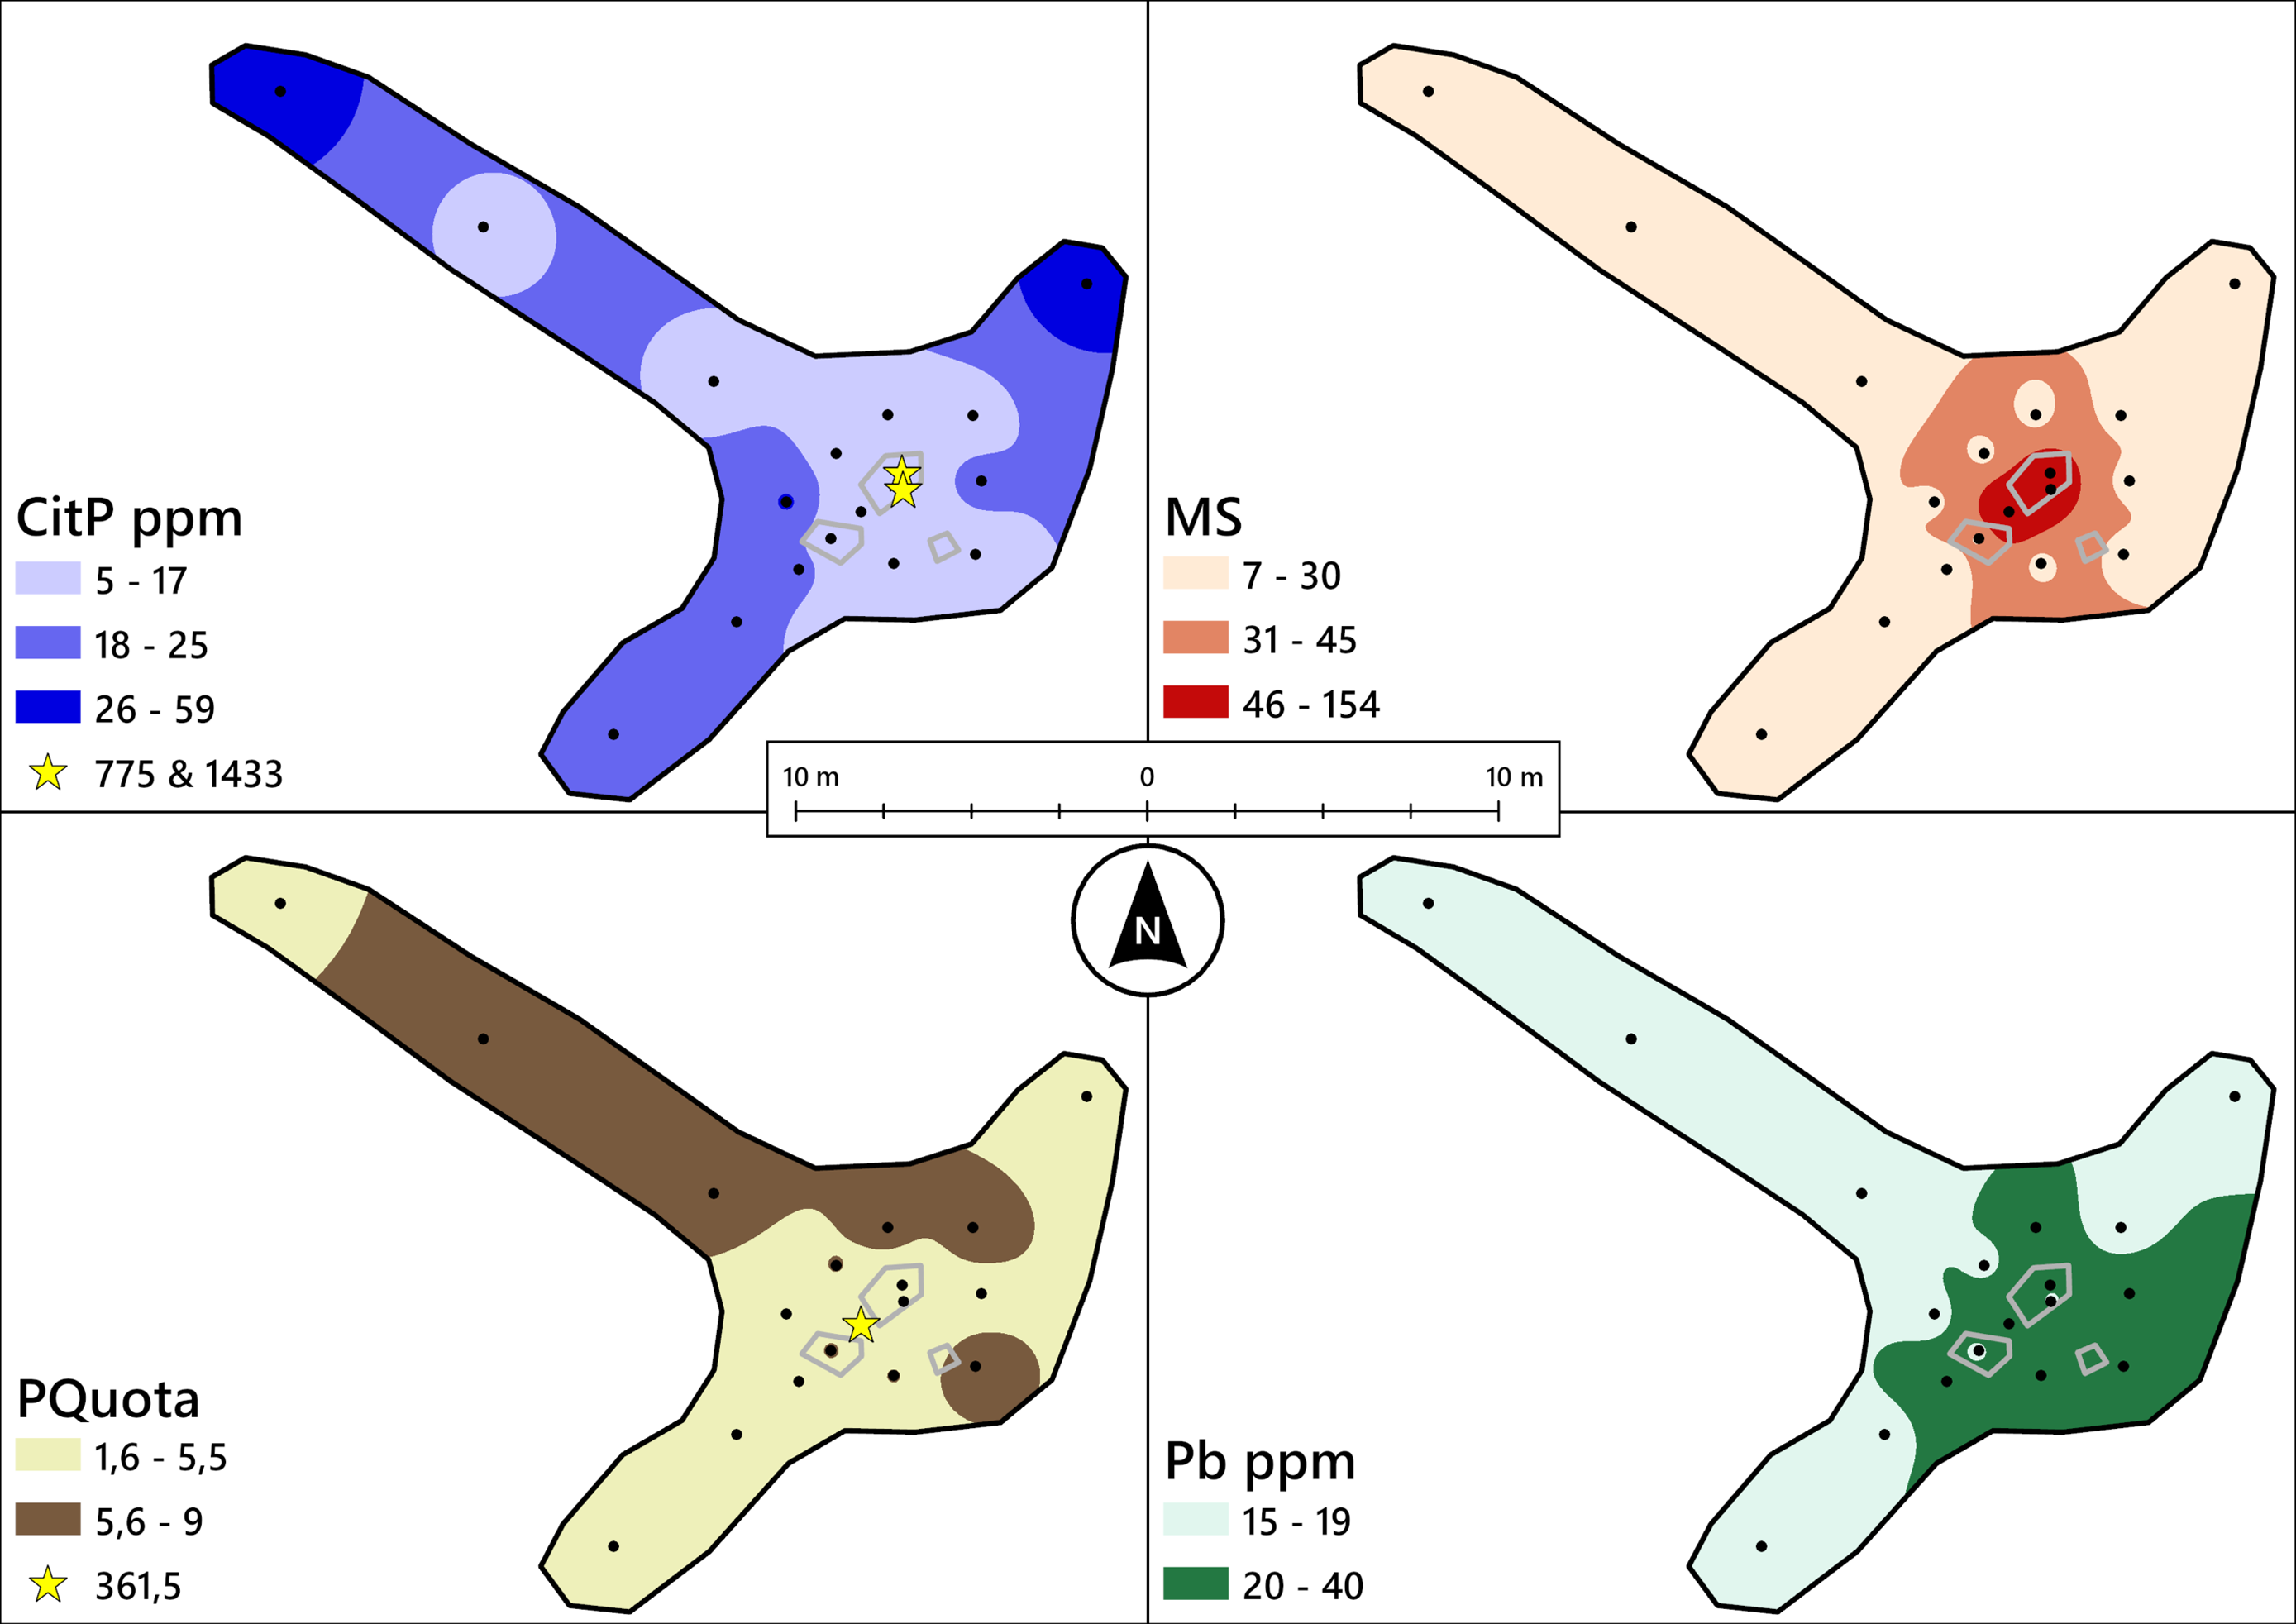
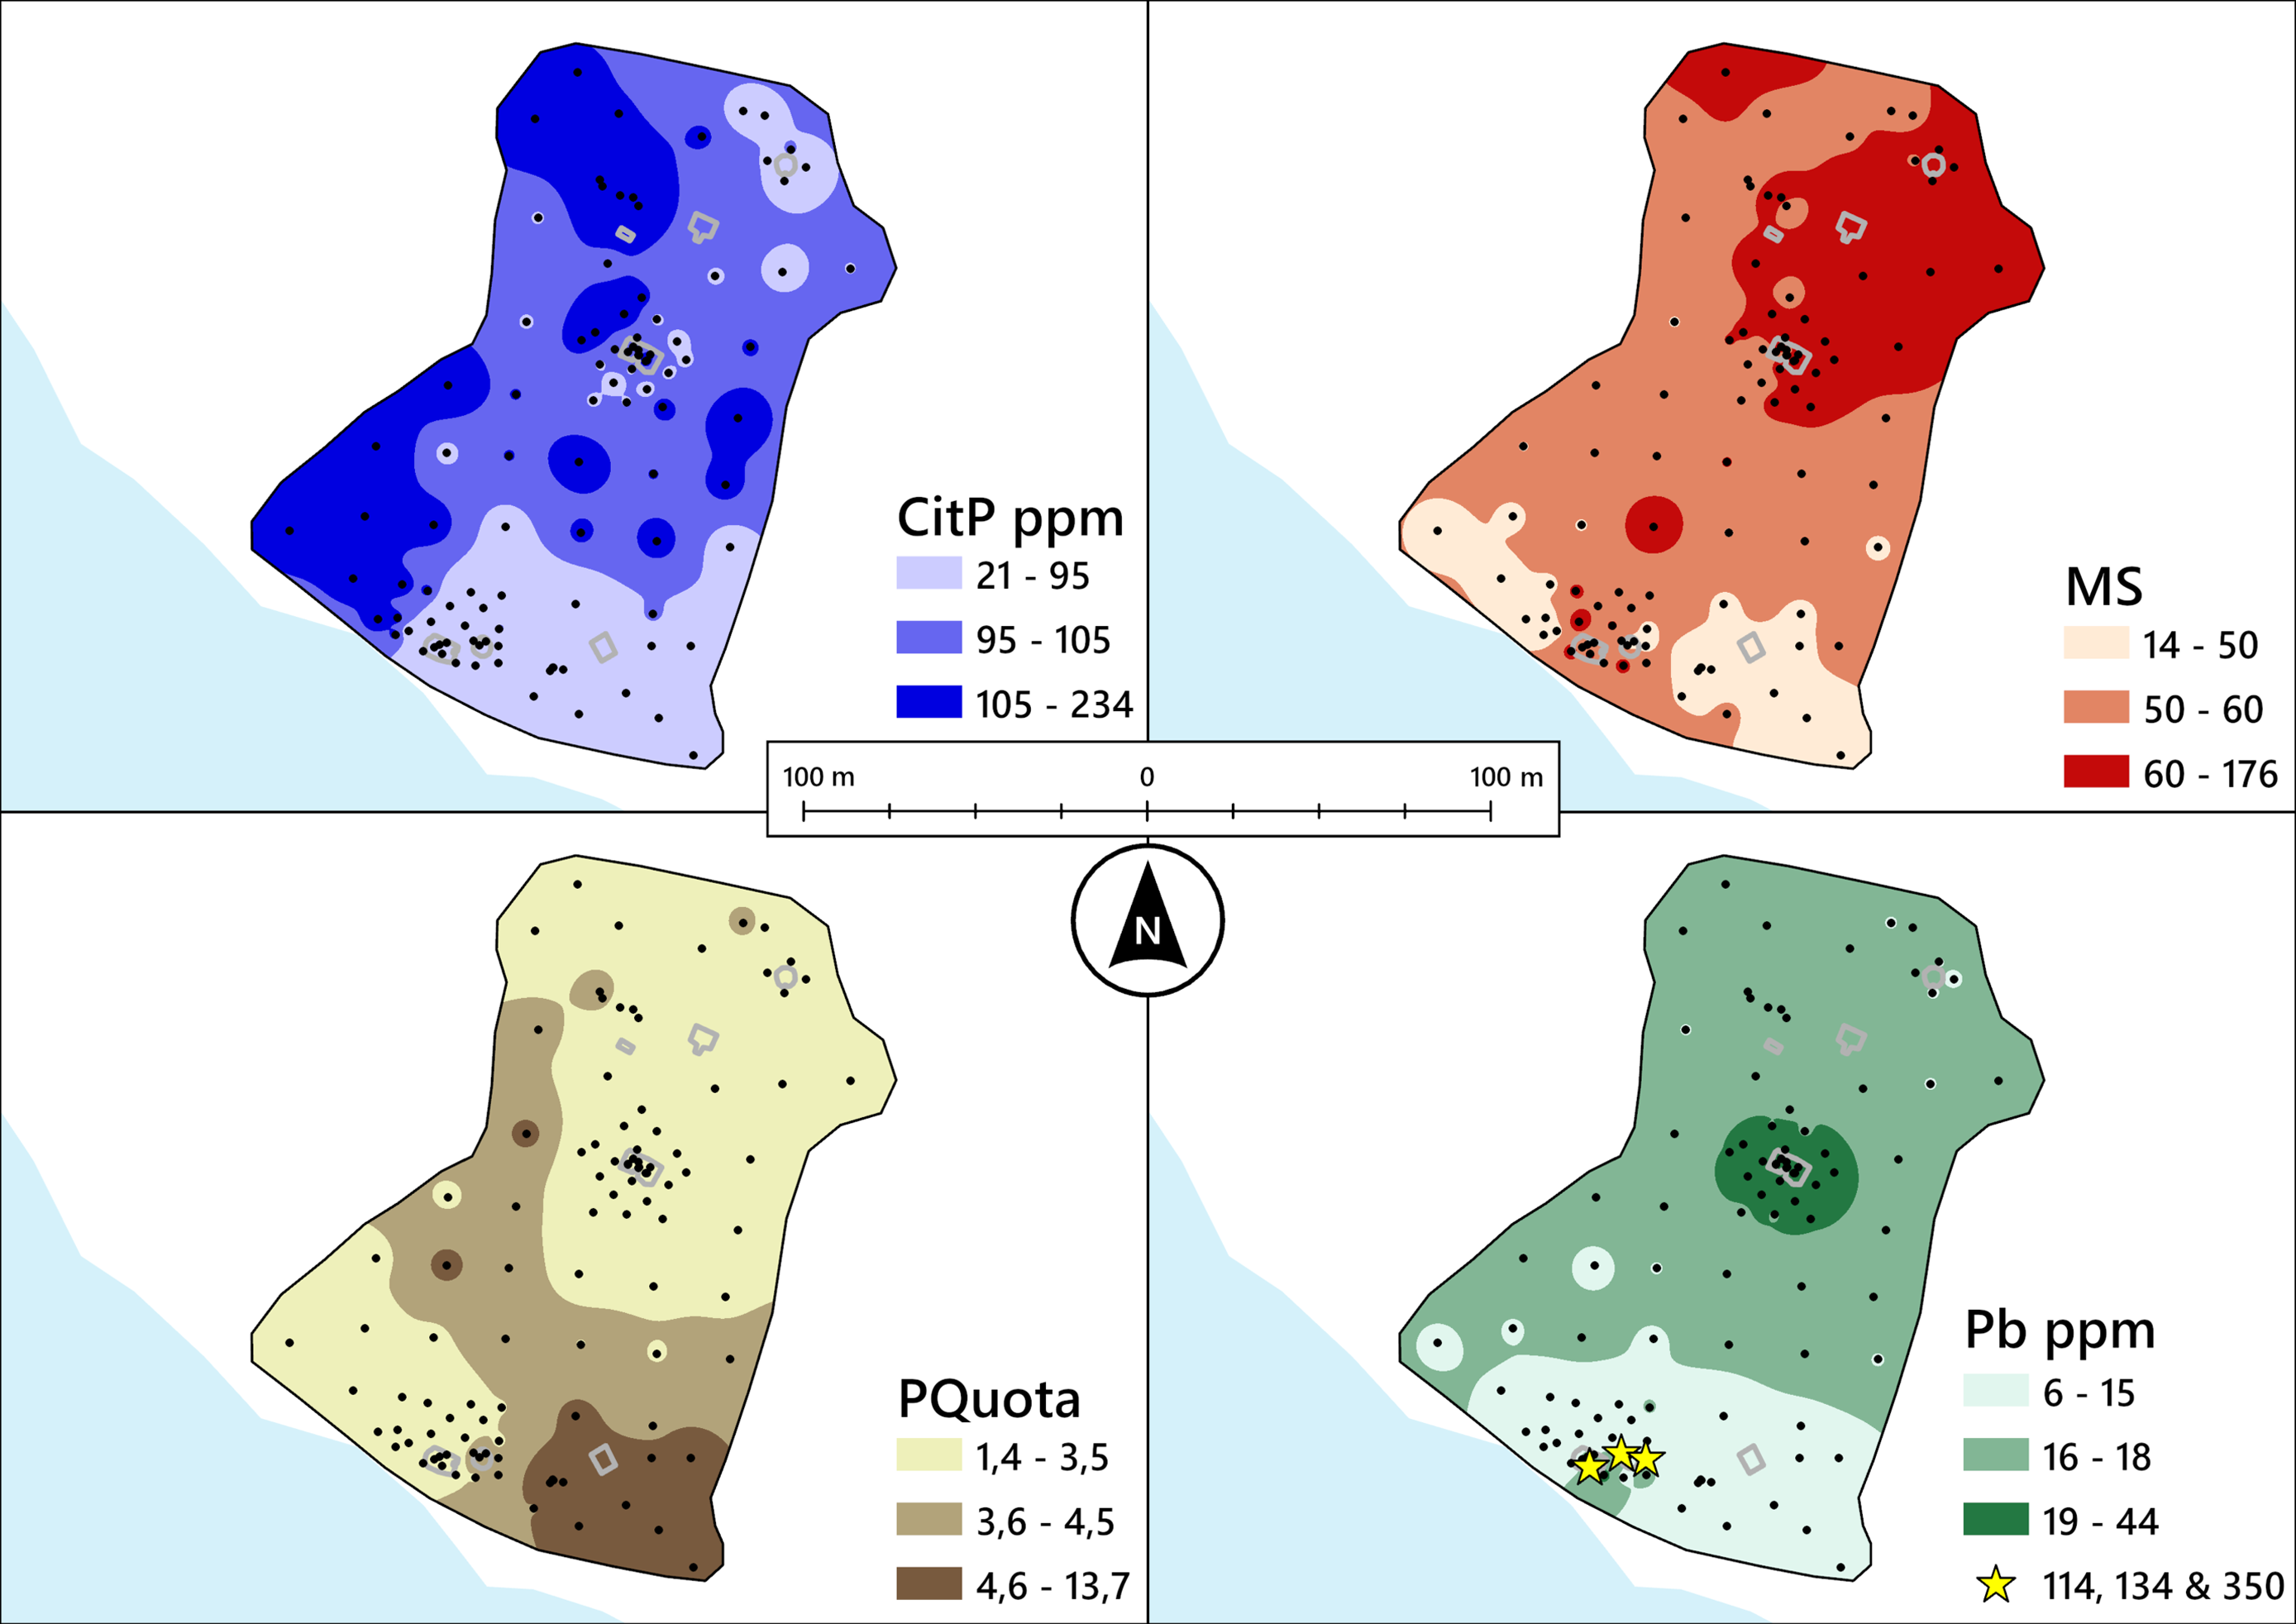
Spatial distributions of selected soil parameters are shown in Figures 9 and 10. At Snuvrejohka (Fig. 9), outliers in CitP and PQuota are situated near hearth features, the trend in these variables is comparably low. MS values and Pb concentrations were high in areas surrounding mapped hearth features. All interpolated values for Snuvrejohka are based on E-horizon samples.
Spatial distribution of soil geochemical properties at the Snuvrejohka site. CitP concentrations (ppm) are interpolated in the upper left panel, MS values are interpolated in the upper right panel, PQuota values are interpolated in the lower left panels, and Pb concentrations (ppm) are interpolated in the lower right panel. Outliers (CitP and PQuota) are marked with yellow stars. The interpolation in panels (MS) and (Pb) is based on 18 points, while panels (CitP) and (PQuota) are based on 17 and 16 points, respectively, due to the exclusion of outliers.
Spatial distribution of soil geochemical properties at the Maiva site. CitP concentrations (ppm) are interpolated in the upper left panel, MS values are interpolated in the upper right panel, PQuota values are interpolated in the lower left panels, and Pb concentrations (ppm) are interpolated in the lower right panel. Outliers (Pb) are marked with yellow stars. Lake Torneträsk is indicated in light blue. The interpolation is based on 103 points, except for panel (Pb), which is based on 100 points due to the exclusion of outliers.
At Maiva (Fig. 10), elevated phosphate concentrations were detected west of the cabin and north of the outbuilding (structures 2 and 3, Fig. 1E) and in the southwest. High PQuota values were found in the southeast. MS values were highest near the southern remains (structures 6 and 7, Fig. 1E), the central house foundation (structure 4, Fig. 1E), and in the northeast. Pb concentrations were elevated around the house foundations (structures 4 and 7, Fig. 1).
Pb concentrations exceeded 20 ppm in samples collected from both sites. At Snuvrejohka, the highest concentrations were observed near the hearths. At Maiva, elevated Pb levels (>20 ppm) were found in samples from the house foundations. Outliers exceeded 100 ppm.
Samples from a distinct cultural layer at Snuvrejohka contained up to 40% Ca and 15,000 ppm Zn. In comparison, average concentrations of these elements in other site samples were 0.6% Ca and 95 ppm Zn.
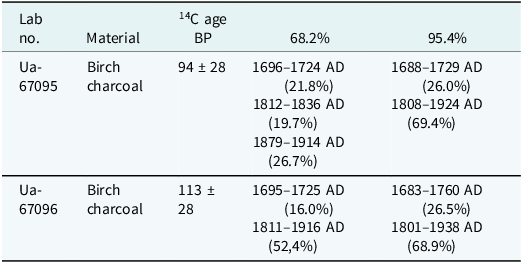
Radiocarbon dating of birch charcoal collected from hearths at Snuvrejohka yielded calibrated age ranges consistent with late 18th to early 20th-century occupation. Detailed results are provided in Table 3.
Radiocarbon dating of the Snuvrejohka site, using calibration curves based on atmospheric data from Reimer et al. (Reference Reimer, Austin, Bard, Bayliss, Blackwell, Bronk Ramsey and Talamo2020)
Discussion
Spatial distributions and human activity
At both Maiva and Snuvrejohka, soil chemistry and physical properties exhibit clear spatial patterns linked to human activity. At Snuvrejohka, elevated CitP (775 and 1433 ppm) and MS values are concentrated around hearths, suggesting repeated fire use and input of phosphate-rich materials such as bone or waste (Jerand et al., Reference Jerand, Linderholm, Hedman and Olsen2016). This is corroborated by the recovery of bone fragments during field and laboratory work (Jerand, Reference Jerand2020), and by ethnographic sources indicating seasonal reindeer herding and habitation (Svonni, Reference Svonni1999). The high phosphate values in the E horizons may result from organic material accumulating and slowly translocating downward.
At Maiva, phosphate concentrations are high near the cabin and other structures, corresponding with documented areas of habitation and stabling (Jerand et al., Reference Jerand, Klaminder and Linderholm2023). The Ap horizons, dark, sharply defined, and 20–25 cm deep, suggest prolonged tillage, possibly involving manuring and drainage of peat soils to the southeast. Elevated LOI and PQuota values in these horizons further support this interpretation. Pb levels above 20 ppm near structures at both sites, with peaks over 100 ppm, align with anthropogenic sources such as lead-based implements, containers, or ammunition.
These patterns demonstrate that chemical signals of human activity can extend beyond visually altered cultural layers, from an archaeological point of view (Viberg, Berntsson, & Lidén, Reference Viberg, Berntsson and Lidén2013; Viberg, Trinks, & Lidén, Reference Viberg, Trinks and Lidén2009). This emphasizes the need for stratigraphic and spatial sampling strategies that relate to soil formation in any given context. However, variations in horizon type and sampling strategy (E horizons at Snuvrejohka versus Ah and Ap at Maiva) may affect the comparability of the absolute values, highlighting the importance of tailoring sampling design to the environmental and historical context of each site.
Vertical soil development and anthropogenic signatures
Differences in soil horizon chemistry and structure at each site reflect contrasting land-use practices and soil formation processes. At Snuvrejohka, podzolization dominates, with O and E horizons displaying organic enrichment and phosphate accumulation. These patterns suggest episodic yet intense use, consistent with short-term seasonal habitation and localized waste disposal. The preservation of these signals in upper horizons emphasizes the importance of stratigraphic context and the risk of under-sampling if only deeper or more visibly altered layers are targeted.
In contrast, Maiva profiles exhibit evidence of earthworm bioturbation and soil mixing. Profile PZ1 lacks a well-defined O horizon, and the E horizon appears diffuse, both indicators of disturbance. Elevated LOI and PQuota in the Ap horizons, along with their sharp morphological boundaries, suggest intensive historical land-use and former peatland cultivation. Earthworms have likely played a substantial role in homogenizing the profile, producing characteristics associated with cambisols. This transformation has implications for both the visibility and long-term preservation of anthropogenic traces.
These findings align with theoretical models of soil formation, such as those proposed by Jenny (Reference Jenny1941), which include climate, organisms, relief, parent material, and time, and by Dudal (Reference Dudal2005), who added human influence as a sixth soil-forming factor. Swedish studies (e.g. Stålfelt, Reference Stålfelt1965; Troedsson, & Nykvist, Reference Troedsson and Nykvist1980; Troedsson, Reference Troedsson1997; Wiklander, Reference Wiklander1976) further demonstrate the significance of anthropogenic processes in Arctic and boreal soil systems.
Human-induced soil development (e.g. tillage and waste disposal) in the Arctic, even over short time spans, can substantially alter soil chemistry and morphology, a process that is locally accelerated by earthworms (Lavelle et al., Reference Lavelle, Decaëns, Aubert, Marot, Blouin, Bureau and Rossi2006; Blume-Werry et al., Reference Blume-Werry, Krab, Olofsson, Sundqvist, Väisänen and Klaminder2020). This has implications for the visibility and preservation of past land-use remains over time.
Sampling strategies and interpretive frameworks
The results of this study reinforce the need to adapt sampling strategies to local soil development processes and historical land-use. At Snuvrejohka, anthropogenic signatures were well preserved in E horizons, while at Maiva, a combination of horizons was necessary to capture the effects of more intensive and long-term activity. Misidentifying or omitting relevant horizons can lead to underestimation of impact, particularly where cultural layers are vague or modified by post-depositional processes (Goldberg et al., Reference Goldberg, Macphail, Carey and Zhuang2022). For example, reliance solely on B horizons could miss more recent anthropogenic signals (Jerand et al., Reference Jerand, Linderholm, Hedman and Olsen2016).
Although this study does not introduce new sampling methodologies, it demonstrates the importance of informed and flexible sampling strategies. Geoarchaeological investigations must be guided by local stratigraphy and environmental history to accurately interpret human–environment interactions. Features such as hearths can serve as valuable chronological anchors when paired with radiocarbon dating and contextual historical or ethnographic records (Seitsonen, & Égüez, Reference Seitsonen and Égüez2021).
Broader significance
While focused on two case studies, the approach used here can be broadly applied across Arctic and sub-Arctic contexts. Historically documented sites like Maiva and Snuvrejohka offer valuable analogues for interpreting prehistoric land-use. Previous research supports this comparative approach (Bonnichsen, Reference Bonnichsen1973; Deetz, Reference Deetz1996; Reynolds, Reference Reynolds, Stone and Planel1999; Macphail, Cruise, Allen, Linderholm, & Reynolds, Reference Macphail, Cruise, Allen, Linderholm and Reynolds2004), and our results contribute additional evidence that soil chemical signals reflect the intensity and nature of historical human activities.
Geochemical enrichment, spatially correlated with known activity zones, further illustrates the utility of multi-element analysis for reconstructing past land-use. Comparable findings from the UK (Wilson, Davidson, & Cresser, Reference Wilson, Davidson and Cresser2008, Reference Wilson, Davidson and Cresser2009) and Arctic North America (Knudson, Frink, Hoffman, & Price, Reference Knudson, Frink, Hoffman and Price2004; Butler, & Dawson, Reference Butler and Dawson2018) confirm that chemical footprints of human activity persist across diverse environments and cultural practices. However, in analogous studies from Scotland, Pb, among other elements, was interpreted as not being enriched by human activity (Entwistle, Abrahams, & Dodgshon, Reference Entwistle, Abrahams and Dodgshon1998, Reference Entwistle, Abrahams and Dodgshon2000).
Understanding how soil development and human impact interact is increasingly urgent in light of environmental change, threatening archaeological preservation. Bioturbation, chemical redistribution, and erosion are ongoing processes (Wackett et al., Reference Wackett, Yoo, Olofsson and Klaminder2018), and as climate change accelerates soil organic matter turnover (Jansen et al., Reference Jansen, Christensen, Dokken, Nisancioglu, Vinther, Capron and Stendel2020; Soldatova, Krasilnikov, & Kuzyakov, Reference Soldatova, Krasilnikov and Kuzyakov2024) these cultural remains and anthropogenic signals may become harder to detect or preserve (Blankholm, Reference Blankholm2009; Hollesen et al., Reference Hollesen, Callanan, Dawson, Fenger-Nielsen, Friesen, Jensen and Rockman2018), making careful documentation and context-adaptive sampling strategies even more critical for future research and heritage management.
Conclusions
This study demonstrates that soil geochemical analysis is a powerful tool for identifying and interpreting human occupation in Arctic environments shaped by different land-use practices. At Maiva, the chemical signatures indicate prolonged agricultural activity and significant post-depositional soil transformation, largely influenced by earthworm bioturbation. In contrast, Snuvrejohka presents a more stratified soil profile with localized geochemical enrichment, reflecting short-term, seasonal reindeer herding. The horizons most affected by human activity differed between the sites, E horizons at Snuvrejohka and a combination of Ah and Ap horizons at Maiva, highlighting the importance of adapting sampling strategies to local soil development processes and the nature of past land-use.
Climate change poses an escalating threat to the preservation of archaeological soil records in Arctic and alpine environments. Rising temperatures and increased precipitation are accelerating biological turnover, bioturbation, and chemical weathering, leading to intensified soil formation and the potential degradation of podzolic profiles, regardless of whether changes are driven by earthworms or other factors (Blankholm, Reference Blankholm2009; Hollesen et al., Reference Hollesen, Callanan, Dawson, Fenger-Nielsen, Friesen, Jensen and Rockman2018; Jansen et al., Reference Jansen, Christensen, Dokken, Nisancioglu, Vinther, Capron and Stendel2020). These processes increase the risk of erosion, disturbance, and eventual loss of both prehistoric and historic cultural remains (Hollesen, Reference Hollesen2022). In this context, advancing geoarchaeological knowledge is essential. Accurate, context-adaptive sampling strategies, grounded in both soil science and historical understanding, are critical for documenting, interpreting, and protecting these vulnerable records before they are altered or destroyed by ongoing environmental change.
Competing interests
The authors declare none.


 Open access