


1. Introduction and background
Additive Manufacturing (AM) allows the fabrication of complex geometries and customized components that are difficult or impossible to obtain with traditional subtractive manufacturing techniques. As AM is shifting from prototyping to end-use production, its industrial adoption still depends on process reliability. In order to exploit AM as a production tool, it must consistently reproduce items with predictable geometric and mechanical performances (Reference Venturi and TaylorVenturi & Taylor, 2023). Fluctuations in printing results can compromise dimensional accuracy, assembly compatibility, and functional response, which jeopardize the predictability required for the industrial use of AM. Understanding and managing this intrinsic variability is therefore essential to enable the use of AM for certified and safety-critical applications (Reference Dowling, Kennedy, O’Shaughnessy and TrimbleDowling et al., 2020).
Extensive research has examined the influence of process parameters on part quality, e.g., (Reference Cappellini, Borgianni, Maccioni and NezziCappellini et al., 2022; Reference Petruse, Simion and BondreaPetruse et al., 2024; Reference Solouki, Aliha, Makui, Choupani and SeitiSolouki et al., 2024). Most of these works focus on quantifying how process parameters, such as layer thickness, printing speed, material type, and nozzle temperature, affect dimensional and geometric deviations, how these effects are related, and which parameter combinations minimise errors. The maturity of this domain is witnessed by the existence of several reviews (Reference Cojocaru, Frunzaverde, Miclosina and MargineanCojocaru et al., 2022; Reference Equbal, Murmu, Kumar and EqubalEqubal et al., 2024; Reference Kristiawan, Imaduddin, Ariawan and ArifinKristiawan et al., 2021). These works overall evidence the role of process parameters, consistently reporting that relatively small variations can induce measurable changes in accuracy across AM technologies.
While abundant research has elucidated how parameters affect accuracy, fewer studies have focused on how stable those results remain when using the same parameters. As abovementioned, this issue is a possible barrier for the large-scale adoption of AM in the industry, and it requires major attention.
1.1. Issues of variability and reliability in additive manufacturing
Reliability in AM depends on process repeatability, or the ability to reproduce consistent results under the same nominal conditions. Reference Venturi and TaylorVenturi and Taylor (2023) reviewed the concepts of repeatability and reliability across AM technologies, identifying the absence of standardized methodologies to quantify variability as a major obstacle to industrial adoption. They classified sources of variation into pre-process, in-process, and post-process stages, noting that fluctuations in feedstock properties, energy input, or environmental conditions can significantly affect both dimensional and mechanical performance.
Similar conclusions were reached by Reference Dowling, Kennedy, O’Shaughnessy and TrimbleDowling et al. (2020), who examined critical repeatability and reproducibility issues in powder-bed fusion. Their review highlighted the influence of powder characteristics, laser calibration, and post-processing on part-to-part consistency. Reference Udroiu and BragaUdroiu and Braga (2020) also discussed AM process capability in terms of dimensional accuracy and repeatability, proposing statistical metrics such as process capability indices to assess manufacturing stability.
From an industrial perspective, Reference Chen, Han, Gao, Kandukuri and ZhouChen et al. (2022) reviewed qualification and certification frameworks for metal AM, emphasizing that insufficient data on process consistency still hinder standardization and product validation.
Together, these studies emphasize that variability is intrinsic to AM processes, but more knowledge is required to quantify the extent of such variability. Evidently, variability can depend on the specific AM technology, which stresses the need to extend the literature on “variability in AM”, briefly reviewed in the following subsection.
1.2. Repeatability under identical conditions
Reference Zaborniak, Bremek, Budzik and KluczyńskiZaborniak et al. (2024) analysed the dimensional and shape accuracy of Fused Deposition Modeling (FDM) printed PLA models produced repeatedly under identical settings, observing measurable variations between builds. Reference Schmitt, Schlick and SchilpSchmitt et al. (2022) evaluated build-to-build repeatability in laser powder-bed fusion (LPBF) of 16MnCr5 steel, identifying differences in both geometry and mechanical strength despite identical process parameters. Reference McGregor, Rylowicz, Brenzel, Baker, Wood, Pick, Deutchman, Shao, Tawfick and KingMcGregor et al. (2021) printed ninety lattice structures with identical geometry and settings on multiple printers, revealing significant machine-to-machine variability.
In directed-energy deposition, Reference Sargent, Peter, Penney and SchmitzSargent et al. (2025) performed a repeatability study on robotic wire-arc additive manufacturing (WAAM) of aluminium, printing the same component five times and observing geometric and mechanical scatter. Reference Yang, Hong, Lu, Hu, Yang and LaneYang et al. (2024) studied surface-roughness repeatability in multi-build overhang parts produced by LPBF, confirming that even secondary surface features exhibit significant variability across builds.
1.3. Identified gap
A closer examination of the geometries used in the above studies reveals that most authors adopted standardized or simplified test parts rather than functional components. Reference Zaborniak, Bremek, Budzik and KluczyńskiZaborniak et al. (2024) employed a reference artefact containing basic geometric primitives, such as cylinders, spheres, and step features primarily designed for metrological evaluation. Reference Yang, Hong, Lu, Hu, Yang and LaneYang et al. (2024) analysed overhang coupons with simple prismatic shapes to study surface-roughness repeatability, while Reference McGregor, Rylowicz, Brenzel, Baker, Wood, Pick, Deutchman, Shao, Tawfick and KingMcGregor et al. (2021) used lattice blocks to assess dimensional variability across multiple FDM machines. In metal additive processes, Reference Schmitt, Schlick and SchilpSchmitt et al. (2022) investigated repeatability in LPBF using conventional test samples such as gears and flat tensile specimens, whereas Reference Sargent, Peter, Penney and SchmitzSargent et al. (2025) produced a WAAM artefact composed of basic prismatic and cylindrical features. Although these geometries enable controlled measurement, they remain non-functional and single-purpose, typically printed in predefined, optimized orientations.
While these studies provide valuable data on process stability, they mainly rely on standardized or simplified geometries printed in predefined orientations. In most cases, these designs would not be fabricated with AM in a real-world scenario. In other terms, experiments assessing variability in AM have overlooked components to be conveniently produced through AM and/or developed through Design for AM (DfAM) principles. This distinction highlights a further research gap concerning the repeatability of complex, DfAM-driven parts.
1.4. Objectives and contribution
Building on the gaps identified above, the objective of the paper is to investigate repeatability of AM components fabricated under fixed manufacturing conditions. Rather than isolating individual physical sources of deviation, the study examines how deviations may recur across repeated builds when material, machine, slicing strategy, and process parameters are kept constant. To illustrate how repeatability can be assessed in practice, a representative case study of a functional FDM-printed component is employed. FDM was selected because its layer-wise deposition and strong orientation dependence make geometric repeatability both critical for industrial use and readily observable under controlled conditions. The work quantifies repeatability using complementary metrology approaches and evaluates how repeatability manifests across multiple nominally identical components. The main contributions are: (i) a repeatability-focused assessment workflow combining surface-based and feature-based measurements; (ii) characterisation of repeatability under fixed conditions; and (iii) repeatability-oriented design implications regarding orientation and functional interfaces.
2. Materials and methods
2.1. Experimental setup
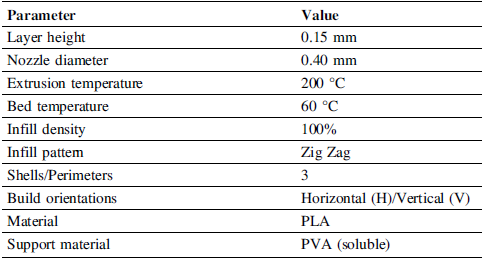
In this case study, the aim is to assess process repeatability of a component presenting complex features in FDM under fixed process parameters. The selected component is a limb of a quadruped robot DINGO, originally designed by Ferguson N. and Calvert A. (Monash University) and later optimized using Fusion360 generative design tool in (Reference Innocenti, Moreno-Nieto, Borgianni, Sales-Lerida and Molina-RubioInnocenti et al., 2025) hence a method ranging among recognized DfAM techniques. As shown in Figure 1, the final CAD model includes optimized features and multiple functional surfaces, representing a more complex geometry compared to standardized test artefacts used in past studies. The component has overall dimensions of 160×30×18 mm (length × width × height). Ten components were printed with the same process parameters, divided into two build orientations as no orientation preferable in all respects could be identified. Five components were produced for each orientation, in line with past literature, e.g., Reference Sargent, Peter, Penney and SchmitzSargent et al. (2025). The printed specimens were labelled according to their build orientation: H1–H5 for horizontally oriented builds and V1–V5 for vertically oriented ones. The printing setup visualized through the software connected to the AM device is shown in Figure 2 where the two different orientations are clearly highlighted. Key process parameters, such as layer height, extrusion temperature, printing speed, and infill density, were kept constant for all builds and are illustrated in Table 1. The components were 3D-printed with a dual-extrusion FDM printer (Ultimaker S7); PLA was used for fabrication and soluble PVA as support material.
Component used for the repeatability study; the figure shows (a) the original DINGO quadruped robot; (b) the CAD model of the final generatively designed component by Reference Innocenti, Moreno-Nieto, Borgianni, Sales-Lerida and Molina-RubioInnocenti et al. (2025)

Printing setup showing the horizontal (left-hand side) and vertical build orientation (right-hand side) for five identical components

Main printing parameters

2.2. Measurement procedure
Dimensional and geometric deviations from the nominal CAD model were assessed using two complementary metrology systems:
-
• a stereovision-based structured-light 3D scanner (ATOS Core 300, ZEISS Metrology) for global shape analysis and deviation mapping (manufacturer-specified measurement accuracy: 0.01 mm), and
-
• a coordinate measuring machine (CMM) (ARES NT, COORD3) for high-accuracy assessment of reference features, such as holes and planes in contact with other components during assembly (MPEE, i.e., maximum permissible error of length measurement, according to ISO 10360-2).
The combined use of 3D scanning and CMM was adopted to characterize repeatability at two complementary scales of detail: the 3D scanner to provide an overall view of form deviations across the entire surface; the CMM to quantify dimensional variations on functional reference features.
Computed statistical indicators concerning deviations include mean, standard deviation, interquartile range (IQR), mean absolute error (MAE), root mean square error (RMSE), 95th percentile (P95), coefficient of variation (CV%), and the percentage of points within a ±0.20 mm tolerance band (%T) were computed on the deviation variable Δ, defined as the difference between the measured and nominal geometry. For the 3D scanner data, Δ corresponds to the point-wise distance between the reconstructed surface and the nominal CAD model after best-fit alignment, providing a representation of geometric variability across the entire part. For the CMM data, Δ refers to the deviation of each measured feature (such as hole diameters, inter-hole distances, and planar or cylindrical surfaces) from its nominal value, quantifying local dimensional variability relevant to assembly interfaces. The ±0.20 mm tolerance threshold used was adopted as a reference value to evaluate accuracy, consistent with the typical dimensional performance of FDM processes, in line with (Reference Equbal, Murmu, Kumar and EqubalEqubal et al., 2024).
2.2.1. Surface deviation assessment
For each specimen, the acquired surface data were processed with an inspection software that allows the comparison between 3D-scanned (mesh) and CAD models, namely GOM Inspect (ZEISS Metrology). The mesh was aligned to the nominal CAD model through a best-fit procedure that minimizes the squared distances between corresponding surface points belonging to critical areas. More specifically, the alignment was performed using the Local Best Fit tool constraining the functional interfaces of the component, namely Plane 1, Cylinder 1, and Cylinder 2 (Figure 3). These correspond to the contact surfaces between the printed part and the robot’s mechanical joints. This alignment choice was made to give prominence to variability dimensions that directly affect the functional performance of the part within the assembly.
Functional reference features used for the local best fit alignment

2.2.2. Feature-based dimensional assessment
The CMM measurements provide a quantitative evaluation of local dimensional repeatability across the ten printed specimens. The dimensional evaluation using the CMM was performed on the reference geometries highlighted in Figure 4, six holes (indicated through numbers) and two reference surfaces (in yellow) for each specimen.
Reference geometries used for CMM measurements

3. Results
3.1. Surface deviations
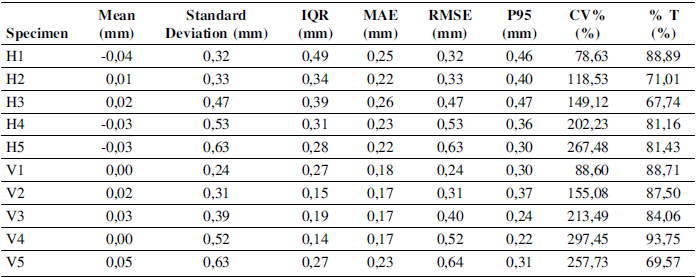
The deviation data, defined as the point-to-surface distance between the mesh and the nominal CAD model, were extracted as point-wise values uniformly distributed over the component’s surface, with additional points placed in critical geometric areas. For each specimen, 72 points were evaluated across the whole volume. This sampling density was considered adequate with respect to the component’s overall dimensions and surface complexity. The evaluated statistical indicators reported in Table 2 enable a comparison between specimens and orientations, highlighting both average accuracy and local variability in the produced geometry.
Surface deviations following the local best fit alignment (abbreviations are to be found in Section 2.2)

The analysis highlights the intrinsic geometric variability of FDM parts under fixed process conditions. Mean deviations across all samples remain small (within ±0.05 mm), confirming the absence of systematic dimensional bias. However, the dispersion metrics reveal clear orientation-dependent differences.
For the horizontally oriented builds (H1–H5), the standard deviation ranges from 0.32 to 0.63 mm and the IQR varies between 0.28 and 0.49 mm, indicating moderate but consistent variability across specimens. These deviations mainly appear on upper surfaces and overhanging regions, where heat accumulation and layer transitions generate minor distortions that propagate along the build plane. Despite this, over 80% of surface points remain within the ±0.20 mm tolerance band, demonstrating generally stable geometry when the component is printed in the horizontal orientation.
Conversely, the vertically-oriented builds (V1–V5) exhibit smaller global deviations but more pronounced local irregularities. The standard deviation varies between 0.24 and 0.63 mm, but the IQR tends to be lower (0.14–0.27 mm), reflecting tighter clustering of values but larger extremes. This suggests that vertical orientation amplifies thermal contraction and material flow asymmetry along the Z-axis, producing slender distortions and residual stresses that locally affect feature alignment. The percentage of surface points within tolerance (%T) varies widely from 70% to over 90%, depending on the orientation of functional zones to unsupported or inclined regions.
Overall, horizontally oriented prints show better average conformity but larger overall warpage, while vertically oriented builds show higher local accuracy but greater anisotropy. These trends confirm that FDM repeatability is directionally sensitive: dimensional consistency improves when layers support one another, whereas vertically accumulated stresses reduce reproducibility in height-dependent features.
3.1.1. Feature-based dimensional assessment
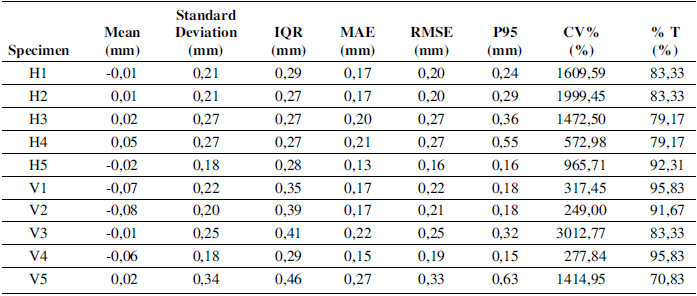
The measurement set of CMM evaluation included the diameters of the six holes, the centre-to-centre distances between the holes, the cylindricity of each hole, and the planarity of the two reference surfaces. All measured values were expressed as deviations from the corresponding nominal CAD dimensions and then grouped by specimen (H1–H5 and V1–V5) to analyse repeatability both within and between build orientations. Table 3 summarizes the main statistical parameters derived from the CMM measurements, highlighting the variability observed across specimens within each orientation.
Surface deviation statistics from CMM (abbreviations are to be found in Section 2.2)

Mean deviations for both orientations remain close to zero, confirming the absence of systematic bias. However, the dispersion indicators reveal notable part-to-part variability.
For the horizontal builds (H1–H5), the standard deviation ranges between 0.18 mm and 0.27 mm, with IQR between 0.27 mm and 0.29 mm, indicating moderate geometric consistency within the group. The corresponding MAE and RMSE values, between 0.13–0.20 mm, confirm that most measured deviations remain within the typical dimensional accuracy range reported for FDM-printed PLA parts.
In contrast, the vertical builds (V1–V5) show slightly higher dispersion, with standard deviation values up to 0.34 mm and MAE values up to 0.27 mm, suggesting that build orientation influences the geometric repeatability of functional features. P95 of deviations ranges from 0.16 mm to 0.63 mm, highlighting that a small fraction of the evaluated surface points exceed typical tolerance limits.
CV value, despite the small mean values, varies widely (from about 250% to over 3000%) due to the limited nominal deviation, emphasizing that local dimensional differences can be relatively large even when the overall mean deviation is small. The percentage of data within a ±0.20 mm tolerance band is generally high (between 70% and 95%) confirming that most critical features meet dimensional requirements, though with some orientation-dependent deviations.
Overall, the CMM analysis demonstrates that, under identical process parameters, FDM components exhibit feature-level variability consistent with the orientation-dependent deviations observed in the analysis of 3D-scanned models. These findings confirm that not only is variability an evident phenomenon in FDM, but also do orientation and local geometry significantly affect repeatability.
3.1.2. Integrating surface- and feature-level metrology
Some of the comments that follow derive from more granular observations of data, which are not reported for space reasons.
Overall, the data revealed that deviations detected by the scanner were consistent with those measured by the CMM. In horizontal builds, the scanner highlighted mild but extensive warpage across surfaces, which corresponded to small yet systematic dimensional shifts in hole spacing measured by the CMM. Vertical builds exhibited more localized deviations, with cylindrical features slightly elongated along the build direction, consistent with the anisotropic deformation observed in surface deviation data.
These results suggest that both form and feature accuracy are influenced by the same sources of process variability, expressed differently depending on build orientation. The findings do not imply predictive capability but provide complementary evidence on how orientation and geometry affect repeatability.
4. Discussion and design implications
The comparative analysis between surface and feature level metrology highlights that geometric repeatability in FDM remains limited even under fixed process conditions, but it also reveals how this variability manifests differently across measurement scales. Since the scanner and the CMM operate at different scales and their metrics are not directly comparable in terms of magnitude, the analysis focuses on identifying which specimens exhibit the most critical behaviour within each measurement domain. Among the analysed specimens, H5 and V4 exhibit the highest surface variability (standard deviations of 0.52 and 0.63, respectively) but maintain relatively %T in CMM data, indicating that warpage can coexist with stable functional geometry. H4 and V5 show the opposite behaviour: feature-level deviations reach the highest P95 values and the lowest %T, revealing that local feature can be more sensitive than the overall surface. Rather than scaling consistently across the geometry, variability shifts between surface regions and functional features depending on local geometry and deposition conditions. These observations indicate that some geometries are globally more sensitive, while others are more affected by inaccuracies at the feature level. As a consequence, the stability of functional interfaces cannot be inferred from surface behavior alone, and both scales of deviation need to be considered when evaluating repeatability.
Based on authors’ interpretation of the results, repeatability issues are not purely stochastic, at least in the present case study. Similar deviation patterns reappeared across builds, indicating that deterministic sources, such as thermal gradients, toolpath discontinuities, and orientation-dependent overhang effects, plausibly govern much of the observed deviations. Consequently, improving repeatability demands addressing these predictable effects through design and process planning, for example by optimizing toolpath strategies, refining support placement, or compensating for thermal deformation during slicing.
The results indicate that build orientation notably influences geometric consistency, even when process parameters are held constant. Although orientation was not a primary variable of investigation, the comparative data showed up to 25% lower RMSE and CV% in horizontal builds than in vertical ones. This suggests that, to improve dimensional stability, the number of the predominant dimensions of functional features (e.g., axes of cylinders) aligned along the build direction (where layer-by-layer errors tend to accumulate) have to be minimized.
Some design guidelines can be drawn from the results, especially for parts where dimensional stability is critical. While these guidelines are derived from a specific case, they highlight practical aspects that can inform geometry and orientation choices in similar FDM applications.
-
• Orient functional interfaces to minimize error along the build direction. Functional interfaces (planar, cylindrical, or curve) should be oriented so that their principal functional direction (normal or axis) lies as much as possible within the XY build plane. Since FDM accuracy typically decreases along the Z-axis due to layer accumulation and thermal contraction, this orientation helps reduce layer-wise deviation and preserve dimensional integrity.
-
• Reduce unsupported and overhanging regions. The illustrated results straightforwardly confirm that unsupported surfaces, including inclined or curved ones, tend to deform after partial cooling or support removal. Designing parts to minimize such areas, or to include self-supporting angles, reduces post-deposition distortion and improves repeatability of critical dimensions.
-
• Align elongated geometric features with the extrusion path. For features with a predominant geometric direction, such as ribs, beams, or channels, aligning them with the extrusion path helps reduce anisotropic shrinkage and internal stress gradients. This alignment improves both geometric consistency and mechanical homogeneity.
These design guidelines are well established in the literature; however, the present study extends their interpretation by explicitly linking them to repeatability rather than to accuracy alone. In existing DfAM guidance, improved geometric accuracy is often implicitly assumed to translate into improved repeatability. Our results indicate that this link is not straightforward: similar deviation patterns recur across builds under fixed conditions. This suggests that geometry and orientation dependent effects can give rise to systematic, repeatable deviation signatures that limit repeatability even when process settings are held constant.
These guidelines are consistent with recent literature on FDM dimensional behaviour and accuracy (Reference Equbal, Murmu, Kumar and EqubalEqubal et al., 2024; Reference Greco, Russo and GerbinoGreco et al., 2024; Reference Grgić, Karakašić, Glavaš and KonjatićGrgić et al., 2023; Reference Solouki, Aliha, Makui, Choupani and SeitiSolouki et al., 2024), while extending these observations explicitly to the context of repeatability. Reference Equbal, Murmu, Kumar and EqubalEqubal et al. (2024) and Reference Solouki, Aliha, Makui, Choupani and SeitiSolouki et al. (2024) show that build orientation and unsupported regions strongly affect dimensional deviations and geometric stability, highlighting the accumulation of layer-wise errors along the build direction. Similarly, Reference Greco, Russo and GerbinoGreco et al. (2024) demonstrate that orientation-dependent effects simultaneously influence geometric deviations, surface quality, and mechanical performance, confirming that geometric consistency is not uniform across different directions and features. However, in these studies, repeatability is assessed indirectly via aggregate accuracy metrics or via tolerance compliance at a single measurement scale. While Reference Grgić, Karakašić, Glavaš and KonjatićGrgić et al. (2023) demonstrate that FDM components can be produced within permissible tolerance limits for assembly, repeatability is primarily interpreted as compliance with predefined dimensional bounds. The present work complements these findings by showing that repeatability cannot be fully characterised by tolerance compliance alone: deviation patterns may recur in a systematic manner and can manifest differently at surface and feature levels, with direct implications for inspection strategy and functional interface design.
Some design-related considerations emerged from this case study, which involved a geometry without a clearly preferred build orientation. The analysis of deviation patterns made it possible to identify orientation-dependent phenomena that underline the relevance of the above guidelines. It is reasonable to assume that, for other geometries, materials, or AM technologies, different or additional design recommendations related to repeatability could emerge.
To support such comparisons, the methodological workflow adopted in this study can be conveniently replicated. This means replicating the following sequence of operations:
-
• Definition of geometry (possibly aligned with one or more DfAM techniques), material, AM technology and process parameters;
-
• fabrication and metrological evaluation, combining surface deviation mapping and feature-level inspection;
-
• analysis of deviation data and its interpretation to give design feedback; identification of the aspects critical to improve repeatability in relation to geometry, orientation, or process setup.
In this sense, the contribution of this work lies also in its methodological proposal. The workflow illustrates how metrology can be systematically connected to design interpretation to produce repeatability-related knowledge. Applying the same sequence of steps to other materials, AM processes, and geometries could help verify, refine, and extend the design guidelines obtained here.
5. Conclusions, limitations and future work
This study explored repeatability in FDM using two complementary metrology techniques: a structured-light 3D scanner for surface deviations and a CMM for feature-level dimensional analysis. The analysis aimed to understand how geometric deviations occur under fixed manufacturing conditions. Therefore, the scope of the work was intentionally limited to a single material and geometry, in order to keep the experimental conditions controlled. This methodological focus represents both the strength and the main limitation of the study: the results clarify how repeatability can be characterized under controlled settings but cannot yet be extended to other materials, machines, or process environments. In real production scenarios, factors such as long-term machine drift, filament ageing, or environmental stability may alter the variability trends observed. As a result, the authors acknowledge that the obtained results cannot be directly used to infer practical implications for industry.
The authors’ observations led to identify specific phenomena taking place during the 3D printing process as fundamental sources of variability. To validate the interpretations proposed here, future research could monitor the behaviour using different printers, technologies or analyse how deviations emerge during printing. Coupling in-situ sensing (thermal or optical) with the deviation maps developed here could enable predictive correction of geometric errors in real time.
From a design perspective, the results indicate that geometric repeatability can be treated as design-relevant information. The next step is to include repeatability information within generative or parametric design environments, allowing designers to predict geometric instability in the design space exploration.





 Open access

