INTRODUCTION
Salmonella may be responsible for two types of human diseases: (i) acute salmonellosis, e.g. typhoid fever, which results from systemic infection and may lead to very severe symptoms and death; and (ii) foodborne gastroenteritis, which is less dramatic, except in the elderly or immune depressed people. The latter is most often due to Salmonella enterica serovar Enteritidis and consumption of poultry and poultry products [1, Reference Humphrey2]. Horizontal transmission between hens may occur either directly from one animal to another, through aerosols or indirectly through the environment, mainly through contaminated water and feed. Vertical transmission may also occur from infected parents to offspring directly in the ovary and embryonated eggs [Reference Humphrey and Lanning3]. Many prophylactic means have been developed to reduce the prevalence of the Salmonella carrier-state [Reference Beaumont, Muir and Aggrey4]. While none allows a total reduction of the risk, synergy could result in a marked reduction of it.
Modelling the risk of Salmonella infection would be very useful to estimate such gains in food safety. Previously, a deterministic mathematical model for Salmonella transmission in hen houses was derived by Prévost et al. [Reference Prévost, Magal and Beaumont5]. It was used to investigate the effect of genetic selection and vaccination on disease propagation. This question was also investigated through the comparison of propagation within a homogenous population or another population divided into two subpopulations, with higher or lower resistance. Significant differences in variation with time of prevalence and ultimate level of contamination were observed [Reference Prévost6]. Genetic variability was more precisely modelled using an individual-based model (IBM) [Reference Zongo7]. Immune response was also considered as it may influence the evolution with time of animal infection towards either recovery or systemic state. The animal's bacterial load was thus assumed to depend on environmental contamination and on its individual ability to kill bacteria, as long as it remained lower than an individual threshold denoted by D p ; in this case the bacterial load may decrease over time, animals are then in the so-called I D − state, i.e. with a transient contamination. By contrast, once the bacterial load exceeds this threshold, hens are no longer able to eradicate digestive contamination. They get I D+, i.e suffer from long-term digestive contamination; bacteria multiply and invade the bloodstream leading to a systemic state and afterwards recovery. This stochastic model was used to describe the spatio-temporal spread of Salmonella in a laying flock [Reference Zongo7]. Simulation results show the interest of this model: it allows the reproduction of experimental observations and suggests that the distance between cage rows also plays a role in the speed of propagation. However, the model still assumed that all birds in a cage were at the same state of infection, while the literature shows that, even with experimental infection, some animals remains uninfected (see e.g. [Reference Gast and Beard8–Reference Bichler, Nagaraja and Halvorson12]). Such variations among animals in one cage become more probable with current change in the EU in hens' housing system. To increase animal welfare, conventional laying cages were banned in the EU from 1 January 2012; only enriched cages, barn, free range or organic systems are now allowed. While birds were housed at a density of up to 10 birds per cage with a surface of about 398 cm2 per hen, enriched cages are designed to hold up to 50 animals with at least 600 cm2 of usable space per hen.
Based on very similar assumptions as in [Reference Zongo7], a deterministic model (DM) was proposed in [Reference Beaumont13] to evaluate the effects of different housing systems with regards to speed of bacterial propagation in an industrial hen house. This model was an extension of the one developed by Prévost et al. [Reference Prévost, Beaumont and Magal14] in which the spatial distribution of hens was considered but excretion rates of infectious hens were independent on time elapsed since infection.
The first goal of this publication was thus to introduce, in the IBM, variability between hens of the same cage and to test the interest of comparing this IBM to a DM with reference to Salmonella propagation in flocks of laying hens. This implies an extension of both models ([Reference Zongo7] and [Reference Beaumont13]) to take into account the cage structure and then compare them.
MODELS
This section summarizes the main features of both models more thoroughly described in [Reference Zongo7] and [Reference Beaumont13]. Hen house was assimilated to a cylindrical domain denoted by Σ = ℝ × Ω, where Ω = (0, L y ) and L y is the width of the hen house and denote a point of Σ by (x, y), with x ∈ ℝ and y ∈ Ω. In industrial hen house, cages in a house are aligned in rows and each group of rows are separated from each other by a space allowing the farmer to take care of the animals. Cages hold the same number of hens and enriched cages could harbour up to 50 hens (see Fig. 1).
Graphical representation of a hen house. All points in the hen house are identified by their position (x, y) and each cage containing this position is represented by ω(x, y). A cage may be identified by the number of its row and its position within each row.

IBM
While in the former IBM [Reference Zongo7] all animals in a cage had the same bacterial load, here, the dynamics of individual bacterial load for an individual (between t and t + 1), B is described as resulting from the bacterial growth rate g(B) and the density of bacteria that an individual acquires by ingestion or inhalation from all bacterial sources in a cage, I p .
 $$\displaystyle{{dB(\tau )} \over {d\tau}} = g(B(\tau )) + I_p (t,x,y),\tau \in [t,t + 1],$$
where
 $$I_p (t,x,y) = \displaystyle{k \over {N_c}} \int_{\omega (x,y)} {C(t,x',y')dx'dy'}, $$
with initial condition, B(t), N c is the number of individuals in a cage. The diffusion of bacteria in the hen house was modelled through a reaction diffusion model as in [Reference Zongo7], after a slight modification to take into account the cage size and the number of infected individuals per cage, i.e. using the discrete excretion rates β ID+ and β IS .
An individual at time t is in one of the five disease states (see Fig. 2
a): S
0, susceptible individuals with null bacterial load; I
D
−
, individuals suffering only from digestive contamination at a dose lower that its threshold D
p
(i.e. with a transient contamination); I
D+, individuals suffering from long-term digestive contamination; I
S
, individuals systemically infected after long-term digestive contamination; R, recovered individuals. The transitions $S_0 \rightleftharpoons I_{D -} \to I_{D +} $
are regulated by the individual bacterial load computed from equation (1), while transitions I
D+→I
S
→R are stochastic.
$S_0 \rightleftharpoons I_{D -} \to I_{D +} $
are regulated by the individual bacterial load computed from equation (1), while transitions I
D+→I
S
→R are stochastic.
A schematic comparison of the individual-based model (IBM) and deterministic model (DM). Evolution of health status for an individual and its interaction with the contaminant in the environment at time t and position (x, y) within the same cage. (a) In the IBM, hens may be in five states: S 0 (susceptible); I D− (infected with a low dose of digestive contamination); I D+ (suffering from a long-term digestive contamination); I S (systemic contamination); and R (recovered). Contaminations depends on environmental contamination C. The parameters γ,η (B p1), μ, β ID+, β IS and λ are described in Table 2. (b) In the DM, densities are considered, S(t, x, y) represents the density of susceptible hens at continuous time t and position (x, y). It should be compared to the number of hens with health status S 0. In the DM, i(a, t, x, y) is the density of infected hens with respect to age a of infection at continuous time t and position (x, y) to be compared to the number of hens with health status I D − , when a ∈ [0; τ 1], (I D+ + I S ) when a ∈ [τ 1; τ 1 + τ 2] and R when a ∈ [τ 2; A max]. The parameters τ 1, τ 2 and A max are described in Table 2.

State variables of deterministic model (DM) and individual-based model (IBM)

Baseline values of the model parameters
IBM, Individual-based model; DM, deterministic model.
As in [Reference Zongo7] the set of thresholds in a cage is denoted by D p , a random variable taking values from a beta distribution β(σ 1, σ 2), σ 1, σ 2 > 0.
DM
This model was the same as described by [Reference Beaumont13], except that cage size was considered. The DM reads as follows:
 $$\displaystyle{{\partial S(t,x,y)} \over {\partial t}} = - \sigma S(t,x,y)C(t,x,y),$$
 $$\displaystyle{{\partial i(t,a,x,y)} \over {\partial t}} = - \displaystyle{{\partial i(t,a,x,y)} \over {\partial a}},$$
 $$i(t,0,x,y) = \sigma S(t,x,y)C(t,x,y),$$
 $$\eqalign{\displaystyle{{\partial C(t,x,y)} \over {\partial t}} = & D{\rm \Delta} _{x,y} C(t,x,y) - \lambda C(t,x,y) \cr & + {\rm {\opf J}}(t,x,y),} $$
 $$\displaystyle{{\partial C(t,x,y)} \over {\partial \nu _\Sigma}} = 0,\;\;{\rm on}\;\;(0,\infty ) \times {\opf R} \times \partial {\rm \Omega,} $$
 $$S(0,x,y) = S_0 (x,y),$$
 $$i(0,a,x,y) = i_0 (a,x,y),$$
 $$C(0,x,y) = C_0 (x,y).$$
State variables and parameters are described in Tables 1 and 2, respectively. ν
Σ(x, y) denotes the outward unit normal vector of Σ at (x, y) ∈ ℝ × ∂Ω. The term ${\rm {\opf J}}$
(t, x, y) denotes the flux of excreted bacteria at time t by the hens at position (x, y). It is defined by
${\rm {\opf J}}$
(t, x, y) denotes the flux of excreted bacteria at time t by the hens at position (x, y). It is defined by
 $${ \rm {\opf J}}(t,x,y) = \int_{\omega (x,y)} {\,p(x - x',y,y')} \int_0^\infty {\beta (a)i(t,a,x',y')dadx'dy'}. $$
This term means that the flux at (x, y) is due to infection at (x′, y′) in the same cage weighted by some probability p. Function β ≡ β(a) denotes the age (since infection)-specific excretion rate. The parameter σ denotes the transmission rate, λ denotes the mortality rate of the bacteria and D is the diffusion coefficient for their dispersal in the environment.
Relationship between IBM and DM
In the DM, S(t, x, y) represents the density of susceptible hens at continuous time t and position (x, y). It corresponds in the IBM to the density of hens with health status S
0. In the DM, i(a, t, x, y) represents the density of infected hens with respect to infection age a at continuous time t and position (x, y). When a ∈ [0; τ
1], it corresponds in the IBM to the density of hens with health status I
D
−
; when a ∈ [τ
1; τ
1 + τ
2], it corresponds to R status. Therefore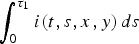 $\int_0^{\tau _1} {i(t,s,x,y)\,ds} $
,
$\int_0^{\tau _1} {i(t,s,x,y)\,ds} $
,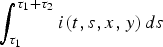 $\int_{\tau _1} ^{\tau _1 + \tau _2} {i(t,s,x,y)\,ds} $
and
$\int_{\tau _1} ^{\tau _1 + \tau _2} {i(t,s,x,y)\,ds} $
and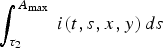 $\int_{\tau _2} ^{A_{\max {\rm \;}}} {i(t,s,x,y)\,ds} $
represent the total density of hens with health status I
D
−
, (I
D+ + I
S
), and R, respectively (see Fig. 2).
$\int_{\tau _2} ^{A_{\max {\rm \;}}} {i(t,s,x,y)\,ds} $
represent the total density of hens with health status I
D
−
, (I
D+ + I
S
), and R, respectively (see Fig. 2).
Model parameters
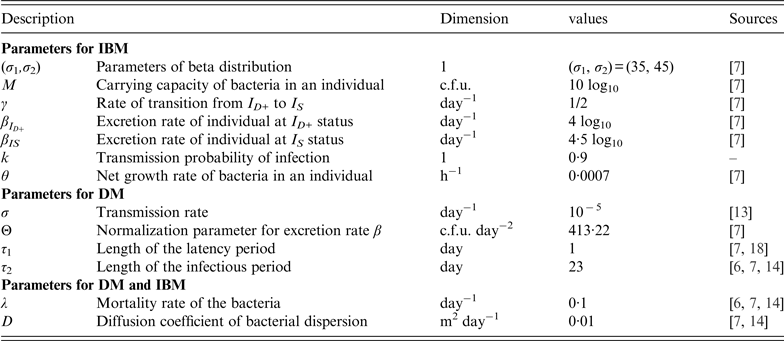
The list of parameters in the IBM and DM as well as their values are summarized in Table 2.
Most parameters are obtained from previous models except the probability of transmission, k, for DM which was set at 0·9. This parameter value was chosen in order that both models are very close when the initial doses of contamination are close to the mean value [i.e. σ 1/(σ 1 + σ 2) × 10 log10] of the set of individual thresholds.
The excretion rate of hens with respect to age a is chosen as in [Reference Beaumont13] in the form
 $$\beta (a) = {\rm \Theta} \times (\tau _1 - a)\,(a - (\tau _1 + \tau _2 )) \times 1_{[\tau _1 ;\tau _1 + \tau _2 ]} (a),$$
where τ 1 (resp. τ 2) is the mean duration of the latency (resp. infectious) period, and Θ is a normalization parameter.
As in the IBM we assume that probability p, that an infection starts in position (x, y) is due to an infection at position (x′, y′) is uniform in cages.
 $$ {p(x - x',y,y') = \left\{ {\matrix{ {\displaystyle{1 \over {\vert \omega (x,y) \vert}}\,{\rm if}\,(x,x'),(y,y') \in \omega (x,y),} \cr {0\quad {\rm otherwise},} \cr}} \right. }$$
where |ω(x, y)| represents the surface of the cage containing the point (x, y). Since all cages have the same size, |ω(x, y)| = ℓ × L, where ℓ and L is the width and length of a cage, respectively.
SIMULATION EXPERIMENTS
Materials and methods
Comparison of IBM and DM
The comparison of the IBM and DM was investigated in two tests [(i) and (ii)]. For all tests, the dimensions of rows and building are described in Table 3 and the parameter values in Table 2. The cage length is set at 2 m, 20 cages of 24 hens are considered. Different values of the initial dose of environmental contamination are considered.
Dimensions of hen house parameters

Test (i): comparison of the evolution of the percentage of infectious hens in cages and hen house
In cages in rows 2 and 3 at position 1, initial density of bacteria, i.e. C
0 was set at 103, 5 × 10⁴ and 106 c.f.u. and assumed to be distributed uniformly, i.e. $C_0\!: = \int _{\omega (x,y)} C_0 (x',y')\,dx'dy'$
(see Fig. 3). Initial density of infectivity, i.e. I
0 at day 0 was set at 0 for the DM and IBM.
$C_0\!: = \int _{\omega (x,y)} C_0 (x',y')\,dx'dy'$
(see Fig. 3). Initial density of infectivity, i.e. I
0 at day 0 was set at 0 for the DM and IBM.
Initial condition: (a, b) for the deterministic model (DM) and individual-based model (IBM), initial density of bacteria, i.e. C
0 is set at 5 × 10⁴ c.f.u. and distributed uniformly in the environment of two cages, i.e.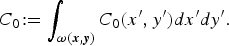 $C_0\! : = \int _{{\bi \omega} ({\bi x},{\bi y})} C_0 (x',y')dx'dy'.$
(c, d) Initial distribution of susceptible hens, at day 0 for the DM and IBM.
$C_0\! : = \int _{{\bi \omega} ({\bi x},{\bi y})} C_0 (x',y')dx'dy'.$
(c, d) Initial distribution of susceptible hens, at day 0 for the DM and IBM.

The evolution with time after inoculation was computed. In both models and with the two cage sizes, percentages of infectious hens per cage were considered, i.e. $\int _{\tau _1} ^{\tau _1 + \tau _2} i(t,s,x,y)ds \times 100/S_0 (x,y)$
for the DM and (I
D+ + I
S
) × 100/N
c
for the IBM (as described in earlier). They were represented as a function of time, cage per cage, or by cage row.
$\int _{\tau _1} ^{\tau _1 + \tau _2} i(t,s,x,y)ds \times 100/S_0 (x,y)$
for the DM and (I
D+ + I
S
) × 100/N
c
for the IBM (as described in earlier). They were represented as a function of time, cage per cage, or by cage row.
Test (ii): comparison of the basic reproduction number, R 0
The basic reproduction ratio, denoted by R 0, describes the number of infected hens produced by a single infected hen during its entire infectious period in the infection-free environment and a completely susceptible population. The pioneer definition of R 0 in heterogeneous populations is given in [Reference Diekmann, Heesterbeek and Metz15].
Computations with the IBM
From the definition of the so-called basic reproduction number, we estimated its average value in the IBM model without an explicit formula by directly counting the average number of infected individuals produced by a single infected individual in a completely susceptible population of hens. A total of 300 simulations were achieved. Results shown are the mean, 5th and 95th percentiles of results.
Computations with the DM
Equation (2) was linearized near the disease-free equilibrium (S*, i*, C*) = (S 0(x, y), 0, 0) and studied to obtain an expression for R 0 [see equation (10)]. This method is similar to that used in [Reference Thieme16]. The numerical computation of R 0 was achieved thanks to the power iteration algorithm in function of length L of cages (see algorithm in the Appendix). In the case of spatial homogeneity, S 0(x, y) ≡ S 0 > 0 and without cage structure, R 0 is easily computed:
 $$R_0 = \displaystyle{{\sigma S_0} \over \lambda} \int_{\tau _1} ^{\tau _1 + \tau _2} {\beta (a)da}. $$
Sensitivity analysis of R 0 for the DM
Sensitivity analyses were also performed for the DM to determine the relative importance of model parameters on Salmonella transmission. From [Reference Arriola and Hyman17], the normalized sensitivity index, Λ p X , of a variable X that depends smoothly on parameter p, is defined as,
 $${\rm \Lambda} _p^X = \displaystyle{{\partial X} \over {\partial p}} \times \displaystyle{\,p \over X}.$$
Sensitivity indices of the basic reproduction ratio, R 0, allow us to measure the relative change in R 0 when a parameter, p ∈ {τ 1, τ 2, L, λ, Θ, D, σ} changes.
Effect of cage length L
To investigate the effect of cage length on Salmonella prevalence, speed of propagation and basic reproduction number, two tests were considered [tests (iii) and (iv)]. In cages in rows 2 and 3, position 1, initial density of bacteria, i.e. C 0 was set at 5 × 10⁴ and assumed to be distributed uniformly. Initial density of infectious hens, i.e. I 0 at day 0 was set at 0 for the DM and IBM.
Test (iii): percentage of infectious hens and speed of propagation as a function of L
Two cage sizes were considered: 20 cages of 24 hens or 40 cages of 12 hens so that animals occupy the same surface area. As in the ‘Comparison of IBM and DM’ section, percentages of infectious hens per cage were considered.
Test (iv): basic reproduction number, R 0 , as a function of L
Several cage sizes were considered: the largest 4 m long (i.e. 40 hens per cage) and the smallest 0·5 m long (i.e. five hens per cage). The method used to compute R 0 is the same as in the earlier section comparing the IBM and DM.
Results
Comparison of IBM and DM
Test (i): comparison of the evolution of the percentage of infectious hens in cages and hen house
Figures 4 and 5(a–c), or Figure 6(a–c) in two dimensions, show the percentage of infectious hens as a function of initial contamination dose in the environment, i.e. 103 c.f.u. and 106 c.f.u., for the former and 5 × 10⁴ c.f.u. for the latter. Results on the IBM were the mean of 300 simulations. This test clearly shows the difference between the IBM and DM. Indeed, the DM is much less sensitive to the initial contamination than the IBM.
Evolution at days 4 and 100 of the percentage of infectious hens in the hen house when the environment of two cages are contaminated at 103 c.f.u. (a) and (c) [or 106 c.f.u. (b) and (d)] (see Fig. 3). (a, c) With the individual-based model (IBM); (b, d) with the deterministic model (DM). Results for a dose equal to 5 × 10⁴ c.f.u. is shown in Figure 5(a–c) for the whole hen house or in Figure 6(a–c) in a single row of cages.

Evolution over time of the percentage of infectious hens in a cage in two dimensions when the environment of two cages are contaminated with an initial dose equal to 5 × 10⁴ c.f.u. (see Fig. 3). (a, b) Results from individual-based model simulation; (c, d) results from deterministic model simulation. Only the dynamics of infected individuals in cages in row 2 is shown. (a, c) The number of individuals in each cage, N c = 20; the number of cages per rows, n cpr = 24. (b, d), The number of individuals in each cage, N c = 40; the number of cages per rows, n cpr = 12.

Evolution at days 4 and 100 of the percentage of infectious hens in the hen house when the environment of two cages are contaminated as in Figure 3. (a, b) Results from individual-based model simulation; (c, d) results from deterministic model simulation.

Test (ii): comparison of the basic reproduction number, R 0
For the IBM the basic reproduction number depends on the initial contamination doses. When one individual is contaminated with an initial dose of 102, 5 × 10⁴ and 106 c.f.u., respectively, computations give mean R 0 values of 0, 23 and 34, respectively.
By contrast, with DM R 0 is not dependent on the initial inoculum size: it is equal to 20 whatever the value of C 0.
Sensitivity analysis of R 0 for the DM
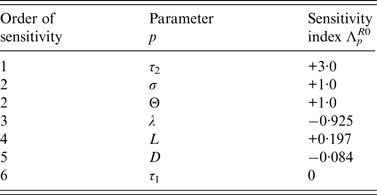
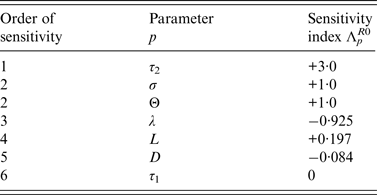
Normalized indices of sensitivity of R 0 to parameters are shown in Table 4. Parameters are ranked according to sensitivity. The most sensitive parameters are parameters linked to disease transmission: first, length of the infectious period during which bacteria are excreted, then transmission rate (i.e. animal susceptibility) and third, rate of excretion. Indices of sensitivity of the three parameters range from 3 to 1. Sensitivity to cage length is smaller (0·197) but three times higher than sensitivity to diffusion rate.
Effect of cage length, L
Test (iii): percentage of infectious hens and speed of propagation as a function of L
The spatio-temporal evolution of infectious hens in the hen house is shown Figure 6. Results on the IBM were the mean of 300 simulations. Comparing results obtained with two cage lengths clearly shows that the speed of propagation is higher with longer cages. With the DM, the speed of propagation is equal to 35·82 cm/day when cages are 0·5 m long and nearly double, i.e. 63·68 cm/day when they are 4 m long. Comparing the two models, it can be seen that results are rather similar but the propagation appears to be smoother for the DM.
Considering dynamics at the cage level (see Fig. 5), the propagation appears to be very regular along the cages in both cases and with both models. A higher number of cages is contaminated at a given time when cages are smaller (16 vs. 12 when the IBM is considered, 15 vs. 12 when the DM is studied).
When comparing results given by both models, even if means of simulations achieved with the IBM are similar to estimations provided by the DM, some differences may be observed. With the DM, the maximal percentage of infectious hens is a little higher (64% vs. 69% hens when cage length is 2 m vs. 4 m). By contrast, it slightly decreases over time for the IBM.
Test (iv): basic reproduction number, R 0 , as a function of L
Figure 7 shows that the epidemic threshold increases with respect to the length L of the cage in both models. When the DM is considered, the evolution is totally linear while with the IBM two different slopes are observed, depending on whether cage length is lower or higher than 2 m. The slope is slightly steeper at lower values. Moreover, variabilities of estimated R 0 also depend on cage length: it is higher for very low values of R 0 then decreases and thereafter markedly increases after the threshold of 2 m.
Evolution of the basic reproduction number with respect to cage length. DM, Deterministic model; IBM, individual-based model.

DISCUSSION
As for any IBM and DM, several features can be recalled. The IBM allows us to reproduce an experience at both the individual and the population level. By contrast, the DM only allows an experience at the group level. In this paper, comparison of both models was carried out at the group (cage or population) level.
In the DM, the formula for R 0 derived in the present paper extends the result of Prévost et al. [Reference Beaumont, Muir and Aggrey4] where R 0 depended also on S 0, σ, λ and a constant excretion rate during the systemic and digestive period. But here the density of excreted bacteria is computed from the integral over the period of excretion from τ 1 to τ 1 + τ 2. It also extends the formula derived in [Reference Beaumont13] because of the structure of the hen house in cages. Here, R 0 depends on the average duration of the systemic period, whose maximal value was set at 23 days with a maximal value at about 12 days.
In the IBM, the duration of excretion period may vary. It depends on the individual bacterial load at the very beginning of the systemic state, when the bacterial threshold is overcome. Since the bacterial load varies from hen to hen and, between hens from day to day, duration of excretion may vary to a large extent, between 0·6 and 47 days. While its mode takes the same values as with the DM, i.e. day 12 variations between estimated R 0 in both models result from those differences, they are coherent with the differences in propagation speeds observed between both models. Next, values of R 0 for both models depend on cage length: the longer the cage, the higher the number of hens contaminated by a single infectious hen and thus the larger the percentage of infected animals (Fig. 7). Larger epidemiological units are thus more favourable for quick diffusion of bacteria.
Moreover, when the cage length is very low (about 0·5 m), the cages only harbour five hens and the DM is equivalent to the case studied in [Reference Beaumont13] when all animals in a cage have the same status. In that case, we find a value of R 0 close to 5·22, the value computed with formula (2·2) in [Reference Beaumont13].
By contrast, when cage lengths are higher than 2 m, the IBM model suggests that the increase in R 0 is a little slower, probably because the increase in bacterial load is proportionally lower than the increase in cage surface, which results in a slightly lower probability for a hen to be contaminated. This variation in R 0 with cage length is in accord with what is observed at the cage or building level. In both cases, it can be seen that higher values of R 0 are associated with higher speeds of propagation along the building. Even in a cage, the maximum percentage of contamination is slightly higher with larger cages.
It should be noted that variability in results from the IBM was larger with a lower initial dose in environment. These results are a direct consequence of the strong Allee effect considered in the IBM that assumes that individuals may overcome the bacterial infection as long as the bacterial load remains lower than the threshold; when the individual bacterial dose is higher that its threshold, individuals undergo a longer term infection. The threshold, which is the maximal bacterial load that the individual may clear without persistent and systemic infection, varies from one individual to another with a minimal value of about 103 c.f.u. Therefore when one individual is infected and when the environment is contaminated with a dose lower than 103 c.f.u., respectively, R 0 tends to be zero [see results in test (ii)] and epizooty tends to die out (see Fig. 4a ), respectively.
That special case emphasizes the differences between both models. While results from the DM are similar to what is observed when the initial dose is close to the mean value of the individual threshold generated by the beta distribution (with parameters σ 1 and σ 2), with the IBM, a few cages remain uncontaminated (about 300 simulations were achieved). This is due to low individual contamination allowing fowls to recover and the environment to be cleared from Salmonella through natural bacterial mortality. This result demonstrates the main difference between the IBM and DM. Although the IBM allows the identification of unusual situations, it may also result in inappropriate conclusions if too few simulations are achieved.
The formula for R 0 in equation (10) available with the DM allows quick and reliable investigations of the effects of various parameters, of a sensitivity analysis (parameter sensitivity) or an uncertainty analysis (parameter importance) to determine which input parameters exert the most influence. Identifying the most sensitive parameters might help to develop efficient intervention strategies. This study shows that the most sensitive parameters are duration and intensity of excretion as well as animal susceptibility. Those parameters are mostly dependent on animal genetics highligting the interest of genetic selection (as already proved by Prévost et al. [Reference Prévost6]). However, large interactions may be observed between host genotype and bacteria reducing the impact of such prophylactic measures. Therefore, although the length, L, of a cage is not the most sensitive parameter, it may be easily controlled and should be considered in further studies.
This result most likely holds for other pathogenic agents than Salmonella enteritidis. It suggests that when designing new cages, care should be taken regarding the effect of cage length on risk of contamination. Combining this element with repartition of susceptible animals is a way to further increase food safety.
CONCLUSION
In this paper, two models were improved to take into account the size of cages, i.e. an individual-based model and a deterministic model. Comparison of both models shows that slight differences between individuals or groups may be observed with an IBM that could not be expected from a DM; for example, variations of R 0 with cage length suggest the existence of thresholds for cage length and number of hens per cage. The IBM also shows that the propagation along the building may slow (to a small extent). The main difference between IBM and DM arises when initial environmental contamination is very low (<103 c.f.u.). Such variations could be amplified if other prophylactic means are used. They should be considered in further models.
APPENDIX. Some details about the derivation of formulas in the DM
We assume that the cage structure is L-periodic with respect to the x direction. We set ω(x, y) = [LE (x/L); LE(x/L) + L] × ω(y), where E(z) denotes the integer part of the real number z. Then the contamination rate reads as follows:
 $$\eqalign{& \left( {\partial _t - D{\rm \Delta} + \lambda} \right)C(t,x,y) = \int_0^\infty {\beta (a)} \int_{LE(x/L)}^{LE(x/L) + L} {} \int_{\omega (y)} {\,p\,(x - x',y,y')\,i\,(t,a,x',y')\,dx'dy'da},} $$
Derivation of the basic reproduction number, R 0
We linearized the above equation close to S ≡ S 0(x, y) (L-periodic in x) that leads to the study of the following linear problem:
 $$\left.\eqalign{& \displaystyle{{\partial i(t,a,x,y)} \over {\partial t}} + \displaystyle{{\partial i(t,a,x,y)} \over {\partial a}} = 0 \cr & i(t,0,x,y) = \sigma S_0 (x,y)\,C\,(t,x,y) \cr & \left( {\partial _t - D{\rm \Delta} + \lambda} \right)C(t,x,y) = \int_0^\infty {\beta (a)} \int_{LE(x/L)}^{LE(x/L) + L} {} \int_{\omega (y)} {\,p\,(x - x',y,y')\,i\,(t,a,x',y')\,dx'dy'} da.}\right\} $$
Looking for L-periodic in x solutions of the form
 $$\eqalign{& i(t,a,x,y) = e^{\nu t} \varphi (a,x,y), \cr & C(t,x,y) = e^{\nu t} C(x,y),} $$
leads to the following system of equations
 $$\eqalign{& \varphi (a,x,y) = e^{ - \nu a} \sigma S_0 (x,y)C(x,y), \cr & \left( {\nu - D{\rm \Delta} + \lambda} \right)C(x,y) = \int_0^\infty {\beta (a)} \int_{LE(x/L)}^{LE(x/L) + L} {} \int_{\omega (y)} {\,p(x - x',y,y')e^{ - \nu a} \sigma S_0 (x',y')C(x',y')dx'dy'da.}} $$
Introducing
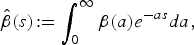 $$\hat \beta (s)\!: = \int_0^\infty {\beta (a)e^{ - as} da,} $$
the Laplace transform of β, by setting the Banach space
 $$X = \left\{ {C \in C^0 \left( {{\rm {\opf R}} \times {\rm \bar \Omega}} \right)\!:\;\;C(x + L,y) \equiv C(x,y)} \right\},$$
to consider the positive linear operator
 $$\eqalign{& L_\nu = \hat \beta (\nu )\left( {\nu + \lambda - D{\rm \Delta}} \right)^{ - 1}{\circ}{\rm \Psi}, \cr & {\rm \Psi} (\phi )(x,y) = \int_{LE(x/L)}^{LE(x/L) + L} {} \int_{\omega (y)} {\,p(x - x',y,y')\sigma S_0 (x',y)\phi (x',y)dx'dy'.}} $$
Note that the map R:v ∈ (−λ, ∞)→R(v) ∈ ℝ defined by the spectral radius of L v is decreasing. Next we set
 $$R_0 = R(0),$$
so that if R 0 > 1 then equation (3) has a non-negative eigenvalue and the disease-free equilibrium is linearly unstable.
Wave speed of propagation
In order to formally determine the wave speed of invasion, we perform a linear analysis of the leading edge of the front. Indeed equation (3) without periodic structure has been demonstrated to satisfy the well known linear determinacy of the wave speed (see [Reference Beaumont13]). Returning to equation (8) we look for solutions of the form
 $$\eqalign{i(t,a,x,y) = & e^{ - \nu (x - ct)} \varphi (a,x,y), \cr C(t,x,y) = & e^{ - \nu (x - ct)} C(x,y),} $$
where c denotes the wave speed of propagation while ν > 0 denotes the exponential decay rate of the front. Plugging these expression into (8) we get:
 $$\varphi (a,x,y) = e^{ - \nu ca} \sigma S_0 (x,y)C(x,y),$$
and
 $$(\lambda + \nu c - D\nu ^2 + 2D\nu \partial _x - D{\rm \Delta} )C(x,y) = \hat \beta (\nu c)\left[ {{\rm \Psi} _\nu C} \right](x,y).$$
Here we have set Ψ ν ∈ L(X) defined by
 $$\eqalign{& \left[ {{\rm \Psi} _\nu \phi} \right](x,y) = \int_{LE(x/L)}^{LE(x/L) + L} {\int_{\omega (y)} {\,p(x - x',y,y')e^{\nu (x - x')}}} \sigma S_0 (x',y')\phi (x',y')dx'dy',\;\forall \phi \in X.} $$
Note that Ψ
ν
is a positive linear operator acting from X into $L_\sharp ^\infty ({\rm {\opf R}} \times \omega )$
. Indeed one has for each ϕ ∈ X:
$L_\sharp ^\infty ({\rm {\opf R}} \times \omega )$
. Indeed one has for each ϕ ∈ X:
 $$\eqalign{& \left[ {{\rm \Psi} _\nu \phi} \right](x + L,y) = \int_{LE(x/L) + L}^{LE(x/L) + 2L} {} \int_{\omega (y)} {\,p(x + L - x',y,y')e^{\nu (x + L - x')}} \sigma S_0 (x',y')\phi (x',y')dx'dy'.} $$
Setting l = x′− L, and recalling that S 0 is L-periodic with respect to x while φ ∈ X, leads to
 $$\eqalign{& \left[ {{\rm \Psi} _\nu \phi} \right](x + L,y) = \int_{LE(x/L)}^{LE(x/L) + L} {\int_{\omega (y)} {\,p(x - l,y,y')e^{\nu (x - l)}}} \sigma S_0 (L + l,y')\phi (L + l,y')dldy' = \left[ {{\rm \Psi} _\nu \phi} \right](x,y).} $$
As a consequence of this linear study we obtain
 $$c^* = \inf \; \left\{ {c \gt 0\!:\exists \nu \gt 0\;R(\nu, c) \gt 1} \right\},$$
where R (ν, c) denotes the spectral radius of the linear operator $A_{\nu, c} \in {\rm {\cal L}}(X)$
defined by
$A_{\nu, c} \in {\rm {\cal L}}(X)$
defined by
 $$A_{\nu, c} \phi = \hat \beta (\nu c)(\lambda + \nu c - D\nu ^2 + 2D\nu \partial _x - D{\rm \Delta} )^{ - 1} \Psi _\nu \phi, \;\forall \phi \in X.$$
Algorithm to compute R 0
The computation of the principal eigenvalue of linear operator
 $$L_0\! :\phi \to \hat \beta (0)\,(\lambda - D{\rm \Delta} _{x,y} )^{ - 1}{\circ} {\rm \Psi} (\phi ),$$
i.e. R 0 is achieved thanks to the power iteration algorithm for a finite dimensional approximation of L 0, Ψ is defined in equation (9). More precisely, let L 0 h be the discretized operator on ℝ N corresponding to L 0 and let (·,·) be the usual scalar product, we compute the sequence defined for k ⩾0 by some non-trivial u 0 and
 $$u_{k + 1} = \displaystyle{{L_0^h (u_k )} \over {(L_0^h (u_k ),L_0^h (u_k ))^{1/2}}} $$
until the Rayleigh quotient
 $$\lambda _k = \displaystyle{{(u_{k + 1}, u_k )} \over {(u_k, u_k )}}$$
converges towards the principal eigenvalue of L 0 h .
DECLARATION OF INTEREST
None.