

INTRODUCTION
Across sub-Saharan Africa (SSA), there is a strong need to intensify crop production sustainably due to poor crop yields, rapid expansion of human population and increasing pressure on remaining non-cultivated areas with a high-biodiversity value (Pretty et al., Reference Pretty, Toulmin and Williams2011; Vanlauwe et al., Reference Vanlauwe, Coyne, Gockowski, Hauser, Huising, Masso, Nziguheba, Schut and Van Asten2014). Legumes provide opportunities for sustainable intensification. Legumes can fix atmospheric nitrogen and yield well without nitrogen fertiliser, improve the N status of soils and prevent the build-up of weeds, pests and diseases associated with continuous monoculture of cereal or root and tuber crops. Moreover, they provide nutritious food and feed, which often have a good market demand (Giller, Reference Giller2001).
Common bean (Phaseolus vulgaris L.) is the key staple grain legume in the highlands of East and Central Africa. While bush varieties have been widely grown since common bean was introduced in the 16th Century, climbing bean varieties were only found in a few locations in the Central African highlands until a targeted breeding programme was started in the mid 1980s including the introduction of new varieties from South America (Sperling and Muyaneza, Reference Sperling and Muyaneza1995). Climbing bean is now an important crop at elevations above 1600 m above sea level (masl) in the highlands of East and Central Africa. Its adoption cuts across socio-economic class and gender boundaries (Sperling and Muyaneza, Reference Sperling and Muyaneza1995). In the Northern Province of Rwanda, up to 95% of the households grow climbing beans (Franke and de Wolf, Reference Franke and de Wolf2011; NIS, 2010). The Northern Province has good rainfall (1000–1500 mm per annum) with two distinct growing seasons and relatively cool temperatures due to its mid to high elevation (Franke et al., Reference Franke, Rufino and Farrow2011). The province harbours relatively fertile volcanic soils, which have a long history of arable farming. Population densities in the Northern Province are very high, with on average 528 persons km−2 (NIS, 2012). Farming/fishing is the prime economic activity of 90% of rural males and 97% of rural females in Rwanda (SNR, 2005). Dense populations and limited opportunities for income generation off-farm have resulted in tiny landholdings, on average 0.65 ha per household in the Northern Province (NIS, 2010), and intensive land use. Climbing bean fits well within this farming system as a high yielding, though labour demanding crop. Other major crops include maize, sorghum, sweet potato, highland banana and potato.
The indeterminate growth of climbing beans allows them to take advantage of the long growing seasons at high elevations, providing edible yield over a prolonged period (Ann Clark and Francis, Reference Ann Clark and Francis1985; Wortmann, Reference Wortmann2001). Climbing beans tend to nodulate more prolifically than bush beans (Bliss, Reference Bliss1993) and their climbing habit allows them to capture a greater proportion of the available radiation, giving a greater yield and N2-fixing potential than bush beans (Wortmann, Reference Wortmann2001). Climbing beans are less suited for intercropping than bush varieties due to their prolific growth pattern, though farmers do intercrop climbing beans with maize, cassava and banana (Ruganzu et al., Reference Ruganzu, Mutware, Uwumukiza, Nabahungu, Nkurunziza, Cyamweshi, Vanlauwe, Van Asten and Blomme2014). Climbing bean productivity and N2-fixation is constrained by poor soil P and K availability (Burleig et al., Reference Burleig, Yamoah, Regas and Mukaruzika1992; Graham and Ranalli, Reference Graham and Ranalli1997). While the vast majority of climbing bean fields in Rwanda receive organic manure, only a small fraction (12–21%) of the farmers apply mineral fertilizers to beans (urea, DAP or NPK blend), as these are preferably applied to staple and high value crops such as potato and tomato (Franke and de Wolf, Reference Franke and de Wolf2011; Ruganzu et al., Reference Ruganzu, Mutware, Uwumukiza, Nabahungu, Nkurunziza, Cyamweshi, Vanlauwe, Van Asten and Blomme2014). Moreover, beans are sensitive to a range of pests and diseases including rodents, bean shoot fly, leafhoppers, chrysomelids and bruchids and root rots (Graham and Ranalli, Reference Graham and Ranalli1997; Ruganzu et al., Reference Ruganzu, Mutware, Uwumukiza, Nabahungu, Nkurunziza, Cyamweshi, Vanlauwe, Van Asten and Blomme2014; Sperling and Muyaneza, Reference Sperling and Muyaneza1995). The use of appropriate staking is the key to good yields of climbing bean, yet the availability and costs of staking material represent a major limitation (Musoni et al., Reference Musoni, Kayumba, Butare, Mukamuhirwa, Murwanashyaka, Mukankubana, Kelly, Ininda, Gahakwa, Vanlauwe, Van Asten and Blomme2014; Ruganzu et al., Reference Ruganzu, Mutware, Uwumukiza, Nabahungu, Nkurunziza, Cyamweshi, Vanlauwe, Van Asten and Blomme2014).
Throughout Africa a wide diversity of farms and farming strategies is found, even within villages (Giller et al., Reference Giller, Tittonell, Rufino, van Wijk, Zingore, Mapfumo, Adjei-Nsiah, Herrero, Chikowo, Corbeels, Rowe, Baijukya, Mwijage, Smith, Yeboah, van der Burg, Sanogo, Misiko, de Ridder, Karanja, Kaizzi, K'Ungu, Mwale, Nwaga, Pacini and Vanlauwe2011). Besides biophysical factors, socio-economic characteristics of farm households such as farm size, livestock ownership, education level and off-farm income, affect the adoption or rejection of technologies (Marenya and Barrett, Reference Marenya and Barrett2007). Categorisations of farms are frequently used to understand factors influencing technology adoption or define recommendation domains (Bidogeza et al., Reference Bidogeza, Berentsen, De Graaff and Oude Lansink2009; Tittonell et al., Reference Tittonell, Muriuki, Shepherd, Mugendi, Kaizzi, Okeyo, Verchot, Coe and Vanlauwe2010). The Government of Rwanda categorised all households according to a typology called ‘Ubudehe’ (translated as ‘local collective action’). The Ubudehe programme of the Ministry of Local Governments and the Rwandan Common Development Fund was launched in 2001 (Ansoms, Reference Ansoms2008). Ubudehe stratifies households into six categories according to their resource status, enabling poverty alleviation programs to target poor households. Ubudehe categories are based on similar principles across the country, but indicators and thresholds vary among Cells with a Cell comprising of several villages and their surroundings. In a meeting with all inhabitants, the Ubudehe committee classifies each household into one of the six categories according to resource endowment indicators specific to that Cell.
To identify the key aspects of the socio-ecological niche (Ojiem et al., Reference Ojiem, de Ridder, Vanlauwe and Giller2006) which favour adoption of climbing beans, and opportunities for enhancing their productivity, we studied the farming systems in the Northern Province of Northern Rwanda. We conducted a detailed farm survey to understand resource endowments of the Ubudehe household types. Moreover, we measured their yields of climbing beans to explore differences among farm types and examined the factors that determine yields of common beans in farmers’ fields. We measured the response of improved climbing bean varieties to P fertiliser across 110 smallholder farmers’ fields that were part of a dissemination campaign. All work was conducted within the framework of the N2Africa project (Giller et al., Reference Giller, Franke, Abaidoo, Baijukya, Bala, Boahen, Dashiell, Kantengwa, Sanginga, Sanginga, Simmons, Turner, de Wolf, Woomer, Vanlauwe, Vanlauwe, van Asten and Blomme2013). Recordings of farmer and household characteristics for each of these fields allowed us to explore the interactions between agronomic, soil fertility and socio-economic indicators that influenced climbing bean productivity and the response to fertiliser application. The implications of our findings for tailoring and scaling-out of technologies for climbing bean for the wide diversity of smallholder farmers are discussed.
MATERIALS AND METHODS
Detailed farm characterisations
Detailed farm characterisations were conducted in Gafuka Cell, Kinoni Sector, Burera District in the Northern Province of Rwanda (Reckling, Reference Reckling2011). The assignment of households according to the Ubudehe typology by the government in Gafuka Cell was used for stratified sampling of households for the detailed study. Household Types 1 and 6 households were excluded, as the poorest households are landless, while households falling in the richest category are extremely rare. Three households from each of the four remaining types were selected randomly from government administrative lists of the Gafuka Cell. Before the detailed farm characterisations were started, the Ubudehe typology was verified through a rapid survey in which key wealth indicators were assessed among farmers, giving confidence that the selected farmers indeed represented different wealth categories. The farm characterisations entailed a series of visits during the 2011A (Sep 2010 – Feb 2011) growing season to each of the selected households to describe the farm and their main operations and to assess biophysical and socio-economic variables related to crop production with particular focus on climbing beans.
Information was collected on household composition, cropping patterns, crop management, livestock ownership and the production and handling of animal and compost manure. The area of each field on the farm was measured using a geographical positioning system (GPS), or by hand when the field was too small for accurate GPS readings. Information on stake density and height was recorded on a representative 10 m2 area from all 27 climbing bean fields managed by the farmers interviewed. Farmers measured and recorded their fresh bean (green pods) harvest with weighing scales we provided for each field separately. At the end of the growing season, yields of mature grains from each field were weighed. The dry matter of climbing bean grain was determined by drying a sub-sample at 70°C in a forced air oven to constant weight. Green pods harvested during the season (only 4% of the total grain harvest) were assumed to contain 30% dry matter. We were successful in collecting robust yield data from 23 of the 27 fields. Soil samples were collected from each field during the growing season. Depending on the size and heterogeneity of the field, 10 to 15 subsamples were taken per field at 0–20 cm depth and combined to one composite sample of around 0.5 kg. Field heterogeneity was assessed qualitatively considering slope, soil type and stoniness. Soil samples were analysed from all fields that provided yield data.
Demonstration trial
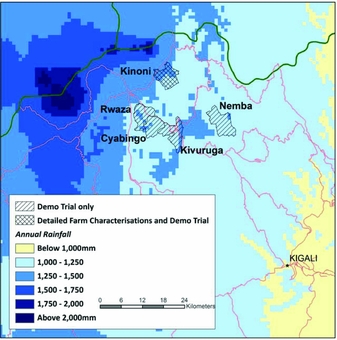
As part of the outreach program of the N2Africa project, a researcher-designed and farmer-implemented on farm demonstration trial (demo trial) was set up at 119 locations in the Sectors Kinoni (including Gafuka Cell) and Nemba of Burera District and in the Sectors Rwaza, Cyabingo and Kivuruga of Gakenke District in the Northern Province of Rwanda, in the 2012A season (Sep 2011 – Feb 2012) (Figure 1). The Sectors in Gakenke District bordered each other and were close to the main road to Kigali, while the two Sectors in Burera District were further apart and had no direct road connection with Kigali. Long-term average rainfall is similar across all these sectors (Figure 1): only Kinoni was slightly wetter. Actual rainfall data was obtained from Musanze weather station in Burera District (1.48°S; 29.61°E) during the 2012A growing season. GPS readings indicated that all trial sites were located between 1800 and 2200 m above sea level (data not shown).
Map showing sectors with climbing bean activities in northern Rwanda in relation to annual rainfall.

Farmers were selected through local farmer-based organisations to be involved in the demo trial, and we strived for participation of at least 50% women. Each farmer had a single replicate of the trial, referred to as a trial site. Trial sites were located on hillsides or plateaus. Swampy valley bottoms were avoided. Two treatments were compared at each site:
1. A new variety of climbing bean (Gasilida) without mineral fertiliser.
2. Climbing bean (variety Gasilida) with 70 kg ha−1 DAP (12.6 kg N ha−1, 14 kg P ha−1).
The rate of DAP applied was expected to alleviate P constraints in climbing bean. Gasilida is a relatively new variety in Rwanda and was most preferred among farmers in variety evaluations in the N2Africa project. Plot size of a single treatment was 6 by 6 m. Farmers received training in climbing bean crop management, but were free to decide on crop management other than fertiliser, such as plant spacing and timing of field operations. Many farmers applied farmyard manure across the trial site, which is common practice in the region. Our recommendation was to apply 10 t manure ha−1, though many farmers applied less.
A soil sample comprised of 10 sub-samples taken at a depth of 0–20 cm from each trial site before planting. For each site a field book jointly filled in by farmers and extension agents was used to record socio-economic characteristics of the farmer and household, field history and crop management in the trial, including the timing of the main crop operations (planting, organic manure and mineral fertiliser application, first and second weeding, harvest), manure and fertiliser application rates, plant spacing, and crop emergence, during the growing season. Farmers were requested not to harvest green beans from the trials before the crop had matured. Final grain harvest was determined by weighing the total fresh grain yield from each plot at harvest. Yield data were obtained from 114 of the original 119 sites. Sites without yield data were removed from further analyses. Yield data from four other sites were removed as well: three sites reported unrealistically high yields of more than 6 t ha−1, and one site a 10-fold yield increase (from 0.27 to 2.70 t ha−1) with DAP fertiliser and a recording error was suspected.
Soil analysis and data handling
Soil samples were air-dried and sieved to 2 mm and analysed for pH (H2O 2:1), total N, available P (Bray), organic C, cation exchange capacity (CEC), and exchangeable cations (K, Ca, Mg, Na) by Crop Nutrition Laboratory Services in Nairobi, Kenya using standard methods (Okalebo et al., Reference Okalebo, Githua and Woomer2002). Particle size distribution was analysed at the Tropical Soil Biology and Fertility Institute (TSBF-CIAT) in Nairobi (Okalebo et al., Reference Okalebo, Githua and Woomer2002). Livestock ownership was converted to Tropical Livestock Units (TLU) of 250 kg with cattle counting as 0.7, goats and sheep as 0.1, pigs as 0.2, and chicken as 0.01 TLU (Jahnke, Reference Jahnke1982). Climbing bean grain yield from the farm characterisations was adjusted to 12% moisture and stover yield to 0%. In the demo trials, grain yield is presented as fresh yield at harvest, with an estimated moisture concentration of 12–14%.
The effects of geographic region, soil parameters and agronomic and socio-economic characteristics on yield in both the farm characterisations and the demo trial were explored using Restricted Maximum Likelihood (REML), linear mixed model analyses. This approach is suitable to analyse unbalanced data (for instance the numbers of female and male farmers, the number of sites per region and the number of farmers per household class were unequal) and produce unbiased estimates of variance and covariance parameters. Several bean fields were monitoredon some farms in the detailed farm characterisations and therefore ‘farm’ was added as a factor to the random model. Since only three observations were obtained from both the ‘Very poor’ and the ‘Poor’ class we pooled data from the two poorer and the two wealthier classes. In the demo trial, ‘Sector’ was found to be confounded with gender, household class and soil characteristics and was included in the random model of the REML analysis of other variables, unless indicated otherwise in the results. First, the strength of factors such as region, household class and gender of the farmer in explaining yield variability were explored individually. Subsequently, a combined analysis of explanatory factors on yield and response to fertiliser was made. All yield observations were used and ‘Trial site’ nested within ‘Sector’ was added to the random model. Similar REML approaches were used to assess the impact of household class or gender on soil parameters and stake density and quality in both the farm characterisations and the demo trial. Relationships between yield in the control plot and yield response to DAP fertiliser and between staking density/height and yield were evaluated using Spearman's Rank Correlation. Soil parameters, except for pH, CEC, soil particle sizes and CN ratio, were log10 transformed prior to statistical analysis to homogenise variances. Timing of planting was expressed as the number of days after August 15, which was taken as the start of the growing season; timing of weeding and harvest were expressed as the number of days from planting. Genstat (Version 15.1.0) was used for all of the statistical analyses.
RESULTS
Description of the household types
The administrative list of the local government indicates that very few households belonged to the poorest landless Ubudehe class (Class 1), or to the richest class that derives most of their income off-farm (Class 6) (Table 1a). This justifies the exclusion of these categories from our study. The vast majority of households belonged to Class 2, 3 or 4 with almost half the households belonging to Class 3 (Poor). The general description of the different classes (Table 1a) matched our observations in the detailed farm characterisation (Table 1b). Landholdings were small with the most abundant ‘Poor’ households having access to 0.34 ha on average (Table 1b). The distribution of landholdings was strongly positively skewed with the few ‘Rich’ households owing much more land. Several households in the ‘Very poor’ and ‘Poor’ class owned a cow, often as a result of the ‘One farm, one cow’ government program, giving them a TLU ≥ 0.7 (Table 1b). Consequently, the distribution of livestock ownership was less skewed than landholding. The ‘Very poor’ households interviewed grew climbing beans and cereals exclusively for home consumption in the 2011A season (Table 1b). Wealthier farmers grew less staple crops, and more market-oriented crops such as potato, banana and vegetables. They also sold a larger proportion of the staple crops, whereas the ‘Very poor’ farmers sold no crop products (data not presented). Given the distribution of households over resource endowment classes (Table 1a), and the average farm size and allocation of crops per class (Table 1b), we estimated that 36% of the total arable land was cultivated with climbing bean in the 2011A season, highlighting the importance of climbing bean in this region.
(a) The Ubudehe household classes, and the distribution of all 1018 households in Gafuka Cell, Kinoni, Burera over the household classes provided by the local government. (b) Average farm size, livestock ownership, and allocation of land to crops for the different classes observed in the detailed farm characterisation with minimum and maximum values in parentheses.
* Other crops include banana, sweet potato and vegetables.
Yield and responses to fertiliser as affected by resource endowment and gender
Rainfall was evenly distributed over the season with no major dry spells (Figure 2) and stable maximum (19.8–26.7°C) and minimum (7.2–15.3°C) day temperatures. An average yield of 1.87 t climbing bean grain and 4.69 t residue biomass ha−1 was recorded in the farm characterisations. Yields varied greatly between fields: from 0.63 to 4.23 t ha−1 grain, and 2.91 and 6.89 t ha−1 of stover biomass. Poorer households had significantly smaller grain yields than richer households (Fpr = 0.039) (Table 2a). There was no significant effect of household class on stover yield.
Accumulated rainfall at Musanze weather station in the 2012A season and the main planting period and harvest period (dry beans) of climbing bean in the demo trial in northern Rwanda.
Climbing bean yields (a) observed in the detailed farm characterisation averaged by household class; (b) observed in the demo plots without and with DAP fertiliser as well as the response to DAP fertiliser, averaged by District and Sector, by household class, and by gender of the farmer (t ha−1).
In the demo trial, grain yield ranged from 0.14 to 6.9 t ha−1 with an overall average yield of 1.69 t ha−1: close to the average yield observed in the farm characterisations. Yield in the demo trial was strongly affected by the Sector where the trial was located (Fpr< 0.001), but not by District (Table 2b). Yields were relatively good in Kinoni and Rwaza Sectors and poor in Nemba and Cyabingo Sectors, although we found considerable variability in yield within Sectors and Districts. Poorer households have smaller average yields than wealthier households (Fpr = 0.032 and 0.012 for plots without and with fertiliser) (Table 2b; Figure 3a and 3d). ‘Rich’ households had much larger yields than farmers in the other resource classes, although this category contained only two farms. Gender had a weakly significant effect on yield: women farmers obtained on average 0.69 t ha−1 lower yields than males (Fpr = 0.029 and 0.060 for plots without and with fertiliser) (Table 2b; Figure 3b and 3e). Women farmers were not more frequently found in the poorly resource endowed household category than male farmers (Table 3). Differences in yield among resource classes and gender were large (Table 2b), but confounded by differences between Sectors. Households belonging to a poorer resource class and women farmers were more frequently located in Nemba and Cyabingo Sectors (data not shown) that had smaller average yields (Table 2b). Excluding ‘Sector’ from the Random model of the REML analysis of the impact of resource class and gender on yield resulted in much greater statistical significance (Fpr ≤ 0.003). Site average yields varied widely within household and gender classes (Figure 3a and 3b). In each class, roughly 30% of the sites had small yields (< 0.75 t ha−1) and roughly 10% had good yields (> 4.0 t ha−1) (Figure 3a and 3b). The differences between resource and gender classes were clearest with site average yields between 0.75 and 4.0 t ha−1.
Probability graphs of site average yield (average of bean yield without and with fertiliser) separated by (a) household class (excluding rich farmers which had only two observations), and (b) gender of the farmer, and (c) probability graph of grain yield response (difference between the plot without and with DAP fertiliser), and scatter graphs of yield in the control plot (manure only) and yield in the plot with manure and fertiliser separated by (d) household class and (e) gender.

Distribution of female and male farmers participating in the demo trial over household classes (%).
DAP fertiliser increased bean grain yields strongly: from 1.36 to 2.02 t ha−1 on average (Table 2b) (Fpr< 0.001). The response to fertiliser differed significantly affected among Sectors (Fpr = 0.022), and household resource classes (Fpr = 0.006) with poorer households having weaker responses, but not by gender of the farmer or by District (Table 2b). Response to DAP also varied strongly among sites (Figure 2c). In a few cases, yields were smaller with fertiliser than without.
Soil characteristics
In the demo trial, average soil characteristics observed in Burera and Gakenke Districts clearly differed (Fpr< 0.001 for all soil parameters), whereas differences between Sectors within Districts were small and not significant (Table 4). Soils in Burera were relatively fertile with more soil C, soil N and available P, and pH that were unlikely to limit bean productivity. Soils in Gakenke were less fertile on average with lower pH, C and N concentrations, a lower C/N ratio, less available P and less silt and clay than in Burera. Soil characteristics observed in the farm characterisations (Table 4) were comparable with those in the demo trial in Kinoni (Burera), with the exception of available P concentrations, which were larger in the demo trial.
Soil characteristics in the detailed farm characterisation and the demo trial averaged by district and sector.
The first latent vector of a Discriminant Analysis to distinguish Sectors based on soil characteristics from trial sites accounted for 95% of the variation and provided an almost perfect segregation of sites between the two Districts (Figure 4), even though District was not used as a dependent variable. C and N concentration had strong loadings in the first vector, indicating that these variables differed more consistently between the two Districts than, for example, silt and clay or available P. Available P was in fact negatively associated with the first vector, which is unexpected given that sites in Burera had large values on the first vector and large average soil available P concentrations, which suggests that available P was not useful in distinguishing sites from different Districts. The second vector accounted for only 4% of the variation and only partially distinguished sites from different Sectors within Districts.
Scatter plot of scores of trial sites on the 1st (x-axis) and 2nd (y-axis) vector of a Discriminant Analysis, as well as the eigen values, the percentage of variation accounted for, and the loadings of the vectors.

Several characteristics of the soils sampled during the farm characterisation were significantly related to household class with bean fields from wealthier households having soils higher in pH with greater available P, CEC and exchangeable Ca2+ and Mg2+ (Table 5). Exchangeable K+ levels were generally high and unrelated to household type (Table 5). In a first analysis of the soils from the demo trial which did not consider potential confounding of trial sites within Sector, soil C, N, available P and silt and clay concentrations increased progressively with resource endowment across the household classes (Table 5). The fields of wealthier households had higher pH, greater soil C, N, available P and silt and clay. In the demo trial, none of the soil parameters was significantly related to household class if confounding effects of Sector were accounted for. Thus, poorer households were more frequently located in Sectors with poorer soils. Female farmers in the demo trial had a significantly higher C/N ratio than male farmers, while other soil parameters did not differ between female and male farmers (Table 5).
Soil fertility characteristics in the detailed farm characterisation (Kinoni only) and the demo trial (average of sectors) as affected by household class and gender, and the significance of the differences between classes.
* Compensated for confounding effects of Sector in the demo trial.
† Not compensated for confounding effects of Sector.
Impact of soil and crop management characteristics on yield and response to fertiliser
In the farm characterisations, exchangeable Mg2+ and CEC were significantly positively associated with grain yield (Fpr = 0.009 for Mg2+ and 0.044 for CEC), whereas none of the other soil parameters, nor organic input rates were. Staking density and height were strongly associated with both grain (Fpr < 0.001 for density and Fpr = 0.005 for height) and stover yield (Fpr = 0.010 and 0.016) (Figure 5), as also indicated by the relatively strong correlation coefficients, given these data were collected in highly variable farmers’ fields. Wealthier households used more stakes per unit area than poorer households (Fpr = 0.044) (Figure 5), but staking height did not differ significantly with household class.
Scatter graph of stake density (left) and stake height (right) and climbing bean yield for the two poorest and the two wealthiest household classes as observed in the detailed farm characterisation. ‘r’ represents Pearsons correlation coefficient.
In the demo trial, differences in yield among Sectors (Table 2b) poorly reflected differences in soil fertility (Table 4). Some Sectors with good average soil characteristics (e.g. Nemba) reported relatively poor yields and vice versa (e.g. Rwaza). It is therefore unsurprising that none of the soil parameters contributed significantly to explain yield variability. Among the agronomic factors (planting density, emergence rate, planting date, timing of first weeding, organic manure applications), only organic manure application rate was significantly positively associated with yield (Fpr = 0.022). Sites that received more organic inputs tended to give larger bean yields. Almost all farmers (96%) applied the same amount of organic manure to both plots, while the amount applied varied massively from < 300 kg ha−1 to 67 t ha−1. A separate analysis for plots without and with fertiliser indicated that the application rate of organic inputs was highly significantly associated with yield in plots without fertiliser (Fpr < 0.001), but not in plots with fertiliser, which suggests that the additional N and/or P supplied through organic inputs improved yield in plots without fertiliser. Gender of the farmer or household class were not related to the rate of organic manure application. Stake number or length was not measured in the demo trial.
The response to fertiliser was not significantly influenced by any of the soil or agronomic characteristics. Bean yield in the control plot however was positively correlated with yield response (tpr < 0.001). A similar pattern was observed at Sector level with the largest average response to fertiliser observed in Kinoni where control yields were largest and smallest in Cyabingo where control yields were small (Table 2b). Strong responses to DAP fertiliser (a yield increase of more than 1.2 t ha−1) were seen where soil available P was more limiting (in most cases less than 10 mg kg−1), likely because bean yield in control plots were limited by P shortages (Figure 6a). No relationship between soil N and response to DAP fertiliser was observed (Figure 6b), which suggests that available N was not limiting bean yield. At many sites, yield was not or only slightly improved by fertiliser application, despite small soil N or P concentrations observed at these sites (Figure 5a and 5b). In these cases, factors other than N and P availability presumably overrode any benefit from DAP. So two, contrasting tendencies could be observed in the responses. The strongest responses to DAP were observed in fields with small soil available P concentrations, whereas larger responses were generally observed in fields with good control yields.
Response of climbing bean grain yield to the application of DAP fertiliser as a function of (a) plant available P and (b) soil N in the demo trials.
DISCUSSION
Resource endowment and gender explain yields of climbing beans and their response to fertiliser
The combination of two complementary approaches: farming systems analysis and multi-locational on-farm trials gave good insights into the factors affecting both current production of climbing beans and the opportunities for sustainable intensification. Given the strong co-variation among variables that indicate resource endowments and the influence of resource endowment, both in terms of current availability and in terms of past management, it is difficult to unravel the precise role of different factors. Household resource endowment and gender of the farmer played a key role in determining the grain yield of climbing beans. Both the farm characterisations and the demo trial provided evidence that poorer households farmed on poorer soils (Table 5), as observed elsewhere in SSA (Franke et al., Reference Franke, van den Brand and Giller2014; Tittonell et al., Reference Tittonell, Vanlauwe, Leffelaar, Rowe and Giller2005). The differences among household classes in pH, CEC, exchangeable Ca2+ and Mg2+ in the farm characterisations, and in total C and N and available P in the demo trial were most probably caused by differences in crop management in the past, especially the past use of organic manures and mineral fertiliser. In addition, the greater silt and clay content of fields belonging to wealthier households in the demo trial (Table 5) suggests they were located on soils with better inherent fertility. In the demo trial, these differences in soil fertility between household classes were confounded by geographic location, but similar patterns were observed in the farm characterisations in which geographic confounding was not an issue. We return to this issue below.
Women play an important role in farming in Rwanda: they are more frequently engaged in farm activities, and control a larger part of the land and harvest than men (Franke and de Wolf, Reference Franke and de Wolf2011). Yet, in the demo trial women farmers achieved poorer yields than men in both treatments with and without fertiliser (Table 3, Figure 3). We found no evidence that female farmers belonged more frequently to poorer households (Table 3). This suggests that the poorer yields achieved by female farmers were related to differences in access to resources within the household. The only soil characteristic that clearly differed was the higher C:N ratio of the soil from fields of female farmers in the demo trial which could indicate less use of organic inputs in the past. Interviews with the farmers indicated that women farmers primarily rely on compost as organic manure, while male farmers own most of the animals and have access to animal manure richer in N. There was no significant relationship between soil C:N ratio, nor in fact any other soil characteristic measured, and bean yield. Other possible explanations for the poorer yields on the fields of female farmers include: (i) women usually do not own tree plantations and therefore may use poorer quality stakes in climbing bean; (ii) women may face more labour constraints due to their other responsibilities (e.g. fetching water and firewood, household chores) and (iii) women were more likely to pick green immature pods from the demo trial before final harvest to feed the family.
Poorer households in the farm characterisations used fewer stakes per unit area and stakes of poorer quality, which in turn was associated with smaller yield (Figure 5). Poor households prefer sticks made of Napier grass (Pennisetum purpureum) due to their low costs, while richer households prefer Eucalyptus and other wooden stakes for their durability (Klapwijk, Reference Klapwijk2011). Cutting stakes from trees; however, may entail environmental costs. Access to good quality staking materials (number of stakes, height and durability) is a major challenge limiting productivity and the wider adoption of climbing beans (Musoni et al., Reference Musoni, Kayumba, Butare, Mukamuhirwa, Murwanashyaka, Mukankubana, Kelly, Ininda, Gahakwa, Vanlauwe, Van Asten and Blomme2014; Reckling, Reference Reckling2011).
A relatively small amount of DAP fertiliser (70 kg DAP ha−1 containing 12.6 kg N and 14 kg P ha−1) in the demo trial provided a high average yield response of 0.66 t ha−1. Although other P fertilisers that do not contain N may be preferable as basal application to legumes such as common bean, DAP was the only option available in Rwanda. Organic manure also increased yields, at least in plots without fertiliser applications, and may be seen as a substitute for mineral fertiliser. Assuming that DAP fertiliser input cost 102 US$ ha−1, labour and opportunity costs of fertiliser application were 20 US$ ha−1 and bean grain fetches US$ 0.47 kg−1, a response of 0.52 t ha−1 is required to achieve a value to cost ratio of 2, which is often considered the threshold to make an investment economically attractive. While the observed average response to DAP was above this threshold of 0.52 t ha−1, it was not achieved by roughly half of the farmers (Figure 2c). Thus approaches are needed to predict the likelihood of substantial crop response to reduce the economic risk of using fertiliser. None of the measured soil or crop management parameters were significantly related to the response to DAP fertiliser. While the strongest responses to fertiliser were observed on soils with low available P concentrations, this was not consistent (Figure 5a). The only two measured variables for which we could find a statistically significant relationship with response to fertiliser were household class and yield in the control plot. This suggests that wealthier households and well-managed fields had a stronger chance of achieving an economically worthwhile response to DAP fertiliser application in bean. The poor responses to fertiliser in fields with very poor control yields suggest the existence of what have been termed poorly or non-responsive soils where a range of factors limit yield (Tittonell and Giller, Reference Tittonell and Giller2013). Among the 40 sites with a poor yield in the control plot (< 600 kg grain ha−1), 23 sites (21% of all sites) had a poor response to DAP fertiliser application (< 300 kg ha−1) and could be considered non-responsive in our trial. Among the ‘Very Poor’, ‘Poor’, ‘Well-off’ and ‘Rich’ households, 25%, 24%, 17% and 0% of the sites, respectively, could be classified as non-responsive.
Reflections on the methods used
Working within a large ‘development to research’ project such as N2Africa (Giller et al., Reference Giller, Franke, Abaidoo, Baijukya, Bala, Boahen, Dashiell, Kantengwa, Sanginga, Sanginga, Simmons, Turner, de Wolf, Woomer, Vanlauwe, Vanlauwe, van Asten and Blomme2013) facilitated the collection of data on climbing bean across a wide heterogeneity of farmers’ biophysical conditions and crop management practices, which in turn reflect differences in socio-economic conditions in northern Rwanda. It allowed us to assess the large variability in yield and responses to a technology, under conditions more representative of farmers’ conditions than trials replicated at only a few sites. It thus provided important information on which proportion and which type of farmers and households could benefit from an innovation and the potential risks associated with adoption. Yet this mode of working also imposes constraints on experimental designs and sampling strategies.
First, it was only possible to compare a small number of treatments, given that trial implementation and data collection were primarily in the hands of the farmers and rural development agents. Second, researchers had limited control over the selection of participating farmers and sites. Ideally, a stratified random selection approach of farmers would have been followed, in our case with the key factors Sector, socio-economic class of the household, and gender of the farmer as strata. The farm characterisations provided detailed data from a few farms at a single site and backed up some of the findings from the demo trial and represented actual farmers’ practices. Apart from the responses to fertiliser application, a great deal of the observations in the demo trial could have been made through observations in farmers’ fields as done in the detailed farm characterisation as well, but would require a larger number of farms to be assessed.
In the demo trial, the differences among household classes, soil properties, common bean yield and response to fertiliser were confounded by geographic location. In the field, the N2Africa project works through international and local NGOs, Government extension services and farmer associations. The selection of farmer associations and farmers interested and willing to host the demo trials was made together with the local partners. As it was not possible to impose a fully random or stratified sampling approach, it is hard to disentangle the impact from Sector or from gender and resource endowment on common bean yields and other variables. Were the low yields reported in some Sectors related to the high share of poorer households and women farmers in the sample, or to factors unrelated to resource endowment and gender? The key development partner ‘Abumutimawurugo’ in Cyabingo Sector was a women's cooperative that specifically supports disadvantaged female households which partly explains the strong confounding effect of Sector in the analysis. Nevertheless, the effects of gender and household class on yield were also significant in the demo trial when confounding effects of Sector were accounted for in the analysis. Further, using a case study approach through the farm characterisations, we also found that household class affected bean yield. Household resource endowment and gender were likely proxies that represent a host of agronomic and crop management factors that determine crop productivity, such as soil fertility, current and past access to organic manure and mineral fertiliser, access to sufficient quality staking material, ability to conduct crop management operations on time, etc. While we found evidence of such relationships for only some of these factors, the large heterogeneity in biophysical conditions and crop management practices within household and gender classes, confounding factors, probably masked other relationships.
Implications for scaling out
For the sake of targeting agricultural innovations to those households that are most likely to adopt, the Ubudehe household typology could be a useful and readily available tool to structure rural households within areas in Rwanda that are relatively uniform in agro-ecology. Other household typologies that include additional criteria than resource endowment (Ansoms and McKay, Reference Ansoms and McKay2010; Bidogeza et al., Reference Bidogeza, Berentsen, De Graaff and Oude Lansink2009; Tittonell et al., Reference Tittonell, Muriuki, Shepherd, Mugendi, Kaizzi, Okeyo, Verchot, Coe and Vanlauwe2010) may lead to a typology that is more useful for targeting, but require additional data collection. It is striking that the Ubudehe household class served as a better indicator of yield and response to fertiliser in the demo trial than many soil and crop management characteristics. The wealthier households have better yields in general and achieved stronger response to fertiliser. In addition, wealthier ‘well-off’ and ‘rich’ households were more market-oriented and more likely to afford investments in fertiliser than poorer households. However, also among wealthier households we found sites giving a poor response to fertiliser, presumably because of poorly fertile (non-responsive) soils or highly fertile soils that provided sufficient P to the crop. This suggests that the targeting of fertilisers may be substantially improved if soil fertility status, for instance as indicated by yields in the past or by soil fertility parameters, can also be taken into account.
If fertiliser for common bean would be primarily targeted to the ‘well-off’ and ‘rich’ farmers, who comprise 34% of the rural households in Gafuka Cell (Table 1a), an obvious question is: what can be offered to support the other 66% of households? Innovations that reduce staking costs or improve staking quality, such as the use of plastic or Sisal strings, could substantially help to lower costs of production and increase bean productivity, also for the poorer households (Musoni et al., Reference Musoni, Kayumba, Butare, Mukamuhirwa, Murwanashyaka, Mukankubana, Kelly, Ininda, Gahakwa, Vanlauwe, Van Asten and Blomme2014). It is well known that resource poor households are in a weak position to adopt new technologies and tend to make only marginal changes in their farming practices, and transforming their farming practices requires knowledge intensive research and extension approaches taking the local context into account (Kristjanson et al., Reference Kristjanson, Neufeldt, Gassner, Mango, Kyazze, Desta, Sayula, Thiede, Forch, Thornton and Coe2012). Rwanda's rural sector policies have been criticised as too oriented to economic growth with little attention for pro-poor strategies leading to a growing inequality and the poor being by-passed (Ansoms, Reference Ansoms2008). Our results underpin the need for research and extension to pay special attention to the needs of women farmers (Manfre et al., Reference Manfre, Rubin, Allen, Summerfield, Colverson and Akeredolu2013). Women-headed households are in many respects in a disadvantaged position to adopt innovations (FAO, 2011). In our study, women achieved smaller average yields than men irrespective of the resource endowment of the household or the gender of the household head, suggesting that targeting women-headed households alone will not close the gender gap. The very small landholdings among the poor rural households observed in this study (Table 1b) and Rwanda as a whole (NIS, 2010) point towards land shortage as a binding constraint to achieving food self-sufficiency or poverty alleviation. While increases in crop production are important to improve food self-sufficiency and relieve drudgery, access to other sources of income off-farm will be indispensable for many households to escape poverty (Harris and Orr, Reference Harris and Orr2014).
Acknowledgement
We thank the Bill & Melinda Gates Foundation for partnering in this research through a grant to Wageningen University to support the project N2Africa: Putting Nitrogen Fixation to Work for Smallholder Farmers in Africa (www.N2Africa.org). We thank Andrew Farrow at GeAgrofía for Figure 1. Moritz Reckling thanks the Deutsche Gesellschaft für Internationale Zusammenarbeit (GIZ) for a scholarship.


 Open access