

Key messages
Chapter 2.5 sets out how long-term care (LTC) is provided and how it is paid for. LTC refers to a broad package of personal, social and medical services provided over extended periods of time which may be delivered by care professionals or by informal care givers. Key learning includes that:
Population ageing, particularly in advanced economies, creates growing demands for LTC.
There are inequities in the need for and access to LTC. Older people, women, those with lower incomes and lower levels of education are all more likely to need care, but less likely to have access to it.
Funding arrangements for LTC are problematic in many countries:
○ voluntary insurance and out-of-pocket (OOP) payments commonly fill public coverage gaps but create inequities;
○ asset-tests for eligibility for publicly funded care are essentially regressive wealth taxes due to the unequal distribution of LTC needs;
○ encouraging for-profit provision theoretically fosters competition, availability and responsiveness but the pressures to generate profits can jeopardize quality and safety.
Countries face urgent pressures on LTC and could usefully consider:
○ increasing public expenditure and broadening the funding mix for LTC;
○ better, fairer pooling of resources across generations;
○ revenue sources independent of payroll contributions since labour markets as a revenue base will shrink at the same time that demand for ageing-related LTC increases;
○ better data and indicators to assess access, quality and value for money;
Introduction
In virtually all countries around the globe, and especially in advanced economies, populations are ageing rapidly due to declining fertility and increasing longevity. In 2018, for the first time ever, the worldwide population aged 65 years and older surpassed children under 5 years old (United Nations, 2019). Longer overall life expectancies are a remarkable achievement. Yet, globally, between 2000 and 2019, life expectancy increased faster than healthy life expectancy (a measure of whether years of life are spent in good health) for both men and women (WHO, 2020). According to Eurostat, on average across the 27 Member States of the EU, people aged 65 years old can expect to live another 20 years, but only 10 of those years will be spent in good health. Older people living with disability and in ill health may eventually struggle with everyday activities, from getting dressed, to shopping or going for a walk, and may at some point require a range of personal care and assistance services that is commonly referred to as LTC.
At the same time that population ageing is likely to lead to greater demands for health and LTC, ageing will also introduce stress on the financing and availability of care. The old-age dependency ratio – the number of people aged 65 years old or older as a percentage of the number of people aged 20 to 64 years old – is projected to jump from 30% in 2015 to more than 50% in 2050 on average across Organisation for Economic Co-operation and Development (OECD) countries (OECD and KIPF, Reference Kim and Dougherty2020). This will create unprecedented pressures on economies, societies and governments. In order to maintain current public debt-to-gross domestic product (GDP) ratios, tax revenue would need to increase by between 4.5 and 11.5 percentage points of GDP by 2060 in G20 countries just to counteract the impact of ageing (Rouzet et al., Reference Rouzet2019).
Economies and societies are also changing in other ways, potentially further hindering the financing and provision of LTC. Social structures are changing, with childless couples, single-parent families, divorce and single-adult households all on the rise. These trends could lead to fewer people being able, or willing, to care for their older relatives. On the other hand, networks of loosely connected family members from different marriages, partnerships and generations may emerge, with fresh approaches to cohesion and solidarity. The nature of work is also evolving, with non-standard forms of employment on the increase, from self-employment to temporary contracts (OECD, Reference Kim and Dougherty2020a). Along with small but rising numbers of people in new forms of employment such as platform and casual work, these workers have less access to social protection and make fewer contributions over their careers. It is possible that medical progress and technological innovation, such as in remote monitoring and assisted living, will help alleviate the strains on families caring for older relatives and friends (OECD, Reference Kim and Dougherty2020c), but that remains to be seen.
Against this challenging backdrop, we provide an overview of how LTC is defined, how it is provided, who pays for it and how, and, finally, how we might assess its performance, in terms of quality, access and value for money. Throughout the chapter, we provide examples of international approaches to designing and delivering LTC in old age, illustrating broad heterogeneity across countries and even regions. We conclude with priorities for research and policy. Although people of any age can become dependent on others through illness or disability, this chapter focuses on people who are aged 65 years or older.
In this chapter, we focus on what is commonly referred to as social LTC, as other parts of this book deal in greater detail with health care. It is the fact that LTC has a social component that makes it quite distinct from other types of health care. For example, as discussed in more detail below and in Chapter 3.6, in many countries LTC is not solely the responsibility of the Ministry of Health (often responsibilities are shared with the Ministry of Social Affairs), and many LTC services are not provided by licensed medical staff but by personal carers and families. Moreover, unlike with medical care, where most OECD countries have near-universal coverage, eligibility for LTC is contingent on onerous needs assessments (including multiple administrative procedures), and OOP costs are often tied to care recipients’, and sometimes their relatives’, income and wealth.
What is LTC?
LTC includes personal care, assistance service and social activities as an individual ages and becomes more dependent on others. As individuals grow older, their health deteriorates and they are more likely to need help from other people to carry out the activities that make up their daily lives, and which most of us take for granted. These activities include bathing and getting dressed as well as housekeeping tasks, like cleaning and shopping. As older people become more dependent, they may also find it difficult to maintain social relationships and participate in their community; for example, attending a community club or going out to meet friends. Finally, people who are dependent on others often need ongoing medical care to manage, commonly multiple, chronic conditions and ensure that they remain as healthy as they can be.
In this chapter, our definition of LTC encompasses personal care, assistance services and social activities, for periods of over six months or until end of life. Personal care services seek to provide support for activities of daily living (ADLs) including eating, bathing, washing, dressing, getting in and out of bed, and getting to and from the toilet and managing incontinence. Assistance services look to help individuals with instrumental activities of daily living (IADLs), such as shopping, laundry, vacuuming, cooking and performing housework, managing finances and using the telephone, among others. To prevent social isolation and further deterioration of physical and mental health, social care services may promote community activities whose primary purpose is social and leisure. This definition is slightly different from the definition of LTC in the System of Health Accounts (SHA) (and the definition used in Chapter 3.6), as it excludes nursing/medical care and furthermore restricts the target population to those aged 65 years old or older (OECD, Eurostat & WHO, Reference Eurostat2017). Rehabilitation services are typically considered medical/nursing care and are thus not discussed here.
How is LTC provided?
LTC is provided in a variety of ways across countries and subnational areas. Differences in how LTC is organized and delivered stem in large part from social norms regarding whose responsibility it is to care for older populations who become dependent on others. In some countries and regions, the responsibility falls first on spouses and children, with states acting as a safety net only for the most vulnerable groups, while in others LTC is considered a collective responsibility, with governments typically taking a leading role (Colombo, et al., Reference Colombo2011). Very generally, LTC can be provided: by formal and informal carers; in different settings, including the care recipient’s home and outside it; by public and private providers; and in kind (i.e. services) and in cash.
Who provides LTC?
Formal carers
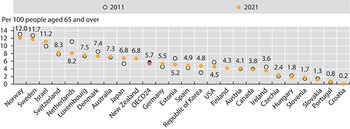
Formal LTC workers are paid staff – typically nurses and personal carers – who provide care and/or assistance to people limited in their daily activities at home or in institutions, excluding hospitals (OECD, Reference Kim and Dougherty2020c). In 2016, on average there were five LTC workers per 100 people aged 65 years and over in 28 OECD countries, ranging from 13 workers in Norway to less than one per 100 older people in Greece, Poland, and Portugal (see Fig. 2.5.1). On average, across OECD countries, over 70% of formal LTC workers are personal care workers. Personal care workers include formal workers providing LTC services at home or in institutions (other than hospitals) who are not qualified or certified as nurses. Personal care workers provide routine personal care, such as bathing, to older, convalescent or disabled persons. Most workers have obtained a high school diploma or attended vocational schools, but 16% have lower education. LTC workers generally have lower qualifications than health workers do.
On average, OECD countries have five formal LTC workers per 100 people aged 65 years and over
OECD: Organisation for Economic Co-operation and Development.
Note: For New Zealand, latest data refer to 2018.

Figure 2.5.1 Long description
The y-axis notes the number of L T C workers per 100 people aged 65 and over, while the x-axis lists the countries. The values are as follows. Norway: 12.0. Sweden: 11.7. Israel: 11.2. Switzerland: 8.3. Netherlands: 8.3. Luxembourg: 7.5. Denmark: 7.4. Australia: 7.3. Japan: 6.8. New Zealand: 6.8. O E C D 24: 5.7. Germany: 5.5. Estonia: 5.2. Spain: 4.9. Korea: 4.8. United States: 4.5. Finland: 4.3. Austria: 4.1. Canada: 3.8. Ireland: 3.8. Czechia: 2.4. Hungary: 1.8. Slovenia: 1.7. Slovakia: 1.3. Portugal: 0.8. Croatia: 0.2.
Working conditions in this sector tend to be poor, which disproportionately affects women since, on average across the OECD, women hold about 90% of the jobs in the LTC sector. Almost half of LTC workers in the OECD (over half in northern and central European countries) work part time and over a fifth of declared formal carers, on average across the OECD, are foreign-born (OECD, Reference Kim and Dougherty2020c). In addition, half of LTC workers experience shiftwork and almost one quarter are on temporary contracts. While the work tends to be demanding, both physically and mentally, pay is often low (Rapp, Ronchetti & Sicsic, Reference Rapp and Ronchetti2021).
Informal carers
The definition of an informal carer is not straightforward. The two cornerstones of the definition are usually that: (i) an informal carer is a family member, close relative, friend or neighbour; and (ii) carers are non-professionals who did not receive qualifying training to provide care (even though they may undertake special training). Definitions tend to exclude paid non-professional carers providing care in private households, such as undeclared carers working in the “grey economy”. The extensive use of live-in, and to some extent live-out, migrant care workers, whose status lies between the two distinct categories of formal and informal carers, can make the line blurry between formal and informal caregiving.
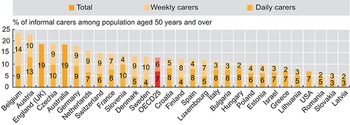
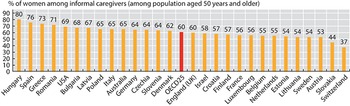
Many older people who struggle with everyday activities may either prefer, or have no choice but, to find informal support in their partners, children, friends and neighbours. Informal carers are people providing any help to older family members, friends and people in their social network, living inside or outside their household, who require help with everyday tasks. These informal carers are generally the first line of support for older people, and in some countries, informal care is the most prevalent form of support (Colombo, et al., Reference Colombo2011). An average of 14% of individuals aged 50 years old and older in 18 OECD countries report providing informal care at least weekly (OECD, Reference Kim and Dougherty2020c) (Fig. 2.5.2). As with informal LTC, women make up the majority of informal caregivers (Fig. 2.5.3).
Across 18 OECD countries, more than 1 in 10 people aged 50 years and older report providing informal care at least weekly
ELSA: English Longitudinal Study of Ageing; HRS Health and Retirement Study; OECD: Organisation for Economic Co-operation and Development; SDAC: Survey of Disability, Ageing and Carers; SHARE: Survey of Health, Ageing and Retirement in Europe.
Note: The definition of informal carers differs between surveys. Data are for 2019 (or nearest year).

Figure 2.5.2 Long description
The y-axis lists the percentage among the population aged 50 years and over reporting carers from 0 to 25, and the x-axis lists the countries. Each bar has 2 stacks, for the number of daily carers and weekly carers, respectively. The values are as follows. Belgium: 9; 14. Austria: 13; 10. England (U K): 19 (total). Czechia Republic: 10; 9. Australia: 19 (total). Germany: 9; 9. Netherlands: 7; 9. Switzerland: 6; 9. France: 8; 7. Slovenia: 10; 4. Denmark: 5; 9. Sweden: 4; 10. O E C D 25: 7; 6. Croatia: 8; 5. Finland: 4; 8. Spain: 8; 4. Luxembourg: 5; 7. Italy: 8; 3. Bulgaria: 8; 3. Hungary: 8; 2. Poland: 6; 4. Estonia: 6; 4. Israel: 7; 3. Greece: 7; 2. Lithuania: 5; 3. United States: 7 (total). Romania: 5; 2. Slovakia Republic: 3; 3. Latvia: 3; 2.
Women are most likely to take on the role of informal carer
ELSA: English Longitudinal Study of Ageing; HRS Health and Retirement Study; OECD: Organisation for Economic Co-operation and Development; SDAC: Survey of Disability, Ageing and Carers; SHARE: Survey of Health, Ageing and Retirement in Europe.
Note: The definition of informal carers differs between surveys. Data are for 2019 (or nearest year).

Figure 2.5.3 Long description
The y-axis lists the percentage of women from 0 to 90, and the x-axis lists the countries. The values are as follows. Hungary: 80. Spain: 76. Greece: 73. Romania: 71. United States: 69. Bulgaria: 68. Latvia: 67. Poland: 65. Italy: 65. Australia: 65. Germany: 64. Czechia Republic: 64. Slovenia: 64. Denmark: 62. O E C D 25:60. England (U K): 60. Israel: 58. Croatia:57. Finland: 57. France: 56. Luxembourg: 56. Belgium: 55. Netherlands: 55. Estonia: 54. Lithuania: 54. Sweden: 54. Austria: 53. Slovakia Republic: 44. Switzerland: 37.
Formal versus informal care
Formal and informal care can either substitute for or complement each other, depending on the country and availability of various forms of formal care. Findings from the USA suggest that increased paid home care primarily went to people who were already receiving a greater amount of informal care from their adult children (Liu, Manton & Aragon, Reference Liu, Manton and Aragon2000; Langa et al., Reference Langa2001). In Europe, informal care tends to be a substitute for formal home care and paid domestic help, and informal care is more prevalent in countries where formal care is not as well developed or comprehensive (Van Houtven & Norton, Reference Van Houtven and Norton2004; Bonsang, Reference Bonsang2009; Bolin, Lindgren & Lundborg, Reference Bolin, Lindgren and Lundborg2008). While typically unrecognized and uncompensated, informal care is not without costs. Families and friends that provide support to dependent older individuals may suffer physical and mental stress, and are more likely to drop out of the labour market or reduce working hours. Income levels of working-age family carers are also likely to decline as a result of providing care.
Where is LTC provided?
The provision of LTC occurs in diverse settings and at different levels of intensity. Broadly, LTC can be home-based, facility-based or community-based. Settings include the older person’s own home, the home of relatives, friends or other individuals (e.g. a foster home), assisted living facilities, institutions and nursing homes, as well as community and day care centres. Services vary from alarm systems to constant personal care 24 hours per day seven days per week, depending on the older person’s specific needs and limitations. Different locations are considered better suited for different needs, limitations and preferences, with intensity and composition of care playing a key role in determining which location is better suited (OECD, Eurostat & WHO, Reference Eurostat2017).
In most countries, LTC for older people with less severe limitations will first be provided in their own home. If and when independent living in the home environment is no longer possible, older people may move into assisted living facilities where LTC workers are available onsite or on-call. If the older person becomes more dependent, they may be moved to an institution with permanent LTC staff providing predominantly nursing care or help with ADLs. Institutions that provide round-the-clock care may also have day care wards, where older people who are not staying in the institution can spend the day, thus providing respite for informal carers or formal home care workers.
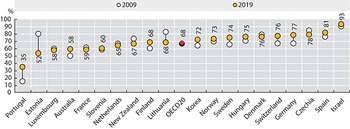
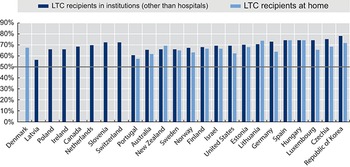
In recent years, in response to both limited budgets and population preferences, many countries have started supporting the idea of a “deinstitutionalization” of LTC: promoting home- and community-based care rather than institutional care. Besides enhancing home-based services, these countries have promoted the use of community-based facilities such as hospices for terminally ill people, day-care centres and homes for the disabled. More than half of OECD countries have started to move LTC out of residential facilities, and towards the community (OECD, Reference Kim and Dougherty2020c). Between 2007 and 2017, the percentage of LTC recipients who received care at home increased 4 percentage points, from 64% to 68% (OECD, 2019) (Fig. 2.5.4).
A majority of OECD countries are moving LTC from residential facilities into the community
OECD: Organisation for Economic Co-operation and Development.

Figure 2.5.4 Long description
The y-axis lists the percentage, while the x-axis lists the countries. The 2019 values are as follows. Portugal: 35. Estonia: 52. Luxembourg: 58. Australia: 58. France: 59. Slovenia: 60. Netherlands: 65. New Zealand: 67. Finland: 68. Lithuania: 68. O E C D 20: 68. Korea: 72. Norway: 73. Sweden: 74. Hungary: 75. Denmark: 76. Switzerland: 76. Germany: 77. Czechia: 78. Spain: 81. Israel: 93. All countries except Estonia, France, Netherlands, New Zealand, Denmark, and Czechia show an increase from 2009.
Public versus private provision
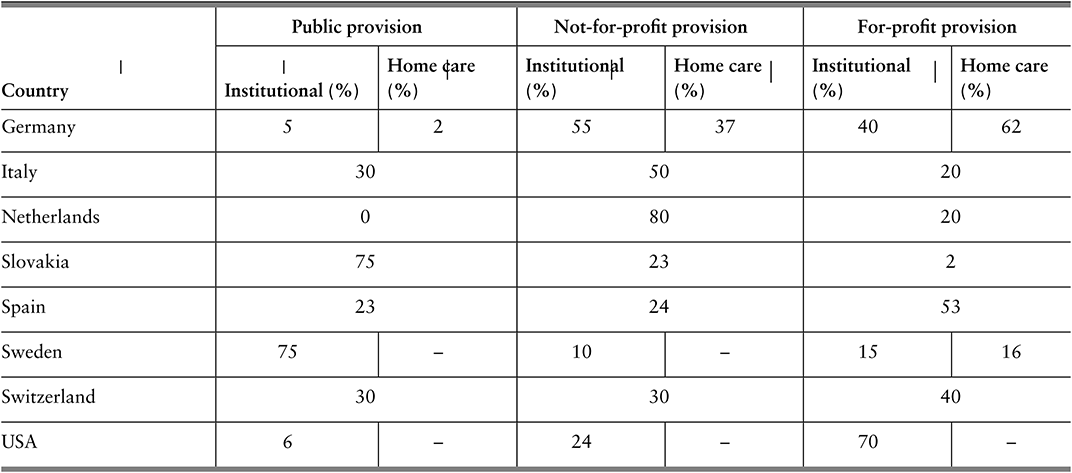
LTC can be provided by public (be it national or subnational governments), not-for-profit (volunteers and organizations managed or owned by religious or civil society groups) or for-profit (privately owned) providers (Colombo, et al., Reference Colombo2011). Virtually all European countries allow voluntary and private provision of LTC (see the comparative tables from the Mutual Information System on Social Protection, www.missoc.org/missoc-database/comparative-tables/), but they differ widely in how they do so. Most commonly, a form of purchaser-provider split is used, so that governments continue to fund LTC services but provision is devolved to voluntary or private providers in some form of managed market or quasi-market (Fine & Davidson, Reference Fine and Davidson2018). The private sector may also be involved in financing LTC, through insurance (see the How is LTC financed section).
The data on public, not-for-profit and for-profit provision of LTC are sparse and outdated, but estimates for Europe and North America suggest there is significant heterogeneity across countries and settings (Table 2.5.1). For-profit provision is highest in England and the USA, followed by Brussels and Germany. Non-profit provision is highest in the Netherlands and for home care in Austria.
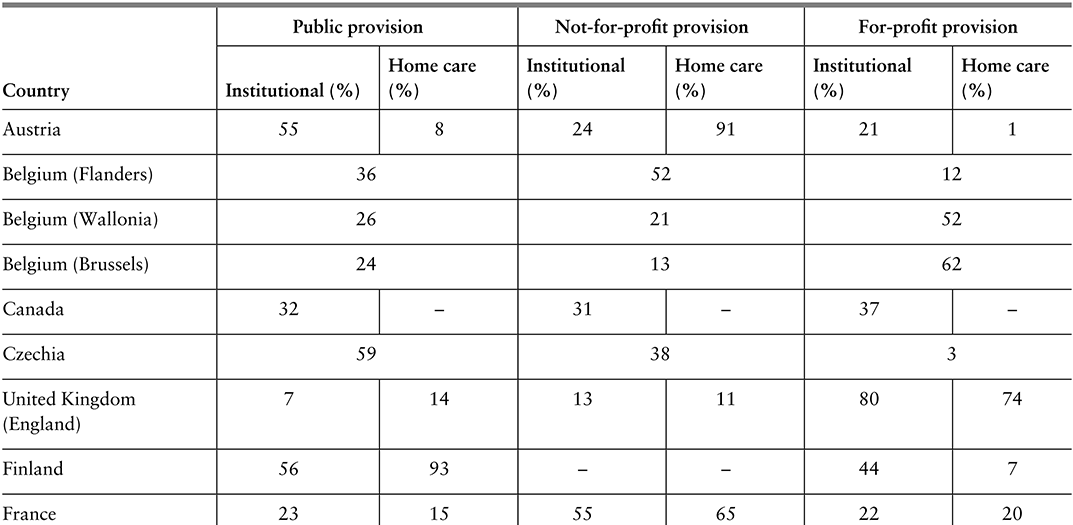
Table 2.5.1a Long description
The table has 4 main columns (and multiple subcolumns): Country, Public provision, Not-for-profit provision, and For-profit provision (the last three are further divided into Institutional (percentage) and Homecare(percentage)). It reads as follows. Austria: Public provision: 55; 8. Not-for-profit provision: 24; 91. For-profit provision: 21; 1. Belgium (Flanders): Public provision: 36. Not-for-profit provision: 52. For-profit provision: 12. Belgium (Wallonia): Public provision: 26. Not-for-profit provision: 21. For-profit provision: 52. Belgium (Brussels): Public provision: 24. Not-for-profit provision: 13. For-profit provision: 62. Canada: Public provision: 32; blank. Not-for-profit provision: 31; blank. For-profit provision: 37; blank. Czechia: Public provision: 59. Not-for-profit provision: 38. For-profit provision: 3. United Kingdom (England): Public provision: 7; 14. Not-for-profit provision: 13; 11. For-profit provision: 80; 74.

Table 2.5.1b Long description
The table has 4 main columns (and multiple subcolumns): Country, Public provision, Not-for-profit provision, and For-profit provision (the last three are further divided into Institutional (percentage) and Homecare(percentage)). It reads as follows. Finland: Public provision: 56; 93. Not-for-profit provision: blank; blank. For-profit provision: 44; 7. France: Public provision: 23; 15. Not-for-profit provision: 55; 65. For-profit provision: 22; 20. Germany: Public provision: 5; 2. Not-for-profit provision: 55; 37. For-profit provision: 40; 62. Italy: Public provision: 30. Not-for-profit provision: 50. For-profit provision: 20. Netherlands: Public provision: 0. Not-for-profit provision: 80. For-profit provision: 20. Slovakia: Public provision:75. Not-for-profit provision: 23. For-profit provision: 2. Spain: Public provision: 23. Not-for-profit provision: 24. For-profit provision: 53. Sweden: Public provision: 75; blank. Not-for-profit provision: 10; blank. For-profit provision: 15; 16. Switzerland: Public provision: 30; 30; 40. For-profit provision: U S A: 6; blank. Not-for-profit provision: 24; blank. For-profit provision: 70; blank.
Note: For certain countries only aggregate data are available and it is not possible to separate institutional and home care; in Spain, no clear distinction can be made for not-for-profit and for-profit providers.
The main rationale for private provision is competition, which in turn is thought to lead to more cost-efficient care that is also better aligned with the preferences of care recipients and their advocates (family and friends). On the other hand, there is concern that for-profit providers may put competitive advantage and profit margins ahead of quality and safety, and that regulating and auditing private actors is both costly and challenging (Fine & Davidson, Reference Fine and Davidson2018; Harrington et al., Reference Harrington2017; Chon, Reference Chon2019; Maarse, Jeurissen & Ruwaard, 2015). Whether or not to promote not-for-profit and for-profit provision, i.e. to facilitate the marketization of LTC, is not a trivial decision and the way it is operationalized and governed, for example, through contracts, is also not straightforward (Rodrigues, Leichsenring & Winkelmann, Reference Rodrigues, Leichsenring and Winkelmann2014). There are many forms of non-public provision, including contracting out the provision of specific LTC services (e.g. personal care) to single providers, providing vouchers to care recipients to spend how they see fit, and establishing lists of certified providers from which older people and their advocates can choose from (Fine & Davidson, Reference Fine and Davidson2018).
Help to access LTC provision: in-kind support versus cash
LTC can be provided in kind (as goods, commodities or services) or in cash (as money transfers to the care recipient, the household or the informal carer). In-kind support includes care provided by formal carers (regardless of setting) as well as special aids and equipment. In cash support can be used to purchase or obtain care services from formal public, voluntary and private providers, as well as to compensate informal carers, depending on the specific regulations governing cash benefits. In some countries, as in France and Belgium (Flanders), cash transfers (often in the form of vouchers) can only be used to pay for LTC services from accredited and certified providers, while in others, as in Austria and Czechia, transfers are provided directly in cash and there is little control over how the cash is used (i.e. can be used to pay for non-LTC goods and services). Most countries have multiple forms of LTC benefits and schemes, some of which are provided in kind and some in cash, although some countries rely exclusively on cash benefits or purely on in-kind services (Cravo Oliveira Hashiguchi & Llena-Nozal, Reference Cravo Oliveira Hashiguchi and Llena-Nozal2020). In certain countries, such as Japan and Korea, LTC is typically provided in kind, but care can be provided in cash in remote areas where public LTC provision is more restricted (Colombo, et al., Reference Colombo2011; Cravo Oliveira Hashiguchi & Llena-Nozal, Reference Cravo Oliveira Hashiguchi and Llena-Nozal2020). Both in-kind and cash schemes may require care recipients to share a part of the costs (Colombo, et al., Reference Colombo2011), as discussed further below.
Cash transfers are touted as a way to promote user choice and allow older people and their advocates to select the providers that best align with their preferences and needs. The Netherlands introduced a system of personal budgets in the late 1990s (Box 2.5.1) that in some circumstances also allow in-kind support. Cash transfers, depending on the exact rules and regulations, can be easier to set up and have lower operational costs than services provided in kind (Creti & Jaspers, Reference Creti and Jaspers2006). Limiting cash transfers may also be an easy response to tightening of budgets, but this may lead to higher out-of-pocket (OOP) spending for care recipients and their families, with potentially negative consequences for access and affordability. Indeed, in-kind services may be a better way to target scarce public support and to make sure public resources are used in the consumption of LTC goods and services and not, as may be the case with cash transfers, for purposes other than care.
Personal budgets (persoonsgebonden budget, in Dutch) were introduced in the Netherlands in 1996 as a way to encourage the marketization of LTC and competition among new for-profit providers, as well as to promote user choice in line with individual needs and preferences (Rodrigues, Leichsenring & Winkelmann, Reference Rodrigues, Leichsenring and Winkelmann2014). Depending on the type of care needs older people have, they can apply for a personal budget from their regional care administration office (under the Chronic Care Act), their health insurance company (under the Health Care Insurance Act) or their municipality (under the Social Support Act) (Government of the Netherlands, 2021).
Older people with more severe LTC needs may use a personal budget to contract home care but only if the costs of home care do not exceed the costs of institutional care. If requesting their budget from their regional care administration office, applicants must create a budget plan describing which services they intend to purchase and from whom, and must sign contracts with each care provider; they can combine the budget with care in kind. Older people requesting their budget from their health insurance company or municipality must explain why they want a personal budget, and the company or municipality will then assess the quality of the services and equipment that is purchased. For budgets agreed by the regional office or municipality, payments are made directly by the Social Insurance Bank (or SVB, which is the organization that implements national insurance schemes) to providers from the care recipient’s personal budget (Government of the Netherlands, 2021).
Under budgets agreed by the municipality, funds can be used to compensate informal carers such as relatives and friends – provided the particular municipality allows this within its own rules and as long as a contract is established between the parties stipulating what care will be provided and for what payment (Eurocarers, 2023). Furthermore, payments to informal carers from personal budgets are considered taxable income, but they do not cover social or pension contributions (Eurocarers, 2023).
Between 2005 and 2008 the number of personal budget holders in the Netherlands grew by an average of 28% every year (Maarse & Jeurissen, Reference Maarse and Jeurissen2016). In 2014, around 120 000 people had personal budgets, but this number went down substantially to 38 500 in 2016 for a number of reasons (Kelders & de Vaan, Reference Kelders and de Vaan2018). The scheme is believed to be more susceptible to fraud, and the quality of care provided is difficult to control (Kelders & de Vaan, Reference Kelders and de Vaan2018). There have also been concerns that the budgets did not, despite expectations, entice new entrants into the LTC market, nor bring down total costs of care through competition. Rather, it would seem that personal budgets were used to compensate relatives and friends who were already providing care, that the budgets only partially substituted for in-kind care, and that people who would not otherwise have applied for care had applied for and been granted a personal budget (Rodrigues, Leichsenring & Winkelmann, Reference Rodrigues, Leichsenring and Winkelmann2014). A recent analysis also found that recipients of the budgets did not have more independence, social participation nor a higher quality of life than those receiving help in kind (Marangos et al., Reference Marangos2020). Thus, despite its good intentions, the personal budget system has not been as successful in the long-term as hoped, in terms of marketizing LTC, increasing competition among new for-profit providers, and promoting user choice in line with individual needs and preferences.
How is LTC financed?
In many high-income settings, public sources cover at least some portion of LTC financing, but voluntary insurance and private payments often also play a significant role. In most OECD and EU countries (OECD, Reference Kim and Dougherty2020b), the costs of LTC are covered to some extent either by a government scheme, at national or subnational level, or through compulsory insurance (mainly social insurance). Public schemes typically only partially cover the total costs of LTC, and so voluntary insurance and private payments (OOP) represent a nontrivial share of total LTC spending. Government schemes are used in Scandinavian countries, Australia, New Zealand and in Austria. Nordic countries typically have universal coverage under one single programme. Countries which have a dedicated social insurance scheme include Germany, Japan, Korea, the Netherlands and Luxembourg, whereas parts of Belgium arrange coverage mostly within the health system.
How much is spent on LTC, in total?
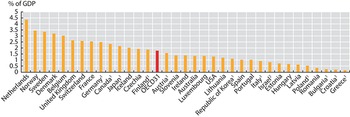
Spending on LTC varies, but tends to be higher in countries where government spending on health is higher in general. On average across the OECD, 1.5% of GDP was spent on all LTC services (health and social) in 2018, equating to around US$ 760 per capita (adjusted for differences in price levels across countries; see Fig. 2.5.5) (OECD, Reference Kim and Dougherty2020b). Spending data from the OECD generally cover both the health and social components of LTC. The health component includes help with ADLs (along with nursing care, like treating pressure ulcers), while the social component covers primarily help with IADLs (OECD, 2019). For some countries, the social part of LTC spending is not reported (but in some cases it is implicitly included under the health component). In some countries, various elements of private spending are also not reported.
Out of OECD countries, total spending on LTC as a share of GDP is highest in the Netherlands and Scandinavian countries, reflecting more developed formal LTC benefits, services and schemes. There is then a second group of countries (which include France, Germany, Japan and the United Kingdom) where total LTC spending accounts for 2% to 2.5% of GDP. A third group, composed mostly of south-eastern European and Latin American countries, spends significantly less on LTC, relying on unpaid or unaccounted informal caring. In countries that report on both health and social components of LTC spending, the health component accounts for around 70% of total spending, on average (OECD, Reference Kim and Dougherty2020b). Total LTC spending has increased gradually in the last decades, both as a share of GDP and as a share of total health spending (OECD, Reference Kim and Dougherty2020b).
Total spending on LTC as a share of GDP varies across OECD countries
Notes: 1. Country not reporting spending for LTC (social). In many countries this component is therefore missing from total LTC, but in some countries it is partly included under LTC (health). 2. Country not reporting spending for LTC (health). Data are for 2021 (or nearest year).

Figure 2.5.5 Long description
The y-axis notes the percentage of G D P from 0 to 5, while the x-axis lists the countries. The Netherlands spends the highest, while Greece spends the lowest. Between 2 and 5 percent: Netherlands, Norway, Sweden, Denmark, Belgium, United Kingdom, Switzerland, France, Germany 1, Canada 1, Japan 1, Iceland, Czechia Republic. Between 0.5 and 2: Finland 1, O E C D 31, Austria 1, Slovenia, Ireland, Australia, Luxembourg, United States, Lithuania, Korea 1, Spain, Portugal, Italy 1, Israel 2, Estonia, Hungary, Latvia, and Poland 1. Below 0.5 percent: Romania, Bulgaria 1, Croatia 1, and Greece 1.
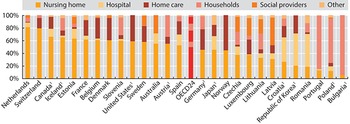
As stated, governments and compulsory social insurance cover the bulk of the costs of LTC provision. Countries where total LTC spending is high also tend to have high shares of government spending (between 92% and 94%). Conversely, in Estonia and Portugal, public spending accounts for only 60% or less of total LTC spending (OECD, Reference Kim and Dougherty2020b). The largest share of total LTC spending is devoted to nursing homes (mostly institutional care, although some nursing homes provide home care and help with IADLs), accounting for 80% of total spending in the Netherlands (see Fig. 2.5.6). By contrast, nursing homes account for only 20% of total spending in Korea and Portugal, two countries where total spending as a share of GDP is also lower. The heterogeneity in spending devoted to different types of providers is significant, with different providers playing more important roles in different countries (e.g. hospitals in Japan, social providers in Portugal, home care in Norway, etc.). Some countries provide cash benefits and allowances for family carers, a spending category (“households”) that can account for a significant share of total spending, as in Austria.
The largest share of total LTC spending in OECD countries is on nursing homes
IADL: instrumental activities of daily living; LTC: long-term care.
Note: Countries not reporting social LTC. The category “Social providers” refers to providers where the primary focus in on help with IADL or other social care. Data are for 2021 (or nearest year).

How much do individuals spend on LTC?
Costs and use of LTC varies, but the price for intensive and sustained support adds up quickly and can become catastrophic for individuals.
Data on aggregate spending on LTC provide limited insights into the OOP costs of LTC services for older individuals, and whether older people with LTC needs might be impoverished due to high OOP costs. LTC needs are difficult to predict, even at older ages and while many older people will never require formal LTC, some will need intensive and sustained support, the costs of which may add up over time (Muir, Reference Muir2017). Moreover, and as previously discussed, LTC needs and use of services are not equally distributed among older populations. Importantly, in the context of OOP spending, survey data suggest the prevalence of LTC needs is higher among older people on lower incomes. It is thus appropriate to explore individual spending on LTC services, and to understand how aggregate spending is associated with individual affordability and protection from poverty, especially among those older people who most need care.
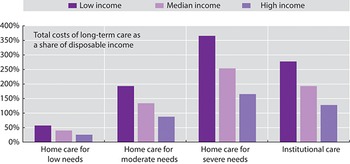
On average across 25 OECD and EU countries for which data are available, the total costs of LTC that older people could face if they did not have access to public social protection represent up to five times the median disposable income of individuals of retirement age or older (Fig. 2.5.7). Without public social protection, the majority of older individuals would not be able to afford LTC from their incomes alone, especially those on lower incomes. To protect older people with LTC needs from these potentially catastrophic expenses, most OECD and EU countries provide some level of public risk pooling, whether predominantly tax-funded (e.g. Finland), based on compulsory social insurance (e.g. Germany), or a mix of these two (e.g. France). The scope, breadth and depth of these public social protection systems for LTC vary widely across countries, with some providing universal comprehensive coverage (e.g. Luxembourg) and others providing targeted means-tested safety nets (e.g. USA) (Cravo Oliveira Hashiguchi & Llena-Nozal, Reference Cravo Oliveira Hashiguchi and Llena-Nozal2020).
Without public social protection, the majority of older individuals would not be able to afford LTC from their incomes alone
Note: Bars show averages for 25 countries in the OECD and EU. Low income refers to the upper boundary of the 20th percentile, and high income to the upper boundary of the 80th percentile. Low, moderate and severe needs correspond to 6.5, 22.5 and 41.25 hours of care per week, respectively. The costs of institutional care include the provision of food and accommodation, so are overestimated relative to home care.

Figure 2.5.7 Long description
The y-axis notes the Total costs of long-term care as a share of disposable income, from 0 to 400 percent, while the x-axis lists the degrees of need. Each section has 3 bars: low income, median income, and high income, respectively. The approximate values are as follows. Home care for low needs: 52 percent; 45 percent; 30 percent. Home care for moderate needs: 198 percent; 142 percent; 90 percent. Home care for severe needs: 360 percent; 250 percent; 165 percent. Institutional care: 270 percent; 195 percent; 125 percent.
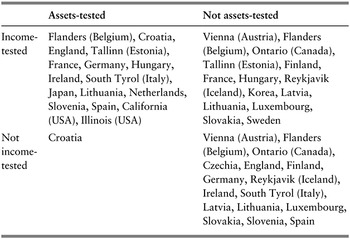
Older people with similar LTC needs often face significantly different OOP costs depending on their means, and where they live and seek formal care. Most countries will cover part of the total costs of LTC, but in most cases users will still need to contribute. Research based on a set of typical cases of LTC needs that has been used to achieve comparability across countries indicates that in most OECD countries, public social protection schemes would cover at least 60% of the total costs of care for moderate needs (Cravo Oliveira Hashiguchi & Llena-Nozal, Reference Cravo Oliveira Hashiguchi and Llena-Nozal2020). The remaining share of costs – the OOP costs – are typically determined based on, often intricate, rules and calculations that can differ depending on the exact benefit and scheme that applies or the type of help provided (e.g. coverage for help with IADLs is often more limited). Many countries provide greater cost coverage to older individuals with more severe LTC needs and lower means but in a few countries, due to ceilings on public support, the opposite is true. The large majority of LTC benefits and schemes, across countries, have means-tested coverage of costs (Table 2.5.2). The exact form of means-testing varies widely across countries, with some countries providing very comprehensive cost coverage and others providing no support whatsoever to older people with higher incomes and assets.

Table 2.5.2 Long description
The table has 2 columns: Assets-tested and Not assets-tested. It reads as follows. Row 1: Income-tested. Assets-tested: Flanders (Belgium), Croatia, England, Tallinn (Estonia), France, Germany, Hungary, Ireland, South Tyrol (Italy), Japan, Lithuania, Netherlands, Slovenia, Spain, California (U S A), Illinois (U S A). Not assets-tested: Vienna (Austria), Flanders (Belgium), Ontario (Canada), Tallinn (Estonia), Finland, France, Hungary, Reykjavik (Iceland), Korea, Latvia, Lithuania, Luxembourg, Slovakia, Sweden. Row 2: Not income-tested. Assets-tested: Croatia. Not assets-tested: Vienna (Austria), Flanders (Belgium), Ontario (Canada), Czechia, England, Finland, Germany, Reykjavik (Iceland), Ireland, South Tyrol (Italy), Latvia, Lithuania, Luxembourg, Slovakia, Slovenia, Spain.
Note: Countries and subnational areas can belong to more than one category if they have multiple benefits and schemes.
Due to differences in cost coverage across countries, needs and means, older people with similar LTC needs could face significantly different OOP costs depending on where they live and seek formal care. In a number of EU countries (e.g. Croatia and Latvia), older people with severe needs and median incomes would face OOP costs for home care that are higher than their income (Cravo Oliveira Hashiguchi & Llena-Nozal, Reference Cravo Oliveira Hashiguchi and Llena-Nozal2020). In other places (e.g. Estonia, Slovenia and parts of the USA), OOP costs of home care for moderate needs would represent over half of median incomes among older individuals, leaving the other half to pay for basic costs of living, such as electricity and food. OOP costs of institutional care for severe needs are almost universally lower than OOP costs of home care for severe needs. While most countries have safety nets to protect the most economically vulnerable older people, many countries set eligibility thresholds far below international relative income poverty lines (e.g. 50% and 60% of median equivalized disposable income after social transfers in the OECD and EU respectively). High OOP costs are likely to lead older people to deplete their assets to pay for care, seek alternatives (like informal care) or forgo care altogether.
Some countries use asset-tests to determine eligibility and support levels granted to individuals who need LTC. Across OECD countries, older people are more likely to have lower incomes (compared to their younger peers). However, they are also more likely to have accumulated assets over their lifetimes and thus have comparatively higher net wealth (Balestra & Tonkin, Reference Balestra and Tonkin2018). For this reason, and in response to budgetary constraints, some governments have adopted assets-tests to determine eligibility for and level of support from public social protection systems. Assets-tests are implemented in a myriad of ways across the OECD. Some systems protect assets below a certain threshold by excluding them from assets-tests and some exclude certain types of assets like an older person’s primary residence (especially if the older person is receiving home care). More recently, some countries (e.g. France, USA) have sought to implement deferred payment agreements or reverse mortgages, whereby governments will pay for care but older individuals agree to use their assets (including their primary residence) to partly or fully repay the state at a later date (e.g. when they move to institutional care or when they pass away). Assets-tests need to be well-designed to avoid distorting saving behaviour. Furthermore, considering the unequal distribution of LTC needs, assets-tests can be considered a regressive wealth tax on those who need LTC.
Public coverage of the total costs of LTC is crucial. Without it, the majority of older people in the OECD and EU would not be able to afford the OOP costs of care without falling below relative income poverty lines. Social protection is especially vital in protecting older people from the very high costs of care for severe needs. However, public support does not completely eliminate the risks of income poverty associated with LTC in old age. Even with social protection, poverty risks are often still higher among older people with LTC needs than among the general older population (Cravo Oliveira Hashiguchi & Llena-Nozal, Reference Cravo Oliveira Hashiguchi and Llena-Nozal2020).
LTC support: who needs it, and who receives it?
Due to data scarcity, it is difficult to determine who applies for, qualifies for and takes up public LTC support, who receives informal LTC and who has unmet LTC needs.
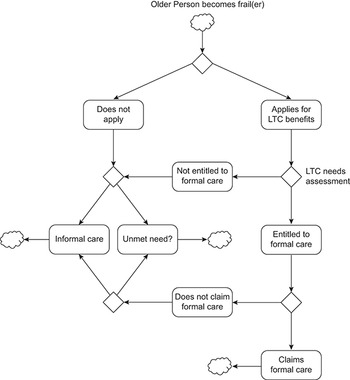
When an older person becomes dependent on others, they and perhaps their family and friends face the choice of seeking support from the state or finding other alternatives, such as informal care or support from carers in the grey economy (Fig. 2.5.8). Ultimately, if an older person cannot find care, this may lead to unmet needs. Decisions to apply for public support may be driven by several factors, including awareness of public benefits and schemes, knowledge of where and how to apply, and availability of regional care administration offices, for example. If the older person does apply, a process of formal needs assessment begins. This may not be immediate and there may be waiting times between requesting an assessment and receiving one. Once the older person’s needs have been assessed, they may or may not qualify for public support. If they do qualify, the level of support they receive will likely depend on their needs but, potentially, also their means (income and net wealth). Once the level of support is determined, the older person and their advocates may choose to take it up or not. They may find it does not meet their expectations and seek alternatives.
Comprehensive and comparable data on the decision points in Fig. 2.5.8, and the reasons behind the decisions taken, are scarce, making it difficult to quantify, in any given year, the numbers of older people who: apply for public LTC support (which could be used as a proxy for self-assessed LTC needs); qualify for public support; take up public support; receive and/or prefer informal care; and have unmet LTC needs.
Assessments of LTC needs vary widely across countries
While a definition of LTC has been agreed to in the SHA, in practice there is a wide range of definitions implicit in needs assessments applied by countries, and in some cases, subnational areas. Assessments of LTC needs vary widely across countries, in terms of who undertakes the assessment, which types of needs are considered, the scoring systems used to rate the severity of needs, whether social structures and external factors are taken into account, how scores are aggregated and, finally, how scores relate to service and benefit levels (Cravo Oliveira Hashiguchi & Llena-Nozal, Reference Cravo Oliveira Hashiguchi and Llena-Nozal2020). The determination of whether an older person is dependent on others and needs LTC is as much a result of their limitations with everyday activities as it is driven by needs assessments (Brugiavini et al., Reference Brugiavini2017).
Assessments of LTC needs are used by countries, and some subnational areas, to determine whether an older person has limitations that qualify them for public LTC benefits, services and schemes and may also be used to determine the level of support that older people qualify for. Several concepts have been used to describe the conditions that lead an older person to require LTC, including terms like vulnerability, frailty, comorbidity, disability and dependency (Brugiavini et al., Reference Brugiavini2017; Rodríguez-Mañas et al., Reference Rodríguez-Mañas2013; Fried et al., Reference Fried2004; De Vries et al., 2010; Pel-Littel et al., Reference Pel-Littel2009). Definitions for these concepts vary, and it is difficult to establish how they differ, how they relate to one another, and how they might be measured. One study found 20 instruments to measure frailty alone (De Vries et al., 2010). The most commonly used instruments are the Lawton Instrumental Activities of Daily Living Scale for measuring difficulties with IADLs, which gives a score between zero (totally dependent) and eight (totally independent), and the Barthel Index of Activities of Daily Living for measuring limitations with ADLs, which gives a score between zero (totally dependent) and 20 (totally independent).
There is no standardized, internationally recognized, instrument to determine whether an older person has LTC needs and how intense they are. Instruments and procedures used to assess LTC needs vary widely (Cravo Oliveira Hashiguchi & Llena-Nozal, Reference Cravo Oliveira Hashiguchi and Llena-Nozal2020). Across OECD and EU countries, needs assessments use different combinations of ADLs, IADLs and even, in some cases, factors such as loneliness and self-assessed ability to cope with difficulties. For example, being aware of dangers and being able to have a social life are included in needs assessments in Belgium. In Croatia, Italy, Ireland and the Netherlands, social networks and external factors, such as the availability of an informal carer, are taken into account in needs assessments. In recent years, countries have revised their needs assessments to gauge not just physical limitations but also mental and cognitive impairments. For example, Austria included dementia explicitly in needs assessments in 2009 while Germany added cognitive and psychological impairments in 2017. These developments are significant, given that an estimated 19 million people in the OECD are living with dementia (OECD, 2018), and that instruments that measure only ability to perform ADLs and IADLs may miss important limitations that are driven by cognitive impairments (Bucks et al., Reference Bucks1996).
Instruments and procedures used to assess LTC needs vary widely
LTC: long-term care.
Note: Clouds represent boundaries of the diagram (entries and exits into system); exit does not mean person cannot re-enter the system at a later point in time. Diamonds represent decision points.

The way different limitations are combined to produce an overall level of LTC needs also varies across countries, and naturally implies distinct hierarchies of limitations. Different weights are used for different types of limitations and factors. For example, in Germany, the highest weights are placed on “self-sufficiency”, a category that comprises 13 indicators, and within which items such as eating, drinking and using the toilet have higher weights than others. Mobility (comprised of five indicators) has the lowest set of weights. In Lithuania, each factor contributes a specified amount to the overall composite score of needs, but factors are scored differently so that some implicitly count more towards the final score. The final composite score of needs is used to categorize an older person in terms of the severity of their needs. The number of categories varies across countries. For many countries, the number of categories and levels is between three and five categories. Luxembourg is an exception, with 15 categories based on minutes of care needed per week (Cravo Oliveira Hashiguchi & Llena-Nozal, Reference Cravo Oliveira Hashiguchi and Llena-Nozal2020). Some of the categories may not be eligible for any public support.
Countries also differ in terms of who is responsible for conducting the needs assessment. In Belgium and Finland, assessments are performed by multidisciplinary teams. In Latvia, assessments are conducted by general practitioners and social workers, while in Germany specialized doctors and nurses are involved. In Austria and England, assessments are based on a physician’s evaluation. In Japan, a computer-aided initial assessment (based on an 85-item questionnaire) is used to assign each applicant to one of seven levels of LTC needs. The Japanese Care Needs Certification Board, a committee of medical and other professionals, then reviews the results and makes a final decision.
Assessments of LTC needs also vary within countries
Needs assessments are not always standardized within countries, which introduces variation at the subnational level. Austria, Germany and Luxembourg, for example, have nationwide instruments while in Italy, instruments are regional. France uses a standardized assessment tool nationwide but there seems to be variation across regions in the interpretation, generating differences in the number of beneficiaries. In Estonia, different agencies have different assessment scales and procedures. In Belgium, Canada and the USA there are both federal and regional benefits and schemes, with their own specific rules and regulations, including needs assessment instruments. In Portugal, there is one needs assessment scale for cash benefits and another for in-kind care. In Denmark, Finland, Iceland, Norway and Sweden, municipalities are responsible for conducting needs assessments and setting eligibility criteria, based on a set of guiding principles (e.g. universal care in Denmark).
Because there is no single internationally accepted and standardized approach to identify and measure LTC needs, cross-country comparisons of administrative data on the number of recipients reflect differences in eligibility, scope and depth of public support. Administrative data on applications for, and results of, needs assessments would be very useful but these data are not available for the majority of countries. Existing cross-country estimates of the prevalence of LTC needs in older populations are thus based on survey data. The exact questions used vary across surveys, with some estimates relying on a single question to establish self-assessed needs, and other studies using some aggregation of self-reported limitations in ADLs, IADLs and physical functioning.
The World Health Organization estimates that, globally, at least 142 million people, equivalent to around 15% of those aged 60 years old or older in the world, lack the ability to meet basic needs (WHO, 2020). This estimate is based on three elements (ability to get dressed, to take medication and to manage money) in national surveys from 37 countries (together these countries account for 49% of the world’s population aged 60 years old and older). The 2021 Ageing Report of the European Commission estimates that 34% of individuals aged 65 years and older in the 27 EU Member States plus Norway are dependent and may require LTC (Directorate-General for Economic and Financial Affairs, 2021). The estimate is based on “self-perceived longstanding limitation in activities because of health problems [for at least the last 6 months]”, as reported in the EU Statistics on Income and Living Conditions (EU-SILC). A different estimate, also by the European Commission, indicates that 31% of people aged 65 years and older in 22 EU Member States were in need of LTC in 2019 (European Commission, 2021). This estimate uses data from the European Health Interview Survey or EHIS.
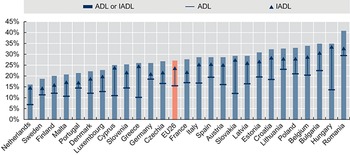
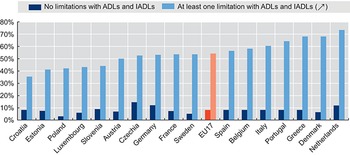
Responses to the Survey of Health, Ageing and Retirement in Europe (SHARE) indicate that, on average across 26 EU Member States, 16% of the population aged 65 years and older report at least one limitation in ADLs, 24% report one or more limitations in IADLs and closer to 30% report at least one limitation in either ADLs or IADLs (Fig. 2.5.9). There is wide variation across countries. For example, the percentage of older individuals reporting limitations in IADLs in the Netherlands and in Sweden are around 14%, while in Hungary and Romania, over 30% of older people report limitations in IADLs. Data from SHARE indicate that older people reporting limitations in ADLs and/or IADLs are more likely to be women, aged 80 years old or older, have lower levels of education, earn lower incomes and live in single households.
Nearly a third of people 65 years and older in the EU report at least one ADL/IADL limitation
ADL: activities of daily living; IADL: instrumental activities of daily living; SHARE: Survey of Health, Ageing and Retirement in Europe.
Note: EU26 is the unweighted average of population-weighted national shares; data refer to 2015 for the Netherlands and 2017 for the rest of countries. Older people are those aged 65 years old and older.

Figure 2.5.9 Long description
The y-axis notes percentages from 0 to 45, while the x-axis notes the countries. In increase order of percentages, the countries are as follows. 25 percent or below: Netherlands, Sweden, Finland, Malta, Portugal, Denmark, Luxembourg, and Cyprus. Between 25 percent and 35 percent: Slovenia, Greece, Germany, Czechia Republic, E U 26, France, Italy, Spain, Austria, Slovak Republic, Latvia, Estonia, Croatia, Lithuania, Poland, Belgium, Bulgaria, and Hungary. Above 35 percent: Romania.
Women, older people, those with less education and those who earn less are more likely to have greater LTC needs, but in some cases have less access to it.
On average across 26 EU Member States, 18% of older women report at least one limitation with ADLs compared to 14% of older men, and 28% of older women report at least one limitation with IADLs compared to 18% of older men. Individuals aged 80 years old or older are almost three times more likely to report limitations in ADLs and IADLs than individuals aged 65–79 years (31% and 48% of people aged 80 years old and older report limitations in ADLs and IADLs respectively, compared to 11% and 15% of people aged 65–79 years). The shares of older people reporting at least one limitation in ADLs and/or IADLs are higher among those with lower levels of education compared to those with medium and high educational attainment (International Standard Classification of Education (ISCED) 1997 codes used to define the levels of education; codes 0–2 for lower level, codes 3–4 of medium level and codes 5–6 for higher level). On average across 26 EU Member States, the prevalence of self-reported limitations in ADLs among older people with a low level of education is more than double that among older people with a high level of education (22% compared to 10%). With respect to IADLs, 13% of older individuals with a high level of education report limitations, compared to 33% of older people with a low level of education.
On average across 26 EU Member States, the prevalence of self-reported limitations in ADLs among older people earning in the bottom income quintile is around 22% compared to a prevalence of 9% among older people with earning in the top income quintile (income refers to households equivalized income using the square root of household size as an equivalence scale). Moreover, older people with self-reported limitations in ADLs and IADLs are more likely to live in single households, limiting their ability to access informal care.
On average across OECD countries, just over one in 10 people aged 65 and older received formal LTC benefits and services in 2017, according to administrative data from national authorities (OECD, 2019). The range across countries is broad, from 22% in Switzerland to 1% in Poland. Data on recipients of LTC provided by voluntary and private providers are more difficult to collect, especially when the state is not paying the costs of care. For this reason, countries where privately funded care is more prevalent may report lower numbers of recipients. The majority of LTC recipients are aged 80 years old and older and women, in line with the distribution of LTC needs shown previously. On average across the OECD, 65% of older people receiving LTC are aged 80 years or older (OECD, 2019). In all OECD countries for which data are available, women make up the majority of LTC recipients aged 65 years or older, both in institutions and at home (Fig. 2.5.10). Further breakdowns of administrative data on recipients, for example for education and income, are not possible due to data gaps.
The majority of LTC users are women and those aged 80 years and above
LTC: long-term care.
Note: Data for the USA are from 2016, and for Slovenia and the Netherlands for 2017. All other data are for 2018.

Figure 2.5.10 Long description
The y-axis notes percentages from 0 to 90, while the x-axis notes the countries. Each country (with some exceptions) has two bars: L T C recipients in institutions (other than hospitals), and L T C recipients at home. Denmark has no bar for L T C recipients in institutions. There are also no bars for L T C recipients at home for Latvia, Poland, Ireland, Canada, Netherlands, Slovenia, and Switzerland. All the other countries - Portugal, Australia, New Zealand, Sweden, Norway, Finland, Israel, United States, Estonia, Lithuania, Germany, Spain, Hungary, Luxembourg, Czechia Republic, and Korea - have both bars. A horizontal line has been drawn at y equals 50 percent. All bars consistently stay above this line. The highest value for L T C recipients in institutions is for Korea (79 percent), while that for L T C recipients at home is for Estonia, Spain, and Hungary (72 percent).
Regardless of which estimate of prevalence of LTC needs is considered, the number of recipients falls short of the number of older people who might need LTC. There are a number of reasons why older people who need LTC may not be counted as recipients of LTC benefits and services in administrative data. First, as discussed (see Fig. 2.5.8), not all older people who have LTC needs or limitations apply for benefits and services. They may seek support from their families first, a decision that is likely affected by cultural norms around the degree to which families look after older people. Second, older people who have LTC needs may not qualify to receive LTC. Third, older people may also pay for care in the voluntary or private market, or seek care from providers in the grey economy.
Across 17 EU Member States, an average 54% of older people who report having limitations with ADLs or IADLs also report they receive help with activities they have problems with, including help from their spouses and other people in their household (Fig. 2.5.11). This compares to 9% of older people who report no limitations in ADLs or IADLs but do report receiving help (these older people may still have limitations in physical functioning). As with recipients of formal LTC, women and those aged 80 years old or older are more likely to report receiving help.
Just over half of older people reporting a need for help also report receiving help for it
ADL: activities of daily living; EU: European Union; IADL: instrumental activities of daily living; SHARE: Survey of Health, Ageing and Retirement in Europe; TILDA: The Irish Longitudinal Study on Ageing.
Note: Help from partner or other people in household is included; the EU17 average is the unweighted average of the population-weighted national shares in each country.

Figure 2.5.11 Long description
The y-axis represents percentages from 0 to 80, while the x-axis represents the countries. Each country has two bars: No limitations with A D Ls and I A D Ls, and At least one limitation with A D Ls and I A D Ls. The bars for No limitations consistently stay below 10 percent except for Czechia (15 percent), Germany (12 percent), and the Netherlands (11 percent). For At least one limitation, the countries from lower to higher percentages are as follows. Between 30 percent and 50 percent: Croatia, Estonia, Poland, Luxembourg, Slovenia, and Austria. Between 50 percent and 60 percent: Czechia Republic, Germany, France, Sweden, E U 17, Spain, Belgium, and Italy. Above 60 percent: Portugal, Greece, Denmark, and Netherlands.
Policy relevance and conclusions
Our conclusions and policy suggestions fall into two areas: the financing of LTC, and how best to assess its quality.
How else to finance LTC?
As populations age and demand for LTC rises, countries face challenges finding the financing to expand LTC coverage for high-quality, accessible, affordable and equitable services.
Many countries are trying to find sustainable solutions for financing LTC in the face of increasing demand due to population ageing. As previously discussed, countries use a variety of cost-sharing mechanisms or strict eligibility criteria to have a form of targeted universalism (OECD, 2011).
Options for governments to finance growing needs include better pooling of financing across generations, broadening of financing sources beyond payroll contributions, and introducing elements of pre-funding. Funding through a rise in social security and payroll taxes would be a major challenge as in some countries taxpayers already feel overburdened. Other forms of taxation outside of income taxes could be considered; for example, earmarking a fixed percentage of the value-added tax to finance reserve funds or a percentage of the tax revenue of other taxes, such as local property taxes (as is the case in France) would in practice increase the tax base of LTC financing. Certain countries have considered the (re)introduction of a wealth tax or increasing the tax levied on the highest incomes as alternative options to finance LTC but these options are likely to be controversial.
Debates about raising taxes have enhanced the attractiveness of introducing a public LTC insurance. The advantages of a dedicated insurance scheme include more transparency in managing funds and a possibility to prefund care instead of creating debts for the future. Disadvantages of such a scheme include its reliance on employee contributions, which can have negative impacts on employment and growth, as well as raise issues with respect to equity and intergenerational fairness. Unless the scheme was extended to the unemployed and the self-employed, it would have a limited tax base, which raises issues regarding equity. For those who are not working, the LTC insurance contribution would still need to be paid from taxes.
In addition, countries could facilitate the development of financial instruments to pay for the board and lodging costs of LTC provided in institutions. Options include bonds or equity release schemes (as in Australia and Ireland), public measures to defer payments (as in the United Kingdom and the USA), and private sector products, such as reverse-mortgage schemes and combinations of life and LTC insurance policies. So far, the development of such products remains limited due to minimal interest from providers and citizens, as well as complex regulatory challenges.
How do we assess LTC performance and quality?
There is limited evidence and understanding around what works in LTC, and thus it is difficult to design and implement effective policy reforms. How to assess the performance of LTC systems remains a challenging yet crucial question. The quality of LTC is important for at least three reasons. First, users of care services increasingly demand more voice and control over their lives. Second, LTC services are under pressure to improve their accountability. Third, governments have a responsibility to protect vulnerable older people from potential abuse. Besides being high-quality, LTC systems that perform well are also accessible to older populations and provide good value for money. There is limited understanding of what works well in LTC, in what contexts and at what costs. This in turn makes it difficult to design and implement effective policy reforms.
Indicators of LTC quality are useful for government regulatory oversight, help providers identify problems and point to adverse events in the provision of care, and can help users make informed choices. Yet, few countries systematically measure whether LTC is safe, effective (or what constitutes effective LTC), and centred around the needs of care recipients. Most available indicators focus on inputs and processes, rather than outcomes and quality. Three groups of dimensions are generally accepted as critical to achieving high quality in care effectiveness and safety; patient-centredness and responsiveness; and care coordination (OECD, 2017).
The COVID-19 pandemic has laid bare deficiencies in LTC safety. Across OECD countries, around four in every 10 deaths due to COVID-19 were among LTC residents (Rocard, Sillitti & Llena-Nozal, Reference Rocard, Sillitti and Llena-Nozal2021). A lack of resources is likely behind these dire statistics. LTC settings are often inappropriately staffed, they lack supplies and struggle to access clinical treatments, all of which can lead to poor safety. Both an absence of quality standards, and limited monitoring and enforcement of quality standards, make matters worse. A lack of data makes it difficult to quantify safety failures, and truly understand the magnitude of the challenge.
In general, countries with higher spending on LTC tend to report better access to, higher quality of and more satisfaction with public LTC services. Across 21 countries, close to a third of respondents to the 2018 OECD Risks That Matter survey identified accessing LTC as one of the three greatest risks to themselves or their immediate family, and 40% of respondents report that ensuring the LTC of family members is among the three greatest risks to themselves and their families. While simple correlations are necessarily imperfect, they indicate that satisfaction with access to high-quality and affordable LTC services is associated with the generosity of public systems. Countries that spend more on public LTC, like Denmark, Norway and the Netherlands, have smaller numbers reporting unhappiness with access to public LTC services for older people, and those countries that spend less have higher shares of respondents expressing dissatisfaction. This would suggest that LTC in some countries is not patient-centred nor responsive to population needs and wants.
The pandemic has also laid bare failings in care coordination across the health and LTC sectors (Rocard, Sillitti & Llena-Nozal, Reference Rocard, Sillitti and Llena-Nozal2021). Poor coordination of care (as discussed in Chapter 3.5) further reduces effectiveness and safety of care. Coordination with primary health care is especially important, as older people tend to have multiple chronic conditions and are at higher risk of hospitalization if not properly monitored. Collaboration across teams of professionals in the health and LTC sectors is key to ensure high quality of care and reduce unsafe and wasteful practices. In Japan, for example, community-based integrated care centres have been opened in every district, with care managers coordinating different services for older people.
Besides the quality of care, it remains unclear whether older people are able to access the LTC services that they need. As mentioned in previous sections, not all older people who are estimated to have LTC needs report using formal care. Moreover, when self-reported receipt of formal and/or informal care is considered, there remain large shares of older people with estimated needs that do not report receiving any help. Across 22 EU Member States, almost half of older people reporting severe difficulties in personal care or household activities stated they had unmet needs for help with those activities (Directorate-General for Economic and Financial Affairs, 2021). Older women and those on lower incomes were more likely to report unmet needs than older men and those on higher incomes (Directorate-General for Economic and Financial Affairs, 2021). Self-reported data are naturally influenced by cultural differences across countries and by factors other than LTC costs and quality, yet these high rates of unmet need suggest there are important perceived challenges in access to care. Among barriers to access are financial limitations (compounded by insufficient social protection), geographical disparities and shortages of care workers, complex administrative procedures that are difficult to navigate, and limited support for informal carers who often have to choose between employment and caring for relatives.
With respect to financing, it remains very difficult to establish whether current total and government spending on LTC constitutes good value for money. Indications are that the sector would benefit from both more funding but also better understanding of how to allocate current and future investments. Fiscal space is already limited today, and will only become more constrained as populations age and old-age dependency ratios increase. Thus, public and private funding for LTC must not be wasted, and should promote high-quality care that is accessible to all who need it, especially those who are most economically vulnerable and least likely to be able to afford it (see Chapter 3.6). As with quality, indications are that not all countries have social protection that sufficiently cover the costs of LTC for older people with more severe needs and fewer means.
As with safety and effectiveness of provision, there is limited analysis of performance indicators in LTC financing. Comparability of data on LTC spending is limited, with elements being excluded or underreported even at the level of total public spending (OECD, Reference Kim and Dougherty2020b). Performance indicators, such as share of households with catastrophic spending, national-subnational financing splits and percentage of expenditure on administrative processes are not available.
Governments, societies and economies face major challenges in planning, financing and providing high-quality care that is accessible and constitutes good value for money. While governments have some visibility of LTC needs via needs assessments and information on recipients, it is unlikely that all older people who have LTC needs apply for public benefits and schemes. It is sensible to assume that there are gaps in the measurement of LTC needs at population level, and that these gaps make it difficult to determine whether current provision is appropriate and how well systems will meet future demand for care. Moreover, without good data on needs and provision, it is also virtually impossible to determine the true societal and economic costs and consequences of informal care provision. With limited understanding and data on quality, specifically on effectiveness and safety, patient-centredness and responsiveness and care coordination, it is very challenging for policy-makers to make evidence-based decisions in this sector.
Going forward, it is thus crucial that governments invest more funds and efforts in data collection, international comparisons and analysis so that best practices can be identified and good solutions can be disseminated and shared widely. The clock is ticking, and unexpected and hugely consequential events like COVID-19 will only increase the urgency for action. The sector is far too complex for short-term thinking, and tackling these significant challenges requires long-term vision and policy action.Footnote 1


 Open access