


Introduction
Coronavirus disease 2019 (COVID-19) caused by severe acute respiratory syndrome-coronavirus-2 (SARS-CoV-2) stands out for its high rate of hospitalisation and long hospital stay and in intensive care units (ICUs). COVID-19 disease severity can be mild, moderate, severe and critical [1]. While 81% of those infected with COVID-19 have mild or moderate symptoms, World Health Organization estimates that 14% of those infected with COVID-19 are severe and require hospitalisation and oxygen support, and 5% are critical and admitted to ICUs [1]. Reported median hospital length of stay (LoS) was from 4 to 21 days (outside China) and ICU LoS was from 4 to 19 days [Reference Rees2].
The severity of COVID-19 states is associated with many risk factors. Early reports suggest advanced age, morbidities, multi-morbidities and immunosuppression [Reference Guan3, 4]. The enlarging list includes cardiac, chronic lung, cerebrovascular, chronic kidney and liver diseases, cancer, diabetes, obesity, hypertension, dyspnoea, fatigue and anorexia [1, 5, Reference Liu6].
Early identification of severe cases allows for optimising emergency care support [1] and improving patient outcomes [Reference Marin7]. However, patients who do not yet meet supportive care criteria may fail to receive the necessary care, when there is rapid deterioration or inability to promptly go to a hospital. In the transition from moderate-to-severe cases there can be avoidable delays in life support interventions with non-optimised treatments.
Together with high hospitalisation rates [1] and lengthy stay [Reference Rees2], the superposition of COVID-19 waves and sustained transmission [Reference Lai and Cheong8] are causing prolonged depletions of health care resources in many countries. Prognosis tools may play a role in planning and in improving the access to supportive treatments by allowing timely allocation of scarce resources to better cope with COVID-19. Indeed, there is widespread interest in predictive models of COVID-19 outcomes [Reference Marin7, Reference Wynants9], but a review of 50 prognostic models concluded that they are at high risk of bias [Reference Wynants9]. As they focus on statistical findings, our concern is with lack of minimum causal criteria to identify associations that are effectively related to COVID-19.
In this context, a path to optimised supportive treatments is more reliable assessments of the transition from moderate-to-severe cases of COVID-19 inflammation. We choose non-specific blood tests as they are widely available, and hospitalisation decision as a proxy to characterise the transition from moderate-to-severe cases (when not constrained by inpatients availability). After formalising an analytical framework with causal reasoning, the goal is to identify candidate sets of blood tests associated with hospitalisation (with risk factors), excluding noisy predictors that are not related to COVID-19 inflammation.
Methods
Whereas causal effects are clearly predictive, prediction studies usually refer to non-causal analysis that uses observational data to make predictions beyond the observed ones and confounding bias is generally considered a non-issue [Reference Westreich10]. However when one needs more reliable predictions, confounding bias and causality should be accounted for in associations. This study applies analytical tools from the causal effect estimation of directed acyclic graph (DAG) theory [Reference Pearl11] to investigate associations considering covariates.
The strength of the association depends on the specificity and sensitivity of the inflammation pattern, as a kind of distinctive signature of the disease. A low association can also occur and means that the pattern with that set of variables allows weak inferences. If a substantial association due to COVID-19 is identified and it is also stable and representative of the target population, then these blood tests may be useful as proxies in surveillance protocols and screening interventions.
Theoretical framework
The theory of DAG provides graphical notation and a non-parametric probabilistic terminology to describe and evaluate causal relationships [Reference Pearl11]. The use of DAGs in epidemiology is emergent [Reference Foraita, Spallek, Zeeb, Ahrens and Pigeot12] and it is especially helpful with multiple potential confounders [Reference Foraita, Spallek, Zeeb, Ahrens and Pigeot12, Reference Greenland, Pearl and Robins13] that may introduce systematic bias [Reference Westreich10, Reference Glymour, Greenland, Rothman, Greenland and Lash14]. In DAGs, confounding associations between two variables may come from unblocked backdoor paths [Reference Greenland, Pearl and Robins13] that can be graphically identified because they share parent nodes. With a formal definition of backdoor path, for instance, DAG provides a general explanation of the Simpson's paradox [Reference Pearl15], where a phenomenon appears to reverse the sign of the estimated association in disaggregated subsets in comparison to the whole population. As a framework, DAG supplies analytical tools to evaluate which adjustment is mandatory (to predict a non-causal sign reverse) and which covariate should be omitted (to estimate the causal effect), thereby enforcing the elicitation of qualitative causal assumptions [Reference Pearl11, Reference Foraita, Spallek, Zeeb, Ahrens and Pigeot12, Reference Glymour, Greenland, Rothman, Greenland and Lash14].
A hypothetical DAG model with latent variable was conceived to evaluate the influence of various types of covariates on the focal association. Initially, we drew the main causal path from exposure to outcome. The DAG in Figure 1 starts from the infection by SARS-CoV-2 (exposure E) that, in some cases, leads to ‘Moderate-to-severe inflammation due to COVID-19’ (MSIC, hypothetical latent variable (E→MSIC)), and that inflammation causes two outcomes (mutual dependent relationship (H←MSIC→B)): (H) hospitalisation decision; and (B = {B1,…,Bk}) blood tests measured at hospital admission. The blood tests are selected according to their strength with hospitalisation. The focal outcomes under investigation are hospitalisation (H) and blood tests (B).
Initial hypothetical directed acyclic diagram with the main causal path of a moderate-to-severe COVID-19 inflammation (MSIC), one risk factor (RF3) and one confounder (BOC1) of the focal outcomes (H and B1). Legend: MSIC is a latent variable (unmeasured); outcomes are H: hospitalisation (H = {regular ward, semi-intensive care, ICU}); and B: blood test (B = {B1}).

Considering the initial DAG plausible, we hypothesised candidate covariates that are parents of the variables and may open back-door paths, Figure 1 shows one risk factor (RF3) and one confounder (BOC1). Figure 2 is an enhancement of the initial DAG with potential risk factors, confounders of the focal association and other covariates. Risk factors contribute directly to the development of COVID-19 inflammation (RF = {RF1,…,RFL}, mutual causation relationships (RFi→MSIC←RFj)) and they can also affect other variables. Figure 2 also distinguishes the covariates in terms of their confounding potential on the association between H and B. Covariates that affect both focal outcomes are identified as Both-Outcomes-Confounders (BOC = {BOC1,…,BOCm}), as they are correlated to the focal outcomes but not to COVID-19, and when affect one outcome as Single-Outcome-Covariate (SOC = {SOC1,…,SOCn}). These covariates are not exhaustive but to generate causal graph criteria for handling confounding factors.
Hypothetical directed acyclic diagram of a COVID-19 inflammation causal path with risk factors, confounders and other covariates. Legend: Exposure = SARS-CoV-2 (E) (acute respiratory syndrome coronavirus 2); outcomes are H: hospitalisation (H = {regular ward, semi-intensive care, ICU}), and B: blood tests (B = {B1,…,BK}); Covariates are RF: risk factor (RF = {RF1,…,RF4A, RF4B,RF5}), SOC: single outcome covariate (SOC = {SOC1,…,SOC5}) and BOC: both outcomes confounder (BOC = {BOC1,BOC2}).

Causal relationships in DAGs are defined with the do(.) operator that performs a theoretical intervention by holding constant the value of a chosen variable [Reference Pearl11, Reference Morgan and Winship16]. The association caused by COVID-19 inflammation can be understood as a comparison of the conditional probabilities of hospitalisation (H) given a set of blood tests (B) under intervention to SARS-CoV-2 infection (do(SARS-CoV-2) = 1) and intervention without infection (do(SARS-CoV-2) = 0):


where P(H|B = b,do(SARS-CoV-2 = 1)) represents the population distribution of H (hospitalisation) given a set of blood tests equal to b, if everyone in the population had been infected with SARS-CoV-2. And P(H|B = b’,do(SARS-CoV-2 = 0)) if everyone in the population had not been infected. Of interest is the comparison of these distributional probabilities for each intervention.
The interventions with do(.) generate two modified DAGs:
• The do(SARS-CoV-2 = 0) eliminates all arrows directed towards SARS-CoV-2 and to MSIC (Fig. 3). Ignoring the floating covariates, there are single arrow covariates pointing to hospitalisation (RF3, RF4A, SOC1, SOC3) and to blood tests (RF4B, SOC2, SOC4) and fork covariates pointing to both outcomes (BOC1, BOC2, RF5).
• Similarly, the modified graph of do(SARS-CoV-2 = 1) is equal to the former by adding single arrows from RF1 and RF2 to MSIC; and converting RF3, RF4A, RF4B and RF5 to fork types with arrows directed to MSIC.
As most covariates are either unmeasured or unknown, the effect of their absence can be evaluated following the d-separation concept [Reference Pearl11]. This concept attempts to separate (make independent) two focal sets of variables by blocking the causal ancestors (or back-door paths) and by avoiding statistical control for mutual causal descendants [Reference Pearl11]. Differently, to preserve the association between descendants of MSIC (Fig. 2), the focal outcomes (H and B) must remain d-connected (dependent on each other only through MSIC) and their relations with other covariates (that may introduce systematic bias) should be d-separated (conditionally independent). Figure 3, at the negative stratum, shows the confounders that may introduce systematic bias into both outcomes: BOC1, BOC2, RF5. The influence of these confounders on the focal association can be estimated with the modified model at the negative strata. A strong association of the outcomes without infection can be due to these confounders and suggest efforts to measure and control for them (as they have to be d-separated). Another pragmatic possibility is to exclude the noisy exams affected by these confounders. The other covariates are single arrows or they affect only one outcome (H or B) – their absence should not be critical because they are likely to be discarded due to poor discriminative performance.
Modified directed acyclic diagram with intervention at no exposure (do(SARS-CoV-2 = 0)) to evaluate the influence of covariates on the focal outcomes (H and B). Legend: Exposure = SARS-CoV-2 (E) (acute respiratory syndrome coronavirus 2); Outcomes are H: hospitalisation (H = {regular ward, semi-intensive care, ICU}), and B: blood tests (B = {B1,…,BK}); Covariates are RF: risk factor (RF = {RF1,…,RF4A, RF4B,RF5}), SOC: single outcome covariate (SOC = {SOC1,…,SOC5}) and BOC: both outcomes confounder (BOC = {BOC1,BOC2}).

Model assessment with naïve estimation
A naïve estimation of equations (1) and (2) is to assume that they are equal to their conditional probabilities available in a given dataset at each stratum. The cost of this simplification is that the analysis is no longer causal (in a counterfactual sense, because we are not contrasting the whole population infected and the whole population not infected [Reference Westreich10, Reference Pearl11, Reference Morgan and Winship16]) and the estimation becomes an association between two disjoint sets that each represents separate parts of the target population.


As hospitalisation is a dichotomous variable, this conditional probability, P(H|B = b, SARS-CoV-2 = 1), can be computed through a logistic regression of hospitalisation (dependent variable) given a set of blood tests at SARS-CoV-2 = 1. From the modified graph with intervention, P(H|B = b’, SARS-CoV-2 = 0) is calculated with the same model parameters but applied to cases at the negative stratum. It is implicit that there is the conditioning by a proper set of covariates for each model.
The concordance statistic of a logistic regression model is a measure of its predictive accuracy and is calculated as the area under curve (AUC) of the receiver operating characteristic (ROC) [Reference Westreich10, Reference Hosmer, Lemeshow and Sturdivant17]. A way to compare the discriminative ability of (3) and (4) is to subtract the AUC values at each stratum. A difference of 0.0 means no specific association with COVID-19 (i.e. equivalent responses for both strata) and 0.5 means perfect focal association of the outcomes and perfect differentiation among strata (i.e. perfect response at the positive stratum and random response at the negative).

The comparison of the models with AUC values at the negative stratum of SARS-CoV-2 is a necessary improvement in the assessment of prognostic models. This is similar to the null values concept in measures of associations of two groups with two outcomes [Reference Westreich10], but generalised for continuous multivariable prognostic models.
Model selection criteria
The above framework guided our approach to identify sets of blood tests associated with the hospitalisation due to COVID-19 together with
• Acceptable overall statistical properties of each model at the positive stratum of SARS-CoV-2, without and with bootstrap procedure.
• Consistency of the blood test coefficients across models with one variable and with multiple variables: considering causal effects, coefficients should not change signal when properly conditioned across models [Reference Pearl15].
• Elimination of models with high AUC at the negative stratum of SARS-CoV-2 and classification of the sets of blood tests by the difference of AUC between strata.
Source dataset
We identified one public observational database in which, at least partially, we could apply the framework and generate candidate prognostic models. Hospital Israelita Albert Einstein (HIAE), Sao Paulo/Brazil, made public a database (HIAE_dataset) [18] in the kaggle platform of 5644 patients screened with SARS-CoV-2 RT-PCR (reverse transcription–polymerase chain reaction) exam and a few collected additional laboratory tests during a visit to this hospital from February to March 2020. All blood tests were standardised to have mean of zero and unitary standard deviation. As this research is based on public and anonymised dataset, it was not revised by any institutional board. The logistic regression models were evaluated with IBM SPSS version 22.0 and the causal map with DAGitty.net version 3.0.
Results
Of the 5644 patients, 558 presented positive results for SARS-CoV-2 RT-PCR. Of the 170 patients hospitalised (in regular ward, semi-intensive unit or ICU), 52 were positive (9.3% rate of hospitalisation due to COVID-19). Patient age quantile, from 0 to 19, with sample mean of 9.32, was the only demographic variable available. Age was not conditionally independent with SARS-CoV-2 RT-PCR exam. Only 0.9% were positive in the age quantile 0, 1 and 2 (8 positive cases in 883 exams) while the incidence (not weighted) in the age quantile from 3 to 19 was 11.7% ± 2.6%.
In the first round, 15 blood tests were discarded because of poor performance of the univariate model when SARS-CoV-2 = 1 (Table 1). The remaining blood tests were creatinine, C-reactive protein (CRP), eosinophils, lymphocytes, monocytes and neutrophils (Table 1). Only creatinine was not related with the immune system directly and was evaluated as a risk factor. Of the 5644 patients, 602 patients presented values of eosinophils, 602 lymphocytes, 601 monocytes, 513 neutrophils, 506 CRP and 424 creatinine. Regarding missing cases, all observations with the required data were included (available-case analysis).
Univariate logistic regression models with blood tests for predicting hospitalisation

SARS-CoV-2 (acute respiratory syndrome coronavirus 2): result of the exam for SARS-CoV-2 RT-PCR (0 = negative; 1 = positive) (reverse transcription – polymerase chain reaction).
N, Cases included in the analysis; B, coefficient of the univariate logistic regression; P, coefficient significance; OR, odds ratio (exp(B)); CI, confidence interval. MCH, mean corpuscular haemoglobin; MCHC, mean corpuscular haemoglobin concentration; MCV, mean corpuscular volume; MPV, mean platelet volume; RDW, red blood cell distribution width; zName, means that the variable was converted and made available in a standardised format (mean = 0; standard deviation = 1).
a Age was converted in quantiles in the range of 0−19, mean value is 9.32.
b Blood tests selected for screening as potential predictors of COVID-19 inflammation.
CRP is a biomarker of various types of inflammation [Reference Lelubre19, Reference Black, Kushner and Samols20]. At SARS-CoV-2 = 1, the model with CRP and age had good discriminative ability with AUC of 0.872. But at SARS-CoV-2 = 0, AUC = 0.680 was also substantial and the difference of the discriminative ability Δ = 0.192 was moderate (candidate models should present higher differences); the corresponding ROC curve in Figure 4 shows overlapping curves up to sensitivity of 0.5−0.6. Models with CRP demonstrated sensitivity to resampling within the dataset [Reference Hosmer, Lemeshow and Sturdivant17], the coefficient significance moved from 0.005 to 0.144. Similar effects were found in models that include CRP with other blood tests and sensitivity to bootstrapping was reduced by dichotomising CRP (reactive/not-reactive). Models with CRP_reactive, neutrophils and age-generated AUC of 0.901 and 0.730 in the positive and negative strata (Δ = 0.171), and CRP_reactive, monocytes, neutrophils and age-generated AUC of 0.921 and 0.706, respectively (Δ = 0.215). CRP is a predictor of hospitalisation in general, but high levels of AUC at the negative stratum mean that CRP is a response with significant bias due to other causes than COVID-19. Differently from other prognostic studies [Reference Cheng21–Reference Bhargava26], CRP was excluded as candidate.
ROC curves of the logistic regression model for hospitalisation prediction with CRP controlled for age quantile at both strata (with and without exposure to SARS-CoV-2). Legend: Null – area of the null hypothesis model is 0.5.

The neutrophils to lymphocytes ratio (NLR) is considered a possible indicator of severity [Reference Cheng21, Reference Shang24, Reference Yang27, Reference Wang28] of COVID-19, but NLR could not be evaluated as all variables were standardised (division by zero). Lymphocytes presented inconsistent behaviour across models. Single exam models indicated lymphopenia at SARS-CoV-2 = 1, as expected [Reference Zhao29, Reference Huang and Pranata30]. But lymphocytes reversed the sign in the model with neutrophils and age (SARS-CoV-2 = 1), possibly, due to collinearity between them (Pearson's correlation of −0.925 and −0.937 at positive and negative strata, both significant at 0.01 (two-tail)). As there are indications of collinearity issues at both strata, lymphocyte and neutrophils should not be in the same model as independent variables, and this is an indication that NLR may be a noisy association with hospitalisation. As models with combinations of neutrophils were slightly better than with lymphocyte, lymphocyte was dropped from analysis.
In the second round, combinations of eosinophils, monocytes and neutrophils with age were tested systematically. Table 2 presents parameters of models combining eosinophils, monocytes and neutrophils (with age) and the best model with creatinine (as risk factor). Table 3 presents AUCs for each model with the difference of discriminative ability between strata.
Potential candidate logistic regression models for predicting hospitalisation with blood tests and age quantile (different models for each stratum)

SARS-CoV-2 (acute respiratory syndrome coronavirus 2): result of the exam for SARS-CoV-2 RT-PCR (0 = negative; 1 = positive) (reverse transcription – polymerase chain reaction).
B, coefficient of the variable; P, value of the statistical significance of the coefficient; OR, odds ratio of B (exp(B)); C.I., confidence interval.
Discriminative ability of potential candidate models for predicting hospitalisation from non-specific blood tests
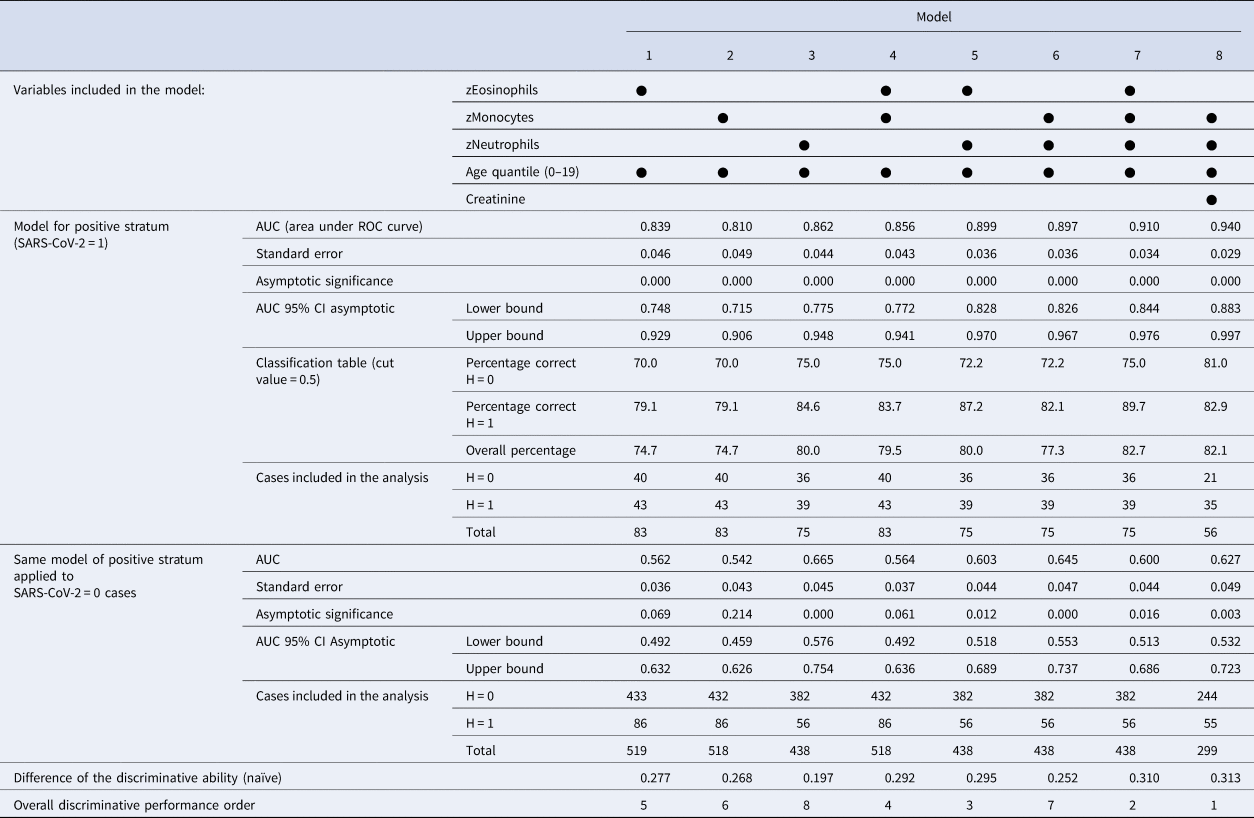
AUC, area under the ROC curve; CI, confidence interval;
H, hospitalisation (0 = false; 1 = regular ward, semi-intensive care, or ICU).
SARS-CoV-2 (acute respiratory syndrome coronavirus 2): result of the exam for SARS-CoV-2 RT-PCR (0 = negative; 1 = positive) (reverse transcription – polymerase chain reaction).
Considered individually, eosinophils, monocytes and neutrophils generated models with good performance to estimate the probability of hospitalisation (models 1, 2, 3 with AUC>0.810 at positive stratum). The combinations of these blood tests generated models (4, 5, 6, 7) with better discriminative ability (AUC>0.856 at SARS-CoV-2 = 1). The AUC at SARS-CoV-2 = 0 is a simplified measure of the systematic bias in both outcomes: models 1, 2 and 4 presented low values (with AUC<0.564) and the others presented relevant noisy associations (AUC from 0.600 up to 0.665), but with better difference in discriminative ability Δ>0.252 in models with two or more exams.
Two patterns of associations were more salient: (1) age as a risk factor with combinations of eosinophils, monocytes and neutrophils as predictors; (2) age and creatinine as risk factors with monocytes and neutrophils as predictors. The interpretation of the conditional probabilities will focus on models 7 and 8, but models with at least two blood tests (4−8) are potential candidate associations. Considering creatinine as a marker of the renal function, model 8 is the overall best model with significant coefficients at P < 0.05 and has the highest difference of discriminative ability between strata (Δ = 0.313). Comparative ROC curves for models 7 and 8 are shown in Figures 5 and 6, where there is a substantial discriminative difference between both strata of SARS-CoV-2; confidence intervals at 95% of AUC values are in Table 3.
ROC curves of model 7 to predict hospitalisation at both strata (with and without exposure to SARS-CoV-2). Legend: Null – area of the null hypothesis model is 0.5; model 7 – logistic regression with eosinophils, monocytes and neutrophils controlled for age quantile.

ROC curves of model 8 to predict hospitalisation at both strata (with and without exposure to SARS-CoV-2). Legend: Null – area of the null hypothesis model is 0.5; model 8 – logistic regression with monocytes and neutrophils controlled for creatinine and age quantile.

When the coefficients of model 7 (Table 2) are converted to conditional probabilities we find that at average age quantile (9.32) and average monocyte and neutrophil levels, there is a hospitalisation probability of 51.1% with eosinophils at −1 standard deviation (s.d.); and 90.2% when age quantile is 15. Model 8 with creatinine has different responses: age quantile coefficient is more pronounced and the odds ratio of creatinine is steep (8.338), so average levels of creatinine result in a probability of hospitalisation >50% for age quantile >9 (with monocytes and neutrophils at average). When creatinine is + 1 s.d. at age quantile 9, hospitalisation probability is 85.9% (monocytes and neutrophils at average). Only below average levels of creatinine lower hospitalisation probabilities. Monocytes and neutrophils are also steeper than model 7. At age quantile 9, + 1/2 s.d. of creatinine, −1/2 s.d. of monocytes and + 1/2 s.d. of neutrophils result in a hospitalisation probability of 92.5%.
Model biases may be due to missing cases selection. Most likely, missing data are not at random (MNAR). We performed the bootstrapping procedure to identify potential sensitivity to resampling and, indirectly, to selection bias. The selected models maintained the magnitude and statistical significance of the coefficients. Apparently, as no significant deviation was detected, the missing cases bias may not be an issue.
ROC and AUC calculations used the same data for model fitting. Because of limited sample size, it was not suitable to apply the approach of splitting the database for training and then prediction. After dividing the sample in two groups, most coefficients were not significant at P > 0.10 (Table 4) at least in one group. Notwithstanding, classification tables were coherent between sub-sets and we found no clear indication of model misspecification.
Tentative parameters for models 4−8 with split dataset at the positive stratum of SARS-CoV-2: sample size is unsuitable for training and then prediction

Note: The cut off at 5030 cases was selected to generate valid parameters with similar quantities of available cases at SARS-CoV-2 = 1 because lower/higher thresholds generated invalid parameters for model 8 due to perfect discrimination.
SARS-CoV-2, acute respiratory syndrome coronavirus 2; RT-PCR, reverse transcription – polymerase chain reaction; B, coefficient of the variable; P, value of the statistical significance of the coefficient; OR, odds ratio of B (it is equal to exp(B)); CI, confidence interval.
Results of classification table cut-off value of 0.5 with percentage of correct non-hospitalisation (H = 0) and correct hospitalisation (H = 1).
Discussion
We focused on models with discriminative ability to identify peculiar responses in the transition from moderate-to-severe inflammation only due to COVID-19. The AUC evaluation at the negative SARS-CoV-2 stratum to estimate the influence of unwanted confounders into the focal association together with equivalent criteria of severity state at both strata is, to the best of our knowledge, a needed improvement in prognosis studies of COVID-19.
In comparison to other prediction studies, we identified a few focused on the transition from moderate-to-severe cases of COVID-19 [Reference Cheng21–Reference Wang28]. None of them considered data from the negative stratum of SARS-CoV-2, therefore, these models are biased by not excluding noisy predictors.
We eliminated variables with ‘high’ AUC at SARS-CoV-2 = 0, so that variables with more peculiar responses to COVID-19 were included. Reactive levels of CRP together with SARS-CoV-2 RT-PCR exam may be a predictor of hospitalisation, but this can happen due to causes other than COVID-19 (most cases of COVID-19 are asymptomatic to mild). To include it in a model, one should control for all other causes of CRP reactive.
We evaluated age and creatinine as risk factors. Controlling for age improved the AUC of all models at the positive stratum of SARS-CoV-2. The difference between risk factor and outcome among blood tests is subtle. The emergent literature is cautious about whether eosinopaenia may be a risk factor [Reference Lindsley, Schwartz and Rothenberg31] and whether creatinine (and other renal markers) may be associated with COVID-19 renal inflammatory response [Reference Qian, Wang and Liu32]. As an acute inflammatory kidney response to COVID-19, the interpretation changes and further refinement of the framework is necessary. If eosinopaenia is a risk factor, the prevalence of this condition should be considered and must be properly diagnosed at admission, and the models should be reviewed with new data.
As we drop noisy predictors, we are effectively dealing with hypothesis about the physiopathology of COVID-19 inflammation. Although not as frequent as the mentions of neutrophils, there are studies on the complex role of eosinophils [Reference Lindsley, Schwartz and Rothenberg31, Reference Xie33] and monocytes [Reference Alzaid34, Reference Martinez35] in COVID-19 inflammation indicating eosinopaenia in severe cases and monocytopaenia in some phase of the cytokine storm and other COVID-19 pathologies [Reference Pence36].
We selected two patterns of blood tests that are associated with hospitalisation due to COVID-19 inflammation: age with combinations of eosinophils, monocytes and neutrophils; and age and creatinine with monocytes and neutrophils. The model findings are aligned with the known physiopathology of COVID-19 but in a more integrative framework of analysis (not as individual predictors, but as a set that is related to risk factors). The selected blood tests are broadly available even in regions with scarce health care resources. It is unlikely that we will have just one or two overall best models; given different sets of risk factors, we should expect a few representative patterns of the COVID-19 inflammation from moderate to severe.
Limitations and future directions
The models are candidates only and the results cannot be representative beyond the patient health profiles of this reference hospital in Sao Paulo/Brazil that attends a high social-economic segment [Reference Teich37]. The sample refers to the initial phase of the pandemics in Brazil and the patterns may change with medicine prescriptions and other adaptations of SARS-CoV-2. The reduced quantity of available cases did not allow the dataset split for training and prediction. Further efforts are needed to increase internal and external validity across populations, as the prognostic ability is also a function of the variability of the development of COVID-19 inflammation.
As there is no unambiguous way to characterise ‘moderate-to-severe COVID-19 inflammation’, the inclusion of an unmeasured variable reduces the predicted conditional independences from the DAG. But still this framework can help in the identification and estimation of risk factors. This cross-sectional data (single point time) cannot inform if creatinine (or eosinophil) is risk factor or effect of COVID-19 inflammation. In future data collection efforts, participants should be followed over time, from diagnosis to hospitalisation; ideally from exposure throughout the lifecycle and also with the follow-up of negative cases.
Causal studies are intrinsically predictive [Reference Westreich10], therefore, we need to advance prognosis research within causal frameworks. As most studies will be observational, data collection with ample selection of variables for matching estimators (e.g. stratification) [Reference Morgan and Winship16] will be required to reduce systematic bias.
All candidate models can be reproduced from the dataset [18]. We believe most hospitals can apply this framework to generate similar models appropriate to the target population in which they are inserted by making efforts to collect blood tests and potential risk factors at admission, and other clinical data. By making these databases public (anonymised and with standardised data), they will allow future external validation in larger target populations.
Finally, in the wider context of COVID-19 epidemiology, the collapse of health systems due to opportunistic pathogens is a symptom of threats that requires system-level measures during and after the pandemics [Reference Cheong and Jones38]. This research is concerned with hospital care. As a bottleneck, even small gains may have multiplicative effects on health systems. In countries with porous containment efforts, hospital occupancy is a critical metric [Reference Martins39] to alternate between ‘soft lockdown’ and economic activity with ‘constrained mobility’. As some regions with sustained transmission are hesitant and being pushed towards these states, they are poorly capturing the benefits of the switching strategy (Parrondo's paradox applied to epidemics [Reference Cheong, Wen and Lai40]) – because they are struggling in trial and error mode to establish thresholds of when to restrain (and open) and at what pace. Due to the fast saturation of hospital infra-structures with overshooting in these regions, the tendency of excessive losses in each transition is hard to manage. In this context, we believe that the application of prognosis tools can improve the timely access to supportive care in countries with sustained COVID-19 transmission.
Acknowledgements
We are grateful to Antonio Magno Lima Espeschit and Sonia Mara de Andrade who contributed with suggestions to this research. We are also indebted to Hospital Israelita Albert Einstein for making the dataset available, and the referees for their detailed comments.
Author contributions
G. Ishikawa: Conceptualisation, methodology and formal analysis. G. Argenti: Conceptualisation, formal analysis and clinical and epidemiological validation. C. B. Fadel: Clinical and epidemiological validation and critical review. All authors: Writing, editing, visualisation, review and final approval of the paper
Conflict of interest
The authors declare no conflicts of interest.
This paper has not been published previously in whole or part.
The data that support the results of this study are openly available in reference number [18].
Although this research received no specific grant from any funding agency, commercial or not-for-profit sectors, as institutionally required we inform that ‘this study was financed in part by the Coordenacao de Aperfeicoamento de Pessoal de Nivel Superior – Brasil (CAPES) – Finance Code 001’.


 Open access