


Introduction
Bipolar disorder (BD) is an overarching diagnostic class with two primary subtypes: bipolar I disorder (BD I) and bipolar II disorder (BD II). BD I is characterized by at least one prior manic episode (i.e. at least one week of manic symptoms), and BD II by both a prior hypomanic (i.e. at least four days of manic symptoms that are not functionally impairing) and major depressive episode (American Psychiatric Association, 2013). The operationalization of these subtypes reflects conceptualizations of BD I and II as part of an illness continuum ranging from schizoaffective to unipolar depression, with BD I lying closer to the former and BD II to the latter (Gershon, Reference Gershon1982). Although BD I is traditionally considered the more clinically severe version of these two disorders, extant research to support this claim, or more generally distinguish these two subtypes beyond their diagnostic definitions, is limited and mixed. For example, comparisons of BD I and BD II have revealed mixed findings regarding whether these subtypes display differences in comorbidity patterns (Baek et al., Reference Baek, Park, Choi, Kim, Choi, Ha and Hong2011; Loftus et al., Reference Loftus, Scott, Vorspan, Icick, Henry, Gard and Etain2020), suicidal behaviors (Dunner, Reference Dunner2004; Karanti et al., Reference Karanti, Kardell, Joas, Runeson, Pålsson and Landén2020; Novick, Swartz, & Frank, Reference Novick, Swartz and Frank2010), or neuroimaging outcomes (Hozer & Houenou, Reference Hozer and Houenou2016). Further, while the broad bipolar diagnostic class is associated with various negative health outcomes, including physical inactivity and related comorbidities (McElroy & Keck, Reference McElroy and Keck2012), it is unclear whether these associations are primarily driven by one of the two subtypes. The current study investigates the etiological differences that characterize the underlying genetic risk pathways of these two major BD subtypes.
Challenging the model that BD I is simply a more severe version of BD II genetic epidemiology has found that the subtypes ‘breed true’. That is, relatives of individuals with a particular BD subtype exhibit heightened risk for that subtype, indicating risk pathways are at least partially unique to a given BD subtype (Andreasen, Reference Andreasen1987; Heun & Maier, Reference Heun and Maier1993). In the past decade, genome-wide association studies (GWAS) of complex phenotypes have started to unpack the specific genetic variants associated with different outcomes. The most recent bipolar GWAS from the Psychiatric Genomics Consortium (PGC) uncovered 64 significantly associated genetic variants (Mullins et al., Reference Mullins, Forstner, O'Connell, Coombes, Coleman, Qiao and Andreassen2021). In addition, GWAS data for each BD subtype were used to examine the overall genetic signal for BD I and BD II, revealing SNP-based heritability estimates $h_{SNP}^2$ of 21.2% and 11.6%, respectively. The genetic correlation (rg) was significantly different from 1, indicating the presence of subtype-specific signal. However, research into what might explain this divergent genetic signal is limited.
Bivariate genomic methods such as LD-score regression (LDSC; Bulik-Sullivan et al., Reference Bulik-Sullivan, Loh, Finucane, Ripke, Yang, Patterson and Neale2015) allow for estimating genetic overlap across two traits with GWAS summary statistics. As these GWAS summary statistics are often publicly available and need not come from the same participant sample, this offers the unique opportunity to investigate genetic overlap across a wide range of rare and even mutually exclusive outcomes. Indeed, progress in understanding BD subtypes using phenotypic approaches has likely been stymied, at least in part, by the pragmatic difficulty of recruiting a participant sample of sufficient size for both subtypes. Genomic structural equation modeling (Genomic SEM; Grotzinger et al., Reference Grotzinger, Rhemtulla, de Vlaming, Ritchie, Mallard, Hill and Tucker-Drob2019) is a multivariate framework for modeling the genetic overlap estimated from LDSC. In the present study, we apply Genomic SEM and its recent extensions to examine genetic convergence and divergence across bipolar subtypes. At the genome-wide level, we explicitly model and statistically compare the genetic correlations across BD subtypes and a range of cognitive, health, interpersonal, and psychiatric outcomes. We go on to apply transcriptome-wide SEM (T-SEM; Grotzinger, de la Fuente, Davies, Nivard, & Tucker-Drob, Reference Grotzinger, de la Fuente, Davies, Nivard and Tucker-Drob2022) to identify genes whose expression is associated with general or subtype-specific BD risk. These results provide biological support for many of the clinically observed differences in subtype-specific outcome measures, aid in the identification of elevated risk factors associated with each subtype, and further our understanding of the etiological convergences and divergences across bipolar subtypes.
Methods
GWAS datasets
GWAS summary statistics for BD I (25 060 cases, 449 978 controls) and II (6781 cases, 364 075 controls) were utilized from the most recent PGC Freeze 3 GWAS (Mullins et al., Reference Mullins, Forstner, O'Connell, Coombes, Coleman, Qiao and Andreassen2021). Cases were defined using either medical records or internationally recognized diagnostic manuals (i.e. DSM-IV, ICD-9, ICD-10) administered by trained interviewers and clinicians. We utilize publicly available European ancestry summary statistics for 104 external traits, selected based on a comprehensive consideration of their clinical relevance across cognitive, interpersonal, health, and psychiatric domains. Among this initial pool of 104 external traits, 98 had $h_{SNP}^2 \;$ Z statistics greater than the recommended cut-off of 4 put forth by the original LDSC developers for producing interpretable estimates of genetic covariance (Bulik-Sullivan et al., Reference Bulik-Sullivan, Loh, Finucane, Ripke, Yang, Patterson and Neale2015). These 98 traits were carried forward for Genomic SEM analyses. A summary of each dataset used in this study with sample characteristics (i.e. case/control numbers) is provided in online Supplementary Table S1.
Genomic SEM
A standard set of quality control filters was first applied to all GWAS summary statistics using the munge function within Genomic SEM. This included filtering to HapMap3 SNPs and, when this information was available, removing SNPs with a minor allele frequency (MAF) < 0.01 and with an imputation score (INFO) < 0.9. These ‘munged’ summary statistics were subsequently used as input to the multivariable version of ldsc implemented in Genomic SEM, which estimates the genetic covariance and sampling covariance matrices across included traits. The genetic covariance matrix contains SNP-based heritability estimates on the diagonal and genetic covariances on the off-diagonal. For binary traits, these estimates were converted to the more interpretable liability scale using the population prevalence from the corresponding publication and the sum of effective sample size across cohorts contributing to the GWAS (Grotzinger, de la Fuente, Privé, Nivard, & Tucker-Drob, Reference Grotzinger, de la Fuente, Privé, Nivard and Tucker-Drob2023). The sampling covariance matrix contains squared standard errors on the diagonal (the sampling variances) and sampling covariances on the off-diagonal, which index sampling dependencies that will arise when there is participant sample overlap. LD weights used to estimate the regression model in LDSC were obtained from 1000 Genomes Phase 3 European LD Scores, excluding the major histocompatibility complex due to complex LD structure in this region that can bias estimates.
Before running models, the genetic covariance and sampling covariance matrices were transformed into genetic correlation and sampling correlation matrices to examine differences in the proportion of genetic overlap with other traits, accounting for differences in the overall $h_{SNP}^2 \;$ of the two BD subtypes (results examining the genetic covariances are reported in online Supplementary Table S2). These standardized LDSC matrices were then used as input to a series of models specified within Genomic SEM. The first was a saturated model in which the genetic overlap across the BD subtypes and each external trait were estimated. Next, a constrained model was specified in which the relationships between each BD subtype and the external trait were fixed to both be equal. The p value associated with the constrained model's χ2 statistic indicates decrement in model fit, relative to the fully saturated model, due to imposing the equality constraint. Significant values then indicate that the BD subtypes have significantly different r g's with the external trait. Separate models were run for each external trait and a Bonferroni-corrected threshold (p < 5.10 × 10−4 = 0.05/98 traits) was applied to determine statistical significance.
To better contextualize our results within the existing illness severity model of BD, we fit a series of theoretically informed models with MDD and SCZ as correlated predictors of both BD subtypes in a genetic multiple regression model. This model assesses the effect each disorder exerts on BD subtypes, while also modeling the contribution of their risk pathways, enabling the estimation of unique and shared contributions that these disorders have on each subtype. We examined all four possible sets of model constraints for this model, with comparisons not done in sequential order. That is, for each of the four models, all other parameters were freely estimated aside from the two parameters with an imposed equality constraint. A final model was then estimated that included any equality constraints that could be imposed without a significant decrement in model fit. Significance was defined here using a Bonferroni-corrected threshold for the four comparisons of p < 0.013. Lastly, the genetic variance for each BD subtype for this model was partitioned based on the genetic signal shared with MDD and SCZ. The residual or unique variance of each subtype was then further broken down into shared and unique residual genetic variance between the subtypes.
Transcriptome-wide SEM
We utilized T-SEM to identify tissue-specific gene expression shared and unique to BD I and II (Grotzinger et al., Reference Grotzinger, de la Fuente, Davies, Nivard and Tucker-Drob2022). Univariate transcriptome-wide association studies (TWAS) uncover the relationship between gene-expression and a single trait through summary-based transcriptomic imputation. T-SEM reflects a multivariate extension of TWAS that allows for examining unique and shared gene-expression across constellations of genetically overlapping traits.
First, FUSION was used to perform univariate, summary-based TWAS for both BD subtypes (Gusev et al., Reference Gusev, Ko, Shi, Bhatia, Chung, Penninx and Pasaniuc2016). Fourteen sets of publicly available functional weights were utilized from two data resources: (i) the Genotype-Tissue Expression project (GTEx v8), with functional weights for 13 brain tissue types, and (ii) PsychEncode, with functional weights for the prefrontal cortex (Gandal et al., Reference Gandal, Zhang, Hadjimichael, Walker, Chen, Liu and Abyzov2018; The GTEx Consortium, 2020). These univariate FUSION statistics were then used as input to the read_fusion function in Genomic SEM, which backs out the gene expression-phenotype covariances that are standardized with respect to the phenotypic variance. This allows these gene expression estimates to be added to the LDSC genetic covariance matrices as they are now on the same scale. Finally, the userGWAS function was used to estimate the effect of gene expression on a latent BD factor defined by the two BD subtypes. As this was a two-indicator factor, the factor loadings of the two BD subtypes were constrained to be equal in order to ensure model identification.
These analyses produced two sets of output: (i) the relationship between gene expression and the latent BD factor and (ii) a Q Gene statistic that identifies patterns of gene expression that do not operate via the factor and are thereby likely to be subtype-specific in their effect. We have previously demonstrated via simulation that Q Gene is typically significant when a gene has directionally discordant associations with the traits that define the factor or shows a much stronger association with one trait (Grotzinger et al., Reference Grotzinger, de la Fuente, Davies, Nivard and Tucker-Drob2022). Thus, Q Gene operates to identify tissue-specific gene-expression that is likely discordant between the two subtypes. Hits on the factor were defined as genes that were significant at a Bonferroni-corrected threshold of p < 5.90 × 10⁻⁷ (0.05/66 571 gene expression estimates) that were not also significant for Q Gene. Finally, over-representation analysis (ORA) was conducted using the WebGestalt package (Liao, Wang, Jaehnig, Shi, & Zhang, Reference Liao, Wang, Jaehnig, Shi and Zhang2019) to identify gene sets that are significantly enriched among BD factor hits. We tested 11 520 gene sets, which represent clusters of genes that have been previously identified to share functional properties or exhibit shared associations with external traits.
Results
Genetic overlap with external traits
A significant rg of 0.83 (s.e. = 0.01) was observed between the two subtypes. Among the 98 examined external traits, 22 exhibited significant divergences at a Bonferroni-corrected significance threshold, and 44 were significantly associated with the broad BD construct. Genetic correlations for the top 25 most significant divergences across BD subtypes are presented in Fig. 1. A full list of genetic correlations for each BD subtype is presented in online Supplementary Table S3 and Fig. S1. Significant rg's for the broad BD construct are presented in online Supplementary Fig. S2 (online Supplementary Table S4 for the full list).
Top 25 most significant genetic correlations between BD subtypes and external traits. Traits sorted top to bottom by ascending χ2difference p values. Error bars depict 95% confidence intervals. Dashed bars represent traits not surpassing a Bonferroni-corrected significance threshold of 5.10 × 10⁻⁴ (0.05/98 traits).
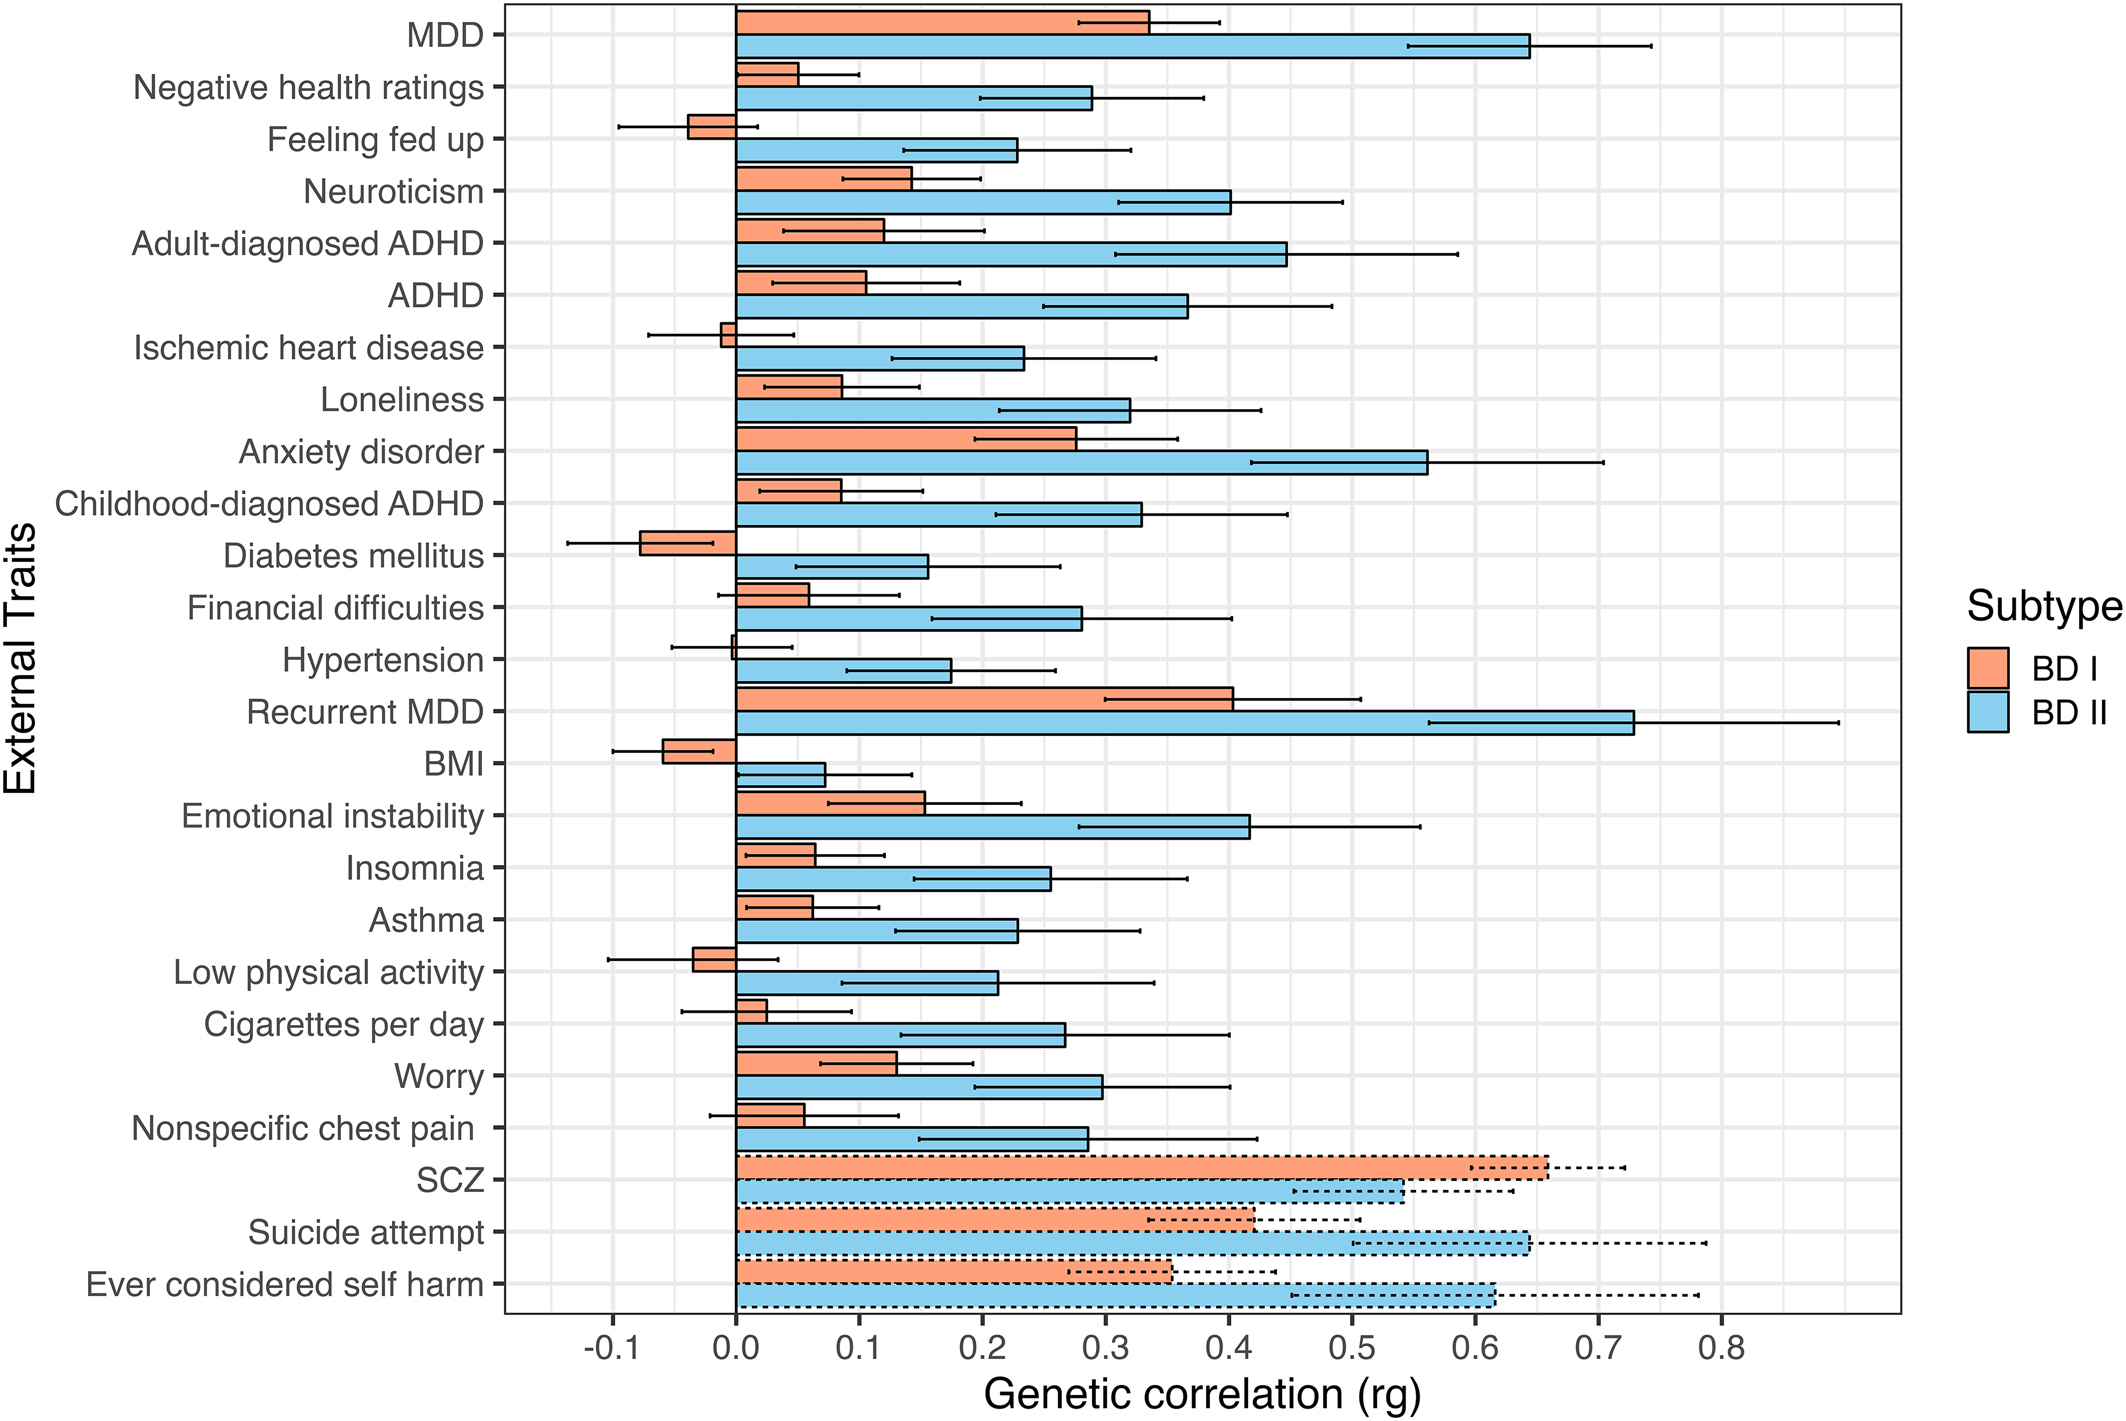
Across a broad range of psychiatric, interpersonal, and non-psychiatric medical outcomes, significant divergences in the underlying genetic risk pathways between each BD subtype are observed, with BD II consistently exhibiting greater levels of shared risk with external outcomes. We consider more specific results across different domains of external traits directly below.
Psychiatric disorders and symptoms
We identified several differences where BD II exhibited elevated risk-sharing relative to BD I across a range of disorders. For example, BD II had higher genetic overlap with ADHD (BD I: rg = 0.11, s.e. = 0.04; BD II: rg = 0.37, s.e. = 0.06, χ2 p = 2.85 × 10⁻⁷), a finding that replicated when splitting across ADHD diagnosed in childhood (BD I: rg = 0.09, s.e. = 0.03; BD II: rg = 0.33, s.e. = 0.06, χ2 p = 7.53 × 10⁻⁶), and adulthood (BD I: rg = 0.12, s.e. = 0.04; BD II: rg = 0.45, s.e. = 0.07, χ2 p = 1.04 × 10⁻⁷). BD II also showed a stronger relationship with a number of disorders in the internalizing space, including anxiety disorders (BD I: rg = 0.28, s.e. = 0.04; BD II: rg = 0.56, s.e. = 0.07, χ2 p = 2.12 × 10⁻⁶), MDD (BD I: rg = 0.34, s.e. = 0.03; BD II: rg = 0.64, s.e. = 0.05, χ2 p = 4.06 × 10⁻¹⁴), and recurrent MDD (BD I: rg = 0.40, s.e. = 0.05; BD II: rg = 0.73, s.e. = 0.09, χ2 p = 2.37 × 10⁻⁵).
In addition to the disorders themselves, several differences were observed between BD subtypes and psychiatric symptoms or closely linked personality traits. These differences can generally be described as reflecting a stronger association between different aspects of internalizing and BD II relative to BD I. This included insomnia (BD I: rg = 0.06, s.e. = 0.03; BD II: rg = 0.26, s.e. = 0.06, χ2 p = 5.78 × 10⁻⁵); feeling fed up (BD I: rg = −0.04, s.e. = 0.03; BD II: rg = 0.23, s.e. = 0.05, χ2 p = 1.34 × 10⁻⁹); mood instability (BD I: rg = 0.15, s.e. = 0.04; BD II: rg = 0.42, s.e. = 0.07, χ2 p = 4.48 × 10⁻⁵); feelings of worry (BD I: rg = 0.13, s.e. = 0.03; BD II: rg = 0.30, s.e. = 0.05, χ2 p = 3.46 × 10⁻⁴); and neuroticism (BD I: rg = 0.14, s.e. = 0.03; BD II: rg = 0.40, s.e. = 0.05, χ2 p = 1.47 × 10⁻⁹).
Theoretically informed follow-up analysis
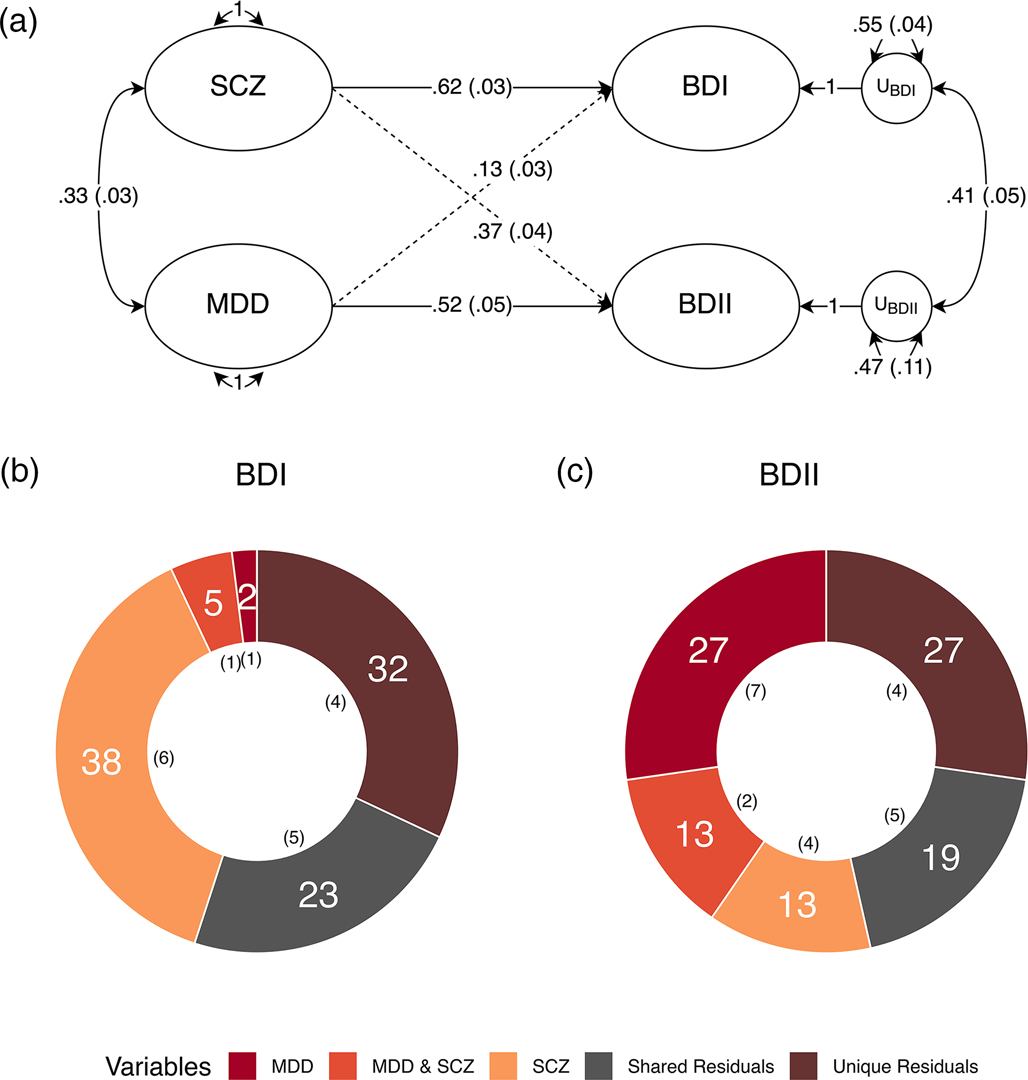
We went on to run a theoretically informed follow-up analysis with MDD and SCZ as correlated predictors of each subtype. All four equality constraints resulted in significant decrements in model fit (ps ≤ .013), indicating that MDD and SCZ do not exhibit equal genetic overlap within or across the BD subtypes. The fully saturated multiple regression model with no constraints was used to partition the genetic variance of each BD subtype into the following groups: the genetic variance explained by MDD; the genetic variance explained by SCZ; the genetic variance shared between MDD and SCZ; and the genetic variance shared between (i.e. covarying residuals) and unique (i.e. unique residuals) to each subtype (Fig. 2). The genetic variance in BD I reflected: 37.9% (s.e. = 5.5%) SCZ, 1.7% (s.e. = 1.0%) MDD, 5.3% (s.e. = 1.3%) shared variance between MDD and SCZ, 22.8% (s.e. = 4.7%) shared residual variance with BD II, and 32.3% (s.e. = 4.1%) residual variance unique of BD II. BD II was partitioned into 13.5% (s.e. = 4.3%) SCZ, 27.2% (s.e. = 6.7%) MDD, 12.8% (s.e. = 1.7%) shared variance between MDD and SCZ, 19.3% (s.e. = 4.9%) shared residual variance with BD I, and 27.3% (s.e. = 4.2%) residual variance unique of BD I. Taken together, these findings indicate that BD I and II are associated with both shared and unique genetic pathways across MDD and SCZ, while BD I and II have greater relative associations with MDD and SCZ, respectively. These results further demonstrate that neither of the BD subtypes are merely a reflection of amalgamated genetic components of MDD and SCZ. Rather, both subtypes have a large residual genetic component that has sizeable unique and shared components across the subtypes.
Major depression and schizophrenia as correlated predictors of the bipolar subtypes. (a) Standardized results using Genomic SEM to construct a model with MDD and SCZ as correlated predictors of BD I and II. Solid and dashed single headed arrows represent regression paths. Curved double headed arrows represent correlations among the (residual) genetic variance components for each trait. Each U represents residual variances for BD type I and II. (b, c) Percent variance within BD I and II accounted for by signal unique to MDD, unique to SCZ, shared by MDD and SCZ, unique to each subtype (unique residuals) and shared between the subtypes (shared residuals). Numbers in parentheses in both panels reflect the corresponding standard error.
Interpersonal and social functioning
We observed patterns of increased genetic risk shared between BD II and outcomes related to interpersonal and social functioning. More specifically, BD II was more strongly associated with increased loneliness (BD I: rg = 0.09, s.e. = 0.03; BD II: rg = 0.32, s.e. = 0.05, χ2 p = 1.18 × 10⁻⁶) and financial difficulties (BD I: rg = 0.06, s.e. = 0.04; BD II: rg = 0.28, s.e. = 0.06, χ2 p = 1.20 × 10⁻⁵).
Non-psychiatric medical conditions and health traits
Non-psychiatric medical disorders more strongly associated with BD II included ischemic heart disease (BD I: rg = −0.01, s.e. = 0.03; BD II: rg = 0.23, s.e. = 0.06, χ2 p = 5.41 × 10⁻⁷), diabetes mellitus (BD I: rg = −0.08, s.e. = 0.03; BD II: rg = 0.16, s.e. = 0.06, χ2 p = 8.04 × 10⁻⁶), hypertension (BD I: rg = −0.003, s.e. = 0.025; BD II: rg = 0.17, s.e. = 0.04, χ2 p = 1.76 × 10⁻⁵), and asthma (BD I: rg = 0.06, s.e. = 0.03; BD II: rg = 0.23, s.e. = 0.05, χ2 p = 6.33 × 10⁻⁵). In addition to the conditions themselves, BD II also exhibited stronger associations with symptoms and negative health traits, such as negative self-ratings of health (BD I: rg = 0.05, s.e. = 0.03; BD II: rg = 0.29, s.e. = 0.05, χ2 p = 1.74 × 10⁻¹⁰), physical inactivity (BD I: rg = −0.04, s.e. = 0.04; BD II: rg = 0.21, s.e. = 0.07, χ2 p = 7.44 × 10⁻⁵), number of cigarettes smoked per day (BD I: rg = 0.03, s.e. = 0.04; BD II: rg = 0.27, s.e. = 0.07, χ2 p = 1.08 × 10⁻⁴), and nonspecific chest pain (BD I: rg = 0.06, s.e. = 0.04; BD II: rg = 0.29, s.e. = 0.07, χ2 p = 4.46 × 10⁻⁴).
T-SEM
For each BD subtype, 66 571 tissue-specific gene expression estimates were obtained. Univariate TWAS for each of the disorders revealed 211 hits for BD I and one hit for BD II (online Supplementary Table S5 for BDI hits; online Supplementary Table S6 for BD II hits). T-SEM revealed 76 hits on the BD factor (Fig. 3 for Miami plot; online Supplementary Table S7 for list of all T-SEM hits). As many genes are present across multiple tissues, these 76 hits reflect 35 unique gene IDs. The top 5 most significant hits for the BD factor were: LINC02033, GNL3, ZSCAN9, FADS1, and PRSS16. Follow-up ORA analyses indicated significant enrichment for the BD factor gene expression hits and a gene-set previously implicated in the overarching bipolar diagnostic class (p = 1.83 × 10⁻⁶; (Liao et al., Reference Liao, Wang, Jaehnig, Shi and Zhang2019). Online Supplementary Fig. S3 visually depicts that T-SEM is working as expected. More specifically, we observe that univariate BD I TWAS hits that were identified as hits for the BD factor were far more significant for BD II than genes that were hits for BD I but not the overarching BD factor. Thus, T-SEM is functioning to identify patterns of gene expression specifically associated with shared risk pathways across the BD subtypes. No Q Gene hits surpassed a Bonferroni-corrected significance threshold. A list of the top 10 most significant Q Gene hits is provided in online Supplementary Table S8, many of which showed divergent directions of effects across subtypes.
Miami plot of gene expression hits on the bipolar factor. The top and bottom orange bar represents Z statistics surpassing a Bonferroni-corrected significance threshold of 7.50 × 10⁻⁷ (0.05/66 571 imputed gene expression estimates). Positive and negative values depict upward and downward patterns of gene expression associated with the BD factor, respectively. The most significant genes are labeled as dots colored to reflect their tissue expression.

Discussion
Providing support for a diagnostic manual that describes separate BD subtypes, the current findings identified 22 clinically relevant traits and disorders that had significantly discrepant genetic overlap with BD I and II. Challenging the notion that BD II is simply a less severe presentation along the BD continuum, BD II was found to have significantly larger genetic correlations across all divergent outcomes. Although the point estimate for the genetic correlation between BD I and SCZ was larger, the difference from BD II was nonsignificant and the genetic correlation between BD II and SCZ was still sizeable. It is also striking that BD I's elevated association with SCZ does not also result in greater downstream associations with the other outcomes examined.
The specific traits found to be more strongly associated with BD II can generally be summarized as reflecting different dimensions of the internalizing space, including the disorders themselves (i.e. anxiety disorders; MDD), their symptoms (insomnia; feeling fed up; feeling worried), and their clinical correlates (loneliness; negative self-ratings of health). These results are broadly consistent with prior phenotypic findings indicating larger associations, relative to BD I, between BD II and: frequency of depressive episodes (Baek et al., Reference Baek, Park, Choi, Kim, Choi, Ha and Hong2011), comorbid anxiety disorders (Mantere et al., Reference Mantere, Melartin, Suominen, Rytsälä, Valtonen, Arvilommi and Isometsä2006), general psychiatric comorbidity (Karanti et al., Reference Karanti, Kardell, Joas, Runeson, Pålsson and Landén2020), reduced social functioning (Baek et al., Reference Baek, Park, Choi, Kim, Choi, Ha and Hong2011), and insomnia (Steinan et al., Reference Steinan, Scott, Lagerberg, Melle, Andreassen, Vaaler and Morken2016). Though it did not surpass Bonferroni-corrected significance threshold, the point estimate for the genetic correlation with BD II was higher relative to BD I for both suicide attempts and self-harm ideation, which we highlight as this has also been described phenotypically (Tondo, Miola, Pinna, Contu, & Baldessarini, Reference Tondo, Miola, Pinna, Contu and Baldessarini2022). Given the pattern of current and prior findings, it is perhaps unsurprising that BD II has also been linked to a greater burden of illness (Dell'Osso et al., Reference Dell'Osso, Holtzman, Goffin, Portillo, Hooshmand, Miller and Ketter2015).
Several mechanisms may explain the observed pattern of differences. Results from the follow-up model suggest that relative to BD I, there is greater genetic overlap between BD II and MDD that is unique of shared signal with SCZ. This substantially larger proportion of MDD signal within BD II may explain elevated genetic risk sharing between BD II and the external traits significantly diverging from BD I. Indeed, the phenotypic literature has found that many of BD II's elevated genetic correlations (i.e. insomnia, interpersonal deficits, physical inactivity) are also strongly associated with MDD (Barrett & Barber, Reference Barrett and Barber2007; Schuch et al., Reference Schuch, Vancampfort, Firth, Rosenbaum, Ward, Reichert and Stubbs2017; Staner, Reference Staner2010). In addition, BD II's diagnostic criteria, requiring both a prior hypomanic and depressive episode, creates more potential symptom combinations, which may result in higher levels of heterogeneity within this diagnostic class. In turn, this heterogeneity may result in a greater number of distinct symptom clusters within BD II, thereby giving rise to a greater number of potential associations with external traits. Results from the follow-up model also reveal a large proportion of unique SCZ signal within BD I. The lack of a meaningful quantity of this signal in BD II may provide an explanation for BD I's significantly increased rates of psychotic symptoms, relative to its counterpart (Aminoff et al., Reference Aminoff, Onyeka, Ødegaard, Simonsen, Lagerberg, Andreassen and Melle2022).
We find that BD subtypes are not simply blends of MDD and SCZ, with approximately half of the genetic variance unexplained by these two predictors. These large residual genetic variance components were also found to contain both shared and unique signal across the BD subtypes. Taken together, this tentatively supports BD as a separate diagnostic class with distinguishable subtypes within this diagnostic class. The considerable proportion of unique variability within each subtype also supports their stratification in recent GWAS of the overarching disorder class. Further stratification in future GWAS of BD may also increase the power to detect additional divergences, whereas collapsing across the two disorders will mask subtype-specific signal and obscure relationships with external traits. Indeed, in the most recent BD GWAS, stratifying the disorder by subtype increased the SNP-based heritability estimate for BD I relative to the overarching disorder class (Mullins et al., Reference Mullins, Forstner, O'Connell, Coombes, Coleman, Qiao and Andreassen2021).
Epidemiological meta-analyses have estimated overall lifetime comorbidity rates of 17% across ADHD and BD (Schiweck et al., Reference Schiweck, Arteaga-Henriquez, Aichholzer, Edwin Thanarajah, Vargas-Cáceres, Matura and Reif2021). When stratifying by BD subtypes, meta-analyses find no significant differences in ADHD comorbidity between BD I and II (Schiweck et al., Reference Schiweck, Arteaga-Henriquez, Aichholzer, Edwin Thanarajah, Vargas-Cáceres, Matura and Reif2021). Interestingly, our results are contrary to those found in epidemiological meta-analyses and indicate that genetic signal from BD II is likely driving the relationships previously observed between BD and the broader ADHD construct (Schiweck et al., Reference Schiweck, Arteaga-Henriquez, Aichholzer, Edwin Thanarajah, Vargas-Cáceres, Matura and Reif2021).
Results from T-SEM characterize patterns of gene expression that are specifically associated with the shared risk pathways across these two subtypes. Reaffirming the grouping of these subtypes within an overarching BD class, we identify 35 unique gene IDs associated with general bipolar risk. At the same time, many genes were significant for BD I, but not the overarching BD factor, indicating again that BD is most appropriately modeled as two separate subtypes characterized by both shared and unique risk pathways. We consider here the prior research on a few of the top BD factor hits. One of the top hits, FADS1, has been found to be involved in the metabolism of eicosatetraenoic and docosahexaenoic acid, which have been proposed to be beneficial for mood disorders (Yamamoto et al., Reference Yamamoto, Lee-Okada, Ikeda, Nakamura, Saito, Takata and Kasahara2023). Knockdown of gene expression for another top hit, GNL3, in human neuronal cell cultures was shown to cause aberrant proliferation and differentiation (Meng et al., Reference Meng, Wang, Dai, Wang, Ren, Liu and Chen2020).
Limitations and future directions
Several limitations of this work should be noted, with the most important being the restriction to only European samples based on limited data availability in other ancestries. To increase the representativeness of these findings we hope that, as datasets increase in size over the next several years, these analyses can be extended to other ancestral groups. An interpretive caveat of this work stems from recently described potential bias in genetic correlations due to cross-trait assortative mating (Border et al., Reference Border, Athanasiadis, Buil, Schork, Cai, Young and Zaitlen2022). However, due to the magnitude of genetic correlation and phenotypic similarity between these subtypes, cross-trait assortative mating alone is highly unlikely to account for the entirety of the genetic overlap (Grotzinger & Keller, Reference Grotzinger and Keller2022). Misdiagnosis represents another potential source of bias. For example, misdiagnosis of BD I as BD II (and vice versa) would inflate their genetic correlation (Wray, Lee, & Kendler, Reference Wray, Lee and Kendler2012), which in turn may underestimate the etiological divergences reported above. In addition, the use of discrete diagnostic categories in the original discovery GWAS may result in bias from prevailing clinical intuitions regarding differential diagnosis and symptom presentation. Simulations, however, have indicated that unrealistically large levels of misdiagnosis are required to explain the high levels of genetic overlap observed across psychiatric disorders (The Brainstorm Consortium et al., Reference Anttila, Bulik-Sullivan, Finucane, Walters, Bras and Neale2018). Nonetheless, potential bias from misdiagnosis highlights the importance of item-level GWAS summary statistics (i.e. individual symptoms or symptom counts), which can circumvent biases at the diagnostic level.
As GWAS datasets increase in size, future work should seek to include schizoaffective disorder bipolar type in subsequent analyses of etiological divergences of disorders within the BD diagnostic class. The present study is restricted to modeling the genetic variance–covariance across included traits, where the absence of environmental variance–covariance in our analyses is an interpretive limitation. The current findings should be re-evaluated using methods that can jointly model genetic and environmental influences (e.g. family-based studies) when possible. However, we highlight that the ability of Genomic SEM to include even independent participant samples and traits in the same statistical models offered a pragmatic approach to survey a wide array of clinical disorders and correlates, including those with low base rates in the population. This is unlikely to be feasible using alternative methods that also model the environment but require the set of traits to be measured in the same participant sample. Future work applying Genomic SEM can begin to consider the role of the environment by including summary statistics stratified by environmental exposures (i.e. high and low socioeconomic status) to obtain a more comprehensive picture of how environmental factors influence subtype divergences. Although we did not identify any significant Q GENE hits, we were likely underpowered for these analyses and future work should continue to reevaluate patterns of gene expression that may underlie genetic divergence across the BD subtypes. Finally, we highlight that the current conclusions should be interpreted as specifically reflecting common variant genetic architecture for SNPs with a MAF > 1%. While a recent whole exome sequencing study of BD found a similar pattern of findings across subtypes, this should be reevaluated in future work as the results were noted by the study authors to be tentative given the relatively small subtype sample sizes (Palmer et al., Reference Palmer, Howrigan, Chapman, Adolfsson, Bass, Blackwood and Neale2022).
Conclusions
We apply Genomic SEM to explore shared and unique genetic architecture across BD subtypes. At the level of genetic overlap of common SNPs, BD II was found to exhibit greater associations with phenotypes characteristic of internalizing disorders (i.e. anxiety, insomnia, and low physical activity), psychiatric symptoms, and adverse medical outcomes. At the level of tissue-specific gene expression, T-SEM results uncovered 35 unique genes associated with signal shared across BD subtypes, with extant literature implicating the top hits in key neuronal and metabolic functions. Through a genetic lens, these results collectively support a diagnostic system that distinguishes these subtypes, while challenging the illness severity conception of BD that places BD II at the lower end of severity. The genetic divergence implicated by our results also strongly supports treating these as two separate entities in future genetic studies to avoid obscuring subtype specific risk pathways.
Supplementary material
The supplementary material for this article can be found at https://doi.org/10.1017/S0033291723002957
Acknowledgments
The current analyses would not have been possible without the enormous efforts put forth by the investigators and participants from data resources such as the Psychiatric Genetics Consortium, iPSYCH, and UK Biobank.
Funding statement
A. D. G. and J. M. L. are supported by NIH Grant R01MH120219. A. D. G. and I. F. F. are supported by NIA Grant RF1AG073593.
Competing interests
All authors declare no competing financial interests or potential conflicts of interest.


 Open access