


Introduction
Bargaining power is a concept that most people find highly intuitive. Politicians, too, often refer to the notion of bargaining power when talking about international negotiations in general and even more frequently when talking about trade negotiations. Some famous examples from recent years include claims by British politicians that the United Kingdom would “hold all the cards”Footnote 1 in the negotiations on its exit from the European Union (EU) as well as claims by President Donald Trump that the United States would be in a “very strong bargaining position” vis-à-vis China in any trade war between the two countries.Footnote 2 How did these politicians come to the conclusion that their country has more bargaining power than their opponent? What factors did they take into account to calculate the bargaining power of their country?
Political scientists have developed many different theories about the determinants of bargaining power in trade negotiations. The most frequent explanation is based on market power: the larger a country's market is, the more bargaining power that country holds in negotiations because gaining access to its market is a highly valuable export opportunity for any partner country's firms. Additionally, a country with a large economy may threaten to disrupt the existing trade with a smaller partner and thus coerce the partner into making concessions in negotiations. Beyond this market power hypothesis, a variety of other explanations of bargaining power have been put forward in the literature. The institutional rules of negotiation, such as voting power, will impact the outcomes of formalized negotiation.Footnote 3 This applies especially to multilateral institutions such as the General Agreement on Tariffs and Trade (GATT),Footnote 4 the World Trade Organization (WTO),Footnote 5 or the EU.Footnote 6 Constraints imposed by domestic political institutions are another possible determinant of bargaining power as they can tie the hands of the government. However, domestic constraints can also be used by governments as a strategy to signal credible limits to their flexibility in negotiations.Footnote 7 Domestic institutional constraints in trade negotiations might depend on the number of veto players.Footnote 8 Bargaining strategies such as negotiating as a group,Footnote 9 coalition building, threat of disruption,Footnote 10 forum shopping,Footnote 11 issue linkage,Footnote 12 or harassmentFootnote 13 are also factors that might determine negotiating outcomes. Indirectly, the knowledge and skills of negotiators can influence bargaining power because the negotiators are better able to employ effective bargaining strategies.Footnote 14
In this article, I focus on the market power hypothesis and investigate the degree to which this conventional argument still holds in a globalized world. The rising amount of foreign direct investmentFootnote 15 and the increasing integration of global value chains (GVCs)Footnote 16 have significantly increased countries’ incentives to open up to free trade and lower their trade barriers. Companies that have invested abroad or that depend on foreign inputs for their production can be powerful lobbying actors that try to persuade their home governments to liberalize their trade policies. Therefore, I argue, the globalization of production and the resulting economic interdependence of countries has at least partially undercut the effect of market size on bargaining power in trade negotiations.
To measure bargaining power and thus test these hypotheses, I use a dataset of commitments made by countries to liberalize trade in services in preferential trade agreements (PTAs) gathered by Martin Roy to generate an indicator of bargaining power.Footnote 17 Since the last successful trade negotiation in the framework of the WTO in the early 1990s, PTAs have become the primary vehicle for countries to liberalize trade. According to version 2.1 (2021) of the Design of Trade Agreements (DESTA) dataset, there are currently over 800 PTAs in existence, and over 600 of them have been signed since 1990.Footnote 18 PTAs usually include provisions on a wide array of issues, ranging from tariffs on goods to nontrade issues such as environmental protections and labor rights. Most PTAs include a chapter on trade in services. This is not surprising, given that services account for about 20 percent of global trade using a narrow measure and about 50 percent of global trade if trade is measured in value added.Footnote 19 By adding services activities within manufacturing firms, Miroudot and CadestinFootnote 20 estimate that the contribution of services to overall exports is close to two-thirds. Although it would be ideal to have a measure of the total concessions of each country in a PTA and not just its concessions in the services chapter, the relevance of services to global trade makes this approach to measure bargaining power a useful first step.
The results of a series of regression analyses clearly demonstrate that the size of the economy is a strong predictor of bargaining power. The larger a country's market is, the fewer commitments that country will make to liberalize its services sector. However, the results also lend support to the interdependence hypothesis, which argues that the globalization of production has diminished the role that market power plays in determining bargaining power in trade negotiations. The economic dependence arising from having large GVC links with the negotiating partner partially offsets the effect of having a larger market. This might give smaller countries an opportunity to persist in trade negotiations with larger partners. If the larger partner country depends heavily on intermediate products from the smaller country, the partner will find it much harder to use its market size to coerce concessions from the smaller country.
This article adds insights to the long-running discussion of determinants of bargaining power in trade negotiations and shows the need to adapt some long-standing theories to the realities of modern trade. Beyond providing quantitative evidence for the impact of market power in trade negotiation and the limitations of the predictive power of market power in the face of growing globalization of production, this article makes a contribution that is relevant to a wider literature: the presented method of measuring bargaining power is a fruitful approach to tackle one of the perpetual problems of the literature on the international political economy and opens avenues for future research.
Argument
Bargaining power as a concept
The jury in political science is still out on whether it is possible to measure bargaining power and whether the factors that determine bargaining power can be identified. Some scholars argue that bargaining power is a case of “I know it when I see it.” For example, O'NeillFootnote 21 writes, “It is not clear that the concept of [bargaining] power adds to [the analysis of international negotiation]. … If power means no more than holding certain resources, it is superfluous.”
However, most political scientists agree that bargaining power is a useful concept. Many scholars have come up with definitions of bargaining power and analyzed its determining factors. One of the first and still most influential definitions of power is provided by DahlFootnote 22: “A causing [or having the ability to cause] B to do something that B otherwise would not do.” This definition is straightforward and intuitive, yet it is difficult to operationalize. Frieden and WalterFootnote 23 use a more elaborate definition that I will employ for my argument: “Bargaining power [is] the ability to draw the outcome closer to one's ideal point.” Bargaining power can thus be measured as the distance between the outcome of a negotiation and the respective initial ideal points of the parties involved. In the following sections, I detail how it is possible to measure bargaining power in trade negotiations by comparing the preferences of governments to the outcome of the negotiations.
Government preferences in trade negotiations
According to the definition of bargaining power just outlined, the “initial ideal point” of a government in the negotiations for a new trade agreement is one of the two data points necessary for calculating the bargaining power of a country. The political economy literature widely regards trade policy as a result of competing demands by export-oriented and import-competing sectors.Footnote 24 The expectation is that export-oriented companies will pressure their government to negotiate trade agreements that allow them easier access to the markets of other countries.Footnote 25 Import-competing companies will lobby their government to protect them against foreign competition through trade barriers. Firms have various ways to influence the decision-making process of their government: they can form interest groups and finance the parties in government through campaign contributions,Footnote 26 they can provide technical expertise that the government lacks,Footnote 27 or they can offer political information that helps decision makers to get reelected.Footnote 28
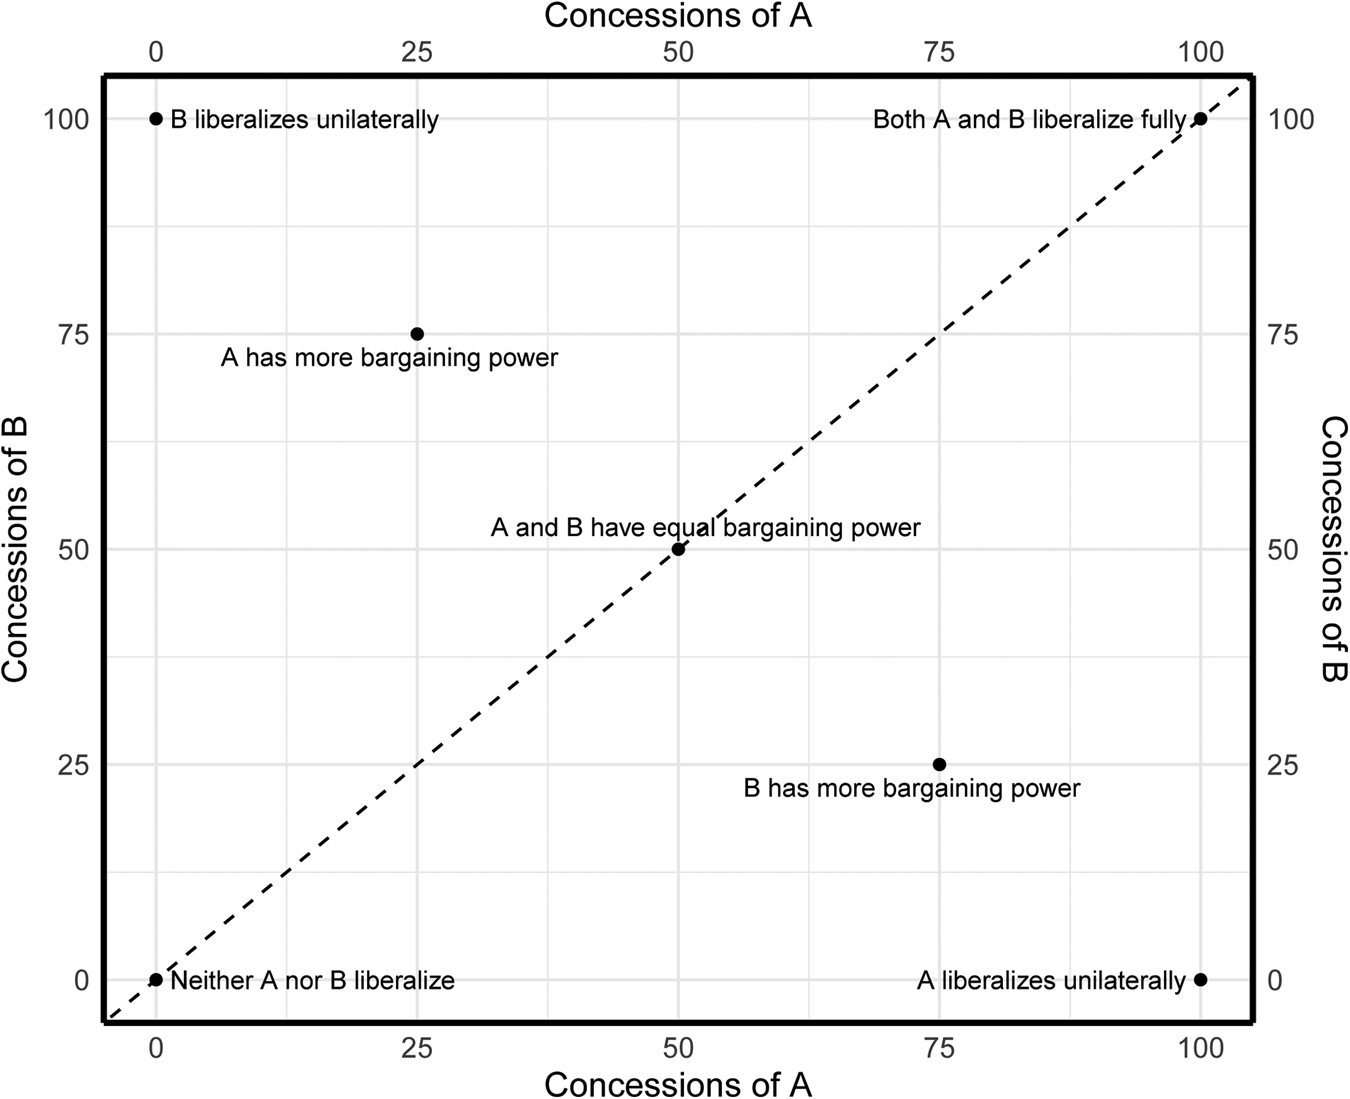
In trade negotiations, the demands from export-oriented firms on the one side and import-competing firms on the other side are most often at odds with each other because governments need to make concessions to their negotiating partners in order to gain concessions from them. Consequently, every government would prefer to conclude an agreement in which the partner country fully opens its market but the country itself does not reduce its trade barriers at all. This is only achievable if the country is very powerful and negotiates with a partner that is not powerful at all. Therefore, it appears reasonable to assume that all negotiating parties try to maximize the concessions made by their partner while minimizing their own concessions. Every own concession is a step away from one's ideal point, whereas every concession of the partner is a step toward one's ideal point. Therefore, the difference in concessions (or net concessions) made by the partners in an agreement can be regarded as an expression of the difference in their bargaining power (see Figure 1).
Calculation of bargaining power. The dashed line represents outcomes with equal bargaining power.
Determinants of bargaining power
Which factors explain the variation in bargaining power in trade negotiations? Most frequently, scholars equate bargaining power with relative market size.Footnote 29 There are two reasons to expect that the size of a country's economy matters in trade negotiations. First, the size of the economy determines the value of access to this market for foreign companies. Consequently, governments should be willing to make more concessions to gain access to a large and wealthy economy than to a small and poor economy. For example, a country will make more concessions to get access to the large market of the United States than to the small market of Central American countries.Footnote 30 McLarenFootnote 31 argues that investors in the small country start investing in exporting industries when their country enters into trade negotiations, thus reducing their country's bargaining power by making it dependent on the larger country's market.
Second, countries with large economies can coerce smaller economies into making concessions by threatening to impose economic sanctions.Footnote 32 HirschmanFootnote 33 formulates that a large government can threaten to interrupt its trade with a smaller government and thus turn trade into “an effective weapon in the struggle for power.” A good example of such coercion is the United States’ threat to apply tariffs on steel imports from South Korea in 2018, which resulted in South Korea making additional concessions in the renegotiation of its trade agreement with the United States.Footnote 34 Given that both the market access and coercion mechanisms have the same expected effect on bargaining power, it does not matter for my argument which of them is more important. From this follows the first hypothesis:
H1: The higher the market power of a country compared to its partner, the smaller the concessions the country will make.
To this point, this discussion has neglected one of the most important developments in the nature of global trade of the last decades: the increasing globalization of production in the form of global value chains. “Value chain” is a term used to describe the “full range of activities that firms and workers perform to bring a product from its conception to end use and beyond.”Footnote 35 In the past several decades, value chains have become increasingly globalized, with products often crossing multiple borders before reaching their final destination and being sold to consumers. Nowadays, GVCs are the basis for the production of many goods and services.Footnote 36 The global expansion of GVCs has fundamentally altered the structure of the global economy and increased the prominence of emerging economies as key economic and political actors.Footnote 37
GVCs also have implications for the domestic decision-making processes of governments regarding trade policy. Firms that engage in GVCs became more reliant on stable trade links because any disruption to their GVCs would threaten their entire production. Thus, the globalization of production through GVCs has major implications for trade negotiations because these import-dependent firms will lobby their government to protect their interests.Footnote 38 Instead of advocating for more protectionism, these firms will actually want lower trade barriers so that they can further integrate their supply chain.Footnote 39 When firms become increasingly reliant on imports of intermediate goods and services for their production from foreign countries, it gets harder for the home countries of these firms to use their market power as a bargaining chip in trade negotiations.Footnote 40 Additionally, there will be firms that rely on exports to the partner country and might lobby their government for reciprocal liberalization.Footnote 41 Shingal, Roy, and SauvéFootnote 42 found that Asian governments support a more ambitious liberalization of the services sector in PTAs when their country relies on trade with the negotiation partner. They attribute this finding to the growing insertion of Asia into supply chain production, where producer services play a significant role.
H2: The more a country relies on intermediate goods and services from the partner country because of GVC links, the larger the concessions the country will make.
In addition to this direct effect of GVCs on the amount of bargaining power, there might be an interaction between GVCs and the effect of market power on the outcomes of trade negotiations. If market power stems from having a large and valuable market that smaller countries want to export to, GVCs counteract this effect because they increase the value of the exports of the smaller country. The larger country then has an interest in being exported to because its firms rely on the intermediate products from the smaller country. If market power is exercised through coercion, with the larger country threatening to disrupt trade and thus harm the smaller country, high GVC links from the larger country to the smaller country make this threat self-defeating. If the larger country were to disrupt trade, it would harm not only the smaller country but also itself because it would cut off the GVCs of its firms. If this hypothesis holds, we should see a mediating impact of GVC links between the country and its negotiating partner on the effect of market power:
H3: The more a country relies on intermediate goods and services from the partner country because GVC links, the lower the effect of the relative market power on the amount of concessions this country will make.
Research design
Case selection
For my analysis, I use the dataset on liberalization commitments in services chapters of PTAs compiled by Roy.Footnote 43 Services constitute two-thirds of all economic activity and up to 50 percent of world exports;Footnote 44 however, the liberalization of services trade has also been a major source of economic growth.Footnote 45 Trade in services matters profoundly in GVCs, too. GVCs start with services (e.g., when activities such as research and development, design, or engineering are outsourced), they are maintained by services (e.g., transport, communication, logistics, and finance), and they often end with services (e.g., marketing, distribution).Footnote 46
The dataset used in this analysis covers 67 PTAs that were concluded in the period between 1994 and 2009. I dropped six agreements from the analysis because only one of the negotiating partners had been coded, making it impossible to calculate the relative bargaining power.Footnote 47 The remaining 61 PTAs include 50 bilateral agreements and 11 plurilateral agreements. They involve 54 different countries and range in economic size from the PTA between Panama and El SalvadorFootnote 48 to the PTA between the United States of America and South Korea.Footnote 49 There are other datasets on the design of trade agreements that cover more PTAs over a longer period (e.g., DESTA), but the dataset provided by RoyFootnote 50 is unique as it includes detailed information on the commitments made by each country in the agreements as well as information on the commitments each country had already made prior to the negotiations.
This dataset does not cover all PTAs that were concluded between 1994 and 2009. According to the DESTA database, 446 PTAs were signed during this period, but only about 62 percent include provisions liberalizing the services industry.Footnote 51 Thus, the sample of PTAs included in the subsequent analysis represents about one-quarter of the universe of PTAs that were signed in the 1994 and 2009 period and include a chapter on services. The sample is representative of different development levels of negotiating countries. Fifty-two percent of the negotiating partners are high-income countries according to the World Bank classification, compared to 51 percent in the whole universe of services PTAs during this period.Footnote 52 See Table A1 in the appendix for an overview of the PTAs that are included in the analysis.Footnote 53
This case selection has one obvious drawback: the dataset only includes the liberalization commitments in the services chapter of PTAs, which generally is just one of many chapters. Thus, only the negotiating outcome in this issue area can be assessed. Bargaining wins and losses in other chapters of the PTA remain unobserved in this research design. However, the negotiation outcomes in different chapters of PTAs are most likely correlated. For example, Dür and MödlhamerFootnote 54 find that GDP differences explain the design of intellectual property rights (IPR) provisions in PTAs. Thus, we can assume that the relative gains or losses of a country in negotiations on services chapters and IPR chapters are based on the same factors.
Still, scholars of international negotiations are well aware that states conduct issue linkage in negotiations and thereby trade concessions in one issue area for concessions of the partner in another issue area.Footnote 55 Therefore, it is possible that a country makes more concessions in the negotiations on the services chapter of a PTA than it would do if this chapter were not negotiated as a comprehensive PTA but as a stand-alone treaty, because this country places a higher emphasis on negotiation wins in another issue area. Despite this important limitation, the empirical approach described in this article should be valid because there is no reason to suspect that the issue linkage between the services chapter and other chapters introduces a systematic bias into the analysis. This would be the case if issue linkages correlated with one of the explanatory variables—for example, if countries with large economies always preferred concessions in the services chapters in turn for liberalization commitments by their smaller negotiation partner in other areas. This is unlikely. Instead, it is reasonable to assume that larger economies sometimes prioritize the services chapter and sometimes are willing to give ground in this area—independent of the size of their economy and their integration into GVCs. Therefore, the relationship between potential issue linkages and the explanatory variables should be random, which allows me to treat the omitted variable of issue linkages as part of the error term. Nevertheless, I will include some control variables that should stand as proxies for the likelihood of issue linkages.
Measurement
The key variable in the dataset is each country's level of commitments to liberalizing its services industry specified in a PTA. RoyFootnote 56 coded the level of commitments for 153 subsectors. This list of subsectors is based on the Sectoral Classification List (W/120), which was compiled by the WTO in July 1991,Footnote 57 but it includes a few additional categories. These subsectors are grouped into eleven distinct sectors. They cover all tradeable services and range from financial services such as “non-life insurance services” to educational services such as “adult education.” Trade in services is usually classified into four modes of supply, but only mode 1 (cross-border trade) and mode 3 (commercial presence) are typically covered in trade agreements. Both modes are coded separately for each subsector.Footnote 58 Table A2 in the appendix provides a list of these eleven services sectors and the number of subsectors in each sector.
The level of commitments for each subsector in the two modes of supply is coded on a scale from 0 to 100.Footnote 59 A subsector/mode of supply combination is given a score of 0 if no commitment to liberalize was made, a score of 50 if a commitment to partially liberalize was made, and a score of 100 if a commitment to fully liberalize was made. If this mode of supply for this subsector had been already partially liberalized in an earlier agreement and then was further (but still not fully) liberalized in the present PTA, a score of 75 is given. This scoring model is well established and has been used in other quantitative studies.Footnote 60
Given that the number of subsectors in each sector varies widely, from just three in health-related and social services to forty-five in business services, I aggregated each country's concessions from the subsector level to the sector level before the analysis. Consequently, the unit of analysis is the liberalization commitment of a country in one of the eleven services sectors and in one of the two modes of supply. Aggregating the liberalization commitments to the level of the eleven services sectors also makes matching independent variables easier. Several economic variables, such as the trade competitiveness or the export share, are only available for these eleven sectors and not for each subsector.
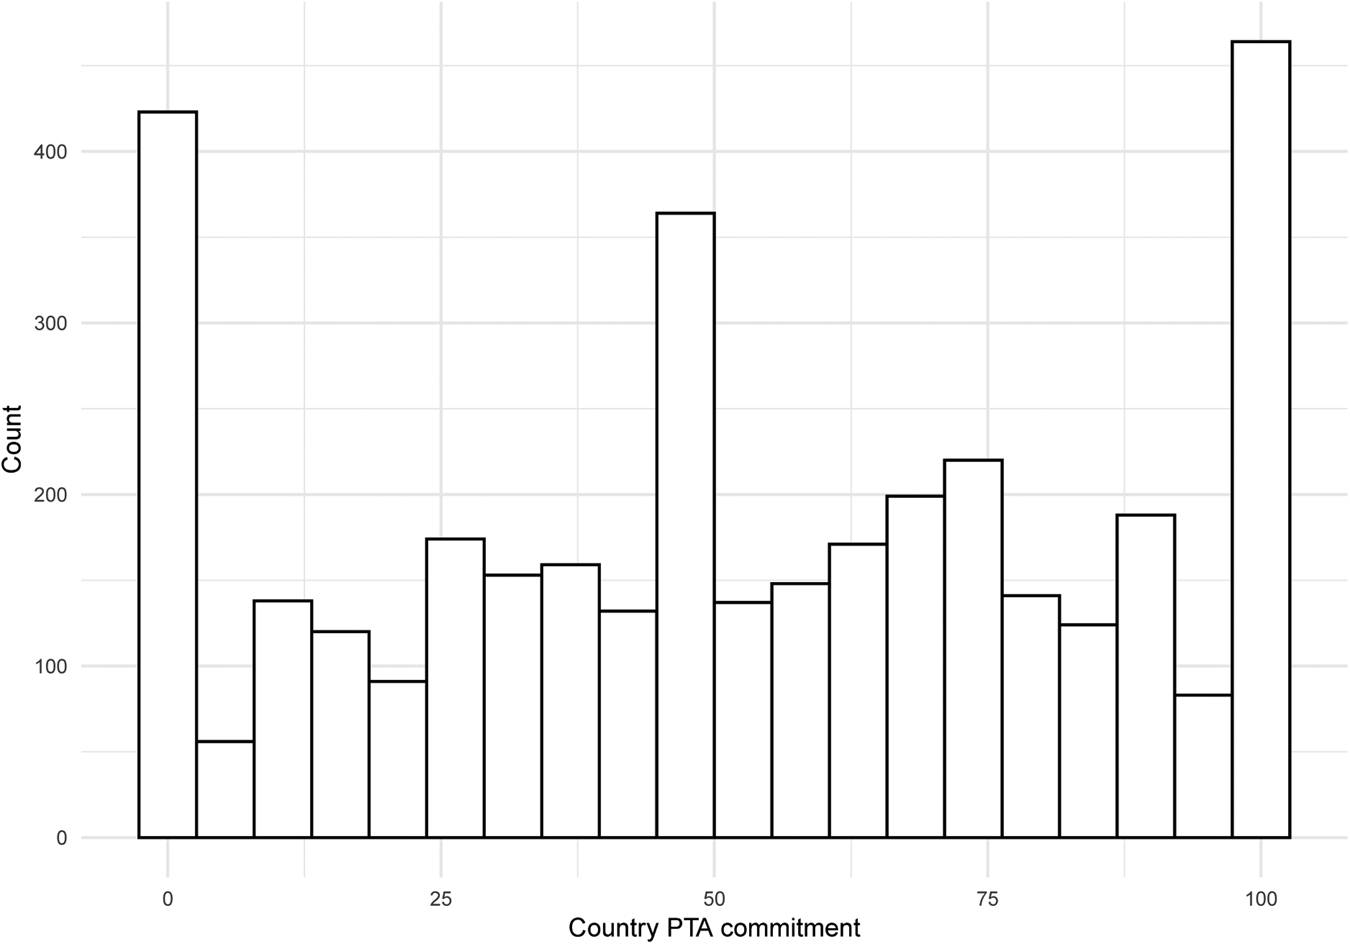
There are 3,738 observations in the dataset. Each observation is the liberalization commitment of one country in one agreement in one sector and one of the two modes of service provision. Figure 2 shows the distribution of this dependent variable. The variable ranges from 0, which means that the country made no commitments to liberalize this sector, to 100, which means that the country agreed to fully liberalize this sector. It is important to keep in mind that a high value in the commitment variable indicates that this country “lost” the negotiations because it moved further toward full liberalization. Some observations had to be dropped because independent variables were not available. A total of 3,444 observations remain for the main analysis.
Country commitments in PTAs.
Crucially, the dataset provide not only information about the level of commitments by each country in a PTA but also the level of commitment this country had already made in the negotiations for the General Agreement on Trade in Services (GATS), which was negotiated under the auspices of the WTO in 1995. This makes it possible to evaluate the concession of each partner country in an agreement by comparing its commitments in a PTA to the status quo level of liberalization, which the country committed to in the GATS. The commitments each country made in the GATS apply to all countries worldwide and can be seen as a baseline of liberalization of the services sector. By comparing the commitments in PTAs to the commitments in the GATS, I can control for the level of liberalization each country had already implemented and refine my variable to measure only additional liberalization that was granted to the partner(s) in the PTA.
To measure the relative bargaining power of a country in a given PTA, the model needs to account for the concessions made by the negotiation partner. Therefore, I include the amount of commitments made by the partner and the status quo liberalization of the partner measured by their GATS commitments as independent variables. In the case of multilateral negotiations, I calculate the commitment and the status quo of the partner by taking a weighted mean of the values of all partners, using GDP as the weight. This is based on the assumption that the concessions of larger partner economies are regarded as more valuable than the concessions of smaller partner economies because they open up more opportunities for expanded trade. In the case of the PTA between South Korea and the Association of Southeast Asian Nations (ASEAN), it seems reasonable to expect that South Korea was more interested in receiving concessions from Indonesia than from Brunei Darussalam.
This approach to measure bargaining power clearly has several shortcomings that need to be mentioned. First, RoyFootnote 61 does not measure absolute levels of commitments, but rather commitments relative to the status quo of each country. Therefore, it is possible for a country with a high absolute level of liberalization, which liberalized in one big step, to have a lower score than a country with a small absolute level of liberalization, which liberalized in many small steps. Second, countries tend to use the level of commitments they made in a PTA as a baseline for further negotiations. Therefore, the level of commitments made are time dependent.
Explanatory variables
Scholars of international relations have employed many methods of measuring market power, but most often, power is attributed to resource endowments. In regard to international economic negotiations, the difference in or the ratio of GDP is the most frequent measure, but alternative indicators such as export or import shares, net exports, or trade dependenceFootnote 62 are also used. In some instances, even military power might increase bargaining power in trade negotiations.Footnote 63 In this article, I use the ratio of GDP (in current US dollars) between the country and its partner in the year when the PTA was signed to measure the economic power relationship. Because of the immense range of this variable among PTAs, I apply a logarithm with base 10 to this GDP ratio. This serves several purposes: First, it reduces the effect of extreme outliers in the dataset, such as the negotiations between the United States and Jordan, in which the GDP of the United States was more then 1,000 times that of Jordan. Second, this logged GDP ratio is better suited for regression analyses because it is symmetrical around 0 and linear (–1 and +1 have the same substantial meaning: a country is 10 times smaller/larger than its partner). Third, this variable is intuitive: a value of 0 means that the two countries have equal GDP. Positive values mean that the observed country has a larger GDP than its partner, whereas negative values mean that the country's GDP is smaller. Based on H1, we should expect high values in the GDP ratio to be associated with lower commitments in a PTA because the economic dominance of this country will increase its bargaining power. I use the database published by the International Monetary Fund (IMF) in its World Economic Outlook report to obtain the GDP for each country in the year when the PTA was signed in current US dollarsFootnote 64 and then calculate the GDP ratio.Footnote 65 The logged GDP ratio ranges from –4.6 in the relationship between Dominica and the EU to 3.1 in the negotiation between the United States and Jordan.
To measure the degree to which the country's firms depend on production inputs from the negotiating partner in the year when the PTA was signed, I include a variable to capture GVCs that originates from the UNCTAD-Eora Global Value Chains Database.Footnote 66 This dataset provides for each country the value-added by all other countries in the world (including itself).Footnote 67 This measure captures the value of inputs from the partner country embodied in the exports of the reporting country, which is also known as backward GVC linkage.Footnote 68
To measure the degree to which a country's firms are dependent on the partner country for inputs for their production, I calculate the share of this partner's value added in the reporting country's total exports. This “GVC share” is the key independent variable to test H2. It is important to note that in most instances, the country itself will be the most important source of inputs for its exports. For example, in 2008, the United States accounted for 85.0 percent of the value added in its exports, meaning that only 15.0 percent of inputs were sourced from all partner countries combined. The largest GVC shares for the United States in that year were with the EU (3.4 percent) and Canada (2.9 percent). Consequently, the variable GVC shares has a rather low mean of 1.9 percent and ranges from 0.001 percent in the case of the GVC links between the United States and Jordan to 15.2 percent in the case of Singapore's GVC links with the rest of ASEAN. This distribution makes it a good measure of dependency on the partner country: it seems quite reasonable that the US economy depends to a negligible degree on production inputs from Jordan but that Singaporean firms rely heavily on inputs from the country's neighbors. One limitation of this measure of GVC linkage is that it not only captures foreign services inputs in the country's production but also includes intermediate goods from the partner country. However, research has shown that services account for up to two-thirds of overall exports.Footnote 69 Thus, the GVC share should be a valid measure to evaluate H2.
To account for the fact that economic interdependence goes both ways, I also include the GVC share of the partner country in the regression analyses. This variable is calculated exactly as the country GVC share described and expresses the share of the reporting country's value-added in the partner's total exports.
Control variables
In addition to these two explanatory variables, I include several control variables. Each variable is measured in the year when the PTA was signed. First, I control for the trade competitiveness of a given services sector. It is important to take the competitiveness of a sector into account because otherwise it is impossible to isolate the effect of bargaining power on the outcome of trade negotiations. As outlined earlier, the basic assumption of the political economy literature is that the main opposition to trade liberalization comes from import-competing firms. Meanwhile, export-oriented companies will lobby their government to make all concessions necessary in order to receive reciprocal liberalization and gain more access to the partner economy.Footnote 70 It follows that the negotiating outcome would be for a country to maintain its own trade barriers while convincing the partner country to fully open its borders. But, given that this ideal outcome is unobtainable, which of these two competing goals will the country prioritize in negotiations? I argue that this depends on the trade competitiveness of the firms in a given industry sector. When a country's firms are not competitive compared to world markets, the import-competing firms will exercise much pressure for continued protection, and only a few export-oriented companies will hope to expand their global presence. However, when an industry sector is highly competitive, there will be limited opposition to lifting trade barriers in this sector, but many firms will pressure the government to pursue reciprocal liberalization.
To account for the role of the competitiveness of a services sector in the preference formation of a government, I rely on a measure of competitiveness known as the revealed comparative advantage (RCA), which was introduced by Balassa.Footnote 71 The idea behind this measure, which is broadly used in economics, is that a services product from a certain country is competitive if the country exports relatively more of this services product than the rest of the world. The measure is calculated by dividing the share of a product's exports in the total exports of a country by the global share of this product's exports in total global exports. If a country exports the same share of a given product as the world's average, the competitiveness measure equals 1. If the RCA value is below 1, the country is not competitive in this product. Producers of the product in this country are hence assumed to face import competition. Conversely, when the RCA is above 1, the country is competitive and its firms should be mainly export oriented. I standardized this score by applying the natural logarithm to the value; thus, 0 means that a country exports as much of a given services product as is usual on the world market. To calculate the RCA, I used the OECD and WTO's Balanced Trade in Services database (BaTIS).Footnote 72 This database provides annual export data for eleven services categories, such as “insurance services” or “transportation services,” that broadly match the eleven services sectors defined in the Sectoral Classification List (W/120) used by RoyFootnote 73 to code the liberalization commitments in trade agreements. I used a correspondence table provided by the United Nations Statistics Division to match these two slightly different sets of categorizations.
As a second control variable, I include the share of the respective services sector in the total exports of the country as a control variable. This serves as a proxy for the likelihood of an issue linkage in this area. The expectation behind this assumption is that countries will put more emphasis on the negotiations regarding industry sectors that are important to their economy, whereas they will more willing to give up ground when the provisions affect only a small share of their exports. The export share is calculated using the same data used to obtain the sector trade competitiveness measure and expressed as a percentage of the total exports of a country. This variable ranges from close to zero—for example, in the case of educational services from Vietnam, to 59 percent for the tourism industry in Barbados. In this situation, I would expect that Barbados will spend its bargaining power almost exclusively on negotiations regarding the tourism sector, whereas Vietnam will trade concessions in the education sector for negotiation wins in other issue areas.
Additionally, I include sector and agreement fixed effects. The sector fixed effects capture all differences between services sectors, including disparities in the degree to which the different sectors were already liberalized in the GATS. The agreement fixed effects serve as another control variable for the fact that the negotiations on one services sector might depend on the concessions each country makes in other services sectors or in other parts of the agreement. They should also account for any special relationships with the negotiating partner, such as military alliances or historical ties that governments might consider in trade negotiations.Footnote 74
In alternative models, I include additional control variables. First, I include the mode of service provision as a dummy variable that can either be M1 (cross-border trade) or M3 (commercial presence). Second, to ensure that the GDP ratio really catches the economic power relationship between the negotiating countries and not differences in wealth or development status, I control for both the GDP per capita of the country and the GDP per capita of its partner(s) in the analysis. Both variables are expressed in thousands of current US dollars per capita. PTAs are sometimes regarded as a tool on the global development agenda, and it is possible that the trade-for-development argumentation can increase the bargaining power of otherwise weak countries.Footnote 75 Third, I use the depth index from version 2.1 (2022) of the DESTA databaseFootnote 76 as a measure of the overall comprehensiveness of the agreement. This index is based on the number of key provisions that can be included in trade agreements; it ranges from 0 (indicating a very shallow agreement) to 7 (indicating a very broad agreement). Fourth, I include a variable measuring the share of the services sector in the total employment of the country. This variable is an alternative indicator of the importance that a country will place on the negotiating outcome in one specific issue area; it is based on data from the IMF.Footnote 77 Lastly, I use the share of the entire services industry in the GDP of a country to control for the overall size of the tertiary sector. This variable serves as yet another check for potential correlations between the explanatory variables and the error term that might occur as a result of issue linkages; the data is obtained from the World Bank.Footnote 78
Section 7.3 in the appendix provides descriptive statistics for all variables and histograms that show the distribution of all main variables.
Results
Main analysis
What role does bargaining power play in explaining the outcomes of trade negotiations? To visualize the overall correlation between these variables, Figure 3 shows the aggregated net concessions for each negotiating partner and the GDP ratio between them. Net concessions can range from –100 (the partner liberalizes fully while the country does not liberalize at all) to +100 (the country liberalizes fully while the partner does not liberalize at all). This figure demonstrates that the net concessions made by countries in the services chapters in trade agreements correlate negatively with the ratio of their GDP to the GDP of their partner. This means that the larger the GDP of country A compared to the GDP of country B, the lower the concessions made by country A compared to the concessions made by country B. The difference is also quite substantial. In negotiations such as the one between the United States and South Korea, where the log GDP ratio is about 1 (the country's GDP is ten times larger than the GDP of its negotiating partner), the correlation indicates that a country makes about 10 points fewer net concessions than when the log GDP ratio is 0 (the two negotiating partners have equal GDPs). In more lopsided agreements, where the larger economy is 100 times larger than the smaller economy (e.g., the EU-Chile PTA), the net concessions of the larger partner are predicted to be nearly 20 points lower.
Relationship between net concessions and GDP ratio. Each dot represents one negotiating partner. The country mentioned first in the labels of the dots is Country A, and the country mentioned second is Country B. To ensure readability, only the dots representing agreements involving the EU, Japan, or the United States are labeled. The blue line is a linear fit describing the relationship between the GDP ratio and the net concessions of Country A. The grey area represents a 95% confidence interval.
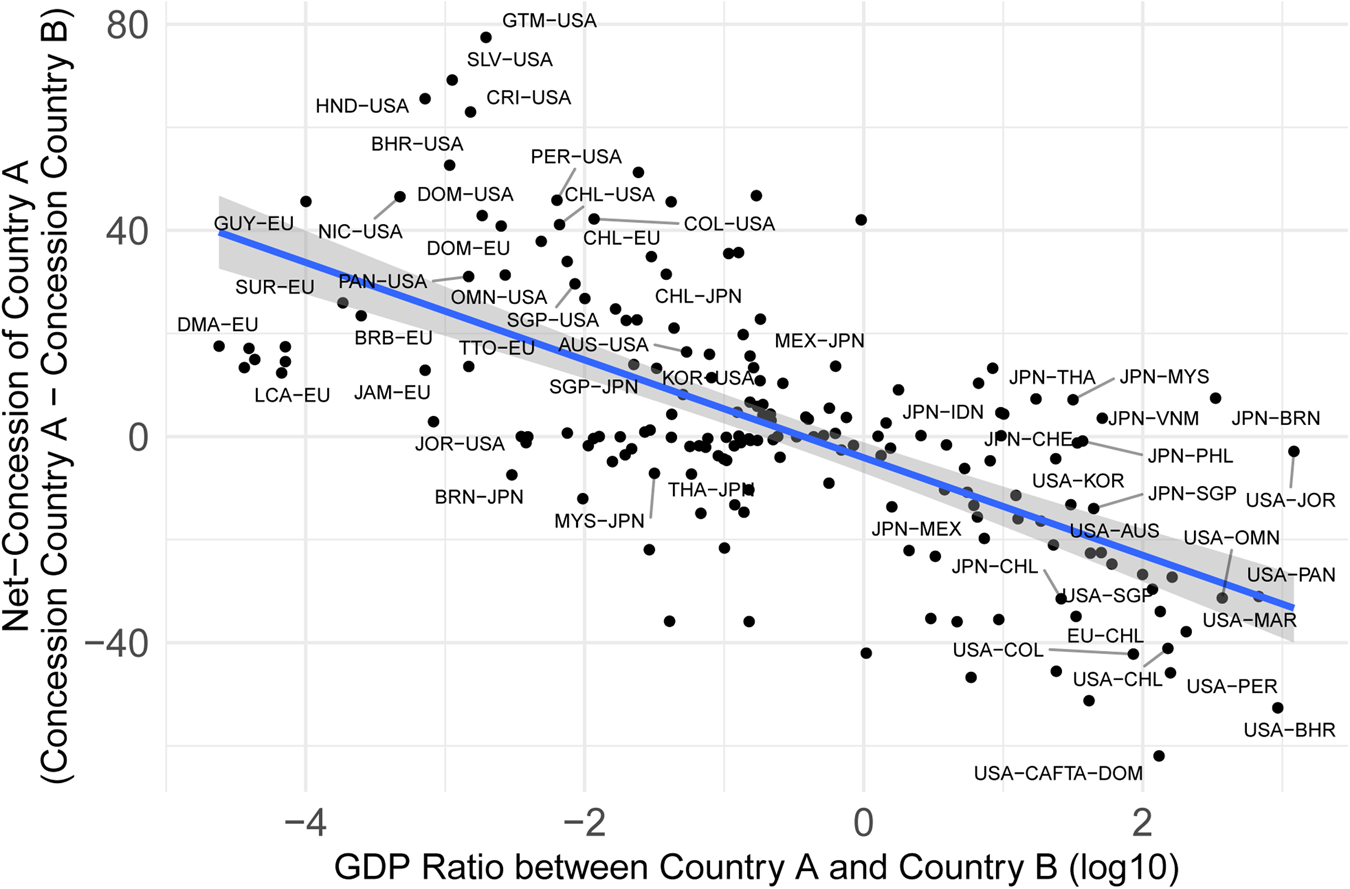
Figure 3 shows a remarkably clear correlation on an aggregate level, but of course, more nuanced statistical analysis is necessary. Table 1 presents the results of the main regression model. The results of Model 1 (the baseline model) support the market power hypothesis (H1) and demonstrate that the GDP ratio has a significant negative effect on the level of commitments a country is forced to make to conclude the agreement. The higher the GDP of the observed country is compared to the GDP of its partner, the fewer commitments this country makes in the negotiations. An increase in the logged GDP ratio of 1 (e.g., moving from a situation in which both countries have equal GDP to a situation in which the observed country's GDP is 10 times larger than the GDP of its partner) results in a decrease of 2.95 points in the country's commitments.Footnote 79 In line with H2, the coefficient of the GVC exposure is positive and significant as well. An increase of 1 percentage point in the country's GVC share is associated with an increase of 0.52 points in the country's commitments to liberalize this services sector.
Commitments in trade negotiations.

Notes: Entries are unstandardized coefficients from a linear regression model. Standard errors in parentheses. Dependent variables range from 0 to 100, with higher values representing higher country commitments. Sector fixed effects and agreement fixed effects not shown.
p < .01; p < .05; p < .1.
Model 2 shows the results of the regression analysis, including the interaction between the share of GVCs the country has with this partner and the (logged) GDP ratio. This interaction effect between the GDP ratio and the GVC share is positive and statistically significant, which supports H3. To assist with the interpretation of this interaction effect, Figure 4 plots the marginal effect of the GDP ratio dependent on the GVC share. The negative effect of the GDP ratio on the country's commitments is only statistically significant as long as the GVC share is low. If the GVC share is larger than about 4 percent, the coefficient of the GDP ratio is not statistically significant anymore at the 95 percent confidence level. The effect of the GDP ratio even turns positive with a rising GVC share, but this positive effect never becomes statistically significant, and there are only a few instances in which the GVC share exceeds 10 percent (see Figure A8 in the appendix).
Marginal effect of log GDP ratio by country GVC share. The dashed line marks a coefficient of zero. The ribbon represents a 95% confidence intervals. Based on Model 2 in Table 1.

The importance of the dependence of a country's economy on inputs from its negotiating partner is highlighted in Figure 5, which shows the predicted level of commitments a country makes in a PTA based on the GDP ratio and the GVC share. When the GVC share is close to zero, there is a strong negative effect of the economic power relationship between the two negotiating parties. However, if the partner accounts for 5 percent of the country's backward GVC links, the line that charts the predicted country commitments based on the GDP ratio is flatter. This means that a large power disparity has less of an effect on the country's liberalization commitments compared to the case in which the GVC share is 0 percent. (An example for a country that has a 5 percent GVC share with its negotiation partners is Paraguay in the Mercosur Services PTA.) If the GVC share is 10 percent, the line is even flatter and not statistically significant anymore, which implies that the power disparity between the country and its negotiation partner does not impact the amount of commitments the country makes in a statistically significant way. (This is the case, for example, in Singapore's negotiations with Japan.)
Predicted country commitment by GDP ratio and country GVC share. The ribbons represent 95% confidence intervals. Based on Model 2 in Table 1.

The most important control variable is the interaction between the partner GVC share and the GDP ratio. This interaction effect is negative and strongly significant, which demonstrates that economic interaction works both ways. If the negotiation partner relies on the country for inputs for its production, the effect of a disparity in market power has an even stronger negative effect on the commitments of the country.
Turning to the other control variables, the coefficient of the export share of the services sector is negative and statistically significant. This is in line with the expectations outlined in the section on control variables and shows that countries are indeed more hesitant to liberalize sectors that constitute an important part of their economy. Conversely, countries are more willing to make concessions in issue areas in which they export little to nothing anyway. As argued earlier, this variable should catch at least some of the issue linkage that countries pursue in trade negotiations, and this plausible finding supports the assumption that bargaining dynamics in the negotiation of services chapters can be representative for the negotiation process on the PTA as a whole.
Meanwhile, the coefficient of the trade competitiveness of a sector is not statically significant. Furthermore, the status quo of liberalization of the country (measured by the commitments this country already made in GATS) has the expected positive effect on the amount of commitments the country makes in the PTA. The more a country already liberalized in GATS, the less additional concessions it can possibly make in a PTA and thus the commitments in the PTA have a high floor. Higher commitments by the partner are associated with higher commitments by the country, which likely is a result of reciprocal liberalization.
Robustness checks
In the following sections, I perform a series of robustness tests. First, I include additional control variables in the main model to rule out omitted variable biases. Second, I use jackknife resampling to ensure that the results are not driven by a single country. Third, I employ three alternative specification of the main model. In a fourth set of models, I use alternative indicators of market power.
Additional control variables
Figure 6 plots the coefficients of the three explanatory variables from a series of variations of the main model that each include one of the five additional control variables that were discussed in the section on control variables. The first row of coefficients stems from Model 2 reported in Table 1 as comparison. The last row of coefficients is based on a model where all five additional control variables are included. Overall, the results are reasonably robust to the inclusion of additional variables. The coefficient for the GDP ratio changes very little and remains statistically significant in all models. The direct effect of the GVC share and the interaction effect between the GDP ratio and the GVC share of a country are virtually unchanged in the first four models, but they are not statistically significant in the models that include the sector share in employment (Models 5 and 7).
Coefficients of main variables from regression analyses with additional control variables. Points are unstandardized estimates from a linear regression model. Ranges represent 90% and 95% confidence intervals. Based on Table A4 in the appendix.

Turning to the effects of these additional control variables themselves, we can see in Model 2 of Table A4 in the appendix that the mode of the services sector does not have an effect on the concessions made. Model 3 shows that neither the prosperity of the country nor of its negotiating partner measured by its GDP per capita have a statistically significant effect. If countries would indeed provide preferential treatment to developing countries in trade negotiations to further their development, we would expect a strong negative of the partner's prosperity on the amount of commitments a country makes in a PTA (and vice versa). The overall depth of an agreement is associated with more liberalization commitments, which is not surprising given that the degree to which services are liberalized factors into the calculation of the depth index. The sector employment share yields a positive and significant coefficient. The positive direction of this coefficient is somewhat surprising given the expectations that countries should hesitate to liberalize parts of their economy that are important sources of employment. However, this result probably can be explained by the fact that the employment data encompasses jobs not only that might be in the respective sector but also those that are highly unlikely to be impacted by trade liberalization. For example, the largest sector by employment in most countries is distribution services—and PTAs probably will not cause a replacement of cashiers or store managers who constitute the majority of the employees in this sector. The last additional variable measures the total share of the services industry in a country's GDP; this variable also has a positive and significant impact on liberalization commitments.
Jackknifing of countries
In the second series of robustness checks, I drop one country at a time from the sample and rerun the main model with this jackknifed sample. The coefficients of the GDP ratio remain remarkably robust, as demonstrated in Figure 7. The direct effect of the GVC share and the interaction effect between the GDP ratio and the GVC share are less robust, and their statistical significance hinges on the inclusion of some countries.
Coefficients of main variables from regression analyses with jackknifed samples. Points are unstandardized estimates from a linear regression model. Ranges represent 90% and 95% confidence intervals.

Alternative model specifications
To test the robustness of these results, I run four sets of additional regression analyses with alternative model specifications. In the first set, I combine the PTA commitments and GATS commitments of both sides of the negotiation to measure of the net concessions of the country. The net concessions are calculated by subtracting the partner's concessions (its commitments in the PTA minus its status quo liberalization made in GATS) from the country's concessions. In the second set of robustness checks, I run linear mixed effects, replacing the fixed effects for the services sector and the agreement by random effects. This accounts for the fact that the observations might not be independent but rather clustered in sectors or agreements. Third, I employ a tobit model to account for the censored nature of the dependent variable. Country commitments cannot exceed 100 (full liberalization) or fall below 0 (no liberalization). Fourth, I rerun the main model but with a sample in which the liberalization commitments are aggregated to the services sector regardless of the mode of supply (see the section on measurement for a discussion of this subject). This halves the number of observations.
Table A5 in the appendix reports the results for the model using net concessions as the dependent variable, Table A6 for the linear mixed-effects model, Table A7 for the tobit model, and Table A8 for the model with the more aggregated sample. The coefficients for the GDP ratio are in the direction expected by H1 and statistically significant in all four additional models. In line with H2, the main effect of the GVC share is positive in all models but not statistically significant. The interaction effect between the GDP ratio and the GVC share is positive in all models as anticipated by H3 and significant in the linear mixed-effects model, the tobit model, and the model with the more aggregated sample, but not in the net concessions model.
Alternative calculations of market power
In this article, I have measured the relative market power in PTAs by calculating the logarithm with base 10 of the ratio between the GDP of the country and the GDP of its partner(s). However, alternative measures are suggested in the literature. Allee and PeinhardtFootnote 80 subtract the GDP of one country from the GDP of the other country. Others have multiplied the GDP of a country with its GDP per capita to account for both the size of its economy and its development at the same time. To ensure that the results of the main analysis in this article do not hinge on the specific calculation of market power, I rerun the main model with these alternative calculations. Models 1 and 2 in Table A9 show the results using the logarithm with base 10 of the ratio between the GDP of the country multiplied with its GDP per capita and the GDP of its partner(s) multiplied with their GDP per capita. Models 3 and 4 show the results using the difference between the countries’ GDP (by subtracting the partner's GDP from the country's GDP). In all models, the coefficient for the market power measure is negative and statistically significant (as expected by H1) whereas the interaction effect between the respective measure of relative market power and the country's GVC exposure to its partner is positive and statistically significant (in line with H3).
Overall, these four sets of robustness tests provide strong support for H1 and decent support for H2 and H3, which apply under most but not all conditions.
Conclusion
In the political economy literature, market power has been the most frequently mentioned determinant of bargaining power of states in trade negotiations. Countries with large economies can coerce smaller countries into making concessions, while smaller countries have incentives to make even larger concessions just to obtain limited access to the valuable markets of larger countries. In this article, I have investigated whether market power still determines bargaining power in a globalized world, where the integration of countries into global value chains massively increased economic interdependence. I have argued that this economic interdependence reduces the ability of countries with large economies to utilize their higher market power in trade negotiations and force their negotiating partner into making concessions. On the one hand, countries that rely on intermediary goods and services from their negotiating partner for their own production cannot convincingly threaten to close their market to the partner's exports because they would suffer themselves from depriving them from these crucial intermediary inputs. On the other hand, GVCs have created domestic firms that lobby for trade openness because they rely on foreign inputs and thus counterweight the protectionist interests of import-competing firms.
To test these hypotheses about the determinants of bargaining power quantitatively, I built on the definition of bargaining power by Frieden and Walter,Footnote 81 who argue that bargaining power can be measured as the distance between the outcome of a negotiation and the respective initial ideal points of the parties involved. I used a dataset on liberalization commitments in services chapters of preferential trade agreements compiled by Roy.Footnote 82 This dataset enabled me to quantify both the initial ideal points and the outcomes of the negotiations in these PTAs.
In my regression analysis, I found consistent support for the market power hypothesis and decent support for the economic interdependence hypothesis. The GDP ratio between the country and its negotiating partner has a strongly negative impact on the level of commitments the country makes in the negotiations. But when the interaction between the market power and the GVC links between this country and its partner is modeled, the negative effect of the GDP ratio holds only for small levels of GVC links. Once a certain threshold of the country's reliance on inputs from the negotiating partner is crossed (in the main model of my analysis, this threshold lies at about 4 percent), the effect of the GDP ratio became statistically indistinguishable from zero. This supports the hypothesis that the globalization of production indeed undermines the effect of economic strength in trade negotiations. A series of additional tests showed that the overall robustness of these results is high although the significance of the interaction effect between market power and economic interdependence is less robust and might not apply in all situations.
It is important to emphasize that these findings do not mean that smaller countries are now generally more powerful than they were before the globalization of production. Smaller countries tend to be highly dependent on intermediate goods from larger countries, and thus the interaction between market power and economic dependency can easily work against smaller countries, too. However, when smaller countries start negotiations with larger countries, they have a better chance to achieve a balanced outcome if the larger country depends to a certain degree on their exports. The worst position for a small country is to negotiate with a large country that does not have significant GVC links with the small country.
This article makes two important contributions. First, it addresses the determinants of bargaining power in trade negotiations and demonstrates that the effect of economic strength is conditional on economic interdependence through GVCs. Only in situations in which there is little interdependence between a country and its negotiating partner can the country bring its economic strength to bear in trade negotiations. Thus, this study has implications for both realist and liberal views of the international political economy. The finding that raw market power is (still) the key driver of the outcome of trade negotiations supports the realist notion that international negotiations are determined by the relative resource endowments. The finding that economic interdependence also shapes negotiation outcomes and even mediates the effect of market power speaks to liberal points of view, especially because this economic interdependence is driven by multinational firms that establish GVCs and thus have influence on trade policy decisions.Footnote 83 Second, this article is relevant to the wider literature on international relations because it demonstrates that quantifying bargaining power and testing theories pertaining to determinants of bargaining power with statistical models is possible and can be an important addition to the existing case studies on this question.
There are several fruitful avenues for further research. I have focused my analysis on the impact of backward linkages in GVCs on bargaining power. These backward linkages introduced a previously nonexistent import reliance into the theoretical argument, whereas forward linkages should merely add to the existing incentives for governments to force their negotiating partners into opening their markets. However, future studies might consider the role of forward linkages in GVCs and the resulting export reliance of countries on trade negotiations more thoroughly. Future research might also tackle some empirical limitation of this study by using more fine-grained data on global value chains. For example, the UNCTAD-Eora Global Value Chains Database offers not only country-level GVC data but also sector-specific GVC data. Unfortunately, the sector classifications are very heterogeneous between countries, which makes intercountry comparison difficult.Footnote 84 Nevertheless, taking into account the sectoral variation in GVC reliance into account might enhance the validity of the findings. Last but not least, it would be insightful to move beyond the scope of this article, which was limited by data availability to the services chapters of PTAs. Future studies should use the approach of quantitatively comparing initial ideal points of countries to negotiation outcomes in order to analyze determinants of bargaining power in other issue areas. This could answer the question of the extent to which the findings of this study are generalizable.
Supplementary material
The supplementary material for this article can be found at https://doi.org/10.1017/bap.2023.5.
Acknowledgments
This research received funding from the European Research Council under the European Union's Horizon 2020 research and innovation program (grant agreement no. 724107). I would like to thank Robert Huber, Andreas Dür, Gabriele Spilker, Dirk De Bièvre, Clara Weinhardt, and audiences at the European Consortium for Political Research General Conferences in August 2020 and September 2021 for comments on earlier versions of this article.
Competing interests
The author(s) declare none.


 Open access