


1. Introduction
The Greenland Ice Sheet (GrIS) is currently the single largest contributor to sea level rise globally (IPCC, Reference Masson-Delmotte, Zhai, Pirani, Connors, Péan, Berger, Caud, Chen, Goldfarb, Gomis, Huang, Leitzell, Lonnoy, Matthews, Maycock, Waterfield, Yelekçi, Yu and Zhou2021) and loses mass via solid ice discharge and surface melt. Extreme summer surface melt events are increasing in frequency (Tripathi and others, Reference Tripathi, Mishra, Joshi and Singh2025; Zhang and others, Reference Zhang2025) and surface melt is currently responsible for over half of the total mass lost from Greenland (The IMBIE Team, 2020). The maximum elevation of the visible runoff limit (the zone below which meltwater runs off the ice sheet) has risen between 58 and 329 m and has subsequently increased the runoff area by 29% between 1985 and 2020 (Tedstone and Machguth, Reference Tedstone and Machguth2022).
Surface melt from the accumulation zone of the GrIS will either be retained through refreezing in the pore space of snow and firn (Harper and others, Reference Harper, Humphrey, Pfeffer, Brown and Fettweis2012) or it will run off along spatially extensive, near-surface, buried high-density ice layers. These ice layers form when surface melt in the snowpack/firn layer refreezes and can range from millimetres to meters in thickness (MacFerrin and others, Reference MacFerrin2019). Thick and laterally extensive refrozen ice layers are typically referred to as ice slabs (Machguth and others, Reference Machguth2016). It has been proposed that ice layers of sufficient thickness and/or lateral continuity can form a barrier to vertical percolation of meltwater into the underlying snow and firn, preventing melt retention in the snowpack through refreezing, and increasing the likelihood of melt becoming runoff to the ocean (Machguth and others, Reference Machguth2016). Consequently, impermeable ice layers can control the percolation depth of surface melt and may control the balance between meltwater runoff and meltwater storage. The process of increasing the proportion of melt that becomes runoff may itself be further intensified by the formation of thicker and more widespread ice layers closer to the ice sheet surface during the warmer and more sustained melt seasons of recent years (Machguth and others, Reference Machguth2016).
Airborne radar investigations have shown an ice slab (i.e. >1 m thick; MacFerrin and others, Reference MacFerrin2019) expansion inland of up to 44% between 2012 and 2018 (Jullien and others, Reference Jullien, Tedstone, Machguth, Karlsson and Helm2023). Consequently, the refreezing capacity of the GrIS is likely to be reducing because firn pore space is becoming inaccessible due to the formation of more impermeable ice layers which instead increases the propensity for meltwater to become runoff (Fig. 1; Machguth and others, Reference Machguth2016). Modelling studies have suggested that the formation of impermeable ice layers could double runoff across the GrIS, for the same amount of surface melting by the middle of the 21st century (MacFerrin and others, Reference MacFerrin2019).
However, the physical and thermal controls on the permeability of ice layers remain uncertain (Fig. 1). This uncertainty is heightened by the high spatial variability in snow and firn densities (Parry and others, Reference Parry2007) and continuity of ice layers in the accumulation zone of the GrIS. Furthermore, different extrinsic thermal conditions can generate quite different patterns of melting, ice layer formation, degradation and further percolation. In a cool summer with intermittent warming, very thin ice layers (<1 cm thick) act as a barrier to vertical percolation (Bell and others, Reference Bell2008). Conversely, in situ observations from the percolation zone of the GrIS have shown meltwater can penetrate through ice layers up to 12 cm thick when surrounding snow and firn temperatures are sustained at ∼0°C during the melt season (Samimi and others, Reference Samimi, Marshall and MacFerrin2020).
Idealized schematic of water flow over ice layers (both continuous and discontinuous) in the accumulation zone with surface features also noted which contribute meltwater into the interior of the GrIS. The exact location of the runoff limit is currently not known.

Given the correct conditions, ice is a permeable material. Theoretical- (Lliboutry, Reference Lliboutry1971, Reference Lliboutry1996) and laboratory-based results reveal that glacier ice is permeable, and water is able to reside and be transported at vein boundaries of ice layers (Fowler and Iverson, Reference Fowler and Iverson2023). Preferential pathways can develop in these water veins depending on their size, water content and the potential for air bubble clogging (Lliboutry, Reference Lliboutry1971). However, the processes and conditions that enable meltwater in snowpacks to percolate through ice layers formed by refreezing of percolating meltwater, and over what spatiotemporal scales, are largely unknown.
The permeability of snow and firn has been studied for cold conditions where air-snow exchange processes are important for understanding and accurately interpreting the chemical composition of ice core records for climate reconstructions (e.g. Albert and others, Reference Albert, Shultz and Perron2000). The extent to which ice layers are impermeable to percolating surface meltwater across ice sheets has long been acknowledged as uncertain (Pfeffer and others, Reference Pfeffer, Meier and Illangasekare1991). Similar questions for seasonal snow packs has motivated studies such as Albert and Perron (Reference Albert and Perron2000) who measured permeability of seasonally created refrozen ice layers, although this study focussed on air permeability rather than directly measuring water permeability.
Dye tracing has been an effective method to track meltwater pathways in the presence of ice layers in the field (Marsh and Woo, Reference Marsh and Woo1984; Bell and others, Reference Bell2008; Eiriksson and others, Reference Eiriksson2013; Clerx and others, Reference Clerx2022), however, observing and understanding the physical and thermal controls on ice layer permeability from field-based investigations is challenging. This is because field measurements are temporally and spatially discontinuous due to constraints imposed by weather conditions or difficult logistics. It has recently been acknowledged that well-conceived laboratory experiments could be highly valuable in improving our understanding of firn and meltwater dynamics (Vandecrux and others, Reference Vandecrux2020). Although laboratory experiments cannot recreate the natural scales of variability in intrinsic and extrinsic controls on meltwater interaction with firn and ice layers, they can bridge a gap between nature and computer models. Laboratory experiments can help constrain model criteria and parameters if they can physically simulate specific aspects of the environment that can be manipulated and monitored. As McCutchan and Johnson (Reference McCutchan and Johnson2022) put it, ‘Testing the physical mechanics associated with individual parameters to validate models is perhaps the best way to move forward with laboratory experimentation’ (ibid, Section 4, p. 24). More specifically, this study presents temperature-controlled, laboratory experiments, systematically simulating and monitoring refreezing, runoff and percolation of meltwater as it intercepts with ice layers of varying thickness and under different thermal conditions.
2. Study objectives
Herein, we describe and present results from temperature controlled cold-laboratory experiments to observe and monitor the effective permeability of predefined ice layers within snowpacks that are injected with dyed meltwater to simulate surface melt within two defined thermal regimes: (a) cold and (b) temperate. In both cases, the thermal regime must be consistent with a snowpack experiencing melt at its upper surface; hence, our definition of a ‘cold’ snowpack is relative to summer melt conditions, not the much more extreme cold conditions that develop during the Arctic winter months. Field measurements have demonstrated that early melt-season, intermittent surface melt events can occur whilst the underlying snow and firn remains significantly below zero. For example, Samimi and others (Reference Samimi, Marshall and MacFerrin2020) measured early melt season melt events in the accumulation zone of the GrIS that occurred whilst snow temperatures remained at c. −1°C at just 0.3 m depth below the surface and between −3°C and −2°C at 0.6 m depth (ibid, their Fig. 2). Herein, we define this type of thermal regime as ‘cold’. Later in the melt season, after prolonged episodes of warmer temperatures, a more isothermal snowpack may develop where temperatures at or very close to 0°C can extend to depths of over a metre (e.g. Bell and others, Reference Bell2008; Humphrey and others, Reference Humphrey, Harper and Pfeffer2012), herein termed ‘temperate’. Our experimental approach allows us to systematically explore how: (1) different thermal regimes can impact ice layer permeability and (2) different ice layer thicknesses can act as either a barrier to percolating meltwater or whether ice layers can be degraded and allow further deeper percolation.
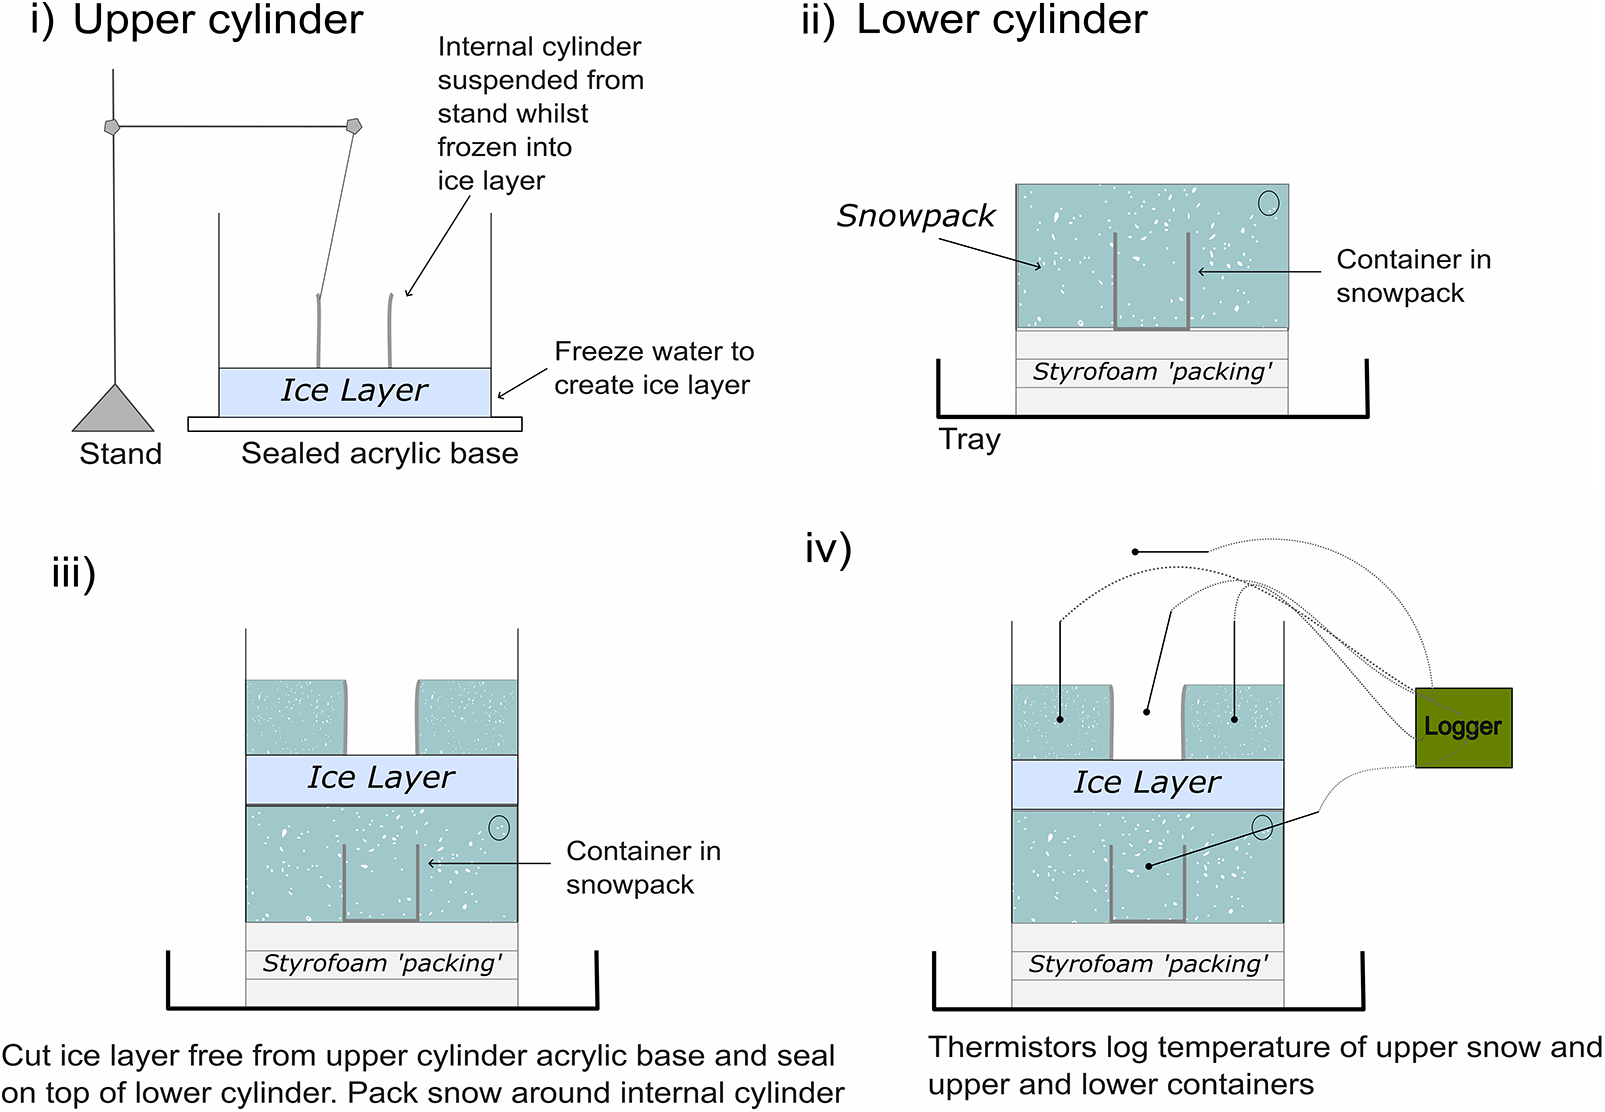
Four stage process of constructing cold regime experimental set-up. Stages explained in full in Section 3.1.

3. Methods and cold-laboratory set-up
The primary aim of the experiments is to monitor and measure the interaction of meltwater with ice layers of varying thickness to determine ice layer permeability under varying thermal regimes. Consequently, the physical properties of the overlying snow or firn should be sufficient to deliver water to the ice layer in a physically and thermally realistic manner. The snowpacks for all experiments were made with artificially generated snow, obtained from the Energy House 2.0 at the University of Salford (https://energyhouselabs.salford.ac.uk/labs/energy-house-2-0/). An elevated snow machine (also referred to as a snow lance) is used. The snow lance is an aluminium tube up to 12 m long with fine nozzles at the tip. A mixture of air and water is blown through these. The water atomizes into fine droplets, which then freeze within sub-zero air temperatures as low as −18°C, falling to the ground as fine ice crystals. The snow that is produced is physically no different from naturally formed snow since it consists of ice crystals, which are nothing more than pure frozen water with air inclusions. Snow was collected into 46 L Cambro insulated boxes and transferred to the University of Liverpool snow lab. Following packing, transportation and storage, snowpack densities fell within a representative range of values for snow or near surface firn found within percolation zones, namely ∼400–550 kg m−3 (Parry and others, Reference Parry2007). Snowpack grain sizes were measured using a BCA Polycarbonate Crystal Card at the start of experiments. Grain sizes were typically ∼1–1.5 mm and were characterized by rounded or irregular crystal shape, sizes and shapes typical of wind-blown snowpacks observed and measured in percolation zone of the GrIS (Scott and others, Reference Scott, Mair, Nienow, Parry and Morris2006; McDowell and others, Reference McDowell, Keegan, Wever, Osterberg, Hawley and Marshall2023). Snow above and below ice layers had no internal lateral stratigraphic structure as it served mainly as a medium through which to ensure: (i) the realistic delivery of meltwater to the ice layer surface; and (ii) a realistic thermal regime for the ice layer and meltwater as they interact. Our experimental set-up is therefore more representative of fairly ‘mature’ snow or firn in which the prior presence of meltwater in the snow/firn column creates a more homogenized snow/firn microstructure where internal layering is diminished (McDowell and others, Reference McDowell, Keegan, Wever, Osterberg, Hawley and Marshall2023). We now describe the equipment and process followed to set up the experiments for the two thermal regimes, ‘cold’ and ‘temperate’.
3.1. Snowpack construction for cold conditions
Each snow column experiment for ice layers within the cold snowpack (SnPkcold) was conducted within two vertically stacked Perspex (acrylic) columns that have internal diameters of 215 mm and wall thicknesses of 2 mm. The columns used were made of transparent Perspex to allow visual inspection of the experiments that were monitored by a time-lapse camera (Afidus ATB100). The upper column was 500 mm in height; had 6 holes drilled through the sides for the insertion of 4 thermistors and 2 runoff tubes and was initially mounted and sealed on a rigid acrylic base. Once the seal was dried and water-tight (after 24 h), water was poured into the bottom of the column and left to fully freeze within the cold lab at air temperature of −3°C for over 24 h. Preliminary experiments had determined that freezing the water with this intensity and duration was more than sufficient to ensure ice layers were fully frozen. Initial water depths varied for each experiment to create ice layers of specific varying thickness (Fig. 2(i)).
A second lower 300 mm tall cylinder, with the same diameter and thickness, had one hole drilled 50 mm below the top of the cylinder for thermistor insertion. The artificially generated snow was ground and packed to make the sample as homogenous as possible within the target bulk density range of 400–550 kg m−3. This lower cylinder was placed in a large plastic drip tray and packed with 200 mm of Styrofoam, topped with 100 mm of snow (Fig. 2 (ii)). Once the ice layer within the upper cylinder was frozen, the rigid acrylic base was removed and the whole upper cylinder was placed on top of the lower cylinder, so the ice layer now lay directly above the 100 mm lower snowpack (Fig. 2(iii)). The two cylinders were sealed together with watertight sealant and snow was packed into the top cylinder to create an upper 300 mm deep snowpack above the ice layer. The bulk density of the snowpacks was determined by weighing the mass of the snow packed into the known volumes of the upper and lower cylinders (Fig. 2 (iv)).
Thermistors were inserted into the overlying snowpack at heights of 10, 130, and 250 mm through the pre-drilled holes in the upper cylinder and through the hole 50 mm below the ice layer in the lower cylinder. A final fifth thermistor was positioned immediately above the snowpack to measure air temperature. The upper cylinder also had two drill holes immediately above the ice layer to which were attached 10 mm PVC piping, covered with pipe insulation (Fig. 2(iv)). These pipes acted as ‘grommets’ to drain meltwater that laterally ran off over the ice layer to account for lateral flow conditions which are observed in snowpacks in the Arctic (Eiriksson and others, Reference Eiriksson2013; Clerx and others, Reference Clerx2022).
Finally, a 5 L jug containing dyed ‘meltwater’ was left to cool overnight and its surface froze over. The dye used for the experiments was Horbin Drain Tracing Dye (Blue) (batch DD050623/DD050923). This dye was selected as it has negligible impact on salinity of the water, with pH remaining between 7 and 8 at a 1% concentration. Before experiments were undertaken the dyed ice/water mix was filtered to remove ice so very cold liquid dyed ‘meltwater’, with a temperature of ∼0.2°C, was used to simulate surface melt in the subsequent experiments (Section 3.4).
3.2. Snowpack construction for temperate conditions
Constructing SnPktemp required a different experimental set-up since the laboratory air temperature is set at +1°C, meaning that if the same set-up was conducted as above (Section 3.1), the ice layer would melt away from the Perspex walls and meltwater would eventually flow down the side of the ice layer undermining the experiment. To circumvent this issue, a cylinder with a narrower diameter than the Perspex column (i.e. 75 mm base diameter and 160 mm tall) was frozen onto the surface of the ice layer, created within a slightly shorter (300 mm) upper cylinder (Fig. 3 (i)). Dyed ‘meltwater’ would be poured directly into this narrower container allowing water to pond on the ice layer surface directly, simulating conditions observed within the wet snow zones (Clerx and others, Reference Clerx2022). Freezing the inner container into the ice layer creates a watertight seal that enables meltwater to pond at the surface of the ice layer without leaking around the slowly melting circumference of the ice layer. The lower cylinder in the drip tray was set up as above (Section 3.1) but with the inclusion of an additional container placed underneath the ice layer, directly below the upper, narrower cylinder in which meltwater will pond (Fig. 3 (ii) and (iii)). Snow was packed into the upper cylinder, surrounding the narrower meltwater container (Fig. 3 (iv)). For these temperate regime experiments, two thermistors were inserted into the surrounding snowpack above the ice layer to monitor the thermal conditions, two thermistors were placed in the narrower containers above and below the ice layer and, as above, a fifth thermistor was positioned above the upper snowpack to monitor air temperature (Fig. 3 (iv)).
Four stage process of constructing temperate regime experimental set-up. Stages explained in full in Section 3.2.

3.3. Thermistor deployment
Both experimental set-ups measured air and snowpack temperatures using negative temperature coefficient thermistors (Fenwell UNI-curve 192-502-LET-AOI) that were attached to plastic rods and inserted into the snow column. The thermistors were soldered onto speaker cable and made waterproof with adhesive lined heat shrink. The thermistor thickness was 7 mm, inclusive of the thermistor, tape and needle in which it was attached. The needles were 200 mm in length to ensure they could be inserted from outside of the Perspex column. The temperatures returned by the thermistors were logged by a Campbell Scientific CR1000X datalogger. The resistance ratio of each thermistor was measured by a 22 kΩ reference resistor which was recorded with a high-precision multimeter. Calibration of the thermistors was performed by submerging the string in a well-mixed, distilled-water-ice bath before logging temperatures at one-minute intervals. Repeating this calibration led to errors within ∼0.03°C. All thermistors logged temperature every 30 s throughout each experiment.
3.4. Experimental description
3.4.1. Cold regime experiments
Six temperature-controlled experiments were undertaken for the cold thermal regime (SnPkcold), each with a duration of three hours and where each snowpack contained an ice layer with predefined thickness (Fig. 4). Four of the six experiments incrementally varied the thickness of the ice layer by 5 mm (between 5 and 20 mm). The two further experiments were undertaken for 10 mm ice layer for repeatability purposes. Information relating to these experiments can be found in Table 1. Over a 70-min period in 10-min intervals, 2.8 L of meltwater was sprayed evenly, via a manual spray gun, across the upper snowpack surface to create an initially dispersed source of dyed ‘meltwater’. The area of the Perspex column is 380 cm2 and so the snowpack was exposed to 74 mm of water equivalent in total. Whilst these simulated melt regimes are typically higher than expected at high elevations of the GrIS, the extreme melt conditions provide insights into the capabilities of meltwater to degrade thin ice layers. Under real, early melt season conditions, spatially concentrated high melt-fluxes can be generated even under predominantly cold conditions via so called ‘finger-flow’ of meltwater vertically through snow and firn (Marsh and Woo, Reference Marsh and Woo1984; Avanzi and others, Reference Avanzi, Hirashima, Yamaguchi, Katsushima and De Michele2016). Finger-flow can develop from small-scale instabilities in the meltwater flux or can be generated by structural heterogeneity in the snowpack itself. It enables liquid meltwater to percolate to depth within cold, dry, sub-zero snow and firn ahead of the wetting front, which is associated with isothermal snow at or close to 0 °C (Marsh and Woo, Reference Marsh and Woo1984; Humphrey and others, Reference Humphrey, Harper and Pfeffer2012). Once all the meltwater was introduced, the snowpack was then left for a remaining ∼2 h to observe the structural integrity of the ice layer and monitor the thermal properties of the snowpack above and below the ice layer. The cold-laboratory ambient air temperature was set at −3°C throughout the cold regime experiments so that the interaction of meltwater with an ice layer underlain by a cold snowpack could be explored systematically.
Temperature controlled laboratory snowpack experiments for cold thermal regimes. Both photograph (a) and schematic diagram (b) show the key monitoring equipment used in each experiment set-up.

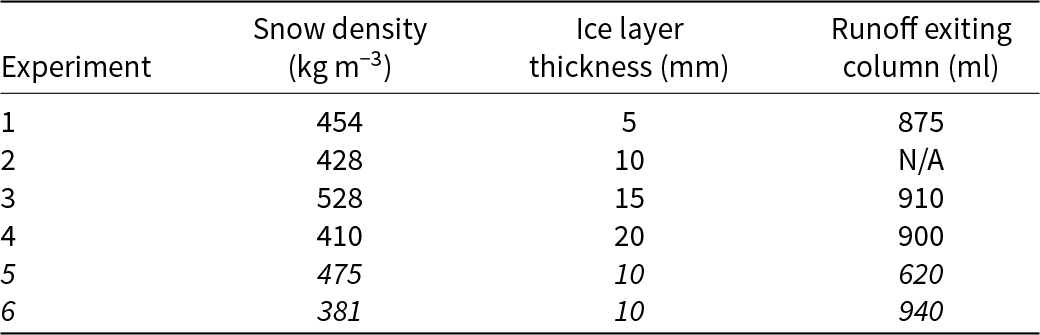
The density of snow (kg m−3), ice layer thickness (mm) and amount of runoff exiting the column (ml) for each experiment. The repeated experiments (5 and 6) with a 10 mm ice layer have their text italicized.

All the experiments were conducted with similar thermal boundary conditions and the same melt regimes. Bulk density of the snowpacks was not precisely controlled (but was measured), varying over a range of realistic values. For this study the snow/firn density above and below the ice layer is not critical but was required to be sufficiently realistic to ensure that the delivery and interaction of meltwater with the ice layer happens within a realistic physical and thermal regime. The only key factor that changed between experiments was the ice layer thickness. At the end of each experiment, the snow/firn columns and ice layers were carefully removed from Perspex cylinders for manual and visual inspection.
3.4.2. Temperate regime experiments
For SnPktemp six experiments were conducted over longer durations (up to 24 h). For each experiment, 250 ml of dyed meltwater (∼0oC) was poured into the narrow cylinder above the ice layer where it ponded without entering the surrounding snow (Fig. 5). The thickness of the ice layer for each of the six experiments incrementally varied by 10 mm from 10 to 60 mm. Information relating to these experiments can be found in Table 2. As for the experiments for SnPkcold, thermal boundary conditions for the temperate regime experiments were similar for each experiment, snow densities varied within a realistic range, and the key variable was ice layer thickness.
Temperature controlled laboratory snowpack experiments for temperate thermal regimes. Both photograph (a) and schematic diagram (b) show the key monitoring equipment used in each experiment set-up. Schematic is also shown of the idealized start and end configuration of temperate regime experiments (c).

The density of snow (kg m−3) and ice layer thickness (mm) for each temperate snowpack experiment.

Since the meltwater is slightly warmer than the surrounding snowpack (Section 3.1), thermistor measurements provide a thermal indicator of timing of percolation of meltwater through the ice layer (Samimi and others, Reference Samimi, Marshall and MacFerrin2020). Thus, as meltwater breaks through or permeates the ice layer, its drainage through the ice layer would be captured and monitored by changes in the thermistor temperatures above and/or below an ice layer. Note that both the incursion of meltwater to a thermistor, or the drainage of meltwater away from a thermistor will register changes in temperature that can establish the presence or absence of water respectively.
The dyed ‘meltwater’ allowed the experiments to be monitored visually. As for the cold regime experiments, the snow/firn columns and ice layers were carefully removed from Perspex cylinders at the end of each experiment for manual and visual inspection to identify or confirm meltwater routing, destination and potential change of state (i.e. refreezing).
4. Results
4.1. SnPkcold: cold thermal regime
The snow used in these experiments ranged in density from 381 to 528 kg m−3 (Table 1) which are typical of the range of snow and firn densities observed before and after summer melt at the surface and near surface (upper ∼1.5 m) of the percolation zone region of the accumulation area of the GrIS (Parry and others, Reference Parry2007).
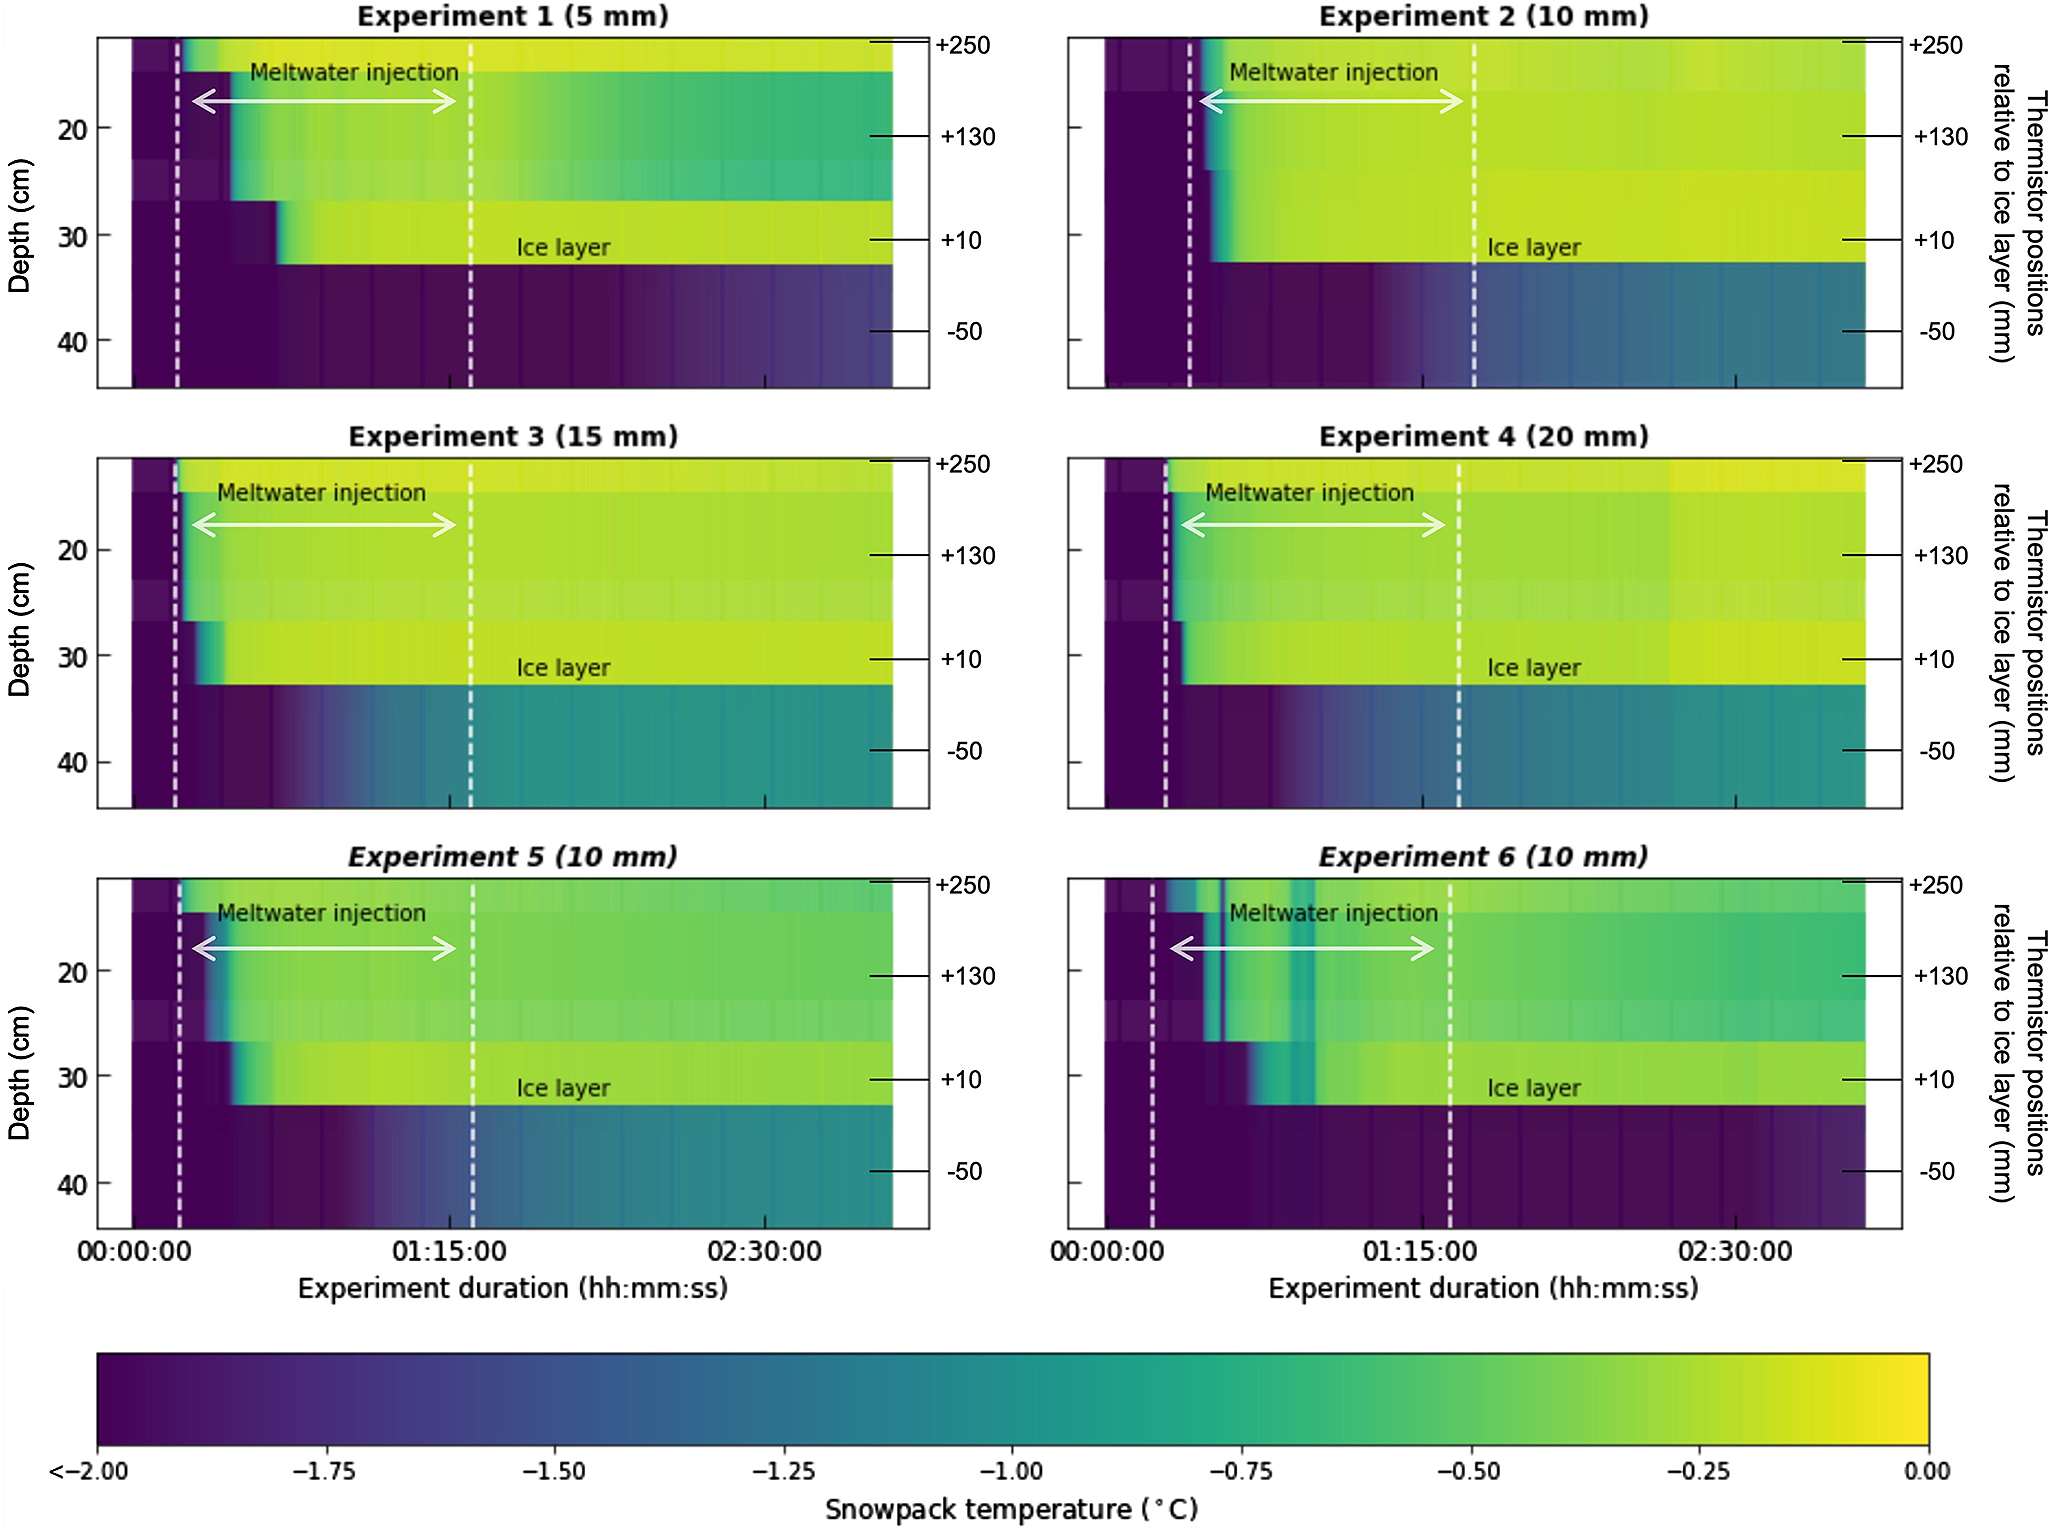
All the ice layers, no matter the thickness, remain intact. They block deeper percolation into the lower snowpack beneath the ice layers and all the injected meltwater either ponds and refreezes in the upper snowpack or runs off (Table 1). Consequently, under cold conditions all ice layers effectively remain impermeable throughout the duration of the experiments (Fig. 6). The temperature of the entire snowpack increases once the meltwater is injected, however the magnitude of this increase is less pronounced in the snow below the ice layer (Figs. 7 and 8). The time of first injection of meltwater to the surface to the time when thermistor temperature immediately above the ice layer rises indicates the time taken for meltwater to vertically percolate via ‘finger-flow’ through the full overlying snowpack depth. This ranges between ∼10 and ∼30 min (Fig. 8) which equates to specific vertical meltwater travel times between ∼0.3 and 0.8 min cm−1. These are consistent with values for vertical meltwater percolation through snow and firn measured in the field (Clerx and others, Reference Clerx2022) and in laboratory experiments (Avanzi and others, Reference Avanzi, Hirashima, Yamaguchi, Katsushima and De Michele2016).
Snow column from experiment 1, 3 h post-experiment, showing dyed meltwater injection from front (a) and side (b) views. The 5 mm ice layer clearly retards downward penetration of the meltwater into the underlying snow.

Snowpack temperatures from probe immediately above and below the ice layer for the duration of each experiment. The repeated experiments with a 10 mm ice layer are followed with (1) and (2). Note gaps in data for ice layer thickness 10 mm (2) (purple line) were due to short term logger error.

Representation of snowpack temperature profiles for the duration of the cold regime experiments. The dashed white lines indicate the 70-min period that meltwater was periodically injected into the snowpack for each experiment. Annotations also include the position of the ice layer and representation of thermistor positions relative to the ice layer (though not to scale to focus plot on middle and lower snowpack around the ice layer). Each profile consists of four temporally evolving colour blocks which scale with the snowpack temperature at each of the four thermistors. The title of each plot has the ice layer thickness used in the respective experiment. The repeated experiments (5 and 6) with a 10 mm ice layer have their titles italicized.

After the meltwater is injected, the snow below the ice layer remains at least ∼1°C cooler than the overlying snow which is completely saturated by meltwater (Fig. 6). The ice layer also enables meltwater to run off via the grommets. Runoff occurred during all but one experiment (experiment 2). Figure 8 highlights the subtle changes in temperature gradient within the upper snowpack as meltwater percolates, runs off and refreezes and highlights the major effect that the ice layer has in creating a strong thermal gradient across the ice layer, as well as a creating a hydrological barrier. The first, fifth, and sixth experiments show cooler snow in the centre of the upper snowpack by the end of the experiments (i.e. the thermistor positioned 130 mm above the ice layer) compared to the other experiments (Fig. 8). No runoff exited the snowpack in experiment 2 owing to blockage of the drainage tubes by ice, possibly due to refreezing. In this experiment, the overlying snow temperature rises to a slightly higher temperature, just below freezing (Fig. 8, Experiment 2).
4.2. SnPktemp: temperate thermal regime
The snow used in the six experiments ranged in density from 430 to 496 kg m−3 (Table 2). Visual inspection of the experimental set-up at the end of all temperate regime experiments showed that meltwater percolated through all the ice layers (e.g. Fig. 9).
(a) Entire snow column (temperate) at the end of the experiment when the meltwater had percolated out of the upper cylinder through the ice layer. (b) Vertical view of the lower part of column with the ice layer removed revealing the container stored below the ice layer which has captured the meltwater that had percolated through the ice layer. The upper container seal never breached from the ice layer surface, meaning the dyed meltwater could only have percolated through the ice layer.

The thinnest ice layer (10 mm) showed evidence of thin fractures directly under the ponded meltwater in the narrow upper cylinder, which later refroze. Thicker ice layers (20–60 mm) were also permeable; however, the meltwater percolated through the ice via water veins (Fig. 10), leaving the ice layer itself intact.
Dyed meltwater flowing through water veins through the 30 mm ice layer (a) and seepage perocolating through the 40 mm ice layer (b) at the end of the temperate experiments. Photos show ice layers in their correct orientation, i.e. with the upper surface towards the top.

Thermistor temperature data above and below ice layers can be interpreted to show evidence for the time when meltwater percolated through the ice layers and when they became permeable (Fig. 11). Because the snow is porous, upper snowpack temperature reflected recorded variations in laboratory air temperature which fluctuated slightly as the fans within the cold laboratory turned on and off to regulate the ambient air temperature. The temperatures recorded in ponded water above the ice layer were initially more constant in time since the meltwater masked the laboratory air temperature fluctuations. Similarly, temperatures recorded in the snow beneath the ice layer were relatively stable because the ice layer above sealed off the lower snowpack and its container from the fluctuations in laboratory air temperature.
Time-series of temperature data for each temperate experiment of the snowpack above the ice layer (faded Orange line), below the ice layer (red line) and the upper container which ponded the meltwater (blue line).

When the meltwater percolates through the permeable ice layer it drains out of the ponded meltwater container above the ice layer. The temperatures recorded within this container (shown separately for all six temperate experiments in Fig. 12) changes from a relatively constant value to showing a pattern of fluctuating temperature as recorded in the surrounding snowpack and in the cold room. Thus the timing of the onset in temperature fluctuations in the upper container indicates an absence of ponded meltwater and hence is interpreted to provide the time when meltwater percolated through the underlying ice layer.
Temperature time series of thermistors within upper ponded meltwater container for all temperate experiments. Vertical arrows denote estimated times of meltwater breakthrough for each experiment.

During experiments 7 and 10 meltwater percolated directly into the container below the ice layer (as shown in Fig. 9b), registering a drop in temperature. In these two cases, these drops in temperature occurred at the same time that temperature fluctuations began within the cylinder above the ice layer (Fig. 11). This slight drop in temperature may be due to movement of the thermistor as the meltwater arrives or due to the meltwater having been cooled as it permeated through the ice layer.
There was no relationship between ice thickness and the time it took for meltwater to permeate the ice layer (Table 3). For each experiment we noted the temperature below the ice layer at the time the meltwater permeated the ice layer (Table 3). Temperatures ranged from −0.09 to −0.2°C with an average of −0.15°C.
Temperature of snow/firn immediately beneath ice layer at time meltwater permeated through the ice layer alongside corresponding percolation rates through ice layers of different ice thicknesses.

5. Discussion
When the thermal regime is cold (i.e. snow/firn temperature immediately below the ice layer is <−1°C) all ice layers are impermeable and force meltwater to pond, runoff and eventually refreeze. Even the thinnest ice layer (5 mm), exposed to extreme meltwater fluxes, provides an impermeable barrier to meltwater and is resilient to degradation and fracturing. In all but one of the experiments, some of the meltwater ran off over the ice layer. The meltwater accesses the cold snow, firn or ice at depth via finger-flow and is retarded for sufficiently long by the pre-existing ice layer for the cold content of the snow and ice to cause the meltwater to refreeze. Refreezing of meltwater on top of the pre-existing ice layer thickens the ice and creates a greater physical barrier which further impedes any subsequent vertical penetration of meltwater by finger-flow to the ice layer surface.
The removal of meltwater by runoff affects the snowpack temperature above the ice layer in two ways. Firstly, the meltwater is slightly warmer than the surrounding snow, so its removal by runoff reduces the impact of this warmer water on the nearest thermistors. Secondly, the reduced presence of meltwater above the ice layer leads to reduced refreezing as the experiment progresses. Refreezing releases latent heat into the surrounding snowpack causing slight snowpack warming. Consequently, less refreezing means less warming of the snowpack. The experiments are consistent with previous modelling (e.g. Morris and others, Reference Morris, Mair, Nienow, Bell, Burgess and Wright2014) that show that, over the course of a melt season, runoff across ice layers helps maintain some of the refreezing capacity (i.e. the pore space and cold content) within the snow/firn above. This process will result in subsequent melt and refreezing events being concentrated above ice layers, close to the ice sheet surface, for example within colder snow/firn of the accumulation zone of the GrIS (e.g. Machguth and others, Reference Machguth2016).
When the snowpack is temperate, ice layers of all thicknesses tested here (10–60 mm) were permeable and allowed meltwater to percolate to greater depths. Our experiments find that the percolation of meltwater through the ice layer occurs once the temperature immediately below the ice layer reaches c. −0.15°C (Table 3). For the thinnest ice layer (10 mm), permeability was due to small fractures forming in the ice layer beneath the ponded meltwater, whilst the thicker layers remained intact but experienced meltwater seeping into the ice and being transported through the layer via water veins (Fig. 10; Fowler and Iverson, Reference Fowler and Iverson2023).
Temperate ice layers can become permeable in as little as ∼4–8 h (Table 3) and therefore show relatively fast percolation rates, significant within a diurnal cycle. There is no correlation between the thickness of an ice layer and how long it takes for water to percolate through it. Thus, the thickness of an ice layer is not a first-order control on its permeability, however thickness may determine the mechanism of meltwater percolation (i.e. fractures vs ‘seeping’).
The rates of vertical percolation of water through temperate ice that we observe (1.4–7.5 mm h−1; Table 3) lie within the range of potential values for the mean vertical velocity of water through ice veins calculated theoretically by Nye and Frank (Reference Nye and Frank1973), equivalent to values from 0.3 to 32 mm h−1 (their Table II and p. 161). Lliboutry (Reference Lliboutry1971) questioned these percolation rates through glacier ice (n.b. Nye and Frank’s work was in press when cited by Lliboutry) and suggested a glacier would be melted within ∼4 years if their calculations were correct (Lliboutry, Reference Lliboutry1971; his Equation 4). Lliboutry (Reference Lliboutry1971) proposed that Nye and Frank (Reference Nye and Frank1973) had not considered the effect that the constant deformation and recrystallization of glacier ice under pressure would have in blocking vein pathways and rendering glacier ice effectively impermeable. However, near-surface ice layers, formed by refreezing of percolating meltwater within snow and firn, have not been subject to the continuous high stress environment of glacier ice and have very different crystal structure to glacier ice. As Lliboutry acknowledges in a later paper, even for ‘a stress-free sample [of glacier ice], permeability is totally different from in situ [i.e. ice under pressure]’ (Lliboutry, Reference Lliboutry1996; p. 211). It is important that assumptions about the impermeability of glacier ice, that have formed the focus of many studies over the past several decades, are not applied to the low stress environment and history of near surface ice layers formed by refreezing of surface meltwater. Our work presented here shows that vertical percolation rates through ice formed by refreezing of meltwater can be relatively fast once the ice layer is raised to temperatures close to the melting point (i.e. −0.15°C; Table 3).
Our laboratory experiments support field-based observations in the percolation zone of the GrIS that have shown meltwater can penetrate ice layers (∼12 cm thick) when the surrounding snow and firn is temperate (Samimi and others, Reference Samimi, Marshall and MacFerrin2020). Samimi and others (Reference Samimi, Marshall and MacFerrin2020) were unable to determine the exact cause of deeper percolation concluding it was likely due to fractures or discontinuities developing in the ice layers (Samimi and others, Reference Samimi, Marshall and MacFerrin2020). We have extended on these findings by observing the mechanism of meltwater percolation through ice layers in snowpacks and showing the ability for meltwater to seep through an ice layer that can remain continuous and intact.
We appreciate laboratory investigations are limited in scale and are not necessarily a full reflection of field-based conditions. Field and remotely sensed observations from the GrIS have revealed ice layers can be up to 16 m in thickness (MacFerrin and others, Reference MacFerrin2019), whilst discontinuous ice lenses can be <5 mm at high elevations (Clerx and others, Reference Clerx2022) which can be difficult to observe by airborne radar depending on the spatial resolution (Culberg and others, Reference Culberg, Schroeder and Chu2021). Therefore, the ice layers used in our experiments represent the lower-end of observed thicknesses, more typical of those found at high elevations of the percolation zone of the GrIS (Parry and others, Reference Parry2007).
6. Summary and conclusions
Our experiments demonstrate that even thin ice layers are impermeable to meltwater ponding above them as long as the snow/firn immediately beneath them remains cold. This holds even when the simulated flux of meltwater to the ice layer is very high (as can be experienced during episodes of vertical percolation by ‘finger-flow’). However, if the snowpack immediately below the ice layer can be raised to temperatures just below the melting point for just a few hours, refrozen ice layers can be permeable. Based on our experiments, the threshold temperature immediately below the ice layer that determines whether the overlying ice layer is impermeable or permeable is c. −0.15°C. Although not able to be tested in the laboratory, we hypothesize that much thicker ice layers will also be permeable if temperate conditions are maintained for sufficiently long without interruption by refreezing (for example due to penetration of a surface cold wave). Field evidence would suggest this holds for ice layers up to several tens centimetres thick (Samimi and others, Reference Samimi, Marshall and MacFerrin2020).
We of course appreciate that ice layers in nature can be discontinuous over scales ranging from 100 to 103 m, particularly for the thinner range of ice layers represented by our experiments. Consequently, in reality such heterogeneity may enable cold or very thick ice layers to be circumvented by complex three-dimensional meltwater flow pathways through cold snow and firn. Although no laboratory experiment can replicate all scales of such structural heterogeneity, neither can most models. Therefore, to be useful for constraining model criteria for ice layer permeability, our experiments have represented, in a physically realistic manner, a key process that is incorporated into computer models, namely the interaction of meltwater percolation to ice layers within snow and firn of varying thermal regimes.
Many snow and firn models do not account for runoff over impermeable ice layers and essentially assume that all ice layers are potentially permeable (Steger and others, Reference Steger2017). Those models that do incorporate impermeable ice layers suggest meltwater cannot penetrate ice layers of any thickness (Buzzard and others, Reference Buzzard, Feltham and Flocco2018), whilst others allow permeability of ice layers, dependent upon their thickness, but regardless of thermal conditions (Ashmore and others, Reference Ashmore, Mair and Burgess2020). We suggest models should not allow water to degrade any ice layer and percolate to further depths if the thermal regime is cold in the domain. When snowpack conditions warm and become temperate, ice layers can become permeable in relatively short timescales (∼4–8 h) and allow meltwater to percolate to deeper depths. We propose that models (e.g. Laha and others, Reference Laha2025) should reflect these findings that the thermal regime of a snowpack is the primary control on ice layer permeability. If the base of the ice layer is cold (i.e. < −0.15°C), even thin layers (∼5 mm) are impermeable.
Acknowledgements
We would like to thank Prof. Richard Fitton and Dr Grant Henshaw from Energy House 2.0, University of Salford, for providing the snow for the experiments presented here. This paper was substantially improved after the helpful comments of two anonymous reviewers. This research was supported by the UK Natural Environment Research Council grant [reference: NE/X000435/1], Ice-layer Permeability Control on Runoff from Ice Sheets (IPCRIS).
Author contributions
DWFM, IJN and JML acquired funding for this research following pilot studies undertaken by DWA and DWFM. CJS, DWFM and DWA conceived the laboratory methodology and experimental design. CJS conducted the experiments with input from DWFM and DWA. CJS and DWFM processed the data and wrote the initial manuscript. GLB created all schematics. All authors contributed to the writing and editing of the original manuscript. GLB, DWFM and CJS completed revisions.


 Open access