





Introduction
Multisystem inflammatory syndrome in children emerged as a rare but severe post-infectious complication of severe acute respiratory syndrome coronavirus 2 infection, characterised by hyperinflammation, endothelial dysfunction, and cardiac involvement that is generally transient. Reference Belhadjer, Méot and Bajolle1 However, subtle long-term alterations have been reported. Reference Belhadjer, Méot and Bajolle1,Reference Sirico, Basso and Sabatino2 While most children recover fully, several studies have raised concerns about potential subclinical myocardial remodelling and autonomic or vascular sequelae after the acute phase. Reference You3,Reference Mavrogeni, Kolovou and Tsirimpis4 The acute phase of multisystem inflammatory syndrome in children is marked by profound elevations in cytokines such as interleukin-6, lymphopenia, and cardiac biomarker abnormalities, all of which tend to normalise over time; however, the timeline and interrelation of these processes remain incompletely understood. Reference Chou, Thomas and Randolph5,Reference Benvenuto, Simonini and Della Paolera6
Although left ventricular dysfunction during acute multisystem inflammatory syndrome in children is well described, the long-term structural and haemodynamic correlations of residual inflammation remain poorly investigated. Reference Benvenuto, Simonini and Della Paolera6 It is unclear whether mild inflammatory persistence contributes to subtle left ventricular remodelling or whether observed changes merely reflect physiological scaling with growth and body composition. Furthermore, while adiposity and blood pressure are known modulators of left ventricular geometry in healthy children, their interplay with post-inflammatory recovery in multisystem inflammatory syndrome in children remains poorly defined. Reference Tam, Clement, Baur and Tordjman7
Growing evidence indicates that multisystem inflammatory syndrome in children may trigger transient but measurable cardiovascular and inflammatory changes that can persist beyond the acute phase. In particular, it is unclear whether they reflect persistent inflammatory activity, physiological adaptation during recovery, or the influence of growth-related haemodynamic factors. We hypothesised that residual inflammatory activity, particularly interleukin-6 levels, and ambulatory blood pressure parameters may be associated with long-term variations in left ventricular structure. This study aimed to comprehensively characterise the long-term interactions among residual inflammation, ambulatory blood pressure parameters, and cardiac geometry in children recovering from multisystem inflammatory syndrome. Specifically, the study explored whether interleukin-6 levels and lymphocyte counts were associated with echocardiographic indices of left ventricular size and mass, and whether these relationships persisted after adjustment for body size and growth.
Materials and methods
This retrospective observational study included paediatric patients previously diagnosed with multisystem inflammatory syndrome in children who were followed at the paediatric infectious diseases, paediatric cardiology, and paediatric nephrology clinics of the hospital between January 2024 and August 2025. All participants underwent follow-up evaluations approximately four years after the acute multisystem inflammatory syndrome in children episodes to assess long-term inflammatory and cardiac sequelae. Patients aged between 5 and 18 years who met the Centers for Disease Control and Prevention and World Health Organization diagnostic criteria for multisystem inflammatory syndrome in children were included. 8,9 Eligible patients were required to have both acute-phase and follow-up echocardiographic data, as well as parametric variables [height, weight, body mass index, and body mass index z-scores]; laboratory measurements of haematologic parameters (leukocyte counts, lymphocyte counts, and platelet counts); cardiac biomarkers [N-terminal pro–B-type natriuretic peptide and troponin levels]; and inflammatory markers [interleukin-6, ferritin, fibrinogen, erythrocyte sedimentation rate, C-reactive protein, and D-dimer levels]. At follow-up, laboratory measurements and echocardiographic examinations were performed on the same day. Children with CHD, chronic systemic or autoimmune disorders, immunodeficiency, or metabolic diseases were excluded. Those with pre-existing obesity, hypertension, or incomplete follow-up laboratory or echocardiographic data and those with ongoing inflammatory or infectious conditions at the time of evaluation were also excluded from the analysis. Of the 51 patients initially enrolled in the study, 12 who did not attend follow-up visits, five who moved to another city, one who died, and three with incomplete medical records were excluded. The study was therefore completed with 30 patients.
Demographic characteristics, anthropometric data, clinical findings, and laboratory parameters were obtained from hospital medical records. Ambulatory blood pressure monitoring was analysed as 24-hour, daytime, and nighttime standard deviation score values for systolic and diastolic pressure, adjusted for age and sex using paediatric normative data.
Echocardiographic findings obtained during the acute phase of multisystem inflammatory syndrome in children (MIS-C) and at follow-up were classified according to predefined diagnostic categories. Normal findings were defined as the absence of structural or functional cardiac abnormalities. Coronary artery changes were defined as coronary dilatation or aneurysmal involvement based on z-score criteria. Valvular changes referred to the presence of valvular regurgitation or structural valve abnormalities. Pericardial effusion was defined as echocardiographically detected pericardial fluid. Heart failure was defined as reduced left ventricular systolic function with decreased ejection fraction (ejection fraction < 55%). Myocarditis was determined based on clinical presentation supported by echocardiographic evidence of myocardial involvement. The same classification framework was applied at the follow-up evaluation.
Echocardiographic evaluations included measurements of left ventricular end-diastolic diameter, left ventricular end-systolic diameter, interventricular septal thickness in diastole, left ventricular posterior wall thickness in diastole, left ventricular mass, left ventricular mass z-score, left ventricular mass indexed to body surface area (left ventricular mass index), and left ventricular mass indexed to height. Reference Sirico, Basso and Sabatino2,Reference Tam, Clement, Baur and Tordjman7 Ejection fraction during the acute phase and follow-up period was recorded, and the change was expressed as ejection fraction delta. Functional assessment included conventional systolic parameters (ejection fraction and fractional shortening). In addition to conventional systolic parameters, Doppler-derived indices of cardiac function were evaluated. The mitral inflow E/A ratio was obtained using pulsed-wave Doppler at the tips of the mitral valve leaflets in the apical four-chamber view. Tricuspid annular plane systolic excursion was measured by M-mode echocardiography by placing the cursor at the lateral tricuspid annulus in the apical four-chamber view as an indicator of right ventricular systolic function.
Transthoracic echocardiography was performed using a Philips Affinity 50 cardiovascular ultrasound system (Philips Medical Systems, The Netherlands) equipped with an S4–2 phased-array transducer (2–4 MHz). Examinations and measurements were independently evaluated by two experienced paediatric cardiologists, both blinded to participants’ clinical status. In cases of discrepancy, a consensus measurement was obtained.
Serum IL-6 levels were measured using an electrochemiluminescence immunoassay (Elecsys IL-6, Roche Diagnostics, Mannheim, Germany) on a Cobas e601 analyser. The assay characteristics were a measuring range of 1.5–5000 pg/mL, a lower limit of detection of ∼ 1.5 pg/mL, and functional sensitivity (CV <20%) of ∼ 2.5 pg/mL.
This study was approved by the Faculty of Medicine Clinical Research Ethics Committee (Approval No: 2481/2025, Date: September 18, 2025). Due to the study’s retrospective design, the Ethics Committee waived the requirement for informed consent.
Statistical analysis
Statistical analyses were performed by using IBM SPSS Statistics (version 24, IBM Corp., Armonk, NY, USA). The normality of data distribution was examined using the Shapiro–Wilk test. Normally distributed variables were presented as mean ± standard deviation, whereas non-normally distributed data were summarised as median with interquartile range.
For group comparisons (ICU vs. non-ICU; gender; obese vs. non-obese), an independent-samples t-test was used for normally distributed data and a Mann–Whitney U test for nonparametric data. Categorical variables were compared using the chi-square or Fisher’s exact test, as appropriate. Follow-up duration was summarised using median, interquartile range, and minimum–maximum values to assess variability in echocardiographic timing.
Correlations between inflammatory, cardiac, and haemodynamic parameters were evaluated using Pearson’s correlation coefficient (r) for normally distributed variables and Spearman’s rank correlation (r) for nonparametric variables. Variables with p < 0.05 in correlation analyses and deemed clinically relevant were further included in multiple linear regression models to identify independent predictors of cardiac remodelling indices. Multicollinearity was assessed by the variance inflation factor, and predictors with a variance inflation factor <2 were retained. A p-value of <0.05 was considered statistically significant in all analyses.
Results
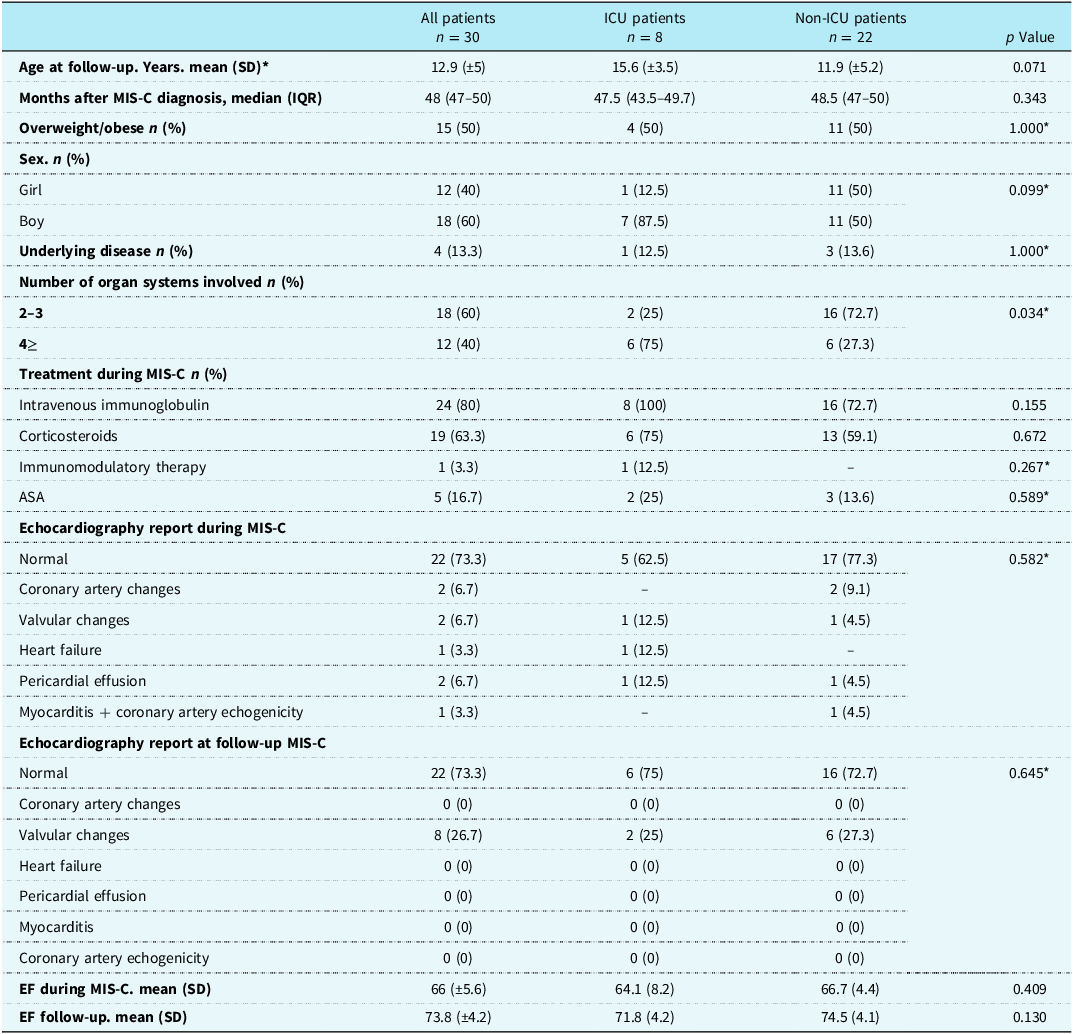
A total of 30 patients meeting the inclusion criteria were assessed, comprising 18 boys (60%) and 12 girls (40%), with a mean age at follow-up of 12.9 ± 5 years. Demographic and clinical characteristics are summarised in Table 1. Eight patients (26.6%) had required ICU admission during the acute phase of multisystem inflammatory syndrome in children. The median time from diagnosis of multisystem inflammatory syndrome in children to follow-up evaluation was 48 months (IQR 47–50; range 22.7–52.7 months). All participants were clinically stable at follow-up examination, with no evidence of residual myocardial dysfunction on echocardiography (Table 2). Doppler-derived parameters of cardiac function were also evaluated. The mean mitral inflow E/A ratio was 1.90 ± 0.35 and remained within age-appropriate normal ranges at the four-year follow-up. Tricuspid annular plane systolic excursion values were within normal limits at the four-year follow-up (mean 21.3 ± 4.6 mm), indicating preserved right ventricular systolic function.
Demographic and clinical characteristics of patients with previous MIS-C according to history of intensive care unit admission

Table 1 Long description
The table presents demographic and clinical characteristics of 30 patients with previous multisystem inflammatory syndrome in children (MIS-C), categorized into ICU patients (n = 8) and non-ICU patients (n = 22). The table includes data on age at follow-up, months after MIS-C diagnosis, overweight/obese status, sex distribution, underlying diseases, number of organ systems involved, treatments during MIS-C, and echocardiography reports during and at follow-up MIS-C. Key columns include age at follow-up with a mean of 12.9 years for all patients, 15.6 years for ICU patients, and 11.9 years for non-ICU patients. The median months after MIS-C diagnosis is 48 for all groups. Overweight/obese status is reported in 50% of all patients, with no significant difference between ICU and non-ICU groups. Sex distribution shows 60% boys and 40% girls overall, with a higher percentage of boys in the ICU group. The number of organ systems involved shows a significant difference, with 75% of ICU patients having 4 or more systems involved compared to 27.3% of non-ICU patients. Treatments during MIS-C include intravenous immunoglobulin in 80% of all patients, corticosteroids in 63.3%, immunomodulatory therapy in 3.3%, and ASA in 16.7%. Echocardiography reports during MIS-C show normal results in 73.3% of all patients, with various cardiac issues reported in smaller percentages. At follow-up, echocardiography reports show normal results in 73.3% of all patients. EF during MIS-C has a mean of 66%, and EF at follow-up has a mean of 73.8%.
SD = Standard Deviation; IQR = Interquartile range; MIS-C = Multisystem inflammatory syndrome in children; ICU = intensive care unit; ASA = Acetylsalicylic acid; EF = Ejection fraction.
* Calculation made by Fisher’s Exact Test.
Echocardiography, inflammatory, and blood pressure findings at follow-up in patients with previous MIS-C
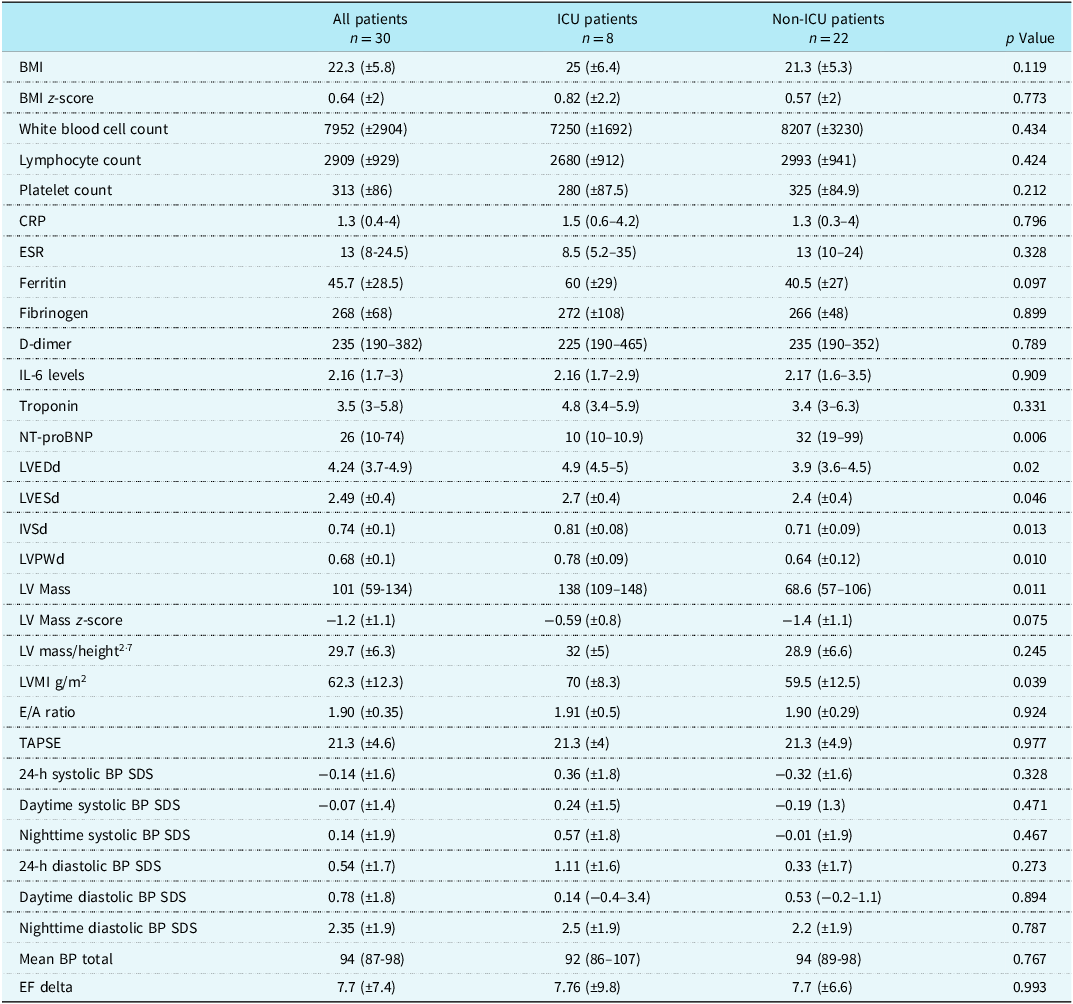
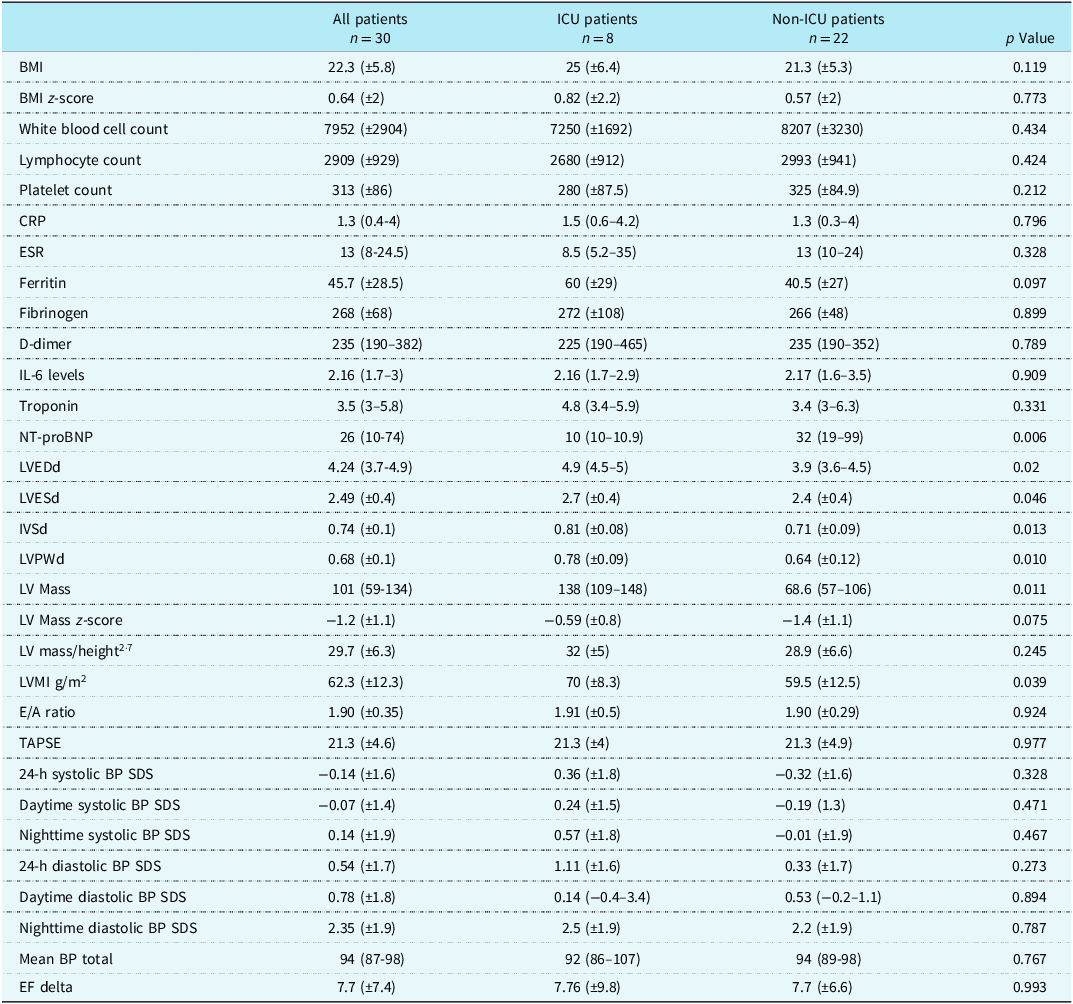
Table 2 Long description
The table presents data on echocardiography, inflammatory markers, and blood pressure findings for 30 patients with previous multisystem inflammatory syndrome in children (MIS-C). It is divided into three columns: All patients, ICU patients, and Non-ICU patients, with 30, 8, and 22 patients respectively. The table includes 30 rows of data, each representing different health metrics such as BMI, white blood cell count, lymphocyte count, platelet count, CRP, ESR, ferritin, fibrinogen, D-dimer, IL-6 levels, troponin, NT-proBNP, LVEDd, LVESd, IVSd, LVPWd, LV Mass, LV Mass z-score, LV mass/height^2.7, LVMI g/m^2, E/A ratio, TAPSE, 24-h systolic BP SDS, daytime systolic BP SDS, nighttime systolic BP SDS, 24-h diastolic BP SDS, daytime diastolic BP SDS, nighttime diastolic BP SDS, mean BP total, and EF delta. Each row provides mean values and standard deviations or medians and interquartile ranges for these metrics across the three patient groups. Notable trends include differences in NT-proBNP, LVEDd, LVESd, IVSd, LVPWd, LV Mass, LV mass/height^2.7, LVMI g/m^2, and nighttime diastolic BP SDS between ICU and Non-ICU patients.
Data are presented as median (IQR) unless otherwise indicated; mean ± SD used for normally distributed variables.
White blood cell count, ×109/L; lymphocyte count, ×109/L; platelet count, ×109/L; CRP = C-reactive protein (mg/L); ESR = erythrocyte sedimentation rate (mm/h); ferritin (ng/mL); fibrinogen (mg/dL); D-dimer (µg/mL); IL-6 = interleukin-6 (pg/mL); troponin (ng/L); NT-proBNP = N-terminal pro–B-type natriuretic peptide (pg/mL); BMI = body mass index; LVEDd = left ventricular end-diastolic diameter; LVESd = left ventricular end-systolic diameter; IVSd = interventricular septum thickness in diastole; LVPWd = left ventricular posterior wall thickness in diastole; LVMI = left-ventricular mass index; TAPSE (mm) = tricuspid annular plane systolic excursion; BP = blood pressure; SDS = standard deviation score; EF = ejection fraction; EF delta = ejection fraction change (%); MIS-C = multisystem inflammatory syndrome in children; ICU = intensive care unit; SD = standard deviation; IQR = interquartile range.
There were no significant differences in laboratory parameters (including leucocyte counts, lymphocyte counts, thrombocyte counts, C-reactive protein, erythrocyte sedimentation rate, ferritin, D-dimer, interleukin-6, troponin, and N-terminal pro–B-type natriuretic peptide) between patients with and without a history of ICU admission during the follow-up multisystem inflammatory syndrome in children phase (all p > 0.05). However, three patients exhibited persistently elevated interleukin-6 levels (10.2–23.3 pg/mL) despite normal N-terminal pro–B-type natriuretic peptide values, normal ventricular dimensions, and preserved systolic function. None of these patients required ICU admission during the acute phase of multisystem inflammatory syndrome in children.
Laboratory and echocardiographic correlations
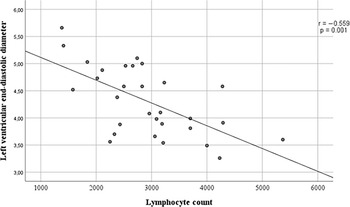
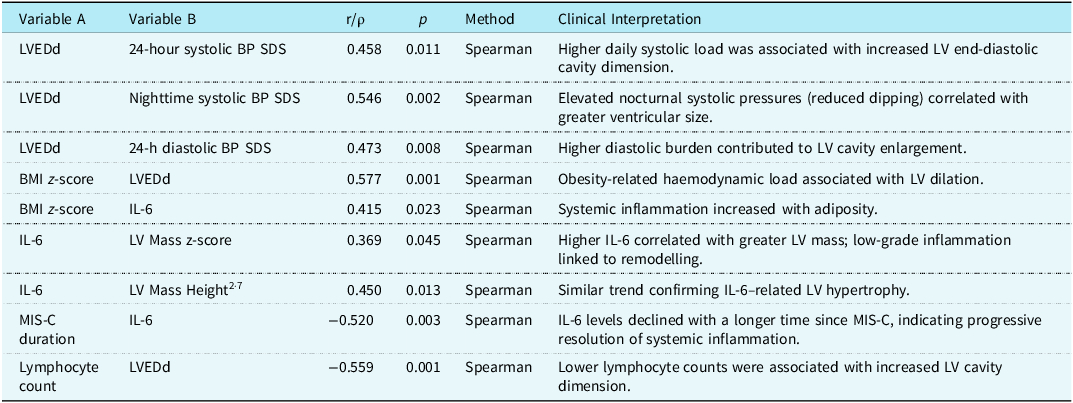
Body mass indexes showed significant positive correlations with left ventricular end-diastolic diameter (r = 0.577), left ventricular end-systolic diameter (r = 0.522), interventricular septal thickness in diastole (r = 0.565), left ventricular posterior wall thickness in diastole (r = 0.610), and left ventricular mass (r = 0.594) (Table 3) (Figure 1). In contrast, no significant correlations were found with indexed parameters such as left ventricular mass z-score, left ventricular mass/height2·7, or left ventricular mass index (p > 0.05). A moderate positive correlation was observed between body mass index z-score and interleukin-6 levels (r = 0.415, p = 0.023). Interleukin-6 showed a weak-to-moderate positive correlation with left ventricular mass z-score (r = 0.369, p = 0.045) and a moderate positive correlation with LV mass indexed to height2·7 (r = 0.450, p = 0.013). Conversely, a moderate negative correlation was observed between the time elapsed since diagnosis of multisystem inflammatory syndrome in children and interleukin-6 levels (r = −0.520, p = 0.003), suggesting a gradual normalisation of inflammatory activity (Table 3). The lymphocyte count showed significant negative correlations with left ventricular end-diastolic diameter (r = −0.559, p = 0.001), left ventricular end-systolic diameter (r = −0.518, p = 0.003), interventricular septal thickness in diastole (r = −0.412, p = 0.024), left ventricular posterior wall thickness in diastole (r = −0.529, p = 0.003), and left ventricular mass (r = −0.631, p < 0.001) (Figure 2). No significant correlations were found between lymphocyte count and indexed cardiac parameters (left ventricular mass/height2·7 or left ventricular mass index). Given the long interval between the acute multisystem inflammatory syndrome in children episode and the follow-up evaluation, this inverse correlation should be interpreted as an exploratory finding rather than as evidence of a direct long-term effect. The association likely reflects inter-individual variability in late immune recovery rather than a persistent influence of acute-phase lymphopenia.
Scatter plot showing BMI z-score versus left ventricular mass (LV mass) in children about four years post-MIS-C. Data points are coloured by IL-6 status (high vs. normal). A moderate positive correlation was observed (r = 0.594, p = 0.001).

Figure 1 Long description
A scatter plot showing BMI z-score versus left ventricular mass in children about four years post-MIS-C. The x-axis represents BMI z-score ranging from -4 to 4, and the y-axis represents left ventricular mass ranging from 50 to 175. The data points are color-coded by interleukin-6 status, with blue circles indicating normal levels and red circles indicating high levels. A moderate positive correlation is observed, indicated by a trend line with a correlation coefficient of 0.594 and a p-value of 0.001. The plot shows several data points with a few clusters and some outliers. All values are approximated.
Scatter plot demonstrating the inverse correlation between lymphocyte count and left ventricular end-diastolic diameter (LVEDd). A moderate negative correlation was observed (r = −0.559, p = 0.001).

Figure 2 Long description
A scatter plot demonstrating the inverse correlation between lymphocyte count and left ventricular end-diastolic diameter. The x-axis represents lymphocyte count, ranging from 1000 to 6000, and the y-axis represents left ventricular end-diastolic diameter, ranging from 3.00 to 6.00 centimeters. The plot includes dozens of data points, showing a moderate negative correlation with a correlation coefficient of -0.559 and a p-value of 0.001. A regression line is present, indicating the overall trend of the data. The data points are scattered with some clustering around the middle range of lymphocyte counts and left ventricular end-diastolic diameters. All values are approximated.
Correlations between cardiac dimensions, inflammatory markers, and blood pressure indices at follow-up in patients with previous MIS-C

Table 3 Long description
The table presents correlations between various cardiac dimensions, inflammatory markers, and blood pressure indices in patients with a history of multisystem inflammatory syndrome in children (MIS-C). It consists of seven rows and six columns. The columns are labeled Variable A, Variable B, r/p, p, Method, and Clinical Interpretation. The rows detail specific correlations, such as the relationship between left ventricular end-diastolic diameter (LVEDd) and different blood pressure indices, body mass index (BMI) z-score with LVEDd and interleukin-6 (IL-6) levels, and IL-6 with left ventricular mass and height. The table also includes correlations involving the duration of MIS-C and lymphocyte count with LVEDd. Notable trends include positive correlations between BMI z-score and various cardiac dimensions, as well as between IL-6 and left ventricular mass. Negative correlations are observed between the duration of MIS-C and IL-6 levels, and between lymphocyte count and LVEDd. The methods used for these correlations are primarily Spearman's rank correlation coefficient.
IL-6: pg/mL; Lymphocyte count: ×109/L.
MIS-C = multisystem inflammatory syndrome in children; IL-6 = interleukin-6; LVEDd = left-ventricular end-diastolic dimension; LVESd = left-ventricular end-systolic dimension; LVPWd = left ventricular posterior wall thickness in diastole; IVSd = interventricular septum thickness in diastole; LVMI = left-ventricular mass index; BP = blood pressure; SDS = standard deviation score; EF = ejection fraction; BMI = body mass.
Blood pressure and cardiac dimensions
Although 26 patients (86.6%) demonstrated left ventricular mass index values exceeding the conventional paediatric cutoff for left ventricular hypertrophy (>51 g/m2·7), this finding was not accompanied by corresponding increases in other indexed parameters. Specifically, left ventricular mass z-scores were within the normal range (−2 to +2 SD) in all patients, and no case exceeded the +2 SD threshold suggestive of pathological hypertrophy. Moreover, left ventricular mass indexed to height2·7 was normal in all patients. These results indicate that the elevated left ventricular mass index is likely due to physiological scaling related to somatic growth or body composition rather than to actual myocardial hypertrophic remodelling.
There were significant positive correlations between cardiac and ambulatory blood pressure parameters (Table 3). Left ventricular end-diastolic diameter was moderately correlated with 24-hour systolic blood pressure standard deviation score (r = 0.458, p = 0.011), indicating that higher daytime systolic load was associated with increased left ventricular end-diastolic cavity dimensions. A moderate to strong correlation was found between nighttime systolic blood pressure standard deviation score and left ventricular end-diastolic diameter (r = 0.546, p = 0.002), suggesting that elevated nocturnal systolic pressures, possibly reflecting an impaired dipping pattern, were related to greater ventricular cavity size. In addition, the 24-hour diastolic blood pressure standard deviation score also showed a moderate positive correlation with left ventricular end-diastolic diameter (r = 0.473, p = 0.008), supporting the contribution of overall haemodynamic load to ventricular remodelling in post-multisystem inflammatory syndrome in children patients. Systolic and diastolic blood pressure standard deviation score values showed significant positive correlations with unindexed cardiac parameters, including left ventricular end-diastolic diameter, blood pressure end-systolic diameter, interventricular septal thickness in diastole, left ventricular posterior wall thickness in diastole, and left ventricular mass. However, no correlations were observed with indexed measures (left ventricular mass z-score, left ventricular mass/height2·7, or left ventricular mass index).
Multivariate analysis
Predictors of left ventricular end-diastolic diameter identified by multiple linear regression analysis are presented in Table 4. In the multiple linear regression model, only lymphocyte count remained an independent predictor of left ventricular end-diastolic diameter [β = −0.492, 95% confidence interval −0.589 to −0.078, p = 0.013]. A one-standard-deviation increase in lymphocyte count was associated with a 0.49 standard deviation decrease in left ventricular end-diastolic diameter, indicating a moderate inverse relationship between immune recovery and ventricular dimensions. This suggests that lower lymphocyte levels, even in the post-inflammatory period, may be linked to transient myocardial dilation, reflecting the residual impact of immune dysregulation rather than ongoing inflammation. Other variables, including interleukin-6, body mass index z-score, N-terminal pro–B-type natriuretic peptide, and 24-hour systolic blood pressure standard deviation score, were not independent predictors (all p > 0.05). These findings indicate that, although mild correlations existed at the univariate level, inflammatory and haemodynamic variables did not contribute to persistent myocardial hypertrophy in the post-multisystem inflammatory syndrome in children period.
Multiple linear regression for predictors of left-ventricular end-diastolic diameter

Table 4 Long description
The table presents predictors of left ventricular end-diastolic diameter identified by multiple linear regression analysis. It includes six rows and six columns. The columns are labeled Variable, B, beta, p, VIF, and Interpretation. The variables listed are Lymphocyte count, 24-hour Systolic BP SDS, IL-6, BMI z-score, and NT-proBNP. Lymphocyte count is an independent inverse predictor of LV dilation with a beta value of -0.492 and a p-value of 0.013. 24-hour Systolic BP SDS shows a borderline association with LVEDd. IL-6, BMI z-score, and NT-proBNP are not significant predictors. The table highlights that only lymphocyte count remained an independent predictor of left ventricular end-diastolic diameter.
IL-6: pg/mL = Lymphocyte count: ×109/L; NT-proBNP = N-terminal pro–B-type natriuretic peptide, pg/mL.
Multiple Linear Regression (Enter method). Dependent variable: LVEDd. Independent variables entered: IL-6. BMI z-score. 24-hour systolic BP SDS. Lymphocyte count. NT-proBNP. Collinearity was assessed by VIF (<2 for all predictors). Only lymphocyte count remained an independent predictor of LVEDd (β = −0.492, p = 0.013). 24-hour systolic BP SDS showed a borderline trend (β = 0.314, p = 0.064). Spearman’s rank correlation was used in bivariate analyses to identify candidate variables.
Patients with persistently elevated Interleukin-6
Three patients with persistently elevated interleukin-6 levels (10.2–23.3 pg/mL) had normal left ventricular dimensions, wall thickness, and mass indices (left ventricular mass z-scores ranging from −1.49 to −0.39). None of these patients required ICU admission or showed echocardiographic evidence of structural remodelling. All three had normal ambulatory blood pressure profiles, with systolic and diastolic blood pressure standard deviation score values within ±2 SD. Nocturnal dipping was preserved, and the mean 24-hour blood pressure remained below the 90th percentile. Ejection fraction improved in all cases (ejection fraction delta +2.7 to +8%), confirming full systolic recovery without residual haemodynamic load.
Discussion
The present study provides a comprehensive evaluation of post-multisystem inflammatory syndrome in children’s cardiac geometry, systemic inflammation, and haemodynamic load. Our findings revealed modest correlations between body mass index, ejection fraction standard deviation score, and left ventricular dimensions, including left ventricular end-diastolic diameter, left ventricular end-systolic diameter, interventricular septal thickness in diastole, and left ventricular posterior wall thickness in diastole in patients with multisystem inflammatory syndrome in children. However, these correlations disappeared after normalisation for body surface area and height, suggesting that the observed increases represent physiological scaling rather than pathological hypertrophy. Furthermore, the moderate correlation between body mass index z-scores and interleukin-6 levels supports the persistence of a low-grade inflammatory milieu, likely attributable to adiposity rather than to residual multisystem inflammatory syndrome-related immune activation in children.
In our study, among the evaluated variables, lymphocyte count showed the strongest independent association with left ventricular dimensions, even after controlling for haemodynamic and metabolic covariates. This inverse association suggests that lower lymphocyte levels, a hallmark of immune dysregulation in the acute phase of multisystem inflammatory syndrome in children, may continue to influence myocardial remodelling during recovery. In a previous multicentre cohort of 601 paediatric patients with multisystem inflammatory syndrome in children, lymphopenia was identified as a significant predictor of ICU admission and overall disease severity, reflecting profound immune activation and cytokine-driven inflammation. Reference Yilmaz, Ekemen Keles and Emiroglu10 Although longitudinal studies have reported that lymphocyte counts and interleukin-6 levels typically normalise within 6–12 months after the acute phase, our cohort, evaluated approximately four years after multisystem inflammatory syndrome in children, showed no residual lymphopenia. Reference Dotta, Moratto and Cattalini11,Reference D’Auria, Bova and Dallapiccola12 However, a significant inverse correlation between lymphocyte count and left ventricular dimensions persisted, suggesting that early immune dysregulation may have long-term structural echoes despite complete haematologic recovery. These findings collectively imply that immune restoration, rather than ongoing inflammation, may drive the late normalisation of cardiac geometry in post-multisystem inflammatory syndrome in children. Notably, this association should be interpreted with caution. Lymphocyte measurements in our study were obtained approximately four years after the acute multisystem inflammatory syndrome in children episode, making it difficult to determine whether the observed relationship reflects lingering effects of earlier immune dysregulation or simply interindividual variability in long-term immune status. Because no serial lymphocyte data were available and multiple dynamic factors influence ventricular remodelling, the inverse correlation identified in this cohort should be viewed as an exploration rather than a mechanistic finding.
In contrast to multisystem inflammatory syndrome in children, Kawasaki disease does not demonstrate persistent haematologic abnormalities beyond the inflammatory phase. Reference Newburger, Takahashi and Gerber13 Newburger et al. and McCrindle et al. emphasised that while acute Kawasaki disease is characterised by neutrophilia, thrombocytosis, and elevated inflammatory markers, haematologic parameters normalise completely during convalescence, and long-term surveillance focuses primarily on coronary artery status and ventricular function rather than immune-cell indices. Reference Newburger, Takahashi and Gerber13,Reference McCrindle, Rowley and Newburger14 Moreover, mid-term Kawasaki disease cohorts with 2–5 years of follow-up have examined left ventricular dimensions, systolic function, and myocardial strain using conventional and speckle-tracking echocardiography; however, these studies did not assess lymphocyte counts in relation to ventricular geometry. Reference Kayabey, Tuncer and Deveci15 Therefore, the persistent inverse correlation between lymphocyte count and left ventricular end-diastolic diameter observed in our multisystem inflammatory syndrome in children cohort appears to represent a recovery signature not described in Kawasaki disease and may reflect a unique immuno-cardiac interaction specific to multisystem inflammatory syndrome in children.
In our results, a positive correlation between body mass index and unindexed left ventricular parameters is consistent with known physiological influences of body size and cardiac loading in paediatric populations. Reference Daniels, Loggie and Khoury16 However, after adjustment for body surface area or left ventricular mass/height2·7, these relationships vanished, indicating that the observed enlargement reflects growth-or volume-related adaptation rather than residual hypertrophic remodelling. This pattern parallels paediatric echocardiographic studies, in which body mass index-related left ventricular mass increase reflects body composition rather than cardiomyocyte hypertrophy. Reference Khoury, Mitsnefes and Daniels17
In our results, a moderate positive correlation between body mass index z-score and interleukin-6 supports the hypothesis that adiposity may sustain a low-grade inflammatory milieu even after the acute phase of multisystem inflammatory syndrome in children. This finding aligns with data in obese children showing persistent interleukin-6 elevation as a marker of metabolic inflammation. Reference Zhao, Niu and Zhao18 The inverse moderate correlation between time since diagnosis of multisystem inflammatory syndrome in children and interleukin-6 further supports gradual immune normalisation and a decline in cytokine activity over time. The positive correlation between body mass index z-scores and interleukin-6 levels suggests that, beyond residual post-multisystem inflammatory syndrome in children inflammation, obesity-related low-grade inflammation may persist and contribute to subtle ventricular changes. Prior paediatric studies support this link: overweight children show elevated inflammatory markers, such as C-reactive protein and white blood cells, indicating a state of low-grade systemic inflammation. Reference Visser, Bouter and McQuillan19 Moreover, obese children demonstrate increased left ventricular mass and wall thickness, independent of blood pressure, highlighting that excess adiposity itself may drive structural cardiac adaptations. Reference Jing, Binkley and Suever20
The correlations between systolic blood pressure, standard deviation score, and left ventricular end-diastolic diameter, particularly at night, indicate that subclinical afterload or impaired dipping may contribute to left ventricular dilation. Nonetheless, the absence of associations with left ventricular mass z-score or left ventricular mass/height2·7suggests that these reflect functional preload adaptations rather than chronic hypertrophic changes. Similar associations between body composition and blood pressure have also been observed in post-multisystem inflammatory syndrome in children cohorts. In the study by McCrindle et al., among 63 children hospitalised with multisystem inflammatory syndrome in children, 14% developed hypertension, and 4% had elevated blood pressure persisting over 30 days after hospitalisation. Multivariate linear regression analysis revealed that higher body mass index z-scores were independently associated with increased mean systolic (β = 2.664, 95% CI: 1.307–3.980, p < 0.001) and diastolic (β = 2.547, 95% CI: 0.605–4.489, p = 0.012) blood pressure indices after one-year follow-up. Reference Lehman, Schuchman and Mitchell21 Similar findings have been observed in paediatric hypertension studies, where systolic load affects chamber dimensions without persistent structural remodelling. Reference Flynn and McDonald22 These findings support the notion that body composition and metabolic status may contribute to persistent subclinical haemodynamic alterations following multisystem inflammatory syndrome in children.
Multivariate analysis revealed that only lymphocyte count independently predicted left ventricular end-diastolic diameter, emphasising the dominance of immune recovery dynamics over metabolic or haemodynamic variables in determining late left ventricular geometry. No predictors of left ventricular mass were identified, suggesting that neither inflammation nor blood pressure contributes to persistent hypertrophy. This is consistent with cardiac MRI studies showing resolution of myocardial oedema and functional normalisation within months after multisystem inflammatory syndrome in children. Reference Webster, Patel and Carr23,Reference Truong, Trachtenberg and Hu24 Although global longitudinal strain was not evaluated in our cohort, previous reports have demonstrated that subclinical myocardial dysfunction may persist despite normalised left ventricular ejection fraction, with some patients showing persistent global longitudinal strain impairment during long-term follow-up. These findings highlight that conventional parameters may underestimate subtle myocardial involvement and support the use of advanced imaging techniques to characterise full cardiac recovery after multisystem inflammatory syndrome in children. Reference Anagnostopoulou, Dourdouna and Loukopoulou25
Finally, three patients with persistently elevated interleukin-6 levels (10.2–23.3 pg/mL) exhibited normal left ventricular geometry, blood pressure, and systolic recovery. These findings underscore the heterogeneity of cytokine normalisation and confirm that mild interleukin-6 elevation does not necessarily indicate ongoing cardiac pathology. In a cohort of 21 children and young adults, Burns et al. demonstrated that pro-inflammatory cytokine elevations had resolved by the 6-month follow-up, supporting the expectation of cytokine normalisation after multisystem inflammatory syndrome in children. Reference Burns, Bartsch and Davis26 Acute-phase data from Kawasaki disease similarly showed markedly higher interleukin-6 levels in refractory cases, reflecting early inflammatory activity rather than long-term risk. Reference Lin, Lin and Hwang27 Moreover, post-acute sequelae of severe acute respiratory syndrome coronavirus 2 infection, commonly referred to as long coronavirus disease 2019, has been associated with persistently elevated interleukin-6 and other cytokines for several months after acute infection, suggesting a form of low-grade chronic inflammation despite clinical recovery. Reference Low, Low and Akrami28 Collectively, these findings indicate that isolated mild interleukin-6 elevation in the post-acute period does not reliably predict adverse cardiac remodelling and may instead represent physiological variability within the spectrum of post-inflammatory resolution. Future longitudinal imaging and cytokine profiling studies are warranted to determine whether residual low-grade inflammation in certain individuals predicts later cardiometabolic alterations.
The present study has several strengths. It represents one of the few mid-to long-term follow-up analyses (approximately 4 years after the acute episode) that integrate echocardiographic, haemodynamic, and inflammatory parameters in patients with prior multisystem inflammatory syndrome in children. The inclusion of comprehensive cardiac indices, both unindexed and size-adjusted, provides an objective means of distinguishing physiologic cardiac growth from potential pathological remodelling. Simultaneous assessment of ambulatory blood pressure monitoring and cytokine levels provides a multidimensional understanding of the haemodynamic and immunologic interplay during recovery. In addition, the homogeneous follow-up protocol and single-centre design ensured methodological consistency and minimised inter-observer variability in echocardiographic measurements.
However, certain limitations must be acknowledged. The study sample was relatively small, reflecting the rarity of multisystem inflammatory syndrome in children and the loss of long-term follow-up in a proportion of the initial cohort. The retrospective design limited causal inference and precluded direct control of confounding factors such as baseline nutritional status and post-discharge therapy. While Doppler imaging formed part of routine clinical assessment, Doppler-derived haemodynamic variables were not incorporated into the study analysis. Given the preserved systolic function observed in the majority of patients, these measurements were unlikely to alter the structural interpretation of ventricular geometry and mass. Cardiac MRI data were unavailable, which might have provided complementary information on residual fibrosis or myocardial oedema. Furthermore, cytokine analysis was limited to interleukin-6 as a representative marker of inflammation; other mediators such as tumour necrosis factor-α or interleukin-10 could have refined the immunologic profile. Also, lymphocyte counts were obtained only at the long-term follow-up visit; the temporal relationship between immune recovery and cardiac remodelling could not be established. Finally, the absence of a healthy control group limits the generalisability of the findings to the broader paediatric population, although within-patient longitudinal comparisons provide valuable internal validity.
Conclusion
In this four-year follow-up study of paediatric patients with a history of multisystem inflammatory syndrome in children, we found no evidence of persistent myocardial hypertrophy or dysfunction. The observed associations between body mass index, blood pressure, and unindexed cardiac parameters disappeared after normalisation for body size, indicating physiological scaling rather than pathological remodelling. The lymphocyte count showed the most consistent association with left ventricular dimensions, suggesting that immune recovery dynamics may play a central role in the normalisation of myocardial geometry. Notably, interleukin-6 levels showed a moderate inverse correlation with the time elapsed since the onset of multisystem inflammatory syndrome in children, supporting the concept of progressive immunologic de-escalation during long-term recovery. The moderate correlation between body mass index z-score and interleukin-6 levels further highlights the contribution of adiposity-related low-grade inflammation during long-term follow-up, independent of residual multisystem inflammatory syndrome in children’s activity. Overall, our findings indicate that post-multisystem inflammatory syndrome in children’s cardiac changes are functional and reversible, reflecting adaptive rather than maladaptive remodelling. Continued longitudinal monitoring of cardiovascular and inflammatory markers remains essential to identify potential late sequelae and to guide individualised follow-up strategies in this population.
Data availability statement
Data are available from the corresponding author upon reasonable request.
Acknowledgements
We want to express our sincere appreciation to all the medical technicians at our institution for their valuable assistance and continuous support throughout the study.
Author contributions
Y.E.K. conceived the study, designed the methodology, supervised data collection, and wrote the first draft of the manuscript. Ö.Ö.Ş. designed the methodology, performed ambulatory blood pressure evaluations, and conducted a critical review of the manuscript. Y.P. designed the methodology, contributed to echocardiographic analysis and interpretation of cardiac measurements, performed statistical analyses, and assisted with data interpretation. United Kingdom contributed to echocardiographic analysis and interpretation of cardiac measurements and contributed to clinical data acquisition and patient follow-up coordination. Z.Ç. Designed the methodology, supervised laboratory assessments, and contributed to data interpretation. D.Y. contributed to the interpretation of immunological data and critically revised the manuscript. All authors reviewed and approved the final version of the manuscript.
Financial support
This research did not receive any specific grant from funding agencies in the public, commercial, or not-for-profit sectors.
Competing interests
All the authors have no conflicts of interest to disclose.
Consent to participate
All authors approved the final manuscript as submitted and agreed to be accountable for all aspects of the work.



 Open access

