1. INTRODUCTION
The shipping industry has witnessed fast growth in the last three decades due to the increase in the demand for cargo delivery. However, the significant increase in traffic demand will result in increased traffic movements within port waters. In general, the number of traffic movements on a busy fairway in port waters can be as high as 2000 per day (Yip, Reference Yip2008) and this number is expected to increase further with the continuing growth of traffic demand. Such a large number of movements results in a high traffic density at peak periods. A large number of existing research works have reported that navigational accidents account for a substantial portion of the major types of accidents in port waters. Many studies have further reported that collisions are over-represented in port water accidents (Goossens and Glansdorp, Reference Goossens and Glansdorp1998; Akten, Reference Akten2004; Yip, Reference Yip2008). Li et al. (Reference Li, Meng and Qu2012) reported that Quantitative Risk Assessment (QRA) models can assess the effectiveness of risk mitigation measures. Considering the fact that the most important contributing input into QRA models is ship collision frequency (Weng et al., Reference Weng, Meng and Qu2012), more focus should be placed on the estimation of ship collision frequency in the port water fairways.
A number of studies have been conducted for the analysis of navigational accident risk. The computer simulation-based technique has been applied to quantitatively examine various navigational safety issues (Blokus-Roszkowska and Smolarek, Reference Blokus-Roszkowska and Smolarek2012). For example, Dand (Reference Dand2001) introduced the Permanent International Association of Navigation Congresses (PIANC) simulation approach to water channel design. Zhang and Huang (Reference Zhang and Huang2006) developed ship models to acquire pilot experience using a computer simulation approach. Goerlandt and Kujala (Reference Goerlandt and Kujala2011) developed a traffic simulation model for modelling ship collision probability. Their results obtained from the simulation model showed reasonable agreement with the observations.
Among the evidence that can facilitate investigation, the Automatic Information System (AIS) data recorded during the context of the collision are highly informative and have been widely used in previous studies (e.g., Debnath and Chin, Reference Debnath and Chin2009; Blokus-Roszkowska et al., Reference Blokus-Roszkowska, Montewka and Smolarek2012; Marcjan and Gucma, Reference Marcjan and Gucma2012; Hansen et al., Reference Hansen, Jensen, Lehn-Schioler, Melchild, Rasumssen and Ennemark2013; Wang et al., Reference Wang, Zhang, Chen, Chu and Yan2013; Mazaheri et al., Reference Mazaheri, Montewka, Kotilainen, Sormunen and Kujala2014).
Since the occurrence frequency of ship collision accidents is simply equal to the number of dangerous encounters multiplied by a causation probability (Macduff, Reference Macduff1974), the major focus was therefore placed on the identification of dangerous ship encounters in most previous studies. Various mathematical models, such as ship domain models (Fujii, Reference Fujii, Yamanouchi and Mizuki1974; Macduff, Reference Macduff1974; Tan and Otay, Reference Tan and Otay1999; Fowler and Sorgard, Reference Fowler and Sorgard2000; Szlapczynski, Reference Szlapczynski2006; Pietrzykowski and Uriasz, Reference Pietrzykowski and Uriasz2009; Uluscu et al., Reference Uluscu, Özbaş, Altiok and Or2009; Wang, Reference Wang2010) and speed dispersion model (Qu et al., Reference Qu, Meng and Li2011), are available to evaluate the number of dangerous encounters. However, one significant drawback of these existing models is that the effects of the angle between two ships, ship types and ship lengths on the ship's capability of avoiding a collision accident have not been taken into account. Therefore, one may suspect that these models may not reflect the real interaction between ships at close quarters. Later, Montewka et al. (Reference Montewka, Hinz, Kujala and Matusiak2010) and Montewka et al. (Reference Montewka, Goerlandt and Kujala2012) conducted an experiment using a hydrodynamic model of ship motion to investigate the effects of ship types and angle of two ships on the minimum distance to collision, which is an index to implicitly reflect ship collision avoidance capability. Sormunen et al. (Reference Sormunen, Goerlandt, Hakkinen, Posti, Hannien, Montewka, Stahlberg and Kujala2014) further took into account the uncertainty associated with the collision risk for chemical tankers.
The objective of this study is to estimate the ship collision frequency in port waterways. In order to incorporate the possible effects of ship types, the angle between two ships and ship lengths on the ship collision avoidance capability, the radius is formulated as a function of these factors for the proposed model in this study. In general, our study is similar to the work of Montewka et al. (Reference Montewka, Goerlandt and Kujala2012). However, one big difference is that we built a mathematical function to show the quantitative relationships between the radius and ship characteristics (i.e., ship type, ship length). It should be pointed out that the collision frequency does not definitely mean the collision risk. This is because the collision risk is also affected by the density of ships and other factors related to the waterway geometry (Debnath et al., Reference Debnath, Chin and Haque2011).
2. SHIP COLLISION FREQUENCY MODEL
According to the previous studies (e.g., Fujii et al., Reference Fujii, Yamanouchi and Mizuki1974; Mou et al., Reference Mou, Tak and Ligteringen2010; Goerlandt and Kujala, Reference Goerlandt and Kujala2011), ship collision frequency is equal to the number of dangerous encounters multiplied by the probability of failing to avoid a collision under a given dangerous encounter. Namely,
 $$f_{collision} = N_{encounter} \times p_{causation} $$
Where f collision = the ship collision frequency; N encounter = the number of dangerous encounters and p causation = the probability of failing to avoid a collision under a given dangerous encounter.
Debnath and Chin (Reference Debnath and Chin2010) employed two indicators including Distance at Closest Point of Approach (DCPA) and Time to Closest Point of Approach (TCPA) to represent the spatial and temporal closeness between a pair of ships. Because of the simplicity, a large number of researchers (e.g., Fujii, Reference Fujii, Yamanouchi and Mizuki1974; Macduff, Reference Macduff1974; Tan and Otay, Reference Tan and Otay1999; Fowler and Sorgard, Reference Fowler and Sorgard2000; Szlapczynski, Reference Szlapczynski2006; Pietrzykowski and Uriasz, Reference Pietrzykowski and Uriasz2009; Uluscu et al., Reference Uluscu, Özbaş, Altiok and Or2009; Wang, Reference Wang2010) estimated the number of dangerous encounters by counting the overlaps of two ship domains. We employ this method to estimate the number of dangerous encounters in this study. Hereafter, a dangerous encounter is defined as an overlap of two ship domains, as shown in Figure 1(a). A ship domain is expressed as the area around the ship that the navigator wants to keep clear of other ships or objects. The overlap of two ship domains is equivalent to an event in which a point representing the centre of one ship enters the disc of which the radius equals the sums of radii of two original discs shown in Figure 1(b). In addition, it should be pointed out that the violation of ship domains (i.e., dangerous encounter) is not necessarily a collision.
Definition of a dangerous ship encounter.

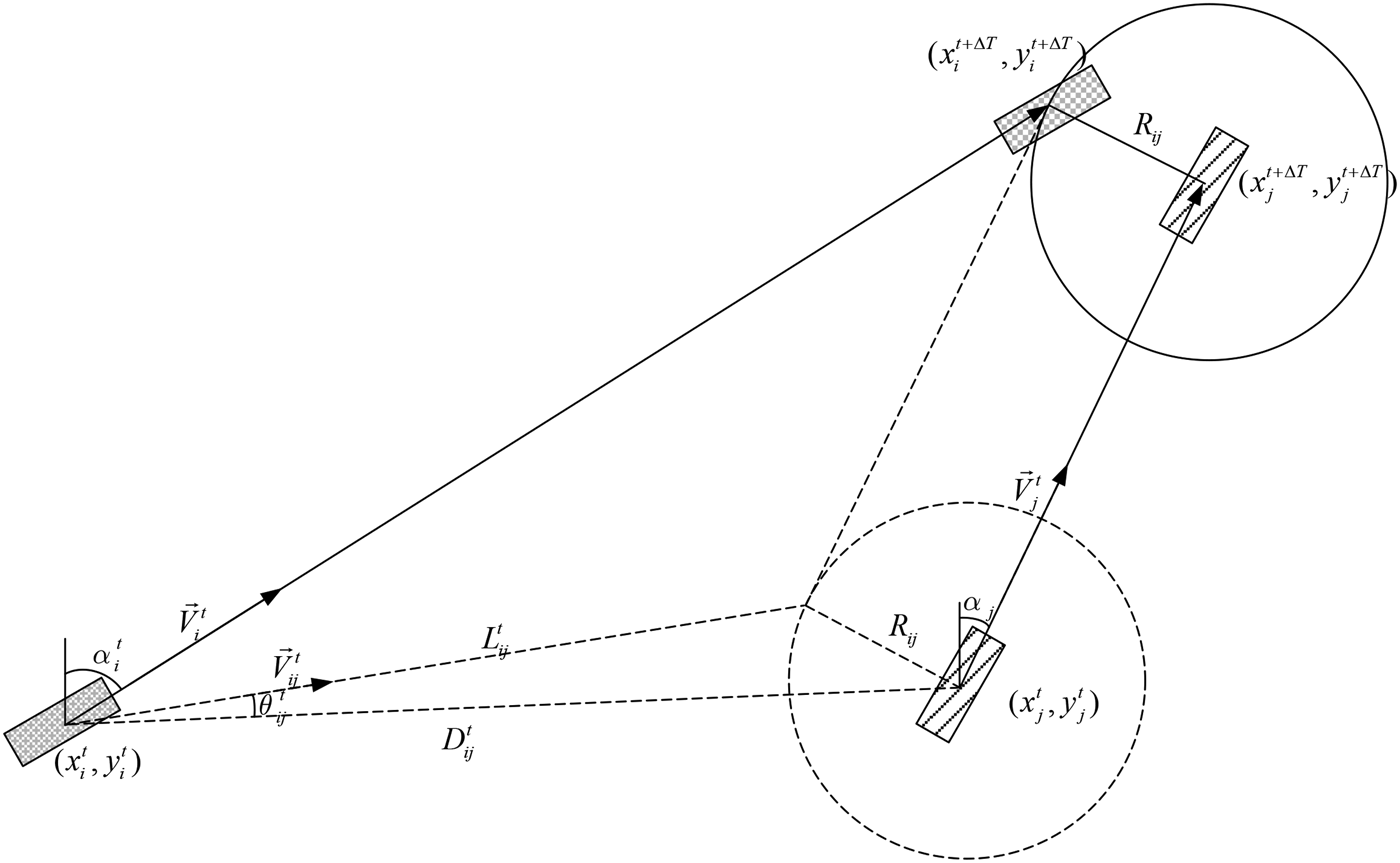
Let (x it,yit) denote the position of a particular ship i at time t;  $\vec v_i^t $ and α it denote the speed and course of ship i at time t, respectively. (x it+ΔT, y it+ΔT) represents the probable position of ship i at time t + ΔT. Similarly, (x jt, yjt) denotes the position of another ship j at time t;
  $\vec v_j^t $ and α jt represent the speed and course of ship j at time t, respectively. (x jt+ΔT, y jt+ΔT) represents the probable position of ship j at time t + ΔT. The relative speed of ship i over ship j at time t, denoted by
  $\vec V_{ij}^t $, can be calculated by
 $$\left\vert {\vec V_{ij}^t} \right\vert = \sqrt {\left( {\left\vert {\vec v_i^t} \right\vert \cos \alpha _i^t - \left\vert {\vec v_j^t} \right\vert \cos \alpha _j^t} \right)^2 + \left( {\left\vert {\vec v_i^t} \right\vert \sin \alpha _i^t - \left\vert {\vec v_j^t} \right\vert \sin \alpha _j^t} \right)^2} $$
The distance between the ships i and j at time t, denoted by D ijt, can be computed by
 $$D_{ij}^t = \sqrt {\left( {x_i^t - x_j^t} \right)^2 + \left( {y_i^t - y_j^t} \right)^2} $$
As mentioned above, dangerous encounters can be observed when the centre of one ship enters the disc with the radius (R ij). In other words, there will be a dangerous encounter only if the distance between two ships at time t + ΔT is not greater than the radius of the disc, as shown in Figure 2. Namely,
 $$\sqrt {(x_i^{t + \Delta T} - x_j^{t + \Delta T} )^2 + (y_i^{t + \Delta T} - y_j^{t + \Delta T} )^2} \le R_{ij} $$
Considering the possible effects of the angle between two ships, ship types and the average length of two ships, the radius R ij can be formulated as a function of these factors, shown below:
 $$R_{ij} = f\left( {l_{ij}, Type_i, Type_j, \varphi _{ij}} \right)$$
where l ij is the average length between ships i and j; Type i and Type j are the types of ships i and j, respectively; ϕ ij is the angle between the courses of ships i and j.
Relationships among ship positions, ship speeds and dangerous encounters.
Assuming the ships i and j keep their current speeds and courses from the time t to t + ΔT, namely, 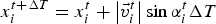 $x_i^{t + \Delta T} = x_i^t + \left\vert {\vec v_i^t} \right\vert \sin \alpha _i^t \Delta T$,
 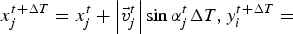 $x_j^{t + \Delta T} = x_j^t + \left\vert {\vec v_j^t} \right\vert \sin \alpha _j^t \Delta T, y_i^{t + \Delta T}= $
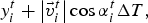 $y_i^t + \left\vert {\vec v_i^t} \right\vert \cos \alpha _i^t \Delta T,$,
 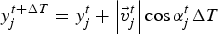 $y_j^{t + \Delta T} = y_j^t + \left\vert {\vec v_j^t} \right\vert \cos \alpha _j^t \Delta T$. Therefore, Equation (4) is equivalent to
 $$\sqrt {(x_i^t - x_j^t + \left\vert {\vec v_i^t} \right\vert \sin \alpha _i^t \Delta T - \left\vert {\vec v_j^t} \right\vert \sin \alpha _j^t \Delta T)^2 + (y_i^t - y_j^t + \left\vert {\vec v_i^t} \right\vert \cos \alpha _i^t \Delta T - \left\vert {\vec v_j^t} \right\vert \cos \alpha _j^t \Delta T)^2} \le R_{ij} $$
It should be pointed out that the Equation (6) is also equivalent to
 $$\eqalign{&\sqrt{(D_{ij}^t )^2 + \left\vert {\vec v_{ij}^t \Delta T} \right\vert^2 + 2\Delta T\left[ {(x_i^t - x_j^t )(\left\vert {\vec v_i^t} \right\vert \sin \alpha _i^t - \left\vert {\vec v_j^t} \right\vert \sin \alpha _j^t ) + (y_i^t - y_j^t )(\left\vert {\vec v_i^t} \right\vert \cos \alpha _i^t - \left\vert {\vec v_j^t} \right\vert \cos \alpha _j^t )} \right]} \cr &\le R_{ij} } $$
From Figure 2, it can be found that
 $$\cos \theta _{ij}^t = \displaystyle{{\left( {x_j^t - x_i^t} \right)\left( {\left\vert {\vec v_i^t} \right\vert \sin \alpha _i^t - \left\vert {\vec v_j^t} \right\vert \sin \alpha _j^t} \right) + \left( {y_j^t - y_i^t} \right)\left( {\left\vert {\vec v_i^t} \right\vert \cos \alpha _i^t - \left\vert {\vec v_j^t} \right\vert \cos \alpha _j^t} \right) \over \left\vert \vec{V}_{ij}^t \right\vert D_{ij}^t}} $$
where θ ijt is the angle between the relative speed  $\vec V_{ij}^t $ and the line connecting two ships, as shown in Figure 2.
Substituting cosθ ijt into Equation (7), we can obtain the following relationship
 $$D_{ij}^t \cos \theta _{ij}^t - \sqrt {R_{ij}^2 - (D_{ij}^t \sin \theta _{ij}^t )^2} \le \left\vert {\vec v_{ij}^t} \right\vert \Delta T$$
Here,  $D_{ij}^t \cos \theta _{ij}^t - \sqrt {R_{ij}^2 - (D_{ij}^t \sin \theta _{ij}^t )^2} $ is the relative distance travelled by the ship i with respect to the ship j (i.e., L ijt in Figure 2). It should be pointed out that Equations (4) and (9) are equivalent in principle because Equation (9) is derived from Equation (4). Both equations can be used to identify whether there will be a dangerous encounter between any two of the ships from time t to t + ΔT.
The causation probability varies with ship encounter types. In general, ship encounters can be classified into three types based on the course difference of two ships. This study adopts the classification scheme from Montewka et al. (Reference Montewka, Hinz, Kujala and Matusiak2010) because their classification scheme could slightly overestimate collision frequency, compared with the classification scheme from the International Regulations for the Prevention of Collisions at Sea (COLREGS). In view of the high safety requirement in port waters, it is reasonable to use this conservative course classification scheme. The detailed classification scheme is shown below:
i) Overtaking encounter. An overtaking encounter means an encounter in which two vessels are proceeding on the same route, lying on almost parallel courses. According to Montewka et al. (Reference Montewka, Hinz, Kujala and Matusiak2010), the course difference of an overtaking should not exceed 10°.
ii) Head-on encounter. A head-on encounter is referred to as an encounter in which vessels are lying on almost reciprocal courses, and the course differences falls in the range from 170° to 190°.
iii) Crossing encounter. A crossing encounter is an encounter in which the difference between two vessels' courses falls in the range 10°–170° or 190°–350°.
Hence, the ship collision frequency can be computed by
 $$f = N_{overtaking} \;p_c^{overtaking} + N_{head - on} \; p_c^{head - on} + N_{crossing}\; p_c^{crossing} $$
where N overtaking is the number of dangerous overtaking encounters; p covertaking is the causation probability for the dangerous overtaking encounters; N head−on is the number of head-on encounters; p chead−on is the causation probability for the dangerous head-on encounters; N crossing is the number of crossing encounters and p ccrossing is the causation probability for dangerous crossing encounters.
3. CASE STUDY
3.1. Data collection
According to the requirement of the IMO's International Convention for the Safety of Life at Sea (SOLAS), all larger seagoing ships (>300 Gross Tonnage) and all passenger ships are requested to be equipped with an AIS on board after 2002 (SOLAS, 1974). Through dedicated Very High Frequency (VHF) channels, AIS information can be transmitted between ships, from ships to shore and vice versa. In simple terms, AIS is a technology that makes ships “visible” to each other. It can record information on ship behaviour, including the effects of human behaviour and ship manoeuvrability. In general, each AIS record consists of the following information for each ship at each reporting time (every 3 to 10 seconds):
(i) Maritime Mobile Service Identity (MMSI) number;
(ii) Latitude position;
(iii) Longitude position;
(iv) Speed over ground (SOG);
(v) Course over ground (COG).
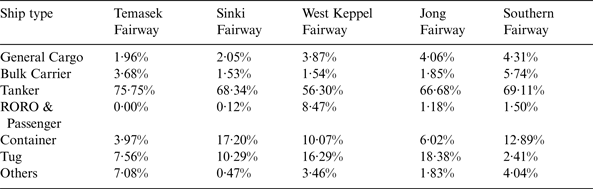
One month's (July 2011) AIS data were used in this study. A total of 203,661 AIS records were collected to evaluate the ship collision frequency in five major Singapore port fairways including Temasek fairway, Sinki fairway, West Keppel fairway, Jong fairway and Southern fairway, as shown in Figure 3. The bold lines in Figure 3 indicate the boundaries of these five fairways. The brief descriptions of these five fairways are shown below:
(i) Temasek fairway: this is located at the southeast of West Jorong Channel. At the southwest of the Temasek fairway, there are four anchorages including the Very Large Crude Carrier Anchorage (AVLCC), LNG/LPG/Chemical Gas Carrier Anchorage (ALGAS), West Jurong Anchorage (AWJ) and Tuas Petroleum Holding Anchorage.
(ii) Sinki fairway: this is located at the east of the Temasek fairway and at the southwest of West Keppel fairway. There is a traffic separation scheme in this fairway, which requires northeast bound ships to keep to the south and the southwest bound ship to keep to the north.
(iii) West Keppel fairway: this is located near the Pasir Panjang Terminal. There are three anchorages at the east of the fairway, which are Western Anchorage (AWW), Western Petroleum A Anchorage (AWPA) and Western Holding Anchorage (AWH). The harbourfront Ferry Terminal is also located near this fairway.
(iv) Jong fairway: similar to the Sinki fairway, the Jong fairway is also a link between the Singapore Strait and the West Keppel fairway. One intersection is located at the southeast of the fairway, as shown in Figure 3.
(v) Southern fairway: the Singapore Strait is located at the south of this fairway. The fairway is a link between the Jong fairway and the East Keppel fairway.
Five Singapore Port Fairways.
Raw AIS data do not contain ship characteristics such as type and size. These characteristics can be found from a ship database. Since each ship has a unique MMSI number, the ship characteristics were extracted from the ship database by means of the corresponding MMSI number. In addition, there are several records with inaccurate speed information though the majority of collected AIS records are accurate. It is inappropriate to abandon these records in view of the real-time data integrity. The following procedures are proposed to update those records with incorrect speed information.
Step 1: Calculate the mean speed for a given ship i from the time t to t + ΔT:
 $$\bar v_i^t = \displaystyle{{\sqrt {(x_i^{t + \Delta T} - x_i^t )^2 + (y_i^{t + \Delta T} - y_i^t )^2}} \over {\Delta T}}$$
where  $\bar v_i^t $ is the mean speed for a given ship i from the time t to t + ΔT.
Step 2: Check the reasonability of the mean speed by identifying whether it satisfies the following condition:
 $$\left\vert {\vec v_i^t} \right\vert - d_i \Delta T \le \bar v_i^t \le \left\vert {\vec v_i^t} \right\vert + a_i \Delta T$$
where d i and a i are the deceleration and acceleration rates for the ship i, respectively.
Step 3: The incorrect speed related to ship i at time t will be replaced with the corresponding mean speed.
As mentioned above, the radius R ij is a key parameter for estimating the ship collision frequency. In order to determine the relationship between the radius and its influencing factors, we conducted the same numerical experiment based on the hydrodynamic model of ship motion as that in Montewka et al. (Reference Montewka, Hinz, Kujala and Matusiak2010). Four ship types including tankers, container ships, passenger ships and general cargo ships were taken into account in the experiment. Twelve meeting scenarios were considered. In each of the four meeting scenarios, two encounter ships have the same types (e.g., container -container, tanker-tanker) and there is a combination of two different ship types (e.g, tanker-container, tanker-general cargo) in each of the remaining eight scenarios. All other assumptions and procedures for this experiment were the same as those in Montewka et al. (Reference Montewka, Hinz, Kujala and Matusiak2010). Figure 4 graphically shows the results of this experiment. The relationship between the radius, ship type combinations and their angles can be mathematically described by:
(a) If ships i and j are both container ships, general cargo ships, tankers or passenger ships
(13)where l ij is the average length between ships i and j, ϑ is the angle between ships i and j. $$R_{ij} = \left\{ \matrix{0.55e^{0.0214\vartheta}\; l_{ij}, {\rm if} \;0^{\circ} \le \vartheta \le 90^{\circ}, {\rm} R^2 = 0.976 \hfill \cr 26.54e^{ - 0.0217\vartheta}\; l_{ij}, {\rm if \;9}0^{\circ} \lt \vartheta \le 180^{\circ}, {\rm} R^2 = 0.975 \hfill} \right.$$
(b) Others (e.g., tanker-container)
(14)$$R_{ij} = \left\{ \matrix{0.47e^{0.0234\vartheta}\; l_{ij}, {\rm if}\; 0^{\circ} \le \vartheta \le 90^{\circ}, {\rm} R^2 = 0.796 \hfill \cr 34.01e^{ - 0.0224\vartheta}\; l_{ij}, {\rm if \;9}0^{\circ} \lt \vartheta \le 180^{\circ}, {\rm} R^2 = 0.952 \hfill} \right.$$
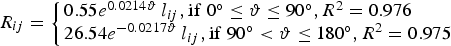

Effects of ship types and their angles on the radius.
3.2. Results and discussions
3.2.1. Ship traffic characteristics
This section mainly presents the characteristics of ships involved in dangerous encounters. The ships in the port fairways can be divided into seven groups: general cargo ships, bulk carriers, tankers, container ships, tugboats (Tug), Roll-On Roll-Off (RORO), passenger ships and others. Hereafter, the group labelled “others” comprises well stimulation vessels and support vessels such as trailing suction hopper dredgers. Table 1 gives each category's percentage share of the traffic for the five different fairways based on our one month of AIS data. According to the table, it can be clearly seen that tankers account for the biggest proportion in the Temasek fairway (75·75%). One possible reason might be that the majority of them will be anchored at the Very Large Crude Carrier Anchorage (AVLCC), the LNG/LPG/Chemical Anchorage (ALGAS) and the Tuas Petroleum Holding Anchorage (APTH) which are located on the southwest of the Temasek fairway. The proportion of container ships ranges from 3·97% to 17·20% in the five different fairways. The percentage of RORO and passenger ships is quite small in Temasek fairway, Sinki fairway, Jong fairway and Southern fairway. Since the International Passenger Terminal and the Regional Ferry Terminal are located near the West Keppel fairway, the percentage of RORO and Passenger ships is largest in the West Keppel fairway compared to the other four fairways.
Types of ships operating in the Singapore port fairways.
We could fit the ship speed distribution using the @Risk software which can make use of chi-squared fit statistics to measure how well a distribution fits the collected data. Nine candidate distribution types including BetaGeneral, Log-logistic, Normal, Weibull, Gamma, Lognormal, Logistic, Inverse Gaussian and Exponential distributions are considered in this study. The distributions with the lowest chi-squared statistics are finally selected. Figure 5 contains five graphs that describe the best-fitted ship speed distributions in the five fairways. Figure 5(a) shows that the BetaGeneral distribution could best describe the speed distribution in the Temasek fairway. The majority of ship speeds (84·4%) range from 2 to 10 knots. Figure 5(c) shows that the fitted speed curve has a long tail. By comparing Figures 5(a)–5(e), we can also see that the West Keppel fairway has the highest ship speed on average (8·6 knots), followed by the Southern fairway (8·5 knots) and then the Sinki fairway (8·0 knots). Both the Temasek and Jong fairways have the lowest average ship speed (7·4 knots). The high average ship speed in the West Keppel fairway might be due to the relatively small percentage of large-sized tankers that sail at relatively lower speeds than other ship types. The lower average ship speed in the Temasek fairway can be explained by the fact that the majority of ships in this fairway are large-sized tankers. The narrower width could be a possible cause for the low traffic speed in the Jong fairway.
Histograms of ship speed distributions in (a) Temasek Fairway, (b) Sinki Fairway, (c) West Keppel Fairway, (d) Jong Fairway and (e) Southern Fairway.
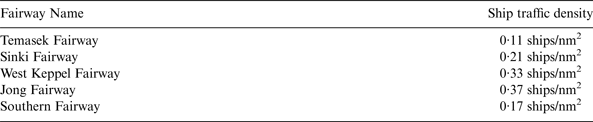
Table 2 gives the ship traffic densities in these fairways based on the collected AIS data. It can be clearly seen that the traffic density varies with different fairways. More specifically, the Jong fairway has the largest traffic density (0·37 ships/nm2), followed by the West Keppel fairway (0·32 ships/nm2). The unequal traffic density is mainly due to the differences in the fairway geometry and traffic flow. The higher traffic density for the Jong fairway is mainly because it has narrower width though traffic volume in this fairway is almost the same as in the West Keppel fairway.
Ship traffic density in port fairways based on the collected AIS data.
3.2.2. Dangerous ship encounters
Figure 6 shows the compositions of ships involved in different types of dangerous encounters. According to Figure 6(a), tankers and container ships are the two major ship types involved in dangerous overtaking encounters, representing 74·16% of all ships involved. Furthermore, the tanker is the most risky vessel type in view of the fact that it makes up the largest percentage of dangerous overtaking encounters. Figure 6(b) shows that the above two ship types account for the majority of dangerous crossing encounters as well, suggesting that the two ship types are again the most risky in terms of relatively high crossing collision frequency. Figure 6(c) shows that the majority of dangerous head-on encounters (84·92%) are again caused by these two ship types. However, container ships rather than tankers have the highest head-on collision frequency. The difference may be due to the traffic separation scheme implemented in the Sinki fairway and Southern fairway, as shown in Figure 3. According to Table 1, it can be found that there is a larger percentage of container ships in the Sinki fairway, as compared with the other fairways. Hence, the northeast-bound containers would certainly have more chance of colliding head-on with south-westbound ships in the Sinki fairway. Due to the high percentage of dangerous encounters involving tankers and their severe consequences, focus may be placed on the tracking and management of tanker traffic.
Distribution of different ships involved in dangerous encounters in the five Singapore port fairways.
Figure 7 presents the spatial distributions of dangerous ship encounters in the five fairways. According to Figure 7(a), we can clearly see that the most risky overtaking area is located in the Jong fairway because of the greater number of dangerous overtaking encounters. The high frequency of overtaking collision may be caused by speeding vessels within this area. The ships bound to the anchorages will reduce their speed in this fairway while the ships just departed from the anchorages will increase their speed if conditions are suitable. Therefore, there is a high frequency of ship acceleration and deceleration actions in this area, which produces a larger number of dangerous overtaking encounters. In addition, the ship density in the Jong fairway is the largest among the five fairways, shown in Table 2. This suggests that the ships navigating in the Jong fairway have the highest probability of being involved in dangerous head-on encounters, as shown in Figure 7(b). Figure 7(c) depicts the spatial distribution of dangerous crossing encounters. It can be found that the majority of dangerous crossing encounters occurred in the West Keppel fairway and Jong fairway. One possible reason for the higher frequency of dangerous crossing encounters in the two fairways might be that the four major anchorages including Western Quarantine and Immigration Anchorage (AWQI), Western Petroleum Anchorage (AWP), Western Anchorage (AWW) and Western Holding Anchorage (AWH) are located on the right side of the two fairways. Hence, the ships bound to or from these anchorages sometimes cross the traffic lanes in these areas. The increase in the number of crossing manoeuvres could increase the number of dangerous crossing encounters. In general, the higher speed could cause more severe damage. As mentioned above, the West Keppel fairway has the highest ship speed on average. Hence, we can infer that this fairway should receive more attention because of high crossing collision frequency and serious consequence.
Spatial distribution of dangerous ship encounters.
3.2.3. Ship collision frequency
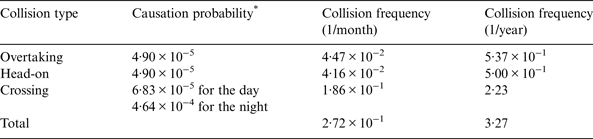
In order to evaluate the ship collision frequency, the causation probability values which are commonly accepted in the existing studies (e.g., Pedersen, Reference Pedersen2002; Kujala et al., Reference Kujala, Hanninen, Arola and Ylitalo2009) are used in this study. More specifically, the three causation probability values are 1·30 × 10−4 for crossing encounters, 4·90 × 10−5 for overtaking encounters and 4·90 × 10−5 for head-on encounters, respectively. Considering the fact that the Maritime and Port Authority of Singapore has used the Vessel Traffic Service (VTS) system to monitor the Singapore port fairways, it is reasonable to assume that the causation probabilities for the crossing encounters are 6·83 × 10−5 in good visibility (e.g., daytime periods) and 4·64 × 10−4 in poor visibility (e.g., night time periods), which were suggested by Otto et al. (Reference Otto, Pedersen, Samuelides and Sames2002).
Table 3 reports that the overall ship collision frequency in five fairways is 3·27 per year. This implies that there will be a ship collision accident every four and an half months. It should be pointed out that the estimated collision frequency is a little overestimated, compared with the average actual frequency of 2·33 per year (standard deviation = 0·87 per year) which is calculated from the historical accident records between the years of 1998 and 2006. The overestimation of the results seems natural. This is because ships could take collision avoidance manoeuvres earlier and have the bigger opportunity to avoid collisions in real traffic.
Ship collision frequency in the Singapore port fairways.
* Source from Otto et al. (Reference Otto, Pedersen, Samuelides and Sames2002), Pedersen (Reference Pedersen2002) and Kujala et al. (Reference Kujala, Hanninen, Arola and Ylitalo2009)
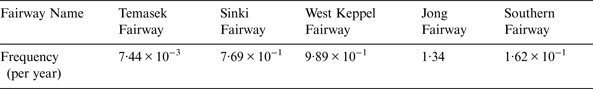
Table 4 further gives the frequency of collision accidents occurred in each fairway. Similar to the findings from Figure 7, it is found that the Jong fairway has the highest collision frequency, followed by the West Keppel fairway. The Temasek fairway is found to have the lowest collision frequency. These results are consistent with the observed data from the historical accident records.
Ship collision frequency at different fairways.
Figure 8 demonstrates that the ship collision frequency at night is significantly larger than during the day, specifically for the Temasek fairway. It should be pointed out that the high ship collision accident frequency is not caused by the high traffic density at night. According to the collected AIS data, the traffic density during the daytime period is found to be 1·8% higher than that during the night period. The higher collision likelihood is primarily due to the higher causation probability used for the night time dangerous encounters (6·83 × 10−5 for daytime periods vs. 4·64 × 10−4 for night time periods). This is because the navigation speeds and courses are determined less readily than during the day. Pilots may totally rely on the navigational aids such as radar and navigational lights at night, which makes risk perception and mitigation processes difficult as pilots are less able to verify the situation visually. In addition, the poor visibility at night could hinder the watch-keeping process and the effectiveness of navigational lights is also reduced at night (Akten, Reference Akten2004).
Effect of time of a day on the collision frequency at different fairways.
4. CONCLUSIONS
This study aimed to evaluate the ship collision frequency in port waterways. The ship domain radius has been formulated as a function of the factors including the angle between two ships, ship types and the average length of two ships for the proposed ship collision frequency model. One case study was created to test the proposed model using one month's real-time ship movement data in five major Singapore port fairways including Temasek fairway, Sinki fairway, West Keppel fairway, Jong fairway and Southern fairway.
The case study successfully showed that the proposed model has the capability of evaluating the ship collision frequency in the port waterways. Results showed that tankers account for the largest proportion of accidents in the Temasek fairway. However, the percentage of RORO and passenger ships is quite small in the Temasek fairway, Sinki fairway, Jong fairway and Southern fairway. The percentage of RORO and passenger ships is largest in the West Keppel fairway. In general, tankers and container ships are the two major ship types involved in dangerous ship encounters. It can be also seen that the largest numbers of dangerous head-on and overtaking encounters are associated with the Jong fairway. This suggests that ships navigating in the Jong fairway have the highest probability of being involved in dangerous head-on encounters. In addition, the majority of dangerous crossing encounters occurred in the West Keppel and Jong fairways. Consistent with previous studies, ship collision frequency at night is found to be significantly higher than during the day in this study.
The proposed model can be adopted to evaluate changes in port waterways. In addition, the proposed model can also be used as a diagnostic and evaluative tool of navigational safety in port waterways. Due to data limits, this study did not take into account the effect of navigational skills on the causation probability. Therefore, we will investigate the relationship between the causation probability and factors like navigational skills in the future. Another limitation of this study is that it is a simplified approach to estimating ship collision frequencies by using the overlap of ship domains. In future study, we will use a time-based measure and distance-based measure together (e.g., DCPA and TCPA) to estimate the frequency of collisions because this approach considers the two-dimensional nature of navigational traffic movements and thus provides more accurate results. In addition, validating the causation probability values in the context of the Singapore port could be one topic of our future study.
DISCLAIMER
The views expressed in this paper only reflect the opinion of the author and must not be considered as official opinions from any national or international maritime authorities.
ACKNOWLEDGEMENTS
The author sincerely thanks the anonymous referees for their helpful comments and valuable suggestions, which considerably improved the exposition of this work. This study is supported by the Fundamental Research Funds for the Central Universities (no. 2014JBM065).