


Introduction
With about 25,000 species and a cosmopolitan distribution, digenetic trematodes constitute one of the most diverse and ubiquitous groups of parasites on the planet (Esch et al., Reference Esch, Barger and Fellis2002). Despite their complex life history with a wide variety of vertebrate definitive hosts, including fish, amphibians, reptiles, birds and mammals, this group shares a unifying character: practically all species require molluscs (usually gastropods) as first intermediate hosts. Due to their complex interaction with their hosts and their wide distribution and abundance, trematodes have been studied in a wide range of ecological contexts. For example, trematodes have been shown to make up a large proportion of an ecosystem's biomass (Kuris et al., Reference Kuris, Hechinger and Shaw2008; Preston et al., Reference Preston, Orlofske, Lambden and Johnson2013; Soldánová et al., Reference Soldánová, Selbach and Sures2016), contribute significantly to the energy flow within ecosystem (Thieltges et al., Reference Thieltges, Jensen and Poulin2008), function as structuring forces in food webs (Lafferty et al., Reference Lafferty, Allesina and Arim2008; Thieltges et al., Reference Thieltges, Amundsen and Hechinger2013) and can affect host populations by influencing host mortality, fecundity, growth and behaviour (Mouritsen & Jensen, Reference Mouritsen and Jensen1994; Marcogliese, Reference Marcogliese2004; Lagrue & Poulin, Reference Lagrue and Poulin2008; Rosenkranz et al., Reference Rosenkranz, Poulin and Selbach2018). Moreover, they can serve as useful bioindicators to assess environmental conditions and changes due to their intricate life cycles (e.g. Lafferty, Reference Lafferty1997; Huspeni & Lafferty, Reference Huspeni and Lafferty2004; Vidal-Martínez et al., Reference Vidal-Martínez, Pech, Sures, Purucker and Poulin2010; Shea et al., Reference Shea, Kersten, Puccia, Stanton, Stiso, Helgeson and Back2012; Nachev & Sures, Reference Nachev and Sures2016). Altogether, there is increasing awareness that trematodes are important ecosystem components that require our attention in order to fully understand the complex interactions and dynamics in ecosystems.
In freshwater systems, snails of the families Lymnaeidae and Planorbidae play a key role in the life cycle of trematodes. In Europe, members of both families serve as important first intermediate hosts to a wide variety of digenean trematodes, with 87 and 92 described species, respectively, which accounts for more than 85% of the described trematode species from gastropod hosts from this region (Faltýnková et al., Reference Faltýnková, Sures and Kostadinova2016; Schwelm et al., Reference Schwelm, Soldánová, Vyhlídalová, Sures and Selbach2018). Both groups are well-studied model host–parasite systems in terms of their diversity, ecological function and their role as infectious agents (e.g. Faltýnková & Haas, Reference Faltýnková and Haas2006; Faltýnková et al., Reference Faltýnková, Našincová and Kablásková2007, Reference Faltýnková, Našincová and Kablásková2008, Reference Faltýnková, Sures and Kostadinova2016; Soldánová et al., Reference Soldánová, Selbach, Sures, Kostadinova and Pérez-Del-Olmo2010, Reference Soldánová, Selbach, Kalbe, Kostadinova and Sures2013, Reference Soldánová, Georgieva and Roháčová2017; Novobilský et al., Reference Novobilský, Engström, Sollenberg, Gustafsson, Morrison and Höglund2014; Horák et al., Reference Horák, Mikeš, Lichtenbergová, Skála, Soldánová and Brant2015; Selbach et al., Reference Selbach, Soldánová and Sures2015a, Reference Selbach, Soldánová, Georgieva, Kostadinova and Suresb). Consequently, detailed identification keys (Faltýnková et al., Reference Faltýnková, Našincová and Kablásková2007, Reference Faltýnková, Našincová and Kablásková2008; Selbach et al., Reference Selbach, Soldánová, Georgieva, Kostadinova, Kalbe and Sures2014) as well as accessible molecular vouchers (e.g. Georgieva et al., Reference Georgieva, Selbach, Faltýnková, Soldánová, Sures, Skírnisson and Kostadinova2013, Reference Georgieva, Faltýnková, Brown, Blasco-Costa, Soldánová, Sitko, Scholz and Kostadinova2014; Selbach et al., Reference Selbach, Soldánová, Georgieva, Kostadinova, Kalbe and Sures2014, Reference Selbach, Soldánová, Georgieva, Kostadinova and Sures2015b; Zikmundová et al., Reference Zikmundová, Georgieva, Faltýnková, Soldánová and Kostadinova2014; Soldánová et al., Reference Soldánová, Georgieva and Roháčová2017) are available for these parasite taxa, which enable studies to accurately identify trematodes and asses their ecological role. Moreover, the life cycles of many trematodes are known in detail (Brown et al., Reference Brown, Soldánová, Barrett and Kostadinova2011 and references therein), which allows conclusions to be drawn about the presence or absence of free-living organisms in ecosystems (Byers et al., Reference Byers, Altman, Grosse, Huspeni and Maerz2010).
In contrast to the detailed knowledge about lymnaeid and planorbid host-trematode systems, the role of bithyniid snails and other non-pulmonate snails, such as Hydrobiidae, Melanopsidae, Neritidae, Valvatidae and Viviparidae, as first intermediate hosts for trematodes in Central Europe remains largely unexplored. Although snails of these families are known to host digenean trematodes and these data were included in some faunistic surveys (e.g. Cichy et al., Reference Cichy, Faltýnková and Żbikowska2011; Faltýnková et al., Reference Faltýnková, Sures and Kostadinova2016), these studies were mostly focused on lymnaeid and planorbid hosts. The faucet snail, Bithynia tentaculata, which is common and widespread throughout Europe, has established itself as a non-indigenous species in North America (Mills et al., Reference Mills, Leach, Carlton and Secor1993; Duggan et al., Reference Duggan, Bailey, Colautti, Gray, Makarewicz, MacIsaac and Munawar2003; Bachtel et al., Reference Bachtel, Rittenhouse, Sandland and Koop2019). Bithynia tentaculata is highly tolerant towards salinity and temporal droughts and occurs in most waterbodies throughout Europe (Glöer, Reference Glöer2002; Welter-Schultes, Reference Welter-Schultes2012). With 32 trematode species according to Cichy et al. (Reference Cichy, Faltýnková and Żbikowska2011) and 14 species according to Faltýnková et al. (Reference Faltýnková, Sures and Kostadinova2016) known from B. tentaculata, it represents the most species-rich snail–parasite assemblage among the group of non-pulmonate freshwater snails (formerly known as ‘Prosobranchia’) in Europe. However, due to the lack of focussed faunistic studies on trematode communities in this host species, with the exception of individual studies investigating selected parasite groups (e.g. Serbina, Reference Serbina2005; Kudlai et al., Reference Kudlai, Stunženas and Tkach2015, Reference Kudlai, Kostadinova, Pulis and Tkach2017), the number of trematode species known from B. tentaculata may well grossly underestimate the true diversity of this host–parasite system.
A serious obstacle for most freshwater ecologists and parasitologists encountering trematodes of the snail families Bithynidae, Hydrobiidae, Melanopsidae, Neritidae, Valvatidae and Viviparidae is the lack of morphological and molecular information for species identification. Unlike for planorbid and lymnaeid snails, there are no keys for larval trematodes parasitizing snails from these families, and morphological descriptions are often restricted to adult stages (e.g. Gibson et al., Reference Gibson, Jones and Bray2002; Tkach et al., Reference Tkach, Littlewood, Olson, Kinsella and Swiderski2003; Jones et al., Reference Jones, Bray and Gibson2005; Bray et al., Reference Bray, Gibson and Jones2008; Besprozvannykh et al., Reference Besprozvannykh, Rozhkovan and Ermolenko2017; Kudlai et al., Reference Kudlai, Kostadinova, Pulis and Tkach2017). Moreover, existing literature is often not available in English (e.g. Našincová, Reference Našincová1992; Ataev et al., Reference Ataev, Kozminsky and Dobrovolskij2002; Serbina, Reference Serbina2005; Besprozvannykh, Reference Besprozvannykh2009), which also exacerbates the investigation of this parasite–host system. These obstacles lead to a further bias towards well-studied species, such as Lymnaea stagnalis, Radix spp. and Planorbarius corneus, while other snail species continue to remain overlooked and avoided in the assessments of the ecological role of trematodes. It is, therefore, important to characterize the trematode fauna in B. tentaculata, and thus facilitate further studies on the ecological role of this host–parasite system, as is possible for lymnaeid and planorbid snails. Moreover, some of the trematodes utilizing Bithynia spp. are important pathogens of wildlife that can have serious impacts on migrating birds (e.g. Herrmann & Sorensen, Reference Herrmann and Sorensen2009; Roy & St-Louis, Reference Roy and St-Louis2017; Bachtel et al., Reference Bachtel, Rittenhouse, Sandland and Koop2019), which further highlights the need for a better understanding of this host and its parasite fauna.
Here, we assess the diversity of the larval trematodes of B. tentaculata in Central Europe and provide molecular and morphological reference material to fill this gap in our knowledge. With this study, we also hope to draw more attention to this essential and largely overlooked parasite–host system and promote further studies on this group.
Material and methods
Sample collection
In total, 682 snails of the species B. tentaculata were collected and examined for trematode infections during monthly collections in 2016 and 2017. Snails were collected at four sampling sites at the River Lippe in summer and autumn in 2016 and 2017 (K4: 51°39′44.1″N, 8°10′23.9″E; K1: 51°39′42.3″N, 8°13′49.3″E; K2: 51°39′41.5″N, 8°14′18.1″E; K3: 51°39′41.8″N, 8°14′19.2″E) and at two sampling sites at the lower River Rhine (R1: 51°47′59.2″N, 6°21′46.3″E; R3: 51°48′37.1″N, 6°21′23.4″E) and one pond of its adjacent floodplain (R2: 51°49′07.0″N, 6°20′26.8″E) in spring, summer and autumn in 2017 in North Rhine-Westphalia, Germany (fig. 1). Additionally, 121 B. tentaculata were collected from the Curonian Lagoon near the village of Juodkrante, Lithuania (55°35′38″N, 21°7′57″E) in June 2013. Snails from Germany were identified using the identification keys of Glöer (Reference Glöer2002) and Welter-Schultes (Reference Welter-Schultes2012).
Map of Germany and the federal state of North Rhine-Westphalia indicating sampling sites along the rivers Lippe and Rhine. Sampling sites are marked with red triangles.

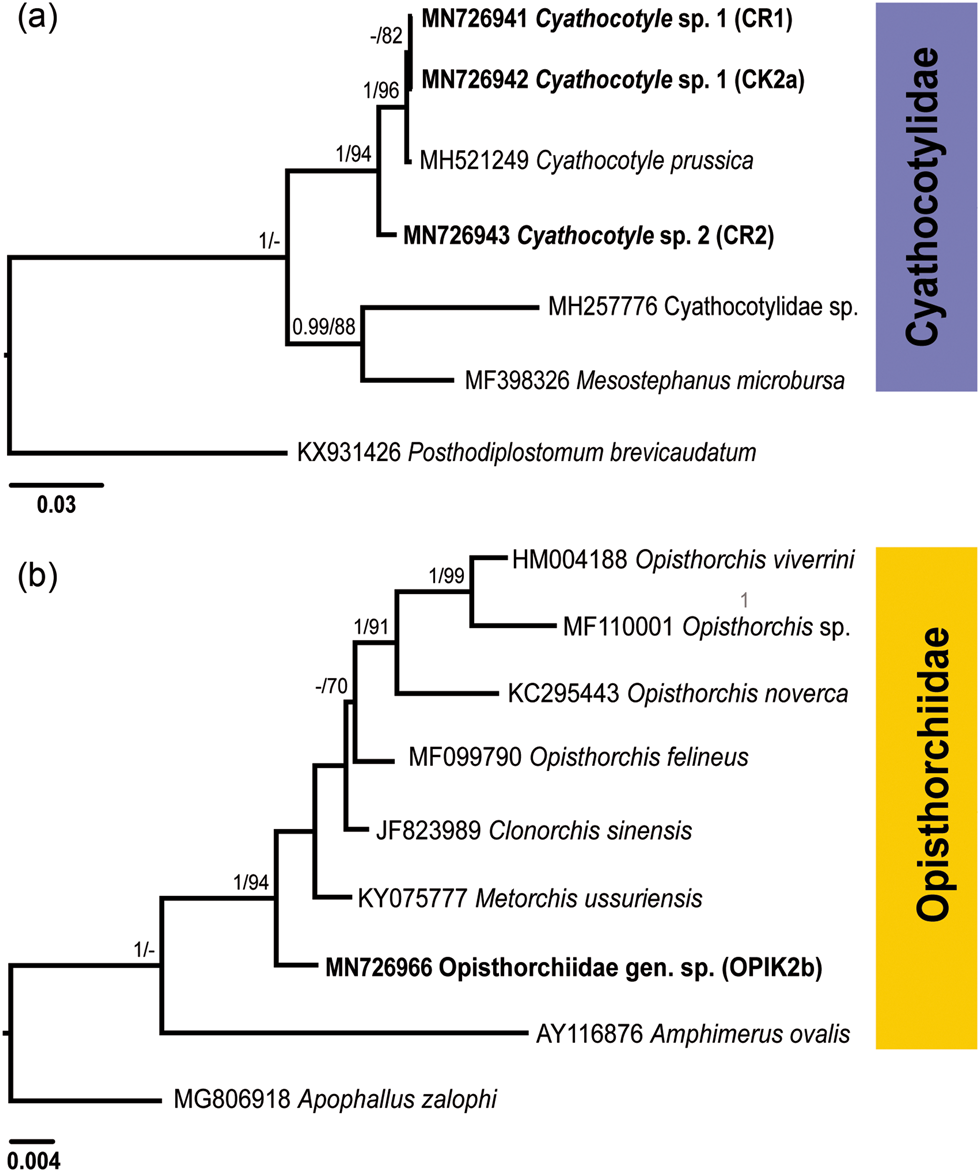
Phylogenetic trees for Cyathocotylidae (a) and Opisthorchiidae (b) based on the partial sequences of the 28S rRNA gene. Numbers above branches indicate nodal support as posterior probabilities from the Bayesian inference (BI), followed by bootstrap values from the maximum likelihood (ML) analysis. Support values lower than 0.90 (BI) and 70 (ML) are not shown. The scale bar indicates the expected number of substitutions per site. The newly generated sequences are highlighted in bold.
All snails were collected with strainers or hand-picked from sediments, stones, macrophytes and floating vegetation from the riverside or along the littoral zone of the pond. In the laboratory, snails were placed in individual cups with filtered river water at 20°C and exposed to a light source to induce the emergence of cercariae. Each cup was screened for the presence of cercariae three times over three consecutive days after sampling under a stereomicroscope. Snails that did not shed cercariae during this time period were dissected and examined for prepatent infections (rediae/sporocysts). To obtain isolates for molecular analyses, cercariae, rediae and sporocysts were pooled from one single infected snail host and fixed in molecular-grade ethanol. Additionally, cercariae were fixed in 4% formaldehyde solution for measurements of fixed material. For documentation and measurements of the snail hosts, photomicrographs of the snail shell were taken with a Keyence VHX5000 microscope (Osaka, Japan). Foot tissue from infected snails was fixed in molecular-grade ethanol for molecular analysis and identification.
Morphological analyses
Larval stages were preliminarily identified under an Olympus BX51 microscope (Tokyo, Japan) using morphological descriptions of Našincová (Reference Našincová1992) and Bykhovskaya-Pavlovskaya & Kulakova (Reference Bykhovskaya-Pavlovskaya and Kulakova1971) and other relevant publications (e.g. Heinemann, Reference Heinemann1937; Zdun, Reference Zdun1961; Našincová & Scholz, Reference Našincová and Scholz1994; Kudlai et al., Reference Kudlai, Stunženas and Tkach2015). Preliminary identification was made to the family or genus level. Morphology of cercariae was studied on live and fixed specimens. Series of photomicrographs were taken for collected isolates with an Olympus UC30 digital camera (Tokyo, Japan) for measurements and further identification. Measurements were taken from the digital images using cellSens 1.16 Life Science image software (https://www.olympus-lifescience.com/en/software/cellsens). Measurements are in micrometres (μm) and are presented as a range, followed by a mean in parentheses.
Molecular sequencing
DNA isolation was performed following a modified salt precipitation protocol after Sunnucks & Hales (Reference Sunnucks and Hales1996) and Grabner et al. (Reference Grabner, Weigand, Leese, Winking, Hering, Tollrian and Sures2015). To each sample, 600 µl TNES Buffer and 10 µl proteinase K solution were added. Trematode samples were incubated at 50°C for two to three hours depending on the quantity of the sample material. Snail tissue samples were incubated overnight at 35°C. In order to precipitate the proteins, 170 µl of 5 M sodium chloride was added, followed by vortexing and centrifuging for 5 min at 20,000×g at room temperature. The supernatant was transferred into a new reaction tube and centrifuging was repeated. The supernatant was again transferred into a new reaction tube, the pellet was discarded and 800 µl of 99% ice-cold ethanol was added to the supernatant and mixed by repeated inverting. The solution was centrifuged at 20,000×g for 15 min at 4°C. In order to purify the sample, 180 µl of 70% ethanol was added after the supernatant was discarded. The sample was centrifuged for 15 min at 20,000×g at 4°C, the ethanol was discarded and the pellet air-dried. The DNA pellet was dissolved in 100 µl TE buffer.
Target gene fragments were chosen based on preliminary identification of cercariae to the family level and were amplified via polymerase chain reaction (PCR) (table 1) following the corresponding protocols (Folmer et al., Reference Folmer, Black, Hoeh, Lutz and Vrijenhoek1994; Cribb et al., Reference Cribb, Anderson, Adlard and Bray1998; Galazzo et al., Reference Galazzo, Dayanandan, Marcogliese and McLaughlin2002; Kostadinova et al., Reference Kostadinova, Herniou, Barrett and Littlewood2003; Tkach et al., Reference Tkach, Littlewood, Olson, Kinsella and Swiderski2003). Tissue of snails was also used for DNA extraction and PCR amplification using the primers and protocols by Folmer et al. (Reference Folmer, Black, Hoeh, Lutz and Vrijenhoek1994). PCR products were purified using purification kits (GATC Biotech, Constance, Germany). The original PCR primers and the internal primers for 28S were used for sequencing (table 1). Contiguous sequences were assembled and edited in Geneious ver. 11 (https://www.geneious.com). All sequences were submitted to GenBank under accession numbers MN720141–MN720149; MN723852–MN723854; MN726941–MN726975; and MN726988–MN727001. For species identification, each sequence was compared with sequences available in GenBank by using the Basic Local Alignment Tool (BLAST).
PCR primers for gene-fragments used in the study.

a Internal primers. PCR conditions were followed as described in the source papers.
Phylogenetic analyses
The newly generated sequences were aligned with sequences available in GenBank according to the trematode family and gene amplified (supplementary table S1). Sequences were aligned with MUSCLE (Edgar, Reference Edgar2004) implemented in Geneious ver. 11. A total of eight alignments for nine families were analysed. Outgroup selection was based upon the molecular phylogenies of Olson et al. (Reference Olson, Cribb, Tkach, Bray and Littlewood2003), Tkach et al. (Reference Tkach, Kudlai and Kostadinova2016), Kanarek et al. (Reference Kanarek, Zaleśny, Sitko and Tkach2017) and Hernández-Orts et al. (Reference Hernández-Orts, Georgieva, Landete and Scholz2019). Phylogenetic trees for each dataset were constructed with Bayesian inference (BI) and maximum likelihood (ML) analyses on the CIPRES portal (Miller et al., Reference Miller, Pfeiffer and Schwartz2010) and the ATGC bioinformatics platform, respectively. The Akaike Information Criterion implemented in jModelTest 2.1.1 (Guindon and Gascuel, Reference Guindon and Gascuel2003; Darriba et al. Reference Darriba, Taboada, Doallo and Posada2012) was used to determine the best-fit nucleotide substitution model for each dataset. These were the general time reversible model, with estimates of invariant sites and gamma distributed among-site rate variation (GTR + I + G) for six alignments: Echinochasmidae and Psilostomidae (28S), Psilostomidae (28S), Notocotylidae (28S), Pleurogenidae and Prosthogonimidae (28S and internal transcribed spacer 2 (ITS2)), and Opecoelidae (28S); and (GTR + I) for two alignments: Cyathocotylidae (28S) and Opisthorchiidae (28S). BI analyses were performed using MrBayes v3.2.6 (Ronquist et al., Reference Ronquist, Teslenko and Van Der Mark2012). Markov chain Monte Carlo chains were run for ten million generations, log-likelihood scores were plotted and only the final 75% of trees were used to produce the consensus trees by setting the ‘burnin’ parameter at 2500 for six alignments: Echinochasmidae and Psilostomidae (28S), Psilostomidae (28S), Notocotylidae (28S) and Pleurogenidae and Prosthogonimidae (28S and ITS2). Markov chain Monte Carlo chains were run for three million generations, log-likelihood scores were plotted and only the final 75% of trees were used to produce the consensus trees by setting the ‘burnin’ parameter at 750 for two alignments: Cyathocotylidae (28S) and Opisthorchiidae (28S). ML analyses were performed using PhyML version 3.0 (Guindon et al., Reference Guindon, Dufayard, Lefort, Anisimova, Hordijk and Gascuel2010) with a non-parametric bootstrap validation based on 100 replicates. Trees were visualized using the FigTree ver. 1.4 software (http://tree.bio.ed.ac.uk/software/figtree/). One cox1 sequence alignment was analysed for the snails. The genetic divergence among taxa was estimated using uncorrected p-distances with the program MEGA version 6 (Tamura et al., Reference Tamura, Stecher, Peterson, Filipski and Kumar2013).
Results
General observations
A total of 12.9% of all B. tentaculata from Germany showed larval trematode infections. Snails collected in Lithuania showed an overall prevalence of 14%. Phylogenetic and BLAST analyses based on 55 novel sequences for 36 isolates recovered from B. tentaculata collected in Germany and Lithuania (table 2) demonstrated high diversity of digeneans, including 20 species belonging to ten families: Cyathocotylidae, Echinochasmidae, Lecithodendriidae, Lissorchiidae, Notocotylidae, Opecoelidae, Opisthorchiidae, Pleurogenidae, Prosthogonimidae and Psilostomidae.
Summary data for isolates collected from Bithynia tentaculata and used for generation of novel sequences.
Six partial cox1 sequences were generated from isolates of B. tentaculata sampled in all German localities (MN720141–MN720146). The sequence difference between the isolates was 0‒0.2% (1 nucleotide (nt) difference), thus confirming their conspecificity. Molecular identification of the snail isolates was achieved by comparing our sequences with sequences for B. tentaculata in GenBank. A BLAST search analysis indicated a 86% coverage and 98% of similarity with two isolates of B. tentaculata from Germany (AF445334) (Hausdorf et al., Reference Hausdorf, Röpstorf and Riedel2003) and North America (JX970605) (Wilke et al., Reference Wilke, Haase, Hershler, Liu, Misof and Ponder2013); and a 89% coverage and 92% of similarity with one isolate from Croatia (AF367643) (Wilke et al., Reference Wilke, Davis, Falniowski, Giusti, Bodon and Szarowska2001). Snails from the Lithuanian system were identified morphologically.
Systematics
Superfamily: Diplostomoidea Poirier, 1886
Cyathocotylidae Mühling, 1898
Molecular results
In total, four snails from three localities were infected with cercariae belonging to the family Cyathocotylidae (prevalence: River Lippe: 0.2%; River Rhine: 4%). Sequences for the partial 28S rRNA gene and entire ITS1-5.8S-ITS2 gene cluster were generated for one isolate per locality.
Both BI and ML analyses of the Cyathocotylidae based on 28S rDNA alignment included novel sequences and those retrieved from GenBank (fig. 2a; supplementary table S1), and resulted in trees with similar topologies. Sequences for the isolates CR1 and CK2a clustered with the sequence for Cyathocotyle prussica Mühling, 1896 with a strong support. A single isolate (CR2) formed a branch basal in the clade of Cyathocotyle spp.
The two identical 28S rDNA sequences (isolates CR1 and CK2a) differed from the sequence for C. prussica (MH521249) by 0.2% (2 nt) and from the sequence for the isolate CR2 by 1.4% (17 nt). The ITS1-5.8S-ITS2 sequences for the isolates CR1 and CK2a were identical and differed from the sequence for the isolate CR2 by 3.7% (48 nt). A BLAST analysis based on ITS1-5.8S-ITS2 data revealed two closely related sequences of the Cyathocotylidae available in GenBank. These were Holostephanus dubinini Vojtek & Vojtkova, 1968 (AY245707) and C. prussica (MH521249) (supplementary table S1). However, the isolates CR1 and CK2a differed from C. prussica by 0.2% (3 nt) and from H. dubinini by 3.8% (49 nt), whereas the isolate CR2 differed from the same species by 3.6% (47 nt) and 3.5% (45 nt), respectively. Based on the results of molecular analyses, the isolates CR1 and CK2a were identified as Cyathocotyle sp. 1 and isolate CR2 as Cyathocotyle sp. 2.
Systematics
Cyathocotyle Muhling, 1896
Cyathocotyle sp. 1
First intermediate host. Bithynia tentaculata (L.) (Gastropoda: Bithyniidae).
Localities. River Rhine (R1), River Lippe (K2), Germany.
Representative DNA sequences. 28S rDNA, two replicates (MN726941, MN726942); ITS1-5.8S-ITS2, two replicates (MN723852, MN723853).
Description
(Measurements from eight fixed specimens.) Furcocercous cercariae (fig. 3a, b) with colourless, opaque, elongate-oval body, 192–226 × 116–147 (205 × 130). Entire body surface covered with minute spines. Tail with furcae; tail stem 267–300 (288) long with maximum width 45–61 (54). Tail stem longer than body [tail stem/body length ratio 1:0.67–0.78 (1:0.71)]. Furcae 229–255 (245) long with maximum width 31–39 (35). Furcae without finfold. Tail stem/furcal length ratio 1:0.80–0.78 (1:0.85). Tips of furcae form contractile processes. Anterior organ terminal, elongate-oval, 36–49 × 29–36 (40 × 32) with several rows of spines (10–12). Prepharynx distinct, pharynx small, elongate-oval, 9–13 × 9–10 (11 × 9); oesophagus short, bifurcating in first third of body, intestinal caeca well developed, conspicuous and wide with lobate walls, terminating blindly at posterior extremity of body. Ventral sucker absent. Penetration gland-cells numerous, small, pear-shaped, posterior to anterior organ and lateral to prepharynx and pharynx, with narrow ducts opening subterminally at the anterior end of anterior organ. Excretory commissures forming two conspicuous loop-like structures. Genital primordium in one group of compact small cells anterior to excretory vesicle. Excretory vesicle thin-walled, transversely oval.
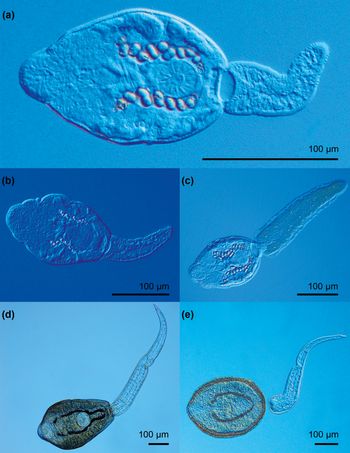
Photomicrographs of live cercariae of the trematode family Cyathocotylidae. (a) Cyathocotyle sp.1; (b) Cyathocotyle sp.1, details of body spines and penetration gland-cells; (c) Cyathocotyle sp. 2.

Cyathocotyle sp. 2
First intermediate host. Bithynia tentaculata (L.) (Gastropoda: Bithyniidae).
Locality. River Rhine (R2), Germany.
Representative DNA sequences. 28S rDNA, one replicate (MN726943); ITS1-5.8S-ITS2, one replicate (MN723854).
Description
(Measurements from ten fixed specimens.) Furcocercous cercariae (fig. 3c) with colourless, opaque, elongate-oval body, 151–176 × 93–120 (165 × 107). Entire body surface covered with minute spines. Several rows (7–8) of small postoral spines at anterior body part. Tail with furcae; tail stem 164–207 (182) long with maximum width at base 39–53 (45). Tail stem longer than body [tail stem/body length ratio 1:0.93–0.97 (0.91)]. Furcae lance-shaped, 135–163 (150) long, maximum width 28–41 (35), with small triangular fins, forming contractile processes. Tail stem/furcal length ratio 1:0.74–0.90 (1:0.82). Anterior organ terminal, elongate-oval, 29–36 × 20–30 (32 × 24). Prepharynx distinct; pharynx small, elongate-oval, muscular, 9–13 × 6–10 (11 × 9), conspicuous; oesophagus very short, indistinct, bifurcation just postpharyngeal. Intestinal caeca well developed, with slightly lobate walls, terminating blindly at posterior extremity of body. Ventral sucker absent. Penetration gland-cells numerous, small, pear-shaped, posterior to anterior organ. Main collection ducts without refractile excretory granules. Excretory commissures forming two loop-like structures. Genital primordium in one group of compact medium-sized cells anterior to excretory vesicle. Excretory vesicle thin-walled, transversely oval.
Remarks
The morphological features of cercariae of both species are consistent with the morphology of cyathocotylid cercariae according to Ginetsinskaya & Dobrovolskij (Reference Ginetsinskaya and Dobrovolskij1968) and Niewiadomska (Reference Niewiadomska1980). To date, cyathocotylid cercariae of nine species have been reported from B. tentaculata in Europe: Cyathocotyle bithyniae Sudarikov, 1974, C. bushiensis (Khan, Reference Khan1962), C. prussica Muhling, 1896; Holostephanus cobitidis Opravilova, 1968, H. curonensis (Szidat, 1933), H. dubinini Vojtek & Vojtkova, 1968, H. luehei Szidat, 1936, H. volgensis (Sudarikov, 1962) and Prohemistomum vivax (Sonsino, 1892).
The cercariae of Cyathocotyle sp. 1 and Cyathocotyle sp. 2 show several distinctive features that allow the separation of the two species. Cercariae of Cyathocotyle sp. 1 differ by body size [length: 192–226 (205) vs. 151–176 (165); width: 116–147 (130) vs. 93–120 (107)], number of rows of postoral spines (10–12 vs. 7–8), shape of furcae (more slender with a sharp tip vs. more compact with small triangular fins), size of furcae [length: 229–255 (245) vs. 135–163 (150); width: 31–39 (45) vs. 39–53 (35)] and tail stem/furcal length ratio [1:0.80–0.89 (1:0.85) vs. 1:0.74–0.90 (1:0.82)]. The oesophagus of the cercariae of Cyathocotyle sp. 2 is much shorter than in Cyathocotyle sp. 1 and it bifurcates just behind the pharynx (fig. 3a, b). The intestinal caeca are well developed in both species, but the cercariae of Cyathocotyle sp. 1 show more conspicuous ceaca with wide and lobate walls, whereas the ceaca of the cercariae of Cyathocotyle sp. 2 exhibit narrower and straighter walls.
General morphology of cercariae of Cyathocotyle sp. 1 and Cyathocotyle sp. 2 corresponds well to cercariae of C. bithyniae, C. prussica and C. bushiensis described by Niewiadomska (Reference Niewiadomska1980), Kanev (Reference Kanev and Vasilev1984) and Khan (Reference Khan1962), respectively. The cercariae of Cyathocotyle sp. 1 resemble cercariae of C. prussica as described by Kanev (Reference Kanev and Vasilev1984) in the absence of the small triangular fins on the tip of furca. However, cercariae of Cyathocotyle sp. 1 have larger body [length: 192–226 (205) vs. 136–169; width: 116–147 (130) vs. 71–105], higher limits for the length and width of the anterior organ [length: 36–49 (40) vs. 32–45; width: 29–36 (32) vs. 26–32], smaller pharynx [9–13 (11) × 9–10 (9) vs. 14 × 14], shorter and narrower tail [length: 267–300 (288) vs. 400–500; width: 45–61 (54) vs. 56–65] and higher low limits for the length and width of furcae [length: 229–255 (245) vs. 208–234; width: 31–39 (35) vs. 26–39].
The cercariae of Cyathocotyle sp. 1 differ from the cercariae of C. bithyniae by larger body [length: 192–226 (205) vs. 161–187; width: 116–147 (130) vs. 102–119], longer tail [267–300 (288) vs. 192–204], shorter and wider anterior organ [length: 29–36 (32) vs. 37–44; width: 36–49 (40) vs. 30–39] and by the absence of the small triangular fins at the ends of the tip of furca. In addition, cercariae of Cyathocotyle sp. 1 bear a small elongate-oval pharynx, whereas the pharynx of C. bithyniae was described as fairly large and muscular [9–13 × 9–10 (11 × 9) vs. 11–17 × 10–15]. The differences between the cercariae of Cyathocotyle sp. 1 and C. bushiensis as described by Khan (Reference Khan1962) include: body width [116–147 (130) vs. 90–93 (92), respectively], size of the furca [229–255 (245) × 31–39 (35) vs. 200–216 (209) × 13–20 (17)], anterior organ [36–49 (40) × 29–36 (32) vs. 43–46 (44) × 33–36 (38)] and pharynx [9–13 (11) × 9–10 (9) vs. 16 × 16].
The present cercariae identified as Cyathocotyle sp. 2 appeared most similar to the cercariae of C. bithyniae and C. bushiensis based on the presence of the small triangular fins at the ends of the tail furcae, but differ from cercariae of C. bithyniae as described by Niewiadomska (Reference Niewiadomska1980) by the lower limits for body length [151–176 (165) vs. 161–187], lower low limits for body width [93–120 (107) vs. 102–119], lower low limits for tail length [164–207 (182) vs. 192–204], higher limits for the width of furca [28–41 (35) vs. 20–34] and shorter anterior organ [20–30 (32) vs. 37–44]. Additionally, the cercariae of Cyathocotyle sp. 2 possess a smaller pharynx than the cercariae of C. bithyniae [9–13 (11) × 6–10 (9) vs. 11–17 × 10–15].
Cercariae of Cyathocotyle sp. 2 differ from C. prussica as described by Kanev (Reference Kanev and Vasilev1984) by larger body [length: 151–176 (165) vs. 136–169; width: 93–120 (107) vs. 71–105], lower low limits for length and width of the anterior organ [length: 29–36 (32) vs. 32–45; width: 20–30 (24) vs. 26–32], smaller pharynx [length: 9–13 (11) vs. 14; width: 6–10 (9) vs. 14], shorter and narrower tail [length: 164–207 (182) vs. 400–500; width: 39–53 (45) vs. 56–65] and shorter furcae [135–163 (150) vs. 208–234].
The cercariae of Cyathocotyle sp. 2 differ from cercariae of C. bushiensis as described by Khan (Reference Khan1962) by smaller body dimensions except the width of body [93–120 (107) vs. 90–93 (92), respectively] and furca [28–41 (35) vs. 13–20 (17)].
Systematics
Superfamily: Echinostomatoidea Looss, 1899
Echinochasmidae Odhner, 1910 and Psilostomidae Looss, 1900
Molecular results
Infection with the cercariae of the families Echinochasmidae and Psilostomidae was detected in nine snails from two localities in the River Rhine and one locality at the River Lippe, and in two snails collected in the Curonian Lagoon (prevalence: Echinochasmidae: River Lippe, 0.2%; River Rhine, 4%; Curonian Lagoon, 0.8%; Psilostomidae: River Lippe, 0.2%; River Rhine, 6.7%; Curonian Lagoon, 13.2%). Partial 28S rDNA sequences were generated for all collected isolates (n = 11); nad1 sequences were successfully generated for three isolates (fig. 4; supplementary fig. S1; table 2).
Phylogenetic tree for Echinochasmidae and Psilostomidae based on the partial sequences of the 28S rRNA gene. Numbers above branches indicate nodal support as posterior probabilities from the Bayesian inference (BI), followed by bootstrap values from the maximum likelihood (ML) analysis. Support values lower than 0.90 (BI) and 70 (ML) are not shown. The scale bar indicates the expected number of substitutions per site. The newly generated sequences are highlighted in bold. Sequences obtained in Curonian Lagoon indicated by asterisk.

Sequences of partial 28S rDNA obtained in this study were aligned with the available sequences for echinoschasmids (n = 15) and psilostomids (n = 13) from GenBank (supplementary table S1). Two species of the Himasthlidae, Acanthoparyphium spinulosum Johnston, 1917 and Himasthla limnodromi Didyk & Burt, 1997 were used as the outgroup based on the topologies in the phylogenetic tree of the Echinostomatoidea published by Tkach et al. (Reference Tkach, Kudlai and Kostadinova2016). Both BI and ML analyses yielded a similar topology, with two main clades representing the two families, Echinochasmidae and Psilostomidae. The newly generated sequences fell into two distinct and strongly supported clades within each family. Two isolates, ECR1 and EBR1, collected from the River Rhine were identical with the sequences for Echinochasmus coaxatus Dietz, 1909 (KT956928) ex Podiceps nigricollis and E. bursicola (Creplin, 1837) (KT956938) ex Ardea alba from Ukraine (Tkach et al., Reference Tkach, Kudlai and Kostadinova2016), respectively (fig. 4; supplementary table S1). The three remaining isolates within the Echinochasmidae represent two unidentified species of Echinochasmus. Echinochasmus sp. 1 (E2R1 and E1CB) clustered with the sequence for Echinochasmus milvi Yamaguti, 1939 (KT873319) from Russia, and Echinochasmus sp. 2 (E1K2a) with E. beleocephalus (Linstow, 1873) (KT956929) ex A. alba from Ukraine and E. japonicus Tanabe, 1926 (JQ890579) ex Gallus gallus from Vietnam. The interspecific divergence between Echinochasmus sp. 1 and E. milvi was 1.5% (58 nt), and between Echinochasmus sp. 2 and E. beleocephalus and E. japonicus was 0.2% (2 nt) and 0.6 (7 nt), respectively.
Six isolates (SR2, PS1R1, PS1R2, PS1K2a, PSCB and PS2R2) represented by three species fell within the clade for the Psilostomidae. One isolate (SR2) collected from the River Rhine was identical to the isolate for Sphaeridiotrema sp. ex B. tentaculata (KT956958) from Lithuania (fig. 5; supplementary table S1). Five remaining isolates formed a strongly supported clade with four of them (PS1R1, PS1R2, PS1K2a and PSCB) representing the same species, whereas the fifth isolate (PS2R2) was distinct. The sequences for these five isolates did not show affiliation to any of the psilostomid genera included in the analyses. The interspecific divergence between the two species was 1.8% (20 nt). Based on these results, both species were identified to the family level as Psilostomidae gen. sp. 1 and Psilostomidae gen. sp. 2.
Additional analyses were conducted for the Psilostomidae in order to include sequences of the three species of the genus Psilotrema Odhner, 1913 available in GenBank (supplementary table S1). The sequences for these species were not included in the main analyses due to their short length (759 nt). In these analyses, the isolates for Psilostomidae gen. sp. 1 and Psilostomidae gen. sp. 2 clustered in a clade with representatives of the genus Psilotrema, P. oschmarini, P. simillium and P. acutirostris, while Psilostomidae gen. sp. 1 appeared to be conspecific with P. oschmarini (see supplementary fig. S1). Based on this result, both species – Psilostomidae gen. sp. 1 and Psilostomidae gen. sp. 2 – may belong to the genus Psilotrema. However, at this stage, we refrain from identifying cercariae in our material as P. oschmarini due to the results being based on a short dataset and the lack of morphological vouchers for the sequences in GenBank.
Systematics
Echinochasmidae Odhner, 1910
Echinochasmus Dietz, 1909
Echinochasmus coaxatus Dietz, 1909
First intermediate host. Bithynia tentaculata (L.) (Gastropoda: Bithyniidae).
Locality. River Rhine (R1), Germany.
Representative DNA sequences. 28S rDNA, one replicate (MN726944); nad1, one replicate (MN720147).
Description
(Measurements from 11 fixed specimens.) Gymnocephalous cercariae (fig. 5a). Body colourless, oval, with maximum width slightly anterior to ventral sucker, 103–124 × 68–102 (115 × 86). Tegument thick, tegumental spines absent. Collar poorly developed. Collar spines absent. Tail simple, muscular, contractile, 72–115 (92) long, with maximum width at base 22–33 (29), slightly shorter than body [tail/body length ratio 1:1.12–1.35 (1:1.25)]. Oral sucker subterminal, muscular, subspherical, 23–32 × 28–36 (29 × 31). Ventral sucker subspherical, just postequatorial, 26–33 × 23–31 (30 × 27). Oral/ventral sucker width ratio 1:0.90–1.14 (1:1.03). Prepharynx distinct, pharynx spherical, muscular, 6–10 × 5–10 (8 × 7). Caeca indistinct. Penetration gland-cells numerous, on both sides posterior to oral sucker. Cystogenous gland-cells few, rounded, with rhabditiform contents. Excretory vesicle bipartite; anterior part transversely oval, at level of posterior margin of body, posterior part transversely oval, at junction of body and tail; main collecting ducts wide, dilated between mid-level of pharynx and level of posterior margin of ventral sucker, containing large dark refractile excretory granules of different size (12 on each side).
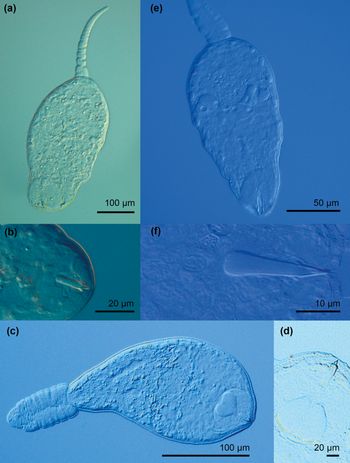
Photomicrographs of live trematode cercariae of the families Echinochasmidae and Psilostomidae. (a) Echinochasmus coaxatus; (b) Echinochasmus bursicola; (c) Echinochasmus sp. 1; (d) Psilostomidae gen. sp. 1; (e) Psilostomidae gen. sp. 2.
Echinochasmus bursicola (Creplin, 1837)
First intermediate host. Bithynia tentaculata (L.) (Gastropoda: Bithyniidae).
Locality. River Rhine (R1), Germany.
Representative DNA sequences. 28S rDNA, one replicate (MN726945).
Description
(Measurements from ten fixed specimens.) Gymnocephalous cercariae (fig. 5b). Body colourless, oval, with maximum width slightly anterior to ventral sucker, 110–132 × 71–105 (120 × 88). Tegument thick, tegumental spines absent. Collar well developed. Collar spines absent. Tail simple, muscular, contractile, 83–101 (93) long, with maximum width at base 31–39 (36), shorter than body [tail/body length ratio 1:1.18–1.42 (1:1.29)]. Oral sucker subterminal, muscular, transversely oval, 25–37 × 31–40 (30 × 35). Ventral sucker subspherical, just postequatorial, 27–38 × 25–37 (33 × 31). Oral/ventral sucker width ratio 1:0.90–1.27 (1:1.10). Prepharynx long, distinct, pharynx subspherical, muscular, 7–10 × 6–9 (9 × 7). Penetration gland-cells numerous, on both sides posterior to oral sucker. Cystogenous gland-cells few, rounded, with rhabditiform contents. Excretory vesicle bipartite; anterior part transversely oval, at level of posterior margin of body, posterior part transversely oval, at junction of body and tail; main collecting ducts narrow, containing large dark refractile excretory granules of different size (seven on each side).
Echinochasmus sp. 1
First intermediate host. Bithynia tentaculata (L.) (Gastropoda: Bithyniidae).
Locality. River Rhine (R1), Germany; Curonian Lagoon (CB), Lithuania.
Representative DNA sequences. 28S rDNA, two replicates (MN726946, MN726947).
Description
(Measurements from seven fixed specimens.) Gymnocephalous cercariae (fig. 5c). Body colourless, oval, with maximum width at level of ventral sucker, 105–136 × 74–125 (123 × 95). Tegument thick, brownish, tegumental spines absent. Collar unincisive. Collar spines absent. Tail simple, leaf-like, brownish, muscular, contractile, with few randomly arranged subspherical concretions, 115–170 (141) long with maximum width at base 27–82 (53), longer than body [tail/body length ratio 1:0.74–0.96 (1:0.87)]. Oral sucker subterminal, subspherical 28–40 × 28–35 (32 × 31). Ventral sucker subspherical, 25–34 × 26–33 (30 × 29). Oral/ventral sucker width ratio 1:0.78–1.06 (1:0.94). Prepharynx indistinct, pharynx elongate-oval, muscular, 12–16 × 6–10 (13 × 8). Caeca indistinct. Penetration gland-cells numerous, on both sides posterior to oral sucker. Cystogenous gland-cells numerous, with rhabditiform contents, on both sides anterior to ventral sucker. Excretory vesicle bipartite; anterior part smaller, transversely oval, at level of posterior margin of body, posterior part larger, transversely oval, at junction of body and tail; main collecting ducts wide, dilated between level of pharynx and anterior margin of ventral sucker, narrowing posteriorly and anteriorly, containing dark refractile excretory granules of different size (13–15 large ones on each side plus several small ones at posterior and anterior ends).
Echinochasmus sp. 2
First intermediate host. Bithynia tentaculata (L.) (Gastropoda: Bithyniidae).
Locality. River Lippe (K2), Germany.
Representative DNA sequences. 28S rDNA, one replicate (MN726948); nad1, one replicate (MN720148).
Description (no photomicrograph available)
(Measurements from seven fixed specimens.) Gymnocephalous cercariae. Body colourless, oval, with maximum width at level of ventral sucker, 98–133 × 66–84 (117 × 75). Tegument thick, tegumental spines absent. Collar poorly developed. Collar spines absent. Tail simple, muscular, contractile, 83–123 (102) long, with maximum width at base 23–31 (28), slightly shorter than body [tail/body length ratio 1:0.96–1.30 (1:1.15)]. Oral sucker subterminal, subspherical 27–37 × 26–36 (31 × 33). Ventral sucker spherical, muscular, 22–31 × 22–31 (28 × 28). Oral/ventral sucker width ratio 1:0.71–1.03 (1:0.90). Prepharynx indistinct, pharynx elongate-oval, muscular, 7–10 × 5–8 (9 × 7). Caeca indistinct. Penetration gland-cells numerous, on both sides posterior to oral sucker. Cystogenous gland-cells numerous, with rhabditiform contents, on both sides anterior to ventral sucker. Excretory vesicle transversely oval at junction of body and tail; main collecting ducts wide, containing large, dark refractile excretory granules of different size (19 on each side).
Remarks
Cercariae of both identified species of Echinochasmus – E. coaxatus and E. bursicola – have been previously reported from B. tentaculata (Karmanova, Reference Karmanova1973, Reference Karmanova1974). The life cycle of E. coaxatus was described by Karmanova (Reference Karmanova1974) in the Astrakhan Nature Reserve, Russia. Cercariae were found in B. tentaculata and metacercariae were found in the freshwater fishes of the families Cyprinidae and Percidae, collected in the River Volga. Cercariae of E. coaxatus were also reported from Radix auricularia in the lake Gołdapiwo, Poland, by Wiśniewski (Reference Wiśniewski1957). General morphology of cercariae found in our study corresponded well to the description for cercariae of E. coaxatus by Karmanova (Reference Karmanova1974), except in the number of the refractile excretory granules per collecting duct (12 vs. 13–14, respectively). The differences in the metrical data for body [114–184 vs. 103–124 (115)] and tail lengths [123–140 vs. 72–115 (92)] may be due to the different fixation methods. Karmanova (Reference Karmanova1974) did not indicate whether the measurements were taken from live or fixed cercariae.
Cercariae of E. bursicola were previously described by Karmanova (Reference Karmanova1973) from B. tentaculata collected in the Lower Volga, Russia. Although the method of fixation was not specified, the present cercariae differ from cercariae described by Karmanova (Reference Karmanova1973) by a shorter [110–132 (120) vs. 129–340, respectively] and narrower body [71–105 (88) vs. 104–110], shorter tail [83–101 (93) vs. 114–300] and the number of the refractile excretory granules per collecting duct (seven vs. six).
Cercariae of both Echinochasmus sp. 1 and Echinochasmus sp. 2 differ from cercariae of Echinochasmus sp. reported from Lithoglyphus naticoides (Pfeiffer, 1928), as described by Stanevičiūtė et al. (Reference Stanevičiūtė, Petkevičiūtė and Kiselienė2008) in Lithuania, by smaller dimensions for all morphological characters, in particular by smaller body (105–136 × 74–125 vs. 98–133 × 66–84 vs. 240–280 × 136–144) and much smaller tail (115–170 × 27–82 vs. 83–123 × 23–31 vs. 1120–1360 × 132), respectively.
Further identification of Echinochasmus sp. 1 and Echinochasmus sp. 2 to the species level requires the sequences of the adults from the definitive hosts, which are typically fish-eating birds and rarely mammals (Tkach et al., Reference Tkach, Kudlai and Kostadinova2016).
Systematics
Psilostomidae Looss, 1900
Sphaeridiotrema Odhner, 1913
Sphaeridiotrema sp.
First intermediate host. Bithynia tentaculata (L.) (Gastropoda: Bithyniidae).
Locality. River Rhine (R2), Germany.
Representative DNA sequences. 28S rDNA, one replicate (MN726949); nad1, one replicate (MN720149).
Description
Cercariae of Sphaeridiotrema sp. were found in one snail at Locality R2 in the River Rhine. The species of the cercariae was identified based on the results of molecular analyses. No morphological data were obtained for cercariae of this species.
Psilostomidae gen. sp. 1
First intermediate host. Bithynia tentaculata (L.) (Gastropoda: Bithyniidae).
Localities. River Lippe (K2), River Rhine (R1, R2), Germany; Curonian Lagoon (CB), Lithuania.
Representative DNA sequences. 28S rDNA, four replicates (MN726950–MN726953).
Description
(Measurements from 11 fixed specimens.) Gymnocephalous cercariae (fig. 5d). Body dark, elongate-oval, with maximum width at level of posterior margin of pharynx, 243–314 × 218–267 (273 × 239). Tegument thick, tegumental spines not observed. Collar and collar spines absent. Tail simple, muscular, contractile, 454–495 (476) long, with maximum width at base 72–82 (76), longer than body [tail/body length ratio 1:0.51–0.66 (1:0.57)]. Oral sucker subterminal, subspherical, muscular, 56–75 × 52–71 (65 × 63). Ventral sucker subspherical, just postequatorial, 58–82 × 68–82 (71 × 72). Oral/ventral sucker width ratio 1:0.89–1.26 (1:1.09). Prepharynx indistinct, pharynx subspherical, muscular, 17–22 × 14–22 (19 × 17). Caeca indistinct. Penetration gland-cells numerous, on both sides posterior to oral sucker. Cystogenous gland-cells numerous on both sides posterior to oral sucker. Main collecting ducts narrow, containing numerous small dark refractile excretory granules of similar size. Main collecting ducts forming small lobes with an accumulation of slightly larger excretory granules posterior to oral sucker. Excretory vesicle transversely oval, at posterior margin of body.
Psilostomidae gen. sp. 2
First intermediate host. Bithynia tentaculata (L.) (Gastropoda: Bithyniidae).
Locality. River Rhine (R2), Germany.
Representative DNA sequences. 28S rDNA, one replicate (MN726954).
Description
Cercariae of Psilostomidae gen. sp. 2 (fig. 5e) were found in one snail at Locality R2 in the River Rhine. Cercariae were identified based on the results of molecular analyses. No morphological data were obtained for cercariae of this species.
Remarks
To date, B. tentaculata was reported as the first intermediate host for six species of psilostomids from three genera: (i) Psilochasmus: Psilochasmus oxyurus (Creplin, 1825) in Poland (Wiśniewski, Reference Wiśniewski1958); (ii) Psilotrema: Psilotrema oligoon (Linstow, 1887) in the UK (Pike, Reference Pike1968), P. simillimum (Mühling, 1898) in Bulgaria (Samnaliev, Reference Samnaliev1981) and P. spiculigerum (Mühling, 1898) in Bulgaria, Russia, Ukraine and the UK (Zdun, Reference Zdun1961; Bykhovskaya-Pavlovskaya & Kulakova, Reference Bykhovskaya-Pavlovskaya and Kulakova1971; Frolova, Reference Frolova1975; Samnaliev et al., Reference Samnaliev, Kanev and Vasilev1977; Morley & Lewis, Reference Morley and Lewis2006); and (iii) Sphaeridiotrema: Sphaeridiotrema globulus (Rudolphi, 1814) in Bulgaria, Finland, Russia and the UK (Szidat, Reference Szidat1937; Selinheimo, Reference Selinheimo1956; Bykhovskaya-Pavlovskaya & Kulakova, Reference Bykhovskaya-Pavlovskaya and Kulakova1971; Kanev & Vasilev, Reference Kanev, Vasilev and Vasilev1984; Morley & Lewis, Reference Morley and Lewis2006) and Sphaeridiotrema sp. in Lithuania (Tkach et al., Reference Tkach, Kudlai and Kostadinova2016).
Sphaeridiotrema sp. in our material appeared to be conspecific to the species that was previously reported from Lithuania (Tkach et al., Reference Tkach, Kudlai and Kostadinova2016). Both isolates were identified only to the genus level and require sequences of adults from the definitive hosts (water birds), to complete identification to the species level.
General morphology of cercariae of Psilostomidae gen. sp. 1 resemble morphology of cercariae of P. oligoon described by Pike (Reference Pike1968), P. simillimum described by Samnaliev (Reference Samnaliev1981) and P. spiculigerum described by Bykhovskaya-Pavlovskaya & Kulakova (Reference Bykhovskaya-Pavlovskaya and Kulakova1971) and Samnaliev et al. (Reference Samnaliev, Kanev and Vasilev1977). However, cercariae of Psilostomidae gen. sp. 1 differ from cercariae of P. oligoon by wider body [218–267 (239) vs. 165–235 (196)], longer tail [454–495 (476) vs. 261–461 (370)] and smaller pharynx [length: 17–22 (19) vs. 30–45 (39); width: 14–22 (17) vs. 22–39 (29)]; and from cercariae of P. simillimum by larger body [length: 243–314 (273) vs. 150–208 (178); width: 218–267 (239) vs. 92–135 (109)], larger oral [length: 56–75 (65) vs. 30–48 (38); width: 52–71(63) vs. 30–45 (37)] and ventral suckers [length: 68–82 (72) vs. 25–40 (32); width: 58–82 (71) vs. 28–40 (31)] and larger tail [length: 454–495 (476) vs. 288–350 (333); width: 72–82 (76) vs. 38–55 (46)]. Cercariae of Psilostomidae gen. sp. 1 differ from P. spiculigerum described by Bykhovskaya-Pavlovskaya & Kulakova (Reference Bykhovskaya-Pavlovskaya and Kulakova1971) in having larger low limits for body width (218–267 vs. 165–249), tail length (454–495 vs. 388–499), tail width (72–82 vs. 52–78), smaller low and high limits for oral sucker width (52–71 vs. 65–78) and smaller pharynx [length: 17–22 vs. 44–49; width: 14–22 vs. 26–39]. It also differs from P. spiculigerum described by Samnaliev et al. (Reference Samnaliev, Kanev and Vasilev1977) by larger body [length: 243–314 (273) vs. 204–242 (221); width: 218–267 (239) vs. 130–155 (138)], larger oral [length: 56–75 (65) vs. 50–62 (53); width: 52–71 (63) vs. 56–62 (56)] and ventral suckers [length: 68–82 (72) vs. 34–50 (41); width: 58–82 (71) vs. 37–56 (45)], smaller pharynx [length: 17–22 (19) vs. 19–31 (23); width: 14–22 (17) vs. 25–31 (28)] and larger tail [length: 454–495 (476) vs. 324–342 (336); width: 72–82 (76) vs. 43–56 (49)]. The above comparisons demonstrate that Psilostomidae gen. sp. 1 may represent a species of the genus Psilotrema, but is not conspecific with P. oligoon, P. simillimum or P. spiculigerum. Further identification of Psilostomidae gen. sp. 1 and Psilostomidae gen. sp. 2 to the species level requires the sequences of the adults from the definitive hosts, which are mainly birds and mammals (Kostadinova, Reference Kostadinova, Jones, Bray and Gibson2005).
Systematics
Superfamily: Monorchioidea Odhner, 1911
Lissorchiidae Magath, 1917
Asymphylodora Looss, 1899
Asymphylodora sp.
First intermediate host. Bithynia tentaculata (L.) (Gastropoda: Bithyniidae).
Locality. River Lippe (K3), Germany.
Representative DNA sequences. 28S rDNA, one replicate (MN726955).
Molecular results
Cercariae of Asymphylodora sp. were found in one snail in the River Lippe (prevalence: 0.2%). Partial 28S rDNA sequences were generated from one isolate (table 2). The partial 28S rDNA sequence for Asymphylodora sp. obtained in the present study was compared to the sequences of Asymphylodora perccotti Besprozvannykh, Ermolenko & Atopkin, 2012 (FR822715−FR822731) ex Perccottus glenii Dybowski, 1877 from Russia (Besprozvannykh et al., Reference Besprozvannykh, Ermolenko and Atopkin2012), the only sequences for this genus currently available in GenBank. The sequence divergence between our isolate and 17 isolates for A. perccotti ranged between 2.7% and 2.8% (31−32 nt).
Description
The species of the cercariae was identified based on the results of molecular data. No morphological data were obtained for cercariae of this isolate.
Systematics
Superfamily: Pronocephaloidea Looss, 1899
Notocotylidae Lühe, 1909
Molecular results
Infection with the cercariae of the family Notocotylidae was detected in nine snails from four localities in the River Lippe (prevalence: 1.5%). Partial 28S rDNA sequences were generated for four isolates (fig. 6; table 2) and aligned with 16 sequences for species of the Notocotylidae available in GenBank (supplementary table S1). Members of the families Opisthotrematidae, Rhabdiopoeidae and Labicolidae were used as the outgroup based on the topologies in the phylogenetic tree of the Digenea published by Olson et al. (Reference Olson, Cribb, Tkach, Bray and Littlewood2003). The results of phylogenetic analyses demonstrated that two isolates preliminarily identified as Notocotylus sp. (N11K0 and N12K0) clustered within a clade comprising Notocotylus spp., demonstrating the close affinity to the isolate of Notocotylus attenuatus (Rudolphi, 1809) (AF184259), the type species of the genus Notocotylus, collected from Aythya ferina in Ukraine (Tkach et al., Reference Tkach, Snyder and Świderski2001). Sequences for two isolates of Notocotylus sp. from our study were identical and differed from N. attenuatus by 0.4% (3 nt). The sequences for two other notocotylid isolates (N2K0 and N2K2b) from B. tentaculata collected in the River Lippe were identical and formed a basal branch to the clade consisting of Notocotylus spp. and Catatropis spp., albeit without support (fig. 6). The taxonomic identity of these two isolates was not justified based on the phylogenetic analyses and we, thus, provide the identification for this species only to the family level, as Notocotylidae gen. sp. The sequence divergence between two notocotylid species recorded in our study was 2.9% (23 nt).
Phylogenetic tree for Notocotylidae based on the partial sequences of the 28S rRNA gene. Numbers above branches indicate nodal support as posterior probabilities from the Bayesian inference (BI), followed by bootstrap values from the maximum likelihood (ML) analysis. Support values lower than 0.90 (BI) and 70 (ML) are not shown. The scale bar indicates the expected number of substitutions per site. The newly generated sequences are highlighted in bold.

Systematics
Notocotylus Diesing, 1839
Notocotylus sp.
First intermediate host. Bithynia tentaculata (L.) (Gastropoda: Bithyniidae).
Locality. River Lippe (K4), Germany.
Representative DNA sequences. 28S rDNA, two replicates (MN726956, MN726957).
Description
No morphological data were obtained for cercariae of these isolates since the infections were prepatent.
Notocotylidae gen. sp
First intermediate host. Bithynia tentaculata (L.) (Gastropoda: Bithyniidae).
Localities. River Lippe (K3, K4), Germany.
Representative DNA sequences. 28S rDNA, two replicates (MN726958, MN726959).
Description
No morphological data were obtained for cercariae of these isolates since the infections were prepatent.
Remarks
Members of the family Notocotylidae are reported to utilize lymnaeids, planorbids and a variety of other snail families in their life cycles (Filimonova, Reference Filimonova1985). To date, six species – namely, N. attenuatus, N. ponticus, N. parviovatus, N. imbricatus, Notocotylus sp. and Catatropis verrucosa – were reported to develop in B. tentaculata in Europe (Bock, Reference Bock1982; Filimonova, Reference Filimonova1985 and references therein; Morley et al., Reference Morley, Adam and Lewis2004). Further identification of the two species collected from B. tentaculata in the River Lippe to the species level requires the sequences of adult worms from the definitive hosts, which are mammals and birds (Filimonova, Reference Filimonova1985).
Systematics
Superfamily: Allocreadioidea Looss, 1902
Opecoelidae Ozaki, 1925
Molecular results
Infection with cercariae of the family Opecoelidae was detected in 45 snails from four localities in the River Lippe (prevalence: 7.4%). Sequences for the partial 28S rDNA and ITS2 region were generated for six isolates (fig. 7; table 2). Comparative sequence analyses of 28S and ITS2 datasets revealed the presence of two species of the family Opecoelidae in our material. Five sequences of partial 28S rRNA gene (table 2) were aligned with seven GenBank sequences for species of the Opecoelidae known to parasitize freshwater fish (supplementary table S1). A species of the Opecoelidae, Buticulotrema thermichthysi Bray, Waeschenbach, Dyal, Littlewood & Morand, 2014, was used as the outgroup based on the topologies in the phylogenetic tree of the Opecoelidae published by Martin et al. (Reference Martin, Huston, Cutmore and Cribb2019). The results of the phylogenetic analyses demonstrated a close affinity of the four isolates (O11K2a, O1K1, O1K2b and O13K2a) with Sphaerostoma bramae (Müller, 1776) (MH161435) collected from Abramis brama in Russia (Sokolov et al., Reference Sokolov, Shchenkov and Gordeev2019). The sequences for our isolates were identical and differed from the sequence of S. bramae by 0.2% (3 nt), which is considered as interspecific variation and, thus, this species was identified as Sphaerostoma sp. The intraspecific divergence between the isolates of Sphaerostoma sp. (O11K2a, O1K1, O1K2b and O12K2a) within the ITS2 dataset was 0.2% (1 nt).
Phylogenetic tree for Opecoelidae based on the partial sequences of the 28S rRNA gene. Numbers above branches indicate nodal support as posterior probabilities from the Bayesian inference (BI), followed by bootstrap values from the maximum likelihood (ML) analysis. Support values lower than 0.90 (BI) and 70 (ML) are not shown. The scale bar indicates the expected number of substitutions per site. The newly generated sequences are highlighted in bold.

The remaining isolate (O2K2a) collected in the River Lippe, representing a second opecoelid species in our material, formed a branch basal to a clade consisted of Sphaerostoma spp. and Plagiocirrus spp. The 28S rDNA sequence of this species differed from the sequence of Sphaerostoma sp. by 5.9% (71 nt), from S. bramae by 5.6% (68 nt) and from Plagiocirrus spp. by 7.1–7.2% (85–87 nt), whereas the ITS2 sequence differed from the sequence of Sphaerostoma sp. by 4.7–4.9% (21–22 nt). Based on the results, we identified this species only to the family level as Opecoelidae gen. sp.
Sphaerostoma sp.
First intermediate host. Bithynia tentaculata (L.) (Gastropoda: Bithyniidae).
Localities. River Lippe (K1, K2, K3), Germany.
Representative DNA sequences. 28S rDNA, four replicates (MN726960–MN726963); ITS2, four replicates (MN726988–MN726991).
Description
(Measurements from ten fixed specimens.) Microcercous cercariae (fig. 8a, b). Body colourless, elongate-oval, 207–285 × 110–132 (246 × 118), with maximum width at level just anterior to ventral sucker. Tegument thick, smooth. Tail reduced to small stump (cotylocercous), 22–42 (28) long with maximum width at base, 35–42 (40). Posterior half of the tail comprising glandular structures. Oral sucker large, subterminal, muscular, subspherical, 39–53 × 42–60 (49 × 50) armed with a small, simple stylet, 6–12 × 2–4 (8 × 3) dorsal to mouth opening. Ventral sucker subspherical, equatorial, 53–79 × 60–69 (68 × 64), larger than oral sucker, opening surrounded by one row of minute spines. Oral/ventral sucker width ratio 1:1.08–1.61 (1:1.39). Prepharynx long, pharynx distinct, elongate-oval, 20–25 × 15–19 (22 × 17). Caeca indistinct. Cystogenous gland-cells numerous, widespread throughout body. Four pairs of small penetration gland-cells, at level of prepharynx. Excretory vesicle broader anteriorly, heart-shaped.
Photomicrographs of live cercariae of the trematode families Opecoelidae, Opisthorchiidae and Lecithodendriidae. (a) Sphaerostoma sp.; (b) Sphaerostoma sp., stylet; (c) Opisthorchiidae gen. sp.; (d) Lecithodendrium linstowi.

Opecoelidae gen. sp.
First intermediate host. Bithynia tentaculata (L.) (Gastropoda: Bithyniidae).
Locality. River Lippe (K2), Germany.
Representative DNA sequences. 28S rDNA, one replicate (MN726964); ITS2, one replicate (MN726992).
Description (no photomicrograph available)
No morphological data were obtained for cercariae of this isolate since the infections were prepatent.
Remarks
To date, one species of the Opecoelidae, S. bramae, has been reported in B. tentaculata in Europe: in Denmark (as Cercaria micrura; Wesenberg-Lund, Reference Wesenberg-Lund1934), Finland (Wikgren, Reference Wikgren1956), Lithuania (Petkevičiūtė et al., Reference Petkevičiūtė, Stanevičiūtė and Kiselienė1995), the Netherlands (as C. micrura; Keulen, Reference Keulen1981), Russia (as C. micrura; Bykhovskaya-Pavlovskaya & Kulakova, Reference Bykhovskaya-Pavlovskaya and Kulakova1971), Ukraine (as C. micrura; Zdun, Reference Zdun1961) and the UK (Pike, Reference Pike1967). Comparative sequence analysis suggested Sphaerostoma sp. of the present study to be close but not conspecific with S. bramae. Morphology of cercariae of Sphaerostoma sp. corresponds well to cercariae of S. bramae described by Wikgren (Reference Wikgren1956), Wesenberg-Lund (Reference Wesenberg-Lund1934), Pike (Reference Pike1967) and Bykhovskaya-Pavlovskaya & Kulakova (Reference Bykhovskaya-Pavlovskaya and Kulakova1971). However, our cercariae differ from cercariae of S. bramae as described by Wesenberg-Lund (Reference Wesenberg-Lund1934) by lower maximum of the body length (207–285 vs. 255–450), body width (110–132 vs. 85–135) and shorter tail [22–42 (28) vs. 45–50]; and from cercariae as described by Pike (Reference Pike1967) by shorter body [207–285 (246) vs. 261–418 (299)] and smaller oral [39–53 (49) × 42–60 (50) vs. 54–61 (57) × 50–59 (55)] and ventral suckers [53–79 (68) × 60–69 (64) vs. 63–81 (68) × 68–84 (73)]. Further identification of Sphaerostoma sp. and Opecoelidae gen. sp. to the species level requires the sequences of the adults from the definitive hosts, freshwater fish.
Systematics
Superfamily: Opisthorchioidea Looss, 1899
Opisthorchiidae Looss, 1899
Molecular results
Cercariae of the family Opisthorchiidae were found in one snail in the River Lippe (prevalence: 0.2%). A partial 28S rDNA sequence was generated for one isolate (fig. 2b; table 2) and aligned with sequences of seven species belonging to the family Opisthorchiidae available in GenBank (supplementary table S1). Apophallus zalophi Price, 1932 (Heterophyidae) was used as the outgroup based on the topologies in the phylogenetic tree of the Opisthorchioidea published by Hernández-Orts et al. (Reference Hernández-Orts, Georgieva, Landete and Scholz2019). In phylogenetic analyses of the Opisthorchiidae (fig. 2b), the novel sequence formed a branch at a basal position in the low supported clade consisting of Opisthorchis spp., Clonorchis sinensis (Cobbold, 1875) and unidentified species of Metorchis. Within this clade, our isolate demonstrated the lowest level of sequence divergence relative to the isolate of Metorchis ussuriensis (KY075777) (0.8%, 9 nt) and the highest level of divergence to the isolate of Opisthorchis sp. (MF110001) (2.3%, 25 nt). Based on the results of molecular analyses, cercariae were identified to the family level as Opisthorchiidae gen. sp.
Opisthorchiidae gen. sp.
First intermediate host. Bithynia tentaculata (L.) (Gastropoda: Bithyniidae).
Locality. River Lippe (K3), Germany.
Representative DNA sequences. 28S rDNA, one replicate (MN726966).
Description (fig. 8c)
(Measurements from 11 fixed specimens.) Pleurolophocercariae (fig. 8c) with elongate-oval body 143–191 × 89–118 (169 × 101), with brown pigment. Tegument thick with minute spines in anterior part. Tail simple, longer than body, 437–494 (459) × 24–40 (33) with dilatation in anterior part and conspicuous finfold present in the posterior two thirds of tail, with maximum width 11–22 (16). Tail/body length ratio 1:0.31–0.42 (1:0.37). Crescent-shaped eye-spots two, with black pigment, large, 13–18 (15) long and maximum width 7–10 (9), mediolateral at level of prepharynx. Oral sucker subterminal, subspherical, 29–39 × 28–36 (34 × 33). Ventral sucker inconspicuous, rudimentary, subspherical 13–25 × 11–23 (19 × 17), smaller than oral sucker. Oral/ventral sucker width ratio 1:0.38–0.74 (1:0.56). Cystogenous gland-cells large, nucleated, posterior to eye-spots. Preacetabular penetration gland-cells six pairs, with long ducts, dilated anteriorly, opening at the anterior margin of oral sucker. Excretory vesicle thick-walled, transversely oval.
Remarks
Four species of the family Opisthorchiidae – Metorchis bilis (Braun, 1890), M. intermedius Heinemann, Reference Heinemann1937, M. xanthosomus (Creplin, 1846) and Metorchis sp. – have been reported from B. tentaculata in Europe (Zdun, Reference Zdun1961; Bykhovskaya-Pavlovskaya & Kulakova, Reference Bykhovskaya-Pavlovskaya and Kulakova1971; Cichy et al., Reference Cichy, Faltýnková and Żbikowska2011). Based on sequence data analyses, the present cercariae may belong to the genus Metorchis. Morphologically, cercariae collected from B. tentaculata in the River Lippe resemble cercariae of Metorchis intermedius Heinemann, Reference Heinemann1937 reported from the same snail host in the Curonian Lagoon by Bykhovskaya-Pavlovskaya & Kulakova (Reference Bykhovskaya-Pavlovskaya and Kulakova1971). However, cercariae in our material differ by having a larger body [143–191 (169) × 89–118 (101) vs. 135–170 × 78–81] and longer tail [437–494 (459) × 24–40 (33) vs. 350–390 × 26]. The present cercariae differ from Metorchis sp. as described by Zdun (Reference Zdun1961) by smaller body [143–191 × 89–118 (169 × 101) vs. 200–320 × 32–70] and oral sucker [29–39 × 28–36 (34 × 33) vs. 48 × 48].
Systematics
Superfamily: Microphalloidea Ward, 1901
Lecithodendriidae Lühe, 1901
Lecithodendrium Looss, 1896
Lecithodendrium linstowi (Dollfus, 1931)
Molecular results
Cercariae of L. linstowi were found in one snail in the River Lippe (prevalence: 0.2%). Sequences for the partial 28S rDNA and ITS2 region were generated for one isolate (table 2). Newly generated 28S rDNA sequence appeared identical to sequence of L. linstowi (AF151919) obtained from an adult collected from Nyctalus noctula in Ukraine (Tkach et al., Reference Tkach, Pawlowski and Mariaux2000) and sequence of L. linstowi (MF498821) obtained from cercariae from Radix balthica in the UK (Enabulele et al., Reference Enabulele, Lawton, Walker and Kirk2018). The sequence for ITS2 region from the present study showed 99% similarity to those of L. linstowi (JF784190 and KJ934792) from Pipistrellus pipistrellus in England (Lord et al., Reference Lord, Parker, Parker and Brooks2012) and N. noctula from Ukraine (Kudlai et al., Reference Kudlai, Stunženas and Tkach2015), and 94% similarity with the sequence of L. linstowi (MF498820) from R. balthica (Enabulele et al., Reference Enabulele, Lawton, Walker and Kirk2018).
First intermediate host. Bithynia tentaculata (L.) (Gastropoda: Bithyniidae).
Locality. River Lippe (K2), Germany.
Representative DNA sequences. 28S rDNA, one replicate (MN726965); ITS2, one replicate (MN726993).
Description
(Measurements from 11 fixed specimens.) Xiphidiocercariae (fig. 8d). Body colourless, elongate-oval, 118–148 × 67–85 (132 × 75). Tegument thin, covered with minute spines. Tail simple, 55–63 (64) long, with maximum width at base 16–23 (21), shorter than body. Tail/body length ratio 1:1.84–2.31 (1:2.06). Oral sucker subspherical, subterminal, muscular, 29–37 × 28–35 (33 × 30) armed with large stylet, 15–17 (16) long with maximum width at base 5–7 (6). Stylet with dilatation 1–2 (2). Virgula absent. Ventral sucker spherical, equatorial, 14–24 × 14–24 (19 × 18), smaller than oral sucker. Oral/ventral sucker width ratio 1:0.42–0.73 (1:0.58). Prepharynx indistinct, pharynx small, elongate-oval, 8–12 × 5–9 (10 × 7). Caeca indistinct. Penetration gland-cells three pairs, anterolateral to ventral sucker, filled with dark, granular secretory material. Excretory vesicle thin-walled, V-shaped.
Remarks
Digenean trematodes of the family Lecithodendriidae infect insectivorous vertebrates (most prominently bats, occasionally birds), using aquatic insect larvae as second intermediate hosts and usually snails of the group formerly known as ‘prosobranchia’ as first intermediate hosts (Enabulele et al., Reference Enabulele, Lawton, Walker and Kirk2018). However, cercariae of L. linstowi were also reported from R. auricularia collected in the Queen's River, England (Enabulele et al., Reference Enabulele, Lawton, Walker and Kirk2018). Adults were found in a wide range of bat species, e.g. Myotis daubentonii (Kuhl) in Germany (Gottschalk, Reference Gottschalk1970), in N. noctula (Schreber) in Ukraine (Tkach et al., Reference Tkach, Pawlowski and Mariaux2000; Kudlai et al., Reference Kudlai, Stunženas and Tkach2015) and in P. pipistrellus (Schreber) in Spain and the UK (Esteban et al., Reference Esteban, Amengual and Cobo2001; Lord et al., Reference Lord, Parker, Parker and Brooks2012). Morphology of cercariae found in our study corresponded well to the description of the cercariea of L. linstowi by Enabulele et al. (Reference Enabulele, Lawton, Walker and Kirk2018). However, the present cercariae differ in having a shorter body [78–116 (88) vs. 118–148 (132)] and smaller oral [19–14 (11) × 9–15 (11) vs. 29–37 (33) × 28–35 (30)] and ventral suckers [10–13 (11) × 8–14 (9) vs. 14–24 (19) × 14–24 (18)].
Systematics
Pleurogenidae Looss, 1899 and Prosthogonimidae Lühe, 1909
Molecular results
Infection with cercariae belonging to the families Pleurogenidae and Prosthogonomidae was detected in nine snails from three localities (prevalence: Pleurogenidae: River Lippe, 0.5%; River Rhine, 1.3%; Prosthogonomidae: River Lippe, 0.7%; River Rhine, 1.3%). Sequences for the partial 28S rDNA (n = 9) and ITS2 region (n = 8) were generated for the isolates from all localities (fig. 9; table 2). The 28S rDNA sequences were aligned with the sequences for pleurogenids (n = 13) and prosthogonomids (n = 5) available in GenBank. Two species of the family Microphallidae were used as the outgroup based on the topologies in the phylogenetic tree of the Microphalloidea published by Kanarek et al. (Reference Kanarek, Zaleśny, Sitko and Tkach2017) (fig. 9; supplementary table S1). Both BI and ML analyses yielded similar topology with two main clades corresponding to the Pleurogenidae and Prosthogonomidae. The sequence of the isolate (PBK2b) collected from the River Lippe (K3) appeared to be identical to the sequence of Parabascus duboisi ex M. daubentonii from Ukraine (AY220618) (Tkach et al., Reference Tkach, Littlewood, Olson, Kinsella and Swiderski2003). The isolate (PL2R1) collected from B. tentaculata in the River Rhine clustered with Leyogonimus polyoon (KY752116) from Fulica atra collected in Poland (Kanarek et al., Reference Kanarek, Zaleśny, Sitko and Tkach2017). The sequence divergence between two species was 2% (23 nt). This isolate was identified to the family level as Pleurogenidae gen. sp. 2. The two isolates (PL11K2a and PL12K2a) collected from the River Lippe (K2) clustered with pleurogenid species from the genera Brandesia, Candidotrema, Pleurogenes, Pleurogenoides and Prosotocus, and identified only to the family level as Pleurogenidae gen. sp. 1.
Phylogenetic tree for Pleurogenidae and Prosthogonimidae based on the partial sequences of the 28S rRNA gene (a) and the internal transcribed spacer 2 (ITS2) region (b). Numbers above branches indicate nodal support as posterior probabilities from the Bayesian inference (BI), followed by bootstrap values from the maximum likelihood (ML) analysis. Support values lower than 0.90 (BI) and 70 (ML) are not shown. The scale bar indicates the expected number of substitutions per site. The newly generated sequences are highlighted in bold.

The 28S rDNA sequences of the remaining five isolates (PO1K2b, PO2K2b, PO1R1, PO2R1 and POK2a) collected from the River Rhine (R1) and from the River Lippe (K2 and K3) were identical with the sequence of Prosthogonimus ovatus from Pica pica collected in Ukraine (AF151928) (Tkach et al., Reference Tkach, Pawlowski and Mariaux2000) (fig. 9b; supplementary table S1).
Sequences of the ITS2 region for pleurogenids and prosthogonomids obtained in this study were aligned with sequences of prosthogonomids available in GenBank (supplementary table S1). Sequences of the four isolates (PO1K2b, PO1R1, PO2R1 and POK2a) clustered with the sequence of P. ovatus (KP192722) from A. ferina collected in the Czech Republic (Heneberg et al., Reference Heneberg, Sitko and Bizos2015). The four remaining isolates (PBK2b, PL2R1, PL11K2a and PL12K2a) identified as the members of the family Pleurogenidae based on 28S rDNA analyses clustered within a nearly supported clade (fig. 9a).
Systematics
Pleurogenidae Looss, 1899
Parabascus Looss, 1907
Parabascus duboisi (Hurkova, 1961)
First intermediate host. Bithynia tentaculata (L.) (Gastropoda: Bithyniidae).
Locality. River Lippe (K3), Germany.
Representative DNA sequences. 28S rDNA, one replicate (MN726967); ITS2, one replicate (MN726994).
Description
No morphological data were obtained for cercariae of this isolate since the infection was prepatent.
Remarks
The life cycle of P. duboisi is unknown and our finding is the first to report B. tentaculata serving as the first intermediate host for this species. Parabascus duboisi is known to parasitize, among other bats, those of the genera Eptesicus, Miniopterus, Myotis, Pipistrellus and Rhinolophus (Sharpilo & Iskova, Reference Sharpilo and Iskova1989).
Pleurogenidae gen. sp. 1
First intermediate host. Bithynia tentaculata (L.) (Gastropoda: Bithyniidae).
Locality. River Lippe (K2), Germany.
Representative DNA sequences. 28S rDNA, two replicates MN726968, MN726969); ITS2, two replicates (MN726995, MN726996).
Description
(Measurements from ten fixed specimens.) Virgulate xiphidiocercariae (fig. 10a, b). Body colourless, oval, 82–115 × 69–94 (92 × 82). Tail simple, 41–48 (45) long with maximum width at base 14–20 (17), longer than body. Tail/body length ratio 1:1.82–2.56 (1:2.04). Oral sucker subterminal, elongate-oval, 32–40 × 21–28 (37 × 25), armed with small stylet 14–20 (16) long with maximum width 3–5 (4). Stylet in anterior part of oral sucker, with anterior dilatation of blade. Small pyriform virgula organ in posterior part of oral sucker. Ventral sucker subspherical, 14–19 × 11–16 (16 × 14), smaller than oral sucker. Oral/ventral sucker width ratio 1:0.38–0.51 (1:0.43). Prepharynx long, pharynx spherical, 8–11 × 7–10 (9 × 8). Caeca indistinct. Few medium-sized fat inclusions in body parenchyma. Cystogenous gland-cells numerous, widespread throughout body. Four pairs of penetration gland-cells, anterolateral to ventral sucker. Excretory vesicle thin-walled, Y-shaped.
Photomicrographs of live cercariae of the trematode families Pleurogenidae and Prosthogonomidae. (a) Pleurogenidae gen. sp. 1; (b) Pleurogenidae gen. sp. 1, stylet; (c) Pleurogenidae gen. sp. 2; (d) Pleurogenidae gen. sp. 2, virgula organ and stylet; (e) Prosthogonimus ovatus; (f) P. ovatus, stylet.
Pleurogenidae gen. sp. 2
First intermediate host. Bithynia tentaculata (L.) (Gastropoda: Bithyniidae).
Locality. River Rhine (R1), Germany.
Representative DNA sequences. 28S rDNA, one replicate (MN726970); ITS2, one replicate (MN726997).
Description
(Measurements from seven fixed specimens.) Virgulate xiphidiocercariae (fig. 10c, d). Body colourless, elongate oval, 120–154 × 77–109 (135 × 90). Tail simple, contractile, 77–150 (105) long with maximum width 21–27 (25), slightly longer than body. Body/tail length ratio 1:1.14–1.47 (1:1.10). Oral sucker subspherical, subterminal, 31–39 × 30–36 (35 × 33), armed with small stylet, 13–19 (16) long with maximum width 4–6 (5). Stylet in anterior part of oral sucker, with anterior dilatation of blade. Virgula organ large, bilobed, in posterior part of oral sucker. Ventral sucker subspherical, equatorial, 21–25 × 16–25 (23 × 21), smaller than oral sucker. Oral/ventral sucker width ratio 1:0.60–0.71 (1:0.66). Prepharynx long, pharynx distinct, close to virgula organ, oval, 10–12 × 12–16 (11 × 14). Caeca indistinct. Numerous small fat inclusions in body parenchyma. Penetration gland-cells four pairs, posterolateral to ventral sucker. Excretory vesicle thin-walled, Y-shaped.
Remarks
Bithynia tentaculata is known to be the intermediate hosts for three species of the Pleurogenidae – Pleurogenes claviger (Rudolphi, 1819), Pleurogenoides medians (Olsson, 1876) and Pleurogenoides sp. – in the Czech Republic (Ždárská, Reference Ždárská1963), Germany (Palm, Reference Palm1966), Lithuania (Bykhovskaya-Pavlovska & Kulakova, Reference Bykhovskaya-Pavlovskaya and Kulakova1971), Poland (Grabda-Kazubska, Reference Grabda-Kazubska1971), Russia (Frolova, Reference Frolova1975) and Ukraine (Zdun, Reference Zdun1961).
The cercariae of Pleurogenidae gen. sp. 1 and Pleurogenidae gen. sp. 2 show some distinctive features that distinguish the two species. Differences between cercariae of Pleurogenidae gen. sp. 1 and Pleurogenidae gen. sp. 2 comprise the size of body [body length: 82–115 (92) vs. 120–154 (135); width: 69–94 (82) vs. 77–109 (90), respectively], the size and shape of virgula (small pyriform vs. large bilobed), position of the penetration gland-cells (anterolateral to the ventral sucker vs. posterolateral to the ventral sucker), the length of tail [41–48 (45) vs. 77–150 (105)] and the width of tail [14–20 (17) vs. 21–27 (25)]. Both species possess distinct fat inclusions in the body parenchyma, which are medium-sized and low in numbers in Pleurogenidae gen. sp. 1 and small and numerous in Pleurogenidae gen. sp. 2.
The cercariae of both species in the present study differ from cercariae of P. claviger as described by Grabda-Kazubska (Reference Grabda-Kazubska1971), P. medians as described by Chernogorenko (Reference Chernogorenko1983) and Pleurogenoides sp. as described by Palm (Reference Palm1966) in having much smaller dimensions for all morphological characters.
Systematics
Prosthogonimidae Lühe, 1909
Prosthogonimus Lühe, 1899
Prosthogonimus ovatus Rudolphi, 1803
First intermediate host. Bithynia tentaculata (L.) (Gastropoda: Bithyniidae).
Localities. River Lippe (K2, K3), River Rhine (R1), Germany.
Representative DNA sequences. 28S rDNA, five replicates (MN726971–MN726975); ITS2, four replicates (MN726998–MN727001).
Description
(Measurements from 11 fixed specimens.) Xiphidio cercariae (fig. 10e, f). Body colourless, elongate-oval, 104–126 × 60–79 (115 × 69). Tail simple, 57–86 (72) long with maximum width 19–26 (23), shorter than body. Body/tail length ratio 1:1.44–1.75 (1:1.60). Oral sucker subspherical, subterminal, 23–35 × 20–33 (30 × 29) armed with small stylet, 14–20 (18) long with maximum width 4–6 (5). Stylet in anterior part of oral sucker with thickening and incomplete wall at basis and anterior dilatation of blade. Ventral sucker subspherical, equatorial, 18–32 × 17–30 (22 × 20), smaller than oral sucker. Oral/ventral sucker width ratio 1:0.60–1.07 (1:0.73). Prepharynx indistinct. Pharynx spherical, muscular, 7–11 × 6–10 (9 × 8). Caeca indistinct. Four pairs of large, overlapping conspicuous penetration gland-cells anterior to ventral sucker. Excretory vesicle thin-walled, Y-shaped.
Remarks
Three species of Prosthogonimus – namely, P. cuneatus, P. ovatus and Prosthogonimus sp. – have been reported to parasitize B. tentaculata in Europe: in the Netherlands (Boddeke, Reference Boddeke1960), Germany (Palm, Reference Palm1966), Lithuania (Bykhovskaya-Pavlovskaya & Kulakova, Reference Bykhovskaya-Pavlovskaya and Kulakova1971), Russia (Ginetsinskaya & Dobrovolskij, Reference Ginetsinskaya and Dobrovolskij1968; Sharpilo & Iskova, Reference Sharpilo and Iskova1989; Serbina, Reference Serbina2005), Ukraine (Sergienko, Reference Sergienko1972; Sharpilo & Iskova, Reference Sharpilo and Iskova1989) and the UK (Probert, Reference Probert1965; Morley & Lewis, Reference Morley and Lewis2006). The morphology of cercariae found in our study corresponded well to the description of the cercariae of P. ovatus by Boddeke (Reference Boddeke1960). The only feature that differs in the present cercariae is the number of penetration gland-cell pairs (four vs. three). However, this difference might be due to a miscount in the previous description, as penetration gland-cells can be overlapping and hard to count.
Discussion
This study examined the parasite diversity in the faucet snail B. tentaculata in Central European fresh waters. To the best of our knowledge, this is the first broad faunistic survey investigating the trematode fauna in B. tentaculata in Central Europe and providing a combined morphological and molecular dataset. The study reveals a high trematode diversity of 20 species belonging to ten families and a high overall prevalence of infection of 12.9% in this snail host.
Not surprisingly, the larval trematode community of B. tentaculata shows little overlap with that of lymnaeids and planorbids, highlighting the distinctive host–parasite associations of pulmonate and non-pulmonate snails. Only one (L. linstowi) out of 20 species has also been recorded from lymnaeid and planorbid snail hosts (Enabulele et al., Reference Enabulele, Lawton, Walker and Kirk2018). Bithynids are the typical hosts of L. linstowi, and the single finding of this species in Radix sp. most probably represents an accidental infection. The species has only been reported in a single lymnaeid host, so it is reasonable to consider it as an accidental infection. Looking at the faunistic overlap of trematodes at the family level, we find a slightly different picture. Out of ten recorded families, six (Lecithodendriidae, Lissorchidae, Notocotylidae, Opecoelidae, Pleurogenidae, Psilostomidae) are also known to occur in lymnaeids and planorbids (Faltýnková et al., Reference Faltýnková, Našincová and Kablásková2007, Reference Faltýnková, Našincová and Kablásková2008, Reference Faltýnková, Sures and Kostadinova2016; Cichy et al., Reference Cichy, Faltýnková and Żbikowska2011; Enabulele et al., Reference Enabulele, Lawton, Walker and Kirk2018). On the other hand, species of the families Cyathocotylidae, Echinochasmidae, Prosthogonomidae and Opisthorchiidae seem to be strictly host-specific to non-pulmonate freshwater molluscs as first intermediate hosts. Some species, such as E. beleocephalus and E. coaxatus, have been recorded from B. tentaculata only in Russia (Frolova, Reference Frolova1975; Karmanova, Reference Karmanova1975), so our records constitute the first record for Central Europe.
Echinochasmus sp. 1 and Psilostomidae gen. sp. 1 are the only species that were both detected in Germany and Lithuania. The definitive hosts of echinochasmids and psilostimids are typically birds and mammals (Kostadinova, Reference Kostadinova, Jones, Bray and Gibson2005; Tkach et al., Reference Tkach, Kudlai and Kostadinova2016). Birds are especially mobile, so the occurrence of the two species in both countries can be easily explained by seasonal migration. However, since the sampling effort in Germany was much higher (682 vs. 121 B. tentaculata), we would expect more trematode species to be present in Curonian Lagoon, which our limited survey did not detect.
Overall, this diverse and distinctive trematode community of B. tentaculata, and the high prevalence of infection, reveal the important role of this snail species as a first intermediate host for trematodes in European freshwater ecosystems. Similar to other well-studied host–parasite systems, B. tentaculata supports a parasite community that presumably fulfils vital and central ecological functions, ranging from contributing to ecosystem diversity, structuring food webs or serving as ecosystem engineers (Thomas et al., Reference Thomas, Poulin, de Meeüs, Guégan, Renaud, Thomas, de Meeus, Guegan and Renaud1999; Mouritsen & Poulin, Reference Mouritsen and Poulin2002; Lafferty et al., Reference Lafferty, Allesina and Arim2008; Hatcher et al., Reference Hatcher, Dick and Dunn2012; Dunne et al., Reference Dunne, Lafferty and Dobson2013). Moreover, since parasites can also serve as indicators of the local diversity and trophic interactions of free-living organisms (Hechinger et al., Reference Hechinger, Lafferty, Huspeni, Brooks and Kuris2007; Byers et al., Reference Byers, Altman, Grosse, Huspeni and Maerz2010; Shea et al., Reference Shea, Kersten, Puccia, Stanton, Stiso, Helgeson and Back2012), the distinct trematode communities of B. tentaculata offer valuable insights into local habitat conditions.
One interesting example of the indication of local diversity and trophic interaction using digenean trematodes might be the detection of P. duboisi and L. linstowi. On the basis of our findings, we can infer the presence of bats in the studied habitat, as both are known to parasitize bats, e.g. the Daubenton's bat M. daubentonii (Gottschalk, Reference Gottschalk1970; Esteban et al., Reference Esteban, Amengual and Cobo2001; Tkach et al., Reference Tkach, Littlewood, Olson, Kinsella and Swiderski2003). The Daubenton's bat feeds on aquatic insects and insects with aquatic larvae, such as Lepidoptera, Diptera and Trichoptera, and it is, therefore, highly dependent on water sources. It hunts over standing or slow-moving water bodies and takes its prey from the water surface (Krapp, Reference Krapp2011 and references therein). Based on the finding of P. duboisi and L. linstowi, we are able to make inferences about the presence of bats at the studied habitat and the trophic relations between aquatic insects, which most probably serve as second intermediate hosts for the detected parasite species (Sharpilo & Iskova, Reference Sharpilo and Iskova1989; Kudlai et al., Reference Kudlai, Stunženas and Tkach2015; Enabulele et al., Reference Enabulele, Lawton, Walker and Kirk2018) and its final bat host.
The current study was limited by the lack of relevant sequences for many trematode families in GenBank. Consequently, a major proportion of our isolates could only be identified to the genus or family level. Moreover, the complete life cycle of many trematodes parasitizing B. tentaculata have not yet been elucidated (see Kudlai et al., Reference Kudlai, Stunženas and Tkach2015) and remain unclear. Such obstacles impede and exacerbate extensive studies on the diversity, the ecological role and the influence of digeneans on food webs. Therefore, it is important to extend and compile morphological data of cercariae also from non-pulmonate snails, obtain more molecular isolates of adult specimens to facilitate molecular identification and clarify the still unknown life cycles of many trematode species. The present study can be seen as an important step in compiling morphological and molecular data on the digenean parasite fauna of bithyniids. Among the 20 digenean species, we are able to present the characteristics (measurements and/or photomicrographs) for 14 taxa. With the present host–parasite list we hope to foster parasitological research on parasites of understudied snail families.
Taken together, our findings and the limitations we encountered demonstrate unambiguously that our knowledge of the studied parasite–host system remains limited and large-scale studies focussing on non-pulmonate freshwater snails are lacking. This fits the overall trend of a currently highly patchy research effort on parasite diversity, which not only prevents a full inventory of parasite biodiversity but also impedes predictions of their role in ecosystems (Jorge & Poulin,Reference Jorge and Poulin2018). Our study revealed an abundant and diverse trematode fauna in B. tentaculata, which highlights the need for further research on this host–parasite system. Therefore, we might currently be underestimating the ecological roles and impacts of parasite communities of non-pulmonate freshwater snails in European fresh waters. In order to fully comprehend the numerous and often central roles these parasites play in aquatic ecosystems, we need to better understand such understudied host–parasite systems.
Supplementary material
To view supplementary material for this article, please visit https://doi.org/10.1017/S0022149X19001093
Acknowledgements
We are grateful to Dakeishla Diaz Morales, Julian Enß, Lisa Fuchs, Katrin Honka, Thomas Hörren, Jenia Kremes, Lena Kusanke, Diana Michler, Louisa Rothe, Till Stempel, Sylvester Watzlawczyk, Laura Witthaus and Tim Zimara for their assistance during sampling and in the laboratory; Anna Faltýnková and Miroslava Soldánová for their help with preliminary species identification; Daniel Grabner for his help with extractions and PCR, Armin Lorenz, Kathrin Januschke and Thomas Hörren for their help with the selection of sampling sites, and Jonas Heidebrecht for his kind help with the figures. We would also like to thank Margret Bunzel-Drüke and Martin Brühne for their cooperation. We thank the anonymous reviewers for their constructive feedback.
Financial support
J.S. received a research grant from the University of Duisburg-Essen. O.K. was supported by the Claude Leon Foundation Postdoctoral Fellowship (2017‒2018). C.S. received a postdoctoral fellowship by the German Research Foundation (DFG, SE 2728/1-1 and SE 2728/2-1)and has received funding from the European Union’s Horizon 2020 research and innovation programme under the Marie Skłodowska-Curie grant agreement No. 839635 TPOINT. J.S.’s visit to South Africa for molecular analysis was, in part, funded through a National Research Foundation (NRF) of South Africa grant (NRF project GERM160623173784, grant number 105875, N.J. Smit, principal investigator). Any opinion, finding and conclusion or recommendation expressed in this publication is that of the authors and the NRF does not accept any liability in this regard.
Conflicts of interest
None.


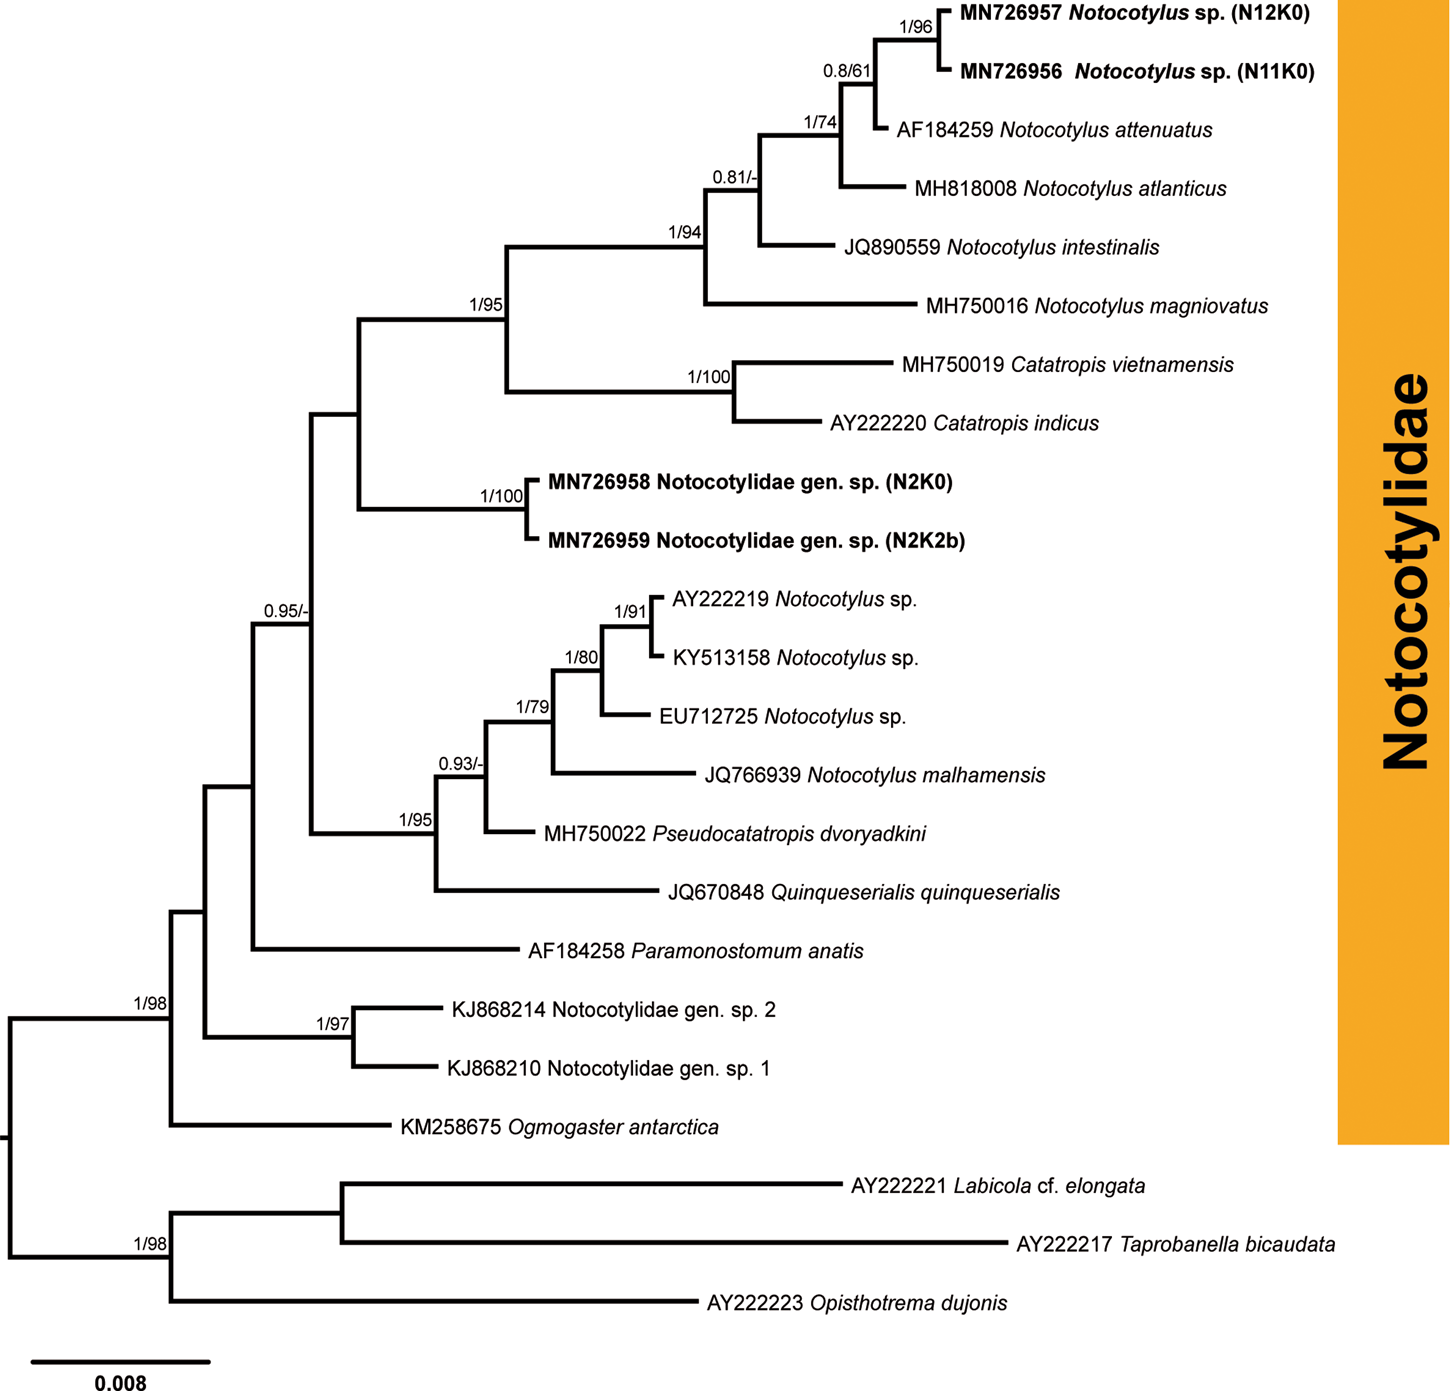


 Open access