1. Introduction
The star formation rate density (SFRD) quantifies the star formation rate (SFR) per unit volume at a given redshift and has been measured at a variety of wavelengths (e.g. UV, IR, optical emission lines). Previous SFRD measurements at radio wavelengths are qualitatively similar to SFRDs measured with UV and IR data (Madau & Dickinson Reference Madau and Dickinson2014, and references therein), although individual z ∼ 0 radio luminosity functions can differ from each other by a factor of 3 at low radio powers (e.g. Mauch & Sadler Reference Mauch and Sadler2007 and references therein). All measurements of the cosmic star formation history (CSFH) at z < 3 follow a broadly similar trend, with SFRD declining by a factor of roughly 20 since its peak at z ∼ 2.5. For individual galaxies, SFRs determined with different indicators can often differ by factors of 2 or more, and inconsistencies as large as a factor of 10 are not uncommon (e.g. Hopkins et al. Reference Hopkins2003). Consequently, achieving precise measurements of the CSFH with different SFR indicators requires large sample sizes to mitigate both cosmic variance and uncertainties on individual SFR measurements. At z < 1.5, recent measurements of the CSFH agree with each other to within ∼ 0.2 dex (Madau & Dickinson Reference Madau and Dickinson2014 and references therein).
By using radio data to measure the CSFH, it is possible to present a complementary view to the UV and IR surveys, which make up the bulk of high-z SFRDs (Madau & Dickinson Reference Madau and Dickinson2014). The advantage of radio observations is that they provide SFRs unbiased by dust but with the disadvantage of potentially including contamination from active galactic nuclei (AGNs). These AGNs have to be removed to measure a reliable radio SFRD, which can then be compared to SFRDs derived from other wavelengths and models.
The first attempts to calculate the CSFH from radio surveys used small samples of star-forming (SF) galaxies, due to the relatively shallow data and/or small survey areas available at the time, and thus these studies had large uncertainties. One of the first measurements of the radio CSFH, by Haarsma et al. (Reference Haarsma, Partridge, Windhorst and Richards2000), found that the SFRD has declined by an order of magnitude since z ∼ 1.6, but their best sample contained just 37 radio sources. Over the subsequent decade, the radio sample sizes increased, with Seymour et al. (Reference Seymour2008) measuring the CSFH with 269 z < 3 SF galaxies and Smolčić et al. (Reference Smolčić2009) using 340 z < 1.3 SF galaxies in the COSMOS field. The most recent study of the radio CSFH, by Novak et al. (Reference Novak2017), uses 5 806 z < 5.7 SF galaxies with 3-GHz flux densities from the VLA-COSMOS 3-GHz Large Project. Despite the large expansion in the sample sizes over the past two decades, the radio luminosity function and CSFH can still be adequately modelled with pure luminosity evolution (Novak et al. Reference Novak2017), as previously found by Hopkins (Reference Hopkins2004).
Previous measurements of the radio CSFH have largely used blind radio survey source catalogues. Such catalogues require conservative signal-to-noise (S/N) thresholds to avoid being swamped by large numbers of spurious sources. For example, searching images containing a total of 250 million pixels with an S/N threshold of 4 could produce as many as ∼ 8 000 false detections. As the number of spurious sources scales with the number of pixels, lower S/N thresholds can be used if one limits detections and measurements to positions of optically identified galaxies. This approach may be particularly useful for studies exploiting the new generation of deep radio continuum surveys in combination with optical galaxy surveys (e.g. Norris et al. Reference Norris2011; da Cunha et al. Reference da Cunha2017), enabling significant expansion of sample sizes. In this Letter, we utilise this approach to detect sources down to an S/N of 3 and to measure the CSFH.
We present the z < 1.3 CSFH measured by combining the COSMOS I < 26.5 object catalogue with the 1.4-GHz VLA-COSMOS survey. We exploit a combination of catalogued radio sources and new flux density measurements at the positions of optical galaxies to reliably measure 1.4-GHz flux densities as faint as S 1.4 = 40 μJy. We use AB magnitudes throughout, the Salpeter (Reference Salpeter1955) initial mass function (IMF), and adopt a flat nine-year WMAP cosmology with H 0 = 69.32 km s Mpc−1, ΩM = 0.29 and ΩΛ = 0.71 (Bennett et al. Reference Bennett2013). We assume that the radio synchrotron spectrum is approximated by Sν ∝ ν −0.7.
2. Sample
We selected our sample using a combination of COSMOS optical and radio catalogues. The main COSMOS optical catalogue is from Ilbert et al. (Reference Ilbert2015), and it contains over 2 million sources with I < 26.5. This was cross-matched to both the Lilly et al. (Reference Lilly2007) spectroscopic redshift catalogue and the COSMOS2015 photometric redshift catalogue (Laigle et al. Reference Laigle2016). When available, we use spectroscopic redshifts in preference to photometric redshifts.
Our principal radio catalogue is from the 1.4-GHz VLA-COSMOS survey (Schinnerer et al. Reference Schinnerer2010), which imaged 2 deg2 centred on 10:00:28.60 + 02:12:21.00 with an angular resolution of 2.5″. In the central 50′ × 50′, the depth is S 1.4 = 12 μJy RMS, increasing to an RMS of S 1.4 = 34 μJy at the edges. The accompanying source catalogue includes sources with S/N > 4σ. The VLA-COSMOS deep radio catalogue of Schinnerer et al. (Reference Schinnerer2010) does not include the suite of COSMOS multiwavelength data, so magnitudes and redshifts were obtained by finding the nearest cross-matches in the merged optical, spectroscopic redshift and photometric redshift catalogue.
If we exclude multicomponent sources from the Schinnerer et al. (Reference Schinnerer2010) radio catalogue, as they are likely to be AGNs, then we have 2 732 radio sources. When we match these 2 732 sources to the optical catalogue, we find that just 233 (9%) of the radio catalogue sources lack optical counterparts. For radio sources fainter than 100 μJy, we find the percentage without optical counterparts rises to just 11%. Using the Brown et al. (Reference Brown2017) nearby galaxy sample, we find SF galaxies have i-band to 1.4-GHz flux density ratios that range from 0.1 to 30, so we expect low redshift S 1.4 = 40 μJy SF galaxies to be brighter than i = 22.4. At z = 1.15 the i-band and 1.4 GHz correspond to u-band and 3.0 GHz, respectively, and we find the Brown et al. (Reference Brown2017) nearby galaxy sample u-band to 3.0-GHz flux density ratios range from 0.05 to 20, so we expect z ∼ 1.15 S 1.4 = 40 μJy SF galaxies to be brighter than i = 23.2. We thus conclude that the bulk of the radio sources without i < 26.5 optical counterparts are AGNs or z > 1.3 galaxies.
Our sample uses a combination of the Ilbert et al. (Reference Ilbert2015) optical catalogue and the VLA-COSMOS deep catalogue of Schinnerer et al. (Reference Schinnerer2010), supplemented by 1.4-GHz flux densities measured at the positions of the optical galaxies. For every optical galaxy we measured a 1.4-GHz flux density per beam using the pixel in the VLA-COSMOS images that corresponds to the optical position, although we only use this flux density if a match to the Schinnerer et al. (Reference Schinnerer2010) catalogue is unavailable. (This assumes we are mostly observing radio point sources, which is a reasonable approximation for SF galaxies across the bulk of our redshift range, as 2.5″ corresponds to 8.3 kpc at z = 0.2.) For the subsequent analyses, we retain galaxies with 1.4-GHz S/N > 3σ and S 1.4 ≥ 40 μJy measured in the Schinnerer et al. (Reference Schinnerer2010) catalogue and/or measured directly from the VLA-COSMOS images.
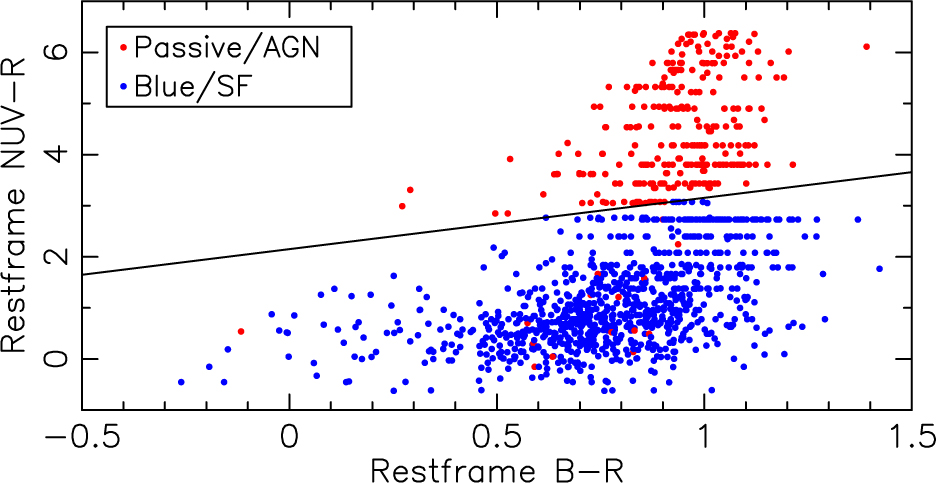
To measure the radio CSFH, we selected a sample of z < 1.3 SF galaxies with radio flux densities above 3σ, using regions that have two or more VLA pointings in the VLA-COSMOS survey (Figure 2 from Schinnerer et al. Reference Schinnerer2010). Radio sources with S 1.4 > 50 mJy that cause artefacts in the VLA-COSMOS deep image were identified and all the galaxies in these regions were removed. This reduces our central area, where the depth is S 1.4 = 40 μJy, to 0.72 deg2, while our (shallower) total area is 0.96 deg2. We also visually cross-checked close pairs of radio sources and removed instances of single sources being spuriously identified as multiple objects. We then split our sample into SF galaxies and AGNs using the passive galaxy colour criterion illustrated in Figure 1 and a modified Stern et al. (Reference Stern2005) infrared AGN selection criterion (that does not cut into the galaxy locus). This leaves us with a sample containing 918 z < 1.3 SF galaxies, of which 374 were not contained within the Schinnerer et al. (Reference Schinnerer2010) VLA-COSMOS deep catalogue. Of the 918 z < 1.3 SF galaxies with S 1.4 > 40 μJy, 883 (96%) are brighter than I = 25, consistent with incompleteness due to our I = 26.5 magnitude limit being negligible.
The restframe colours of our final sample of 1 218 radio-selected galaxies, illustrating the loci of SF and passive galaxies. We use the empirical criterion shown above in combination with a modified Stern et al. (Reference Stern2005) mid-infrared wedge to split the sample into 918 SF galaxies and 300 AGNs. (Some quantisation and aliasing of the absolute magnitudes is an artefact from the COSMOS2015 photometric redshift catalogue.)
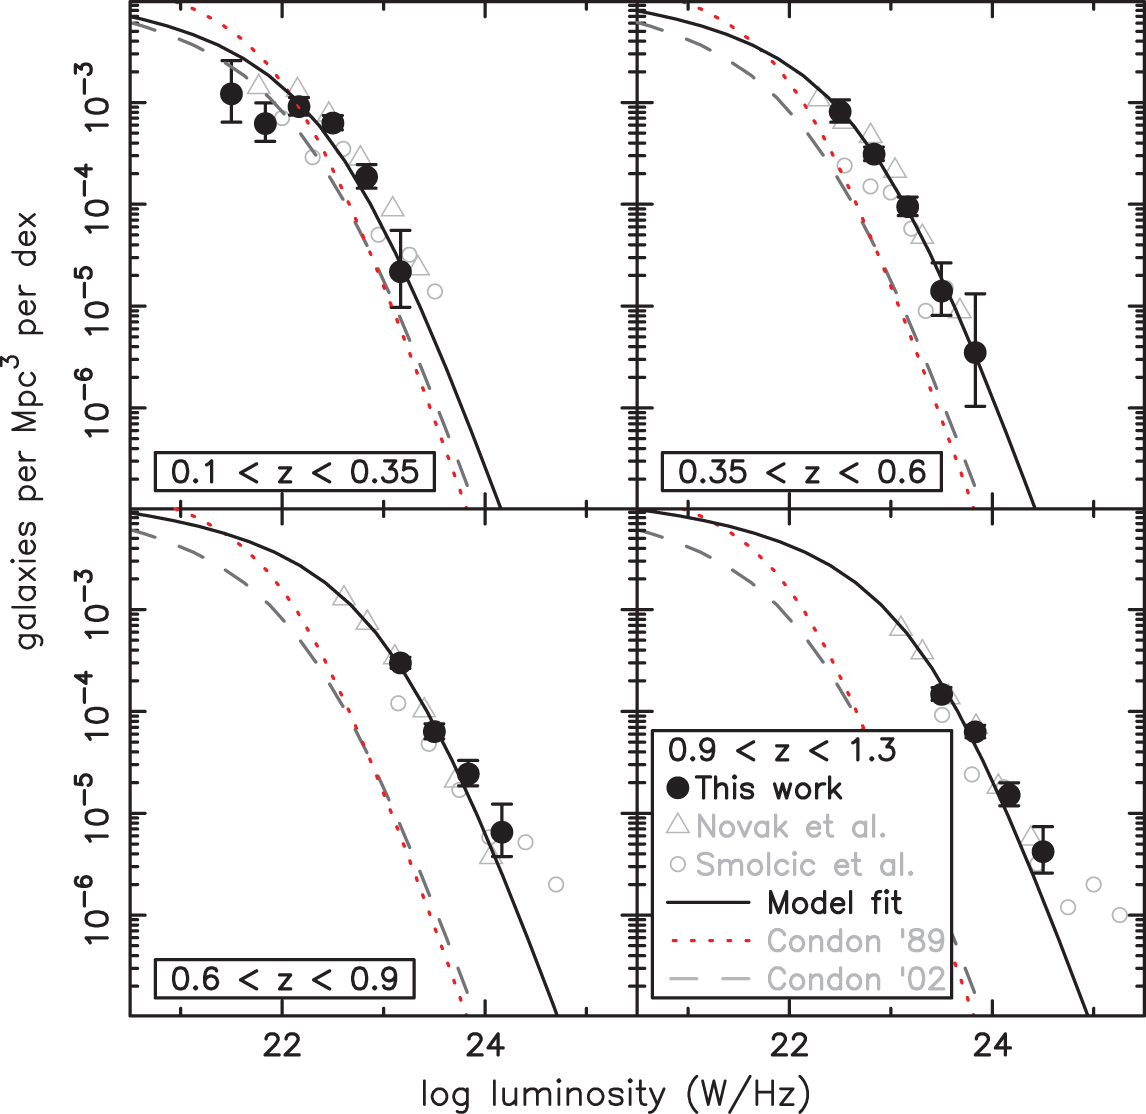
1.4-GHz luminosity functions of star forming galaxies. The dashed line is the Condon, Cotton, & Broderick (Reference Condon, Cotton and Broderick2002) local luminosity function, while the solid line is this function fitted to our data under the assumption of pure luminosity evolution. The red dotted line is the deprecated Condon (Reference Condon1989) local luminosity function, which overestimates the number of galaxies at low radio luminosities. We measure a higher space density of low luminosity galaxies than Smolčić et al. (Reference Smolčić2009), but are in agreement with the deeper 3-GHz measurements of Novak et al. (Reference Novak2017).
Photometric redshift uncertainties for 23 < I < 24 z ∼ 1 SF galaxies are 4.4% (Laigle et al. Reference Laigle2016), which propagate through to individual radio powers having uncertainties of 9% (while brighter SF galaxies have smaller uncertainties). We use spectroscopic redshifts in preference to photometric redshifts when possible, and they are available for 37% of the I < 22 SF galaxies.
3. The 1.4-GHz radio luminosity function
We have measured the radio luminosity function for four different redshift bins using the standard 1/V max method (Schmidt Reference Schmidt1968). To achieve this, our sample was split into four redshift ranges (0.1 ≤ z < 0.35, 0.35 ≤ z < 0.6, 0.6 ≤ z < 0.9 and 0.9 ≤ z < 1.3) and then into bins of 1/3 dex in luminosity. Luminosity limits and survey volumes are constrained by the flux density limits of S 1.4 = 40 μJy for the central region and S 1.4 = 60 μJy for the outer 350″. To keep the sample complete, these flux limits were taken into account when calculating the redshift range, effective area and resulting V max for each bin. As a result, of the 918 SF galaxies in our sample, 463 meet our area and redshift dependent luminosity criteria.
In Figure 2 and Table 1, we present the 1.4-GHz luminosity functions for our four redshift bins, including uncertainties determined using Poisson statistics (e.g. Gehrels Reference Gehrels1986). However, we caution that for the inner region of the sample the 0.10 < z < 0.14 and 0.10 < z < 0.20 redshift slices have cosmic variance uncertainties of 74% and 43%, respectively (determined with the method of Driver & Robotham Reference Driver and Robotham2010). For comparison, in Figure 2 we also show the VLA-COSMOS 1.4 and 3.0-GHz luminosity functions previously measured by Smolčić et al. (Reference Smolčić2009) and Novak et al. (Reference Novak2017), adopting a spectral index of −0.7 for frequency conversions. Compared to the Smolčić et al. (Reference Smolčić2009), 1.4-GHz luminosity functions, we find higher space densities at all but the very highest radio luminosities. This is expected, as 41% of our SF galaxies were not included in the VLA-COSMOS radio source catalogue of Schinnerer et al. (Reference Schinnerer2010). We find better agreement with the recent luminosity functions of Novak et al. (Reference Novak2017), who also measure higher space densities than Smolčić et al. (Reference Smolčić2009), using a sample selected from 3-GHz imaging of the COSMOS field (with an RMS of S 3.0 = 2.3 μJy per beam).
1.4 GHz radio luminosity functions for VLA-COSMOS star forming galaxies.
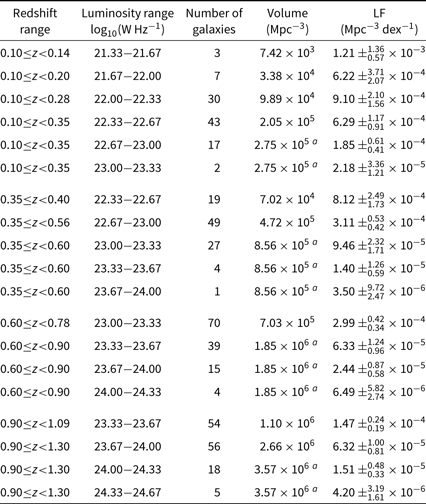
a This volume includes the outer region with the shallower flux density limit.
To model the luminosity function, we use the models of Condon (Reference Condon1989) and Condon et al. (Reference Condon, Cotton and Broderick2002) with pure luminosity evolution added. Our preferred model is Condon et al. (Reference Condon, Cotton and Broderick2002), which is based on the luminosity function determined with 1966 mp < 14.5 galaxies from the Uppsala General Catalogue (Nilson Reference Nilson1973) with counterparts in the NRAO VLA Sky Survey (Condon et al. Reference Condon, Cotton, Greisen, Yin, Perley, Taylor and Broderick1998). However, we also make use of the Condon (Reference Condon1989) model as it has been used by other studies during the past decade, including Smolčić et al. (Reference Smolčić2009), and it illustrates the impact of model assumptions on our results and those from the literature. The dashed lines in Figure 2 illustrate the z = 0 Condon et al. (Reference Condon, Cotton and Broderick2002) luminosity function, while the solid lines show fits of the Condon et al. (Reference Condon, Cotton and Broderick2002) model to our data under the assumption of pure luminosity evolution. When we approximate the observed luminosity evolution with L(z) ∝ (1+z)Q, we find Q = 2.90 ± 0.07.
4. The cosmic star formation history
To measure the SFRD and CSFH, we first determined each galaxy’s SFR using the 1.4-GHz radio luminosity and the calibration of Bell (Reference Bell2003):
 \begin{equation}
\psi[{\rm M}_{\odot}{\rm yr}^{-1}]=\left\{\begin{array}{cc}
5.52\times10^{-22}L_{1.4{\rm GHz}}, & L_{1.4{\rm GHz}} \gt L_c\\
\frac{5.52\times10^{-22}}{0.1\,+\,0.9(L_{1.4{\rm GHz}}/L_c)^{0.3}}L_{1.4{\rm GHz}}, & L_{1.4{\rm GHz}}\leq L_c
\end{array}\right.
\end{equation}
\begin{equation}
\psi[{\rm M}_{\odot}{\rm yr}^{-1}]=\left\{\begin{array}{cc}
5.52\times10^{-22}L_{1.4{\rm GHz}}, & L_{1.4{\rm GHz}} \gt L_c\\
\frac{5.52\times10^{-22}}{0.1\,+\,0.9(L_{1.4{\rm GHz}}/L_c)^{0.3}}L_{1.4{\rm GHz}}, & L_{1.4{\rm GHz}}\leq L_c
\end{array}\right.
\end{equation}
where Lc = 6.4 × 10²¹ W Hz−1. This SFR calibration has been used by both Smolčić et al. (Reference Smolčić2009) and Novak et al. (Reference Novak2017), and is comparable to recent calibrations by Boselli et al. (Reference Boselli, Fossati, Gavazzi, Ciesla, Buat, Boissier and Hughes2015) and Brown et al. (Reference Brown2017) for <L* galaxies. We then used the 1/V max method (Schmidt Reference Schmidt1968), with the SFR divided by the volume in which the galaxy could be detected, to find the SFRD contribution for each galaxy. The sum of each detected galaxy’s contribution to the SFRD gives a lower limit to the SFRD, as it does not include SF galaxies fainter than our radio flux limits. These lower limits for the CSFH are shown with arrows in Figure 3.
Our measurements of the CSFH, along with UV, IR, 3-GHz and 1.4-GHz measurements from the recent literature (Smolčić, et al. Reference Smolčić2009; Cucciati et al. Reference Cucciati2012; Gruppioni et al. Reference Gruppioni2013; Novak et al. Reference Novak2017). For clarity, we do not show random uncertainties as they are comparable to or smaller than the symbols. Our SFRD measurements include lower limits determined with the 1/V max method, estimates determined with fits of the deprecated Condon (Reference Condon1989) model and estimates determined with fits of the preferred Condon et al. (Reference Condon, Cotton and Broderick2002) model. Measurements of the z = 0 SFRD, determined with the radio luminosity functions of Condon (Reference Condon1989) and Condon et al. (Reference Condon, Cotton and Broderick2002), are shown with the orange symbols. Our best measurement of CSFH is in broad agreement with recent UV, IR and 3-GHz results, and can be extrapolated to agree with the z = 0 radio luminosity function of Condon et al. (Reference Condon, Cotton and Broderick2002). Pure luminosity evolution, shown with the black line, approximates our data well and indicates the SFRD has declined by a factor of ten since z = 1.1.
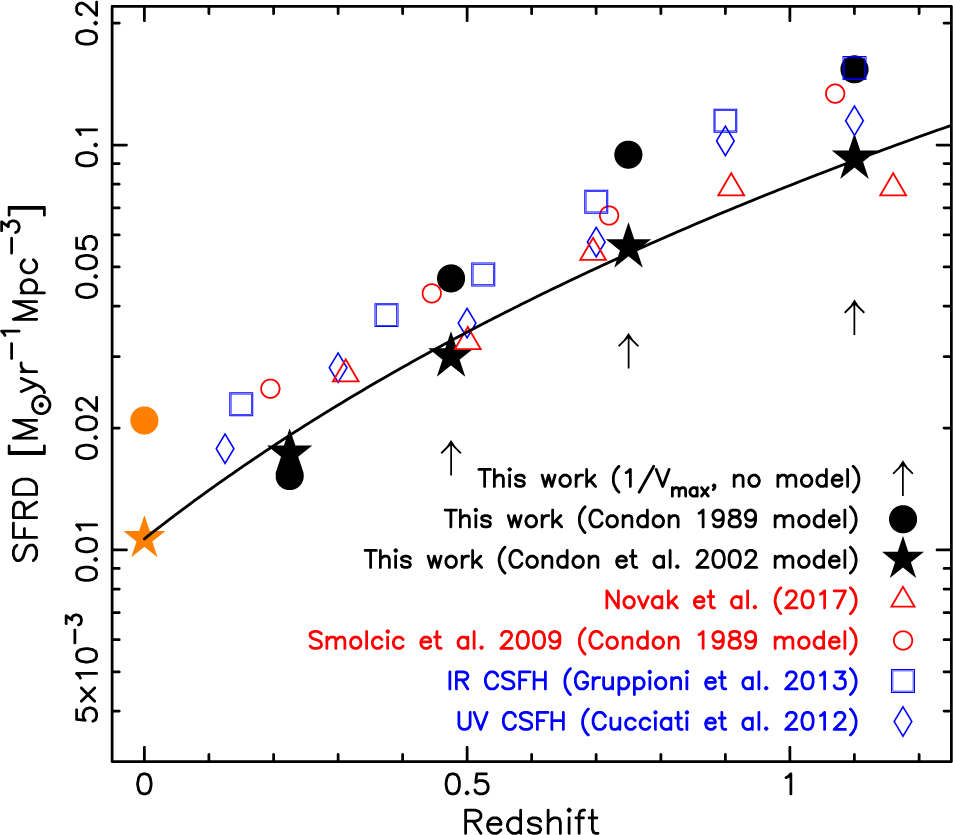
To obtain an SFRD that includes galaxies fainter than our flux density limits, we have modelled our data with the Condon (Reference Condon1989) and Condon et al. (Reference Condon, Cotton and Broderick2002) radio luminosity function models with the addition of pure luminosity evolution, where L(z) ∝ (1+z)Q. We choose to not use the newer radio luminosity function model of Mauch & Sadler (Reference Mauch and Sadler2007) as their sample is incomplete at low luminosities due to the surface brightness limits of the 2MASS survey. While the Condon (Reference Condon1989) model has been used by some studies, we find it is a relatively poor fit to our data and it overestimates the z ∼ 0 SFRD relative to recent radio luminosity functions (Condon et al. Reference Condon, Cotton and Broderick2002; Mauch & Sadler Reference Mauch and Sadler2007; Mao et al. Reference Mao2012). Our preferred model is thus Condon et al. (Reference Condon, Cotton and Broderick2002), which approximates our data well, as illustrated by Figure 2.
We determined SFRDs by integrating ∫ ψ(L)ΦB(L)dL, where ψ(L) is the SFR from Equation 1 and ΦB(L) is the radio luminosity function model. The resulting SFRDs and (for comparison) those from Smolčić et al. (Reference Smolčić2009) are provided in Table 2 and Figure 3. As Figure 3 illustrates, our SFRD measurements depend on the luminosity function model, with the impact increasing with increasing redshift. At 0.10 ≤ z < 0.35 our SFRD measurements have little dependence on the luminosity function model, but at 0.90 ≤ z < 1.30 the Condon (Reference Condon1989) model provides an estimate of the SFRD that is 67% higher than the estimate provided using the Condon et al. (Reference Condon, Cotton and Broderick2002) model.
The radio SFRDs for the COSMOS field.

As expected, we measure a systematically higher CSFH than Smolčić et al. (Reference Smolčić2009) when the same luminosity function model is used. However, it should be noted that Smolčić et al. (Reference Smolčić2009) does agree well with the literature when the Condon (Reference Condon1989) model of the luminosity function is used, as this model’s overestimate of the number of faint sources compensates for sample incompleteness. Our SFRD measurements, using the preferred Condon et al. (Reference Condon, Cotton and Broderick2002) model, agree well with recent UV, IR and 3-GHz studies (Cucciati et al. Reference Cucciati2012; Gruppioni et al. Reference Gruppioni2013; Novak et al. 2017), with the possible exception of 0.90 ≤ z < 1.30, where we measured a higher SFRD than Novak et al. (Reference Novak2017). Using the preferred Condon et al. (Reference Condon, Cotton and Broderick2002) model, we find the SFRD can be approximated by 0.0109 × (1 + z)2.90±0.07 M⊙ yr−1 Mpc−3, which implies SFRD has declined by a factor of ten from 0.90 ≤ z < 1.30 to z ∼ 0.
5. Discussion
Given both we and Smolčić et al. (Reference Smolčić2009) measure the 1.4-GHz luminosity function and CSFH using the COSMOS field, it is useful to explore why our results differ significantly from those of Smolčić et al. (Reference Smolčić2009). First, there are some differences in the radio catalogues used, with Smolčić et al. (Reference Smolčić2009) using the Schinnerer et al. (Reference Schinnerer2007) catalogue whereas we are using the deeper Schinnerer et al. (Reference Schinnerer2010) catalogue. The most significant differences, however, arise from our addition of new flux densities measured at the positions of optical galaxies allowing the use of a lower S/N threshold. Smolčić et al. (Reference Smolčić2009) imposed S/N > 5σ and S 1.4 ≥ 52.5 μJy, whereas we imposed S/N > 3σ and S 1.4 ≥ 40.0 μJy. Our sample contains 308 SF galaxies with 40.0 μJy ≤ S 1.4 < 52.5 μJy.
Given the large differences in sample size, are the radio flux densities measured at optical galaxy positions valid? We find flux densities (per beam) measured at optical galaxy positions are typically ∼90% of the catalogued flux densities (per beam) for sources with S 1.4 ≲ 100 μJy. Visual inspection of the 1.4-GHz VLA-COSMOS image shows that uncatalogued radio sources with S/N > 3 appear to be real radio sources rather than artefacts. This includes a limited number of S 1.4 ∼ 100 μJy sources, which are significantly brighter than the notional limits of the VLA-COSMOS catalogues (Schinnerer et al. Reference Schinnerer2007, Reference Schinnerer2010), which suggests there are (rare) failures of source detection algorithms on relatively bright sources (whose flux densities can otherwise be accurately measured).
A final cross-check of the validity of our approach is by comparison to previous literature. Our results agree well with recent measurements of the CSFH using UV, IR and 3-GHz data (e.g. Cucciati et al. Reference Cucciati2012; Gruppioni et al. Reference Gruppioni2013; Novak et al. Reference Novak2017). We find the evolution of the SFRD at z < 1.3, determined by fitting our SFRD measurements and Condon et al. (Reference Condon, Cotton and Broderick2002), is approximated by 0.0109 × (1 + z)2.90±0.07 M⊙ yr−1 Mpc−3. For comparison, Novak et al. (Reference Novak2017) find that radio luminosity function can be approximated by pure luminosity evolution where L(z) ∝ (1 + z)(3.16±0.2−(0.32±0.07)z ), which is similar to our results at low redshift but does predict less evolution at z > 1. Other measurements of the CSFH at z < 1 are broadly similar (e.g. Hopkins Reference Hopkins2004). Given the results of our cross checks and consistency with the literature, we conclude our approach to measuring radio luminosity function is valid.
6. Conclusions
We have measured the CSFH at z < 1.3 of 918 SF galaxies in the COSMOS field with 1.4-GHz radio continuum flux densities of S 1.4 > 40 μJy. We find that just 9% of the radio sources from the VLA-COSMOS Large Project radio catalogue do not have optical counterparts down to a magnitude limit of I = 26.5. We have also increased the size and depth of our sample by using radio flux densities measured at the positions of I < 26.5 galaxies selected from the COSMOS optical catalogue.
We find that our radio measurements of the CSFH, and those from the prior literature, have increasing dependence on the LF model with increasing redshift. For example, for our high redshift bin the deprecated Condon (Reference Condon1989) model produces SFRD measurements that are 67% higher than those produced by the Condon et al. (Reference Condon, Cotton and Broderick2002) model. We find that pure luminosity evolution of the Condon et al. (Reference Condon, Cotton and Broderick2002) model approximates our data well, and the resulting SFRDs are in broad agreement with recent UV, IR and 3-GHz measurements. Using our preferred model and 463 z < 1.3 SF galaxies, we find that the SFRD is approximated by 0.0109 × (1 + z)2.90±0.07 M⊙ yr−1 Mpc−3 and that it has declined by a factor of 10 since z = 1.1.
Author ORCIDs
Michael J. I. Brown https://orcid.org/0000-0002-1207-9137.
Acknowledgements
We are grateful to Olivier Ilbert and Peter Capak for providing preliminary optical galaxy and photometric redshift catalogues during the development of this paper. MJIB acknowledges financial support from The Australian Research Council (FT100100280), the Monash Research Accelerator Program (MRA), the Monash Outside Studies Programme (OSP) and the University of Cambridge. Part of this work was undertaken while MJIB was on OSP (sabbatical) leave at the University of Cambridge, Swinburne University and the University of Melbourne. The National Radio Astronomy Observatory is a facility of the National Science Foundation operated under cooperative agreement by Associated Universities, Inc.