

Introduction
All economic policy bears the footprint of the social order that gave rise to it. The financial system is no exception to this. Financial regulation is not simply made from a mix of ideas (about regulation) and power struggles among interest groups (over regulation) but also needs to be understood through the structures, institutional contexts, and social relations in which it is set. An important task for the political economy of finance is defining, describing, and analyzing these influences upon the policy-making process.
A great deal of qualitative scholarship takes on this task. It describes something that we all intuit about the financial sector: social relationships matter. Indeed, the interpersonal ties that exist between elites are believed to be crucially important to how financial regulation agenda is set, how the details of regulation are generated, and how regulation is enforced. One crucial set of relationships seen as important are the social relationships between government regulatory agencies and financial industry actors. These relationships are widely understood to be one means by which financial industry actors can overcome the problem of an uncertain future. The regulatory rulemaking process is such that initially proposed rules are often modified, and such modifications may be more likely to come out in favor of financial industry actors with closer connections to regulators.
While social relationships are deemed to matter, we are only just learning to systematically measure and assess these relationships empirically. As we argue in this paper, a great deal of scholarship describes existing relationships and diagnoses these in terms of how “close” or “distant” a given financial firm or other financial industry group is from a regulatory agency at a given point in time. Analyses that mobilize the notion of “regulatory capture,” for example, tend to emphasize how closely knit relationships are among elites within the financial industry and the regulators that oversee (and are potentially captured by) them. The literature on the de facto (as opposed to de jure) independence of regulatory agencies is another example along the same lines. When we think about politically consequential ties between private and public organizations, we are essentially thinking about an asymmetric web of relationships: Some firms (for example, Goldman Sachs) are close to important and influential public policy institutions, while others (for example, your local credit union) are not. Frequent allusion to “revolving doors” in finance make this even more explicit, as they refer to the personnel flows that exist in and out of financial industry firms and regulatory agencies, and back again. Each of these examples point to a similar latent phenomenon: what we call the “social proximity” or “social distance” between public regulatory agencies and financial industry groups.
In this paper, we contribute to an understanding of such social relationships through the use of network analysis and new data on ties between organizations that are both public and private in the financial sector. By modeling relationships between many different individuals and organizations in both business and government agencies, we are able to generate measurements of the social proximity/distance between specific organizations and government agencies, and assess whether or not such a factor affects the advocacy behavior of organizations. Network analysis can thus empirically capture salient aspects of complex evolving systems and in doing so can facilitate a more complete description of social structures.
While our analysis is expository and descriptive, our approach allows us to answer a simple but important question related to financial firms' relationships to their regulators. This is whether or not there is a relationship between the social proximity of firms to their regulators and the frequency of their advocacy over regulatory policy. Answering this question adds to our knowledge about when firms try to use their instrumental power resourcesFootnote 1 or are able to rely on other structurally, situated advantages as they engage with policy.Footnote 2
We conduct an empirical plausibility probe of two causal stories one might tell about the relationship between social distance and advocacy frequency. When firms are closer to their regulators, do they seek to exploit this advantage by advocating more frequently? Or, alternatively, do they advocate less frequently, perhaps because their closeness already enables them to get what they want? Stated succinctly, these relate to simple competing hypotheses subject to empirical investigation—H1: Organizations with less social distance to their regulator will advocate more frequently than organizations with more social distance, and H2: Organizations with less social distance to their regulator will advocate less frequently than organizations with more social distance. We test these two hypotheses through the use of a new method of deriving social proximity between firms and regulators, which we apply to a selection of approximately 3,500 firms and their variable social distance to the U.S. Securities and Exchange Commission (SEC) over the period 1995–2014. Our sample is drawn from the population of organizations that lobbied the SEC at least once during this time period.
Evaluating these hypotheses empirically is important because existing scholarship has very little knowledge with respect to why some firms engage in advocacy while others do so rarely or never do so at all. Considerable attention has been paid to mapping interest group populations under different institutional conditions,Footnote 3 and while researchers can and have done a lot to explain variances in interest group activity when it does occur,Footnote 4 there is still very little we know about the decision to lobby at all and the relative intensity of lobbying when it does occur. We seek to add to the literature on the political economy of finance and financial regulation by adding to our currently low stock of knowledge about the conditions under which advocacy takes place.
The paper is structured as follows. In Section 1 we describe the existing scholarship on the political economy of financial regulation that we seek to speak to and add to in this contribution to the Special Issue. Section 2 reviews some recent attempts to measure the social proximity of private and public actors. Section 3 describes our sources of data and a replicable method for how scholars can construct measures of social proximity. Section 4 shows the results of our analysis of a sample of 3,509 different organizations and the SEC. We find supportive empirical evidence for H1 and thus for the notion that the closer financial firms are to their regulators, the more they engage in advocacy. We conclude by reflecting on what extensions of our analysis might mean for the study of the global financial system as a socio-ecological system.
1 The notion of social distance in existing literature
Scholars studying the political economy of financial regulation are accustomed to thinking in terms of systems. Systems are composed of interrelating and interacting parts that form a complex, usually evolving, larger whole. Recent scholarship on the political economy of finance has begun to utilize network analysis to generate a richer set of descriptive inferences about the financial system.Footnote 5 Scholarship on elites and elite connections within the financial sector and the interrelationships among elites across a range of organizations has an even longer, richer history, though this work has been primarily qualitative in nature and tends to focus on very specific institutional contexts. When scholarship considers the social proximity of regulators and industry to be an issue of theoretical interest, they are often drawing from theories of elite socialization in which individuals in positions of decision-making authority, either within large corporations or in government, are viewed as cut from the same cloth and therefore exhibit a form of social solidarity that is not afforded to other groups in society. Thus, the shared backgrounds and recurring connections among elites are of great theoretical interest.Footnote 6 The global financial crisis has helped to put elite networks closer to the forefront of discussions about how contemporary economic governance actually functions, and in recent years, there has been a resurgence of interest in measuring webs of interrelationships among individuals occupying positions of extraordinary economic and political prominence in particular.
Understanding the social relationships between corporate elites and policymakers is a centerpiece of many analyses of the political economy of finance. Accounts of the build-up of the crisis feature interacting elites flowing in and out of organizations.Footnote 7 Considering social relationships among elites within the financial sector has a long pedigree in political economy, since financial elites have often been considered to be qualitatively different than other kinds of elites within the business community. The financial community is not just a collection of formal organizational structures, buildings, and heaps of money. It is also constituted by social relationships. Political economy scholarship on financial regulation has long pointed out that these relationships cross over not only the financial community and its clientsFootnote 8 but also into regulatory agencies. For example, consider the frequent referral to the “City-Bank-Treasury nexus” in the case of the United KingdomFootnote 9 . Today, there is also renewed talk of a financial oligarchy, of “regulatory capture” by the financial industry and of “revolving doors” being especially pernicious within the financial sector.Footnote 10 Many recent empirical analyses of the political economy of finance emphasize the dense interpersonal ties that exist between private organizations and financial regulators.Footnote 11
Existing scholarship in this area is diverse and has a long history, and the present article does not afford the length to provide an extensive review. We argue, however, that throughout much of this literature, there is a latent operational assumption, one which can be encapsulated in a key concept. That key concept is what we call social distance. Some actors or some types of actors are “close” to institutions of government authority, while others are not or are more “distant.” We use the term social proximity to indicate the opposite of distance. The two terms are part of the same underlying concept. We see the concept of social distance/proximity being either invoked within, or consistent with, three bodies of work that seek to understand the political economy of financial regulation.
First, the concept of social distance is latent within the notion of “regulatory capture.”Footnote 12 Scholarship which asserts that regulators have been captured by the very financial industry they are charged with regulating tend to emphasize how closely knit relationships are among elites within the financial industry and the regulators that oversee (are captured by) them.Footnote 13 When scholars utilize the concept of regulatory capture they are not just invoking an image of regulatory outcomes in which regulation works solely for the industry being regulated. They also invoke a notion that social ties between regulatory officials and private sector representatives are problematically close. Scholarship refers to relationships between the financial industry and public officials as “cozy.”Footnote 14 Whether seen as a cause or an effect of larger capture dynamics, regulatory capture is associated with a scenario in which social distance is low. Capture, after all, is about location. Someone has “captured” the castle only once they are inside it, presumably after having it under siege. Attempts to explain the lack of significant change within the financial system can also be rearticulated in terms of social distance. For example, Tsingou argues that the endurance of pre-crisis regulatory arrangements at the global level is a result of the club-like social structure of global financial governance.Footnote 15 Thus, the social process being described is that a lack of social distance between private and public actors is what is conditioning regulatory outcomes. Another recent example is an intervention by Van der Pijl and Yurchenko on neoliberal governance.Footnote 16 Van der Pijl and Yurchenko argue that the decisions made by the U.S. Federal Reserve and the Bank of England were directly conditioned by the social relationships between major banks and government regulators.Footnote 17 They remark that “[w]ith Greenspan at the Fed from JP Morgan, Robert Rubin as Clinton's Treasury Secretary from Goldman Sachs and afterwards at Citigroup, and Bush's Treasury Secretary, Hank Paulson from Goldman Sachs, we may safely conclude that this time it is money-dealing capital that has captured the state.”Footnote 18
Second, scholarship on the de facto independence of regulatory agencies also suggests a particular relationship of social distance.Footnote 19 Much of this literature suggests that the social ties between regulatory agencies and the financial industry run deeper than the factors emphasized by the move to regulatory independence, such as discretionary control, distance from legislatures, etc. This is highly significant for financial regulatory policy and for financial system resilience more generally because it has been acknowledged for some time now that the independence of financial regulatory agencies and central banks does not mean social distance from the industry.Footnote 20 De jure independence is not the same as de facto independence. Friedman even once stated that “an independent central bank will almost inevitably give undue emphasis to the point of view of bankers.”Footnote 21 This notion of social distance—while not spelled out explicitly in most literature—is nevertheless pervasive as a latent concept, even outside the U.S. For example, in an explanation of the content of banking supervision at the U.K. Financial Services Authority (FSA) before the crisis, McPhilemy argues against claims of ideology among regulatory officials (what he calls “regulatory groupthink”) and the direct political clout of the financial industry (what he associated with “regulatory capture” explanations).Footnote 22 Instead, McPhilemy points to relationships among elites: Regulatory officials at the FSA became overconfident in their ability to manage risk and failed to catch particular fundamentals of emergent risks right before their eyes because of the nature of their social ties to the banking industry and the everyday practices this entailed.
Third and most significantly, the literature on the so-called “revolving door” is another area that uses the concept of social distance. The revolving door concept is premised on the concept that private organizations are able to utilize what is sometimes referred to as “industry specific human capital”Footnote 23 or, broadly speaking, “relational capital” to get what they want out of public policy.Footnote 24 The revolving door is the movement of employees from regulatory agencies to industry and back again. Employees bridge the distance between the agency and the industry it regulates, making them socially close. While the revolving door has been described within the public policy literature for some time,Footnote 25 in recent years, it has become especially prominent in discussions of financial regulation.
Each of these literatures frequently intersect emphasizing shared norms and shared connections among elites and the general revolving-door-ness of the world of finance. For example, in their study of the causes of global financial meltdown, the Warwick Commission on International Financial Reform identified revolving doors in finance as one of the key components of “regulatory capture” in which the regulated financial industry is able to systematically influence the regulatory policy agenda.Footnote 26 Indeed, a range of literature on the political economy of financial regulation emphasizes revolving door-type mechanisms as contributing to the pernicious advance of regulatory capture dynamics within the Anglo-American financial systems.Footnote 27
Social distance between regulatory agencies and the financial industry is a matter of active politicization. A financial industry “too close” to its regulators is viewed with suspicion. Financial regulatory agencies have been publically criticized for their lack of social distance, specifically in the weakness of the controls on post-employment controls after working for a regulatory agency.Footnote 28 Government agencies in turn try to defend their relationship with the industry as one of arms-length. Accordingly, some existing government legislation recognizes the importance of cool-off periods for post-public sector employment.Footnote 29 For example, the U.S. Departmental Ethics Office has established statutory prohibitions on former Federal employees, and individual U.S. states have a variety of different post-public employment restrictions. Similarly, at the international level the Organization for Economic Cooperation and Development (OECD) has also established guidelines for post-public employment, but notably has not done so for pre-public employment.Footnote 30
What is social distance composed of and what does it do?
If the notion of social distance is latent within existing scholarship, one might still ask what constituent parts make up social distance. This question is especially relevant for our intended intervention, since we aim to measure social distance empirically and relate it to the organizational attribute of advocacy behavior. Two questions follow. First, what is social distance composed of? Second, to paraphrase Mizruchi, what does social distance do?Footnote 31
As the above examples from the conceptualization of regulatory capture, de facto regulatory independence, and revolving doors helps to illuminate, the concept of social distance is premised on the existence of social ties. We argue that two kinds of ties can be considered relevant in this regard: ties between individual people and ties between organizations. A tie between individual people—usually those with elite status of some kind (see discussion below)—is observable because of their common connection to a given organization. For example, suppose that W. Kindred Winecoff and W. Travis Selmier, II both worked for JPMorgan Chase, and are thus tied “through” this organization. This tie provided through an organization provides a number of interrelated bonds. Common experience within the same organization means that individuals share an experience with a common organizational culture. The requirements to be employed by the organization in the first place also acts as a selection device to narrow the range of possible other attributes, which could be everything from work ethic to professional skills to taste. Individuals that were employed by the same organization are also more likely to personally know one another (first-degree connections), and they are even more likely to know someone who knows the other (second-degree connections, and so on). Yet ties through organizations are not just about actual connections but about perceived ones. Even if Winecoff and Selmier never met one another and their social ties within the organization are very distant and even if they occupied very different roles within the complex corporate structure of JPMorgan Chase, there is still something in common that is absolutely critical to professional life: they will be seen by others as sharing a common professional attribute. Having worked for the same organization makes professionals legible to one another; there is a perception of common professional experience, an inter-subjective rating of similar prestige; and a social assumption of knowing people or of knowing people who know people within that organization.
When an employee moves from one organization to another, that employee brings the two organizations socially closer to each other. Hula found that a person's new employer will use that person to make connections with the person's previous employer.Footnote 32 The employee acts a bridge between the two organizations, which becomes stronger if there are more employee connections aggregating over time. Once these connections are made, the social relationship between the organizations transcends the individual, as it can engender an inter-organizational tie that can have greater meaning than an employee flow system. Just as organizational affiliations make professionals legible to each other, the ties between organizations also can serve such a legibility function. Organizations can gain a reputation for hiring people with similar career backgrounds or who have worked for particular organizations. The movement of employees from the a regulator such as the SEC to a given firm gives that firm a status that is inter-subjectively important to other organizations. The individual who moves between the organizations is relevant, but so is the fact that others observe movement of employees from one organization to another. These ties make it reasonable to talk of social distance between organizations, not just between individuals. When aggregated up to the systemic level, such intra-organizational ties add up to an extremely complex structure, which in its totality may be beyond the comprehension of any one actor. Yet differences between organizations—for example, the distance between actors—can be comprehended, have social valence, and be strategically acted upon.
Thus we take both individuals and organizations as the constitutive elements of a meaningful measure of social proximity. The data we deploy in this study, which is described more thoroughly below, is mostly composed of businesses—not just financial firms but non-financial firms, from every sector and industry. Our data also contains a range of other kinds of organizations. Among these are government agencies of all kinds, many different kinds of business and professional associations, as well as educational organizations.Footnote 33 By modeling the flows of senior personnel across these organizations, we can capture relationships of social distance across organizations.
We do this through ties that exist across organizations through employment. We recognize that much extant theoretical and empirical work within the study of elites considers a wide variety of social ties that together form the complex nexus of characteristics that constitute elite socialization. In terms of social ties, elites are not only tied through employment, but through common educational experiences at universitiesFootnote 34 and often through earlier phases of education such as prep and boarding schools.Footnote 35 Other kinds of ties that have been shown to be important elements of elite sociality have no direct formal organizational component, but are associated with performances and norms. In particular ties of race and ethnicity have also been shown to be important, as has gender.Footnote 36 Moreover, elites are more likely to live in similar areas, and thus have common physical experiences of space.Footnote 37 Recent scholarship on “linked ecologies” posit that elites connect with each other according to a logic of practice.Footnote 38 Elites in different professional ecologies,Footnote 39 such as international governance or transnational advocacy organizations, form alliances based on shared ideas and skills. Their shared practices, the ideas and skills they use to accomplish their professional advancement and policy goals, bring them together.
We recognize the diverse literature that points to this wide range of elite social ties. Elites clearly inhabit a diverse and complex organizational ecology, and formal organizations are only one element of it. At the same time, we also accept that any serious attempt to understand power within specific fields (in this case, financial regulation) needs to prioritize the kinds of ties that make the most theoretical sense to model. Ties through employment are critical for our analysis because existing scholarship on the political economy of financial regulation discussed above takes employment relationships as the central kind of tie through which theories like regulatory independence and revolving doors are conceived. We make this case in the next section, which also serves to discuss existing empirical attempts to measure social distance and our critique of this extant work.
2 Existing attempts at measuring social distance between firms and regulators
A variety of recent literature has attempted to measure social distance between industry and regulators. The dominant approach is to examine employment ties to these connections. Most of these attempts seek to empirically evaluate revolving doors in action and their consequences. Braun and Raddatz count the number of former politicians on bank boards across different countries, and find that this count is associated with a weaker quality of regulation.Footnote 40 Igan et al. examine the varying success of lobbyists on federal legislators based on whether a lobbyist worked for a member of Congress.Footnote 41 They find the presence of former congressional staffers in lobbying firms to be a statistically significant predictor of whether legislators change their stance in favor of a bill that encourages financial deregulation. De Haan et al. examine the revolving door at work within the SEC, and specifically examine the SEC's civil litigation enforcement actions.Footnote 42 Contrary to existing depictions of how the revolving door affects policymaking, they find that when a firm employs a former SEC lawyer, civil litigation actions are actually more strict than otherwise—a result that has (not surprisingly) been celebrated by the SEC itself.Footnote 43 Lucca et al. seek to understand the prevalence of the revolving door in key U.S. financial regulatory institutions by operationalizing overlapping career trajectories of private and public sector employees derived from CV's.Footnote 44 Once again, it is employment ties that are understood to matter since the most important social connections between private and public organizations are envisaged to flow through workplaces.
Each of these studies has their distinctive individual merits and cumulatively represents an exciting effort taking place in recent years to empirically investigate underlying phenomena that have been richly theorized but difficult to empirically capture. Three commonalities about this literature are especially noteworthy. First, the kinds of entities that are considered relevant in the analysis consist of individual people and their interconnections through organizations. Second, these ties are of one particular kind: they are employment ties. With these two characteristics we have no quibble.
A third common feature of existing studies to date has to do with how social ties are measured: they all measure direct ties. Measuring social distance in this way risks limiting our ability to understand the complex forms of sociality that get built up through both direct and indirect ties. Simply aggregating direct ties between organizations will not capture indirect ties. Put another way, binary variables or simple counts cannot capture the many indirect relationships that organizations have with one another.
Direct and indirect ties are relevant for the study of elite social ties because they aggregate into an interconnected system of relationships, not just into a simple count. We argue that the network analytical frame can offer a useful analytical tool to advance our objective of generating useful knowledge about the social structure of financial systems at a given point in time and context. Network analysis can better approximate complex social relationships by modeling inter-relationships among actors in a way that highlights the asymmetrical integration of actors within a given structure—that structure being the totality of social relations under analysis. In our study, network analysis enables us to examine how social distance within a network is related to advocacy behavior, even as the members of the network change their positions over time. We can determine if network position is important for the frequency of an actor's lobbying. As a variety of the contributions to this Special Issue illustrate, network analysis offers the promise of making relational ties between actors explicit, and thus does not rely on an assumption about their independence.
There is now a growing literature on financial networks, expressed as a system of financial flows or ownership ties among firms. Within this journal Winecoff has shown how interconnections within the financial system highlight the structural prominence of countries in the international financial system.Footnote 45 Recent attempts to model systemic risk along the lines of the “financial ecosystem”Footnote 46 and broader efforts to model financial inter-linkages represent a recognition that financial instability does not simply emerge from formally contracting ultimately isolated firms but on the basis of the relationships within which those firms are embedded. Battiston et al. and Anand et al. highlight the relationship between the increasing complexity of network ties among financial firms and the consequences for systemic risk.Footnote 47 For a variety of this literature, there is a need to rethink our notions of financial systems, fragility, and ultimately, how we construct financial regulation.Footnote 48
Some recent scholarship has begun to empirically explore not only the presence of ties among financial industry actors and public authorities, but the importance of those ties within their network. In particular, Christopoulos and Quaglia find that network centrality alone does not lead to influence over the content of a policy.Footnote 49 Instead, those actors that play brokerage roles within a network are the ones that are able to exert the most influence over a policy. Brokerage roles are created by actors who occupy structural holesFootnote 50 in a network; they connect other actors who would not otherwise be connected. Seabrooke and Tsingou also study the brokerage role of experts.Footnote 51 They examine the ties between members of financial reform commission expert groups and show the significant inter-linkages between elites in this process and the “fractal logics” of reform debates that erupt out of these commissions. They find that some authors of financial policy reform reports occupy brokerage positions within the network. These authors are able to connect the different “fractal logics” or connect actors within each logic to each other. Tsingou, Baker, and Seabrooke analyze the professional backgrounds of participants at the annual “Jackson Hole” central banker meetings.Footnote 52 They describe and illustrate the professional ties of elite economists and central bankers, and seek to understand the professional traits common to those actors most central to these networks. Such literature takes an approach of knowing one's cases well in order to inform what the ties are doing for actors in the network. Thus, there is often a dialogue between network analysis and qualitative investigation of behavior. A range of literature in political economy uses network analysis to develop measures of relative social standing,Footnote 53 but using networks to measure social distance to regulatory agencies has not been pursued before.
To summarize, the relationship between measuring interconnectedness of actors and social distance in finance can be characterized as a lop-sided one within existing scholarship. Studies of interconnectedness within financial systems don't utilize the concept of social distance; studies of social distance don't mobilize network analysis but rather opt for more conventional forms of measurement through coding and aggregation. Yet network analysis is particularly well situated as an empirical method to assess social distance between different parties, as we argue in the section below.
3 Measuring social proximity through network paths
While social proximity has relevance for the literature on the political economy of financial regulation, it has not been systematically measured. In this section, we describe how social proximity can be measured using network analysis using a simple hypothetical example and we then describe the more complex and detailed data we use in subsequent analysis.
In order to understand the relationship between social proximity and advocacy frequency we need to conceptualize how to measure social proximity given the shortcomings of previous studies. Following the literature's focus to date, we model ties between individuals and organizations (whether firms or regulatory agencies) by measuring employment ties. As we have argued above, these are not necessarily the only relevant ties within elite sociality; however, they are highly relevant for an examination of the relationship between social distance and advocacy behavior in financial regulation. The connections between individuals and two or more organizations create connections across organizations. Take for example an employee at the Federal Reserve Board (henceforth: “the Fed”) who moves to HSBC creates a connection between the Fed and HSBC. Therefore, the individual proxies form a tie between two organizations. While other studies have used employee flows to study the revolving door, we think it is important to assess how many of these flows occur. The more former Fed employees that proxy for an organization, the stronger the connection between that organization and the Fed becomes. We also differ from other studies in the range of connections that we measure to assess social distance. Not only do employees move between the Fed and private organizations, they also move between private organizations, like when an employee leaves HSBC to work for Citigroup. In network analysis terms this moves from a bimodal network of individuals and an organization, the Fed, to a one-mode network of organizations. Once a one-mode network is created, we can see that a firm can be directly or indirectly tied to the Fed. Either the HSBC employs former Fed employees or HSBC employs Citigroup employees who once worked for the Fed.
By paying attention to direct and indirect ties we can see that structural position within a network carries far more nuance in measurement than a simple binary of the existence or non-existence of ties. The sample network in figure 1 below illustrates further the complexity in social distance measurement afforded through the lens of social network analysis. Each node (circle) in this network represents an organization, and each edge between them (line) represents some number of shared employees between the two organizations it bridges; the thicker the tie, the higher the number of shared employees. A quick view of the network and its constituent actors helps to understand social distance in a complex of relationships. In this case, the reference point for the regulator is the New York Fed.
Hypothetical network of employment ties between twelve firms and the New York Fed
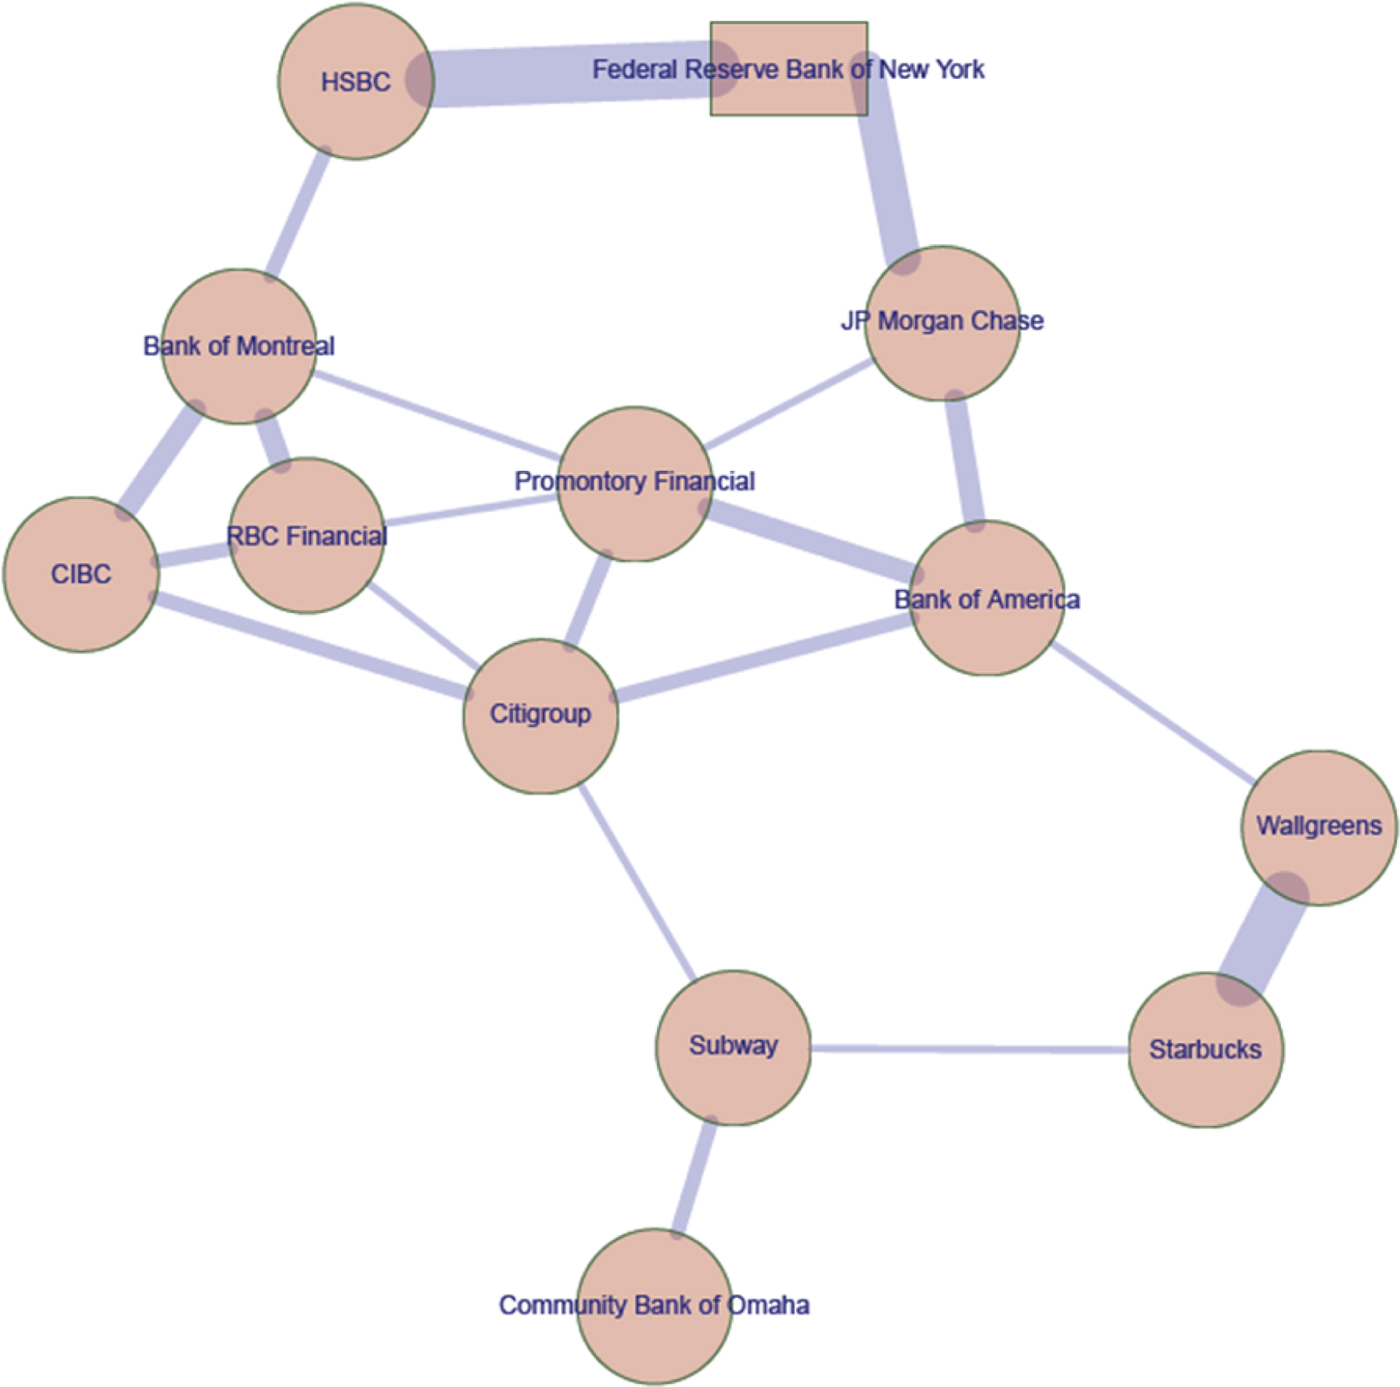
To understand the importance of these indirect ties, take for example Bank of America in this network. There exists no direct tie between the New York Fed and Bank of America, which would classify the latter in most studies as having no employment ties with its regulatory body. The two organizations are bridged by JPMorgan Chase, though, which has shared employees with each. In this way, Bank of America has an indirect tie to its regulatory body through sharing employees with a corporation that holds a direct, shared employment tie. The same is true for the Bank of Montreal, which is bridged to the New York Fed by HSBC, and Promontory Financial, which has several paths to its regulatory body. While these organizations are quite close, with first-, second-, and third-order connections, others like the Community Bank of Omaha are much farther away from their regulatory body despite being in the same network.
Being more than one “hop” away from a node on a network still affords power through indirect social ties like these. In this way, both the number of “hops” between corporations and the width of each tie between them is significant to understanding social distance between the two. Where as these “hops” are an indication of the number of organizations through which information must travel to become influential, the weight of the connections between organizations allows for a more nuanced understanding of how that information will travel between any two organizations along the path. These measures enable us to know the distribution of connections (the least to the most amount of “hops”) and the density of connections (the number of ties between organizations). Focusing simply on “hops,” figure 2 shows the distance from the New York Fed to the fifteen closest organizations in the earlier network, offering a preliminary understanding of social distance of each corporation to the regulatory body within the network.
Social distance to the New York Fed among twelve firms, using unweighted ties
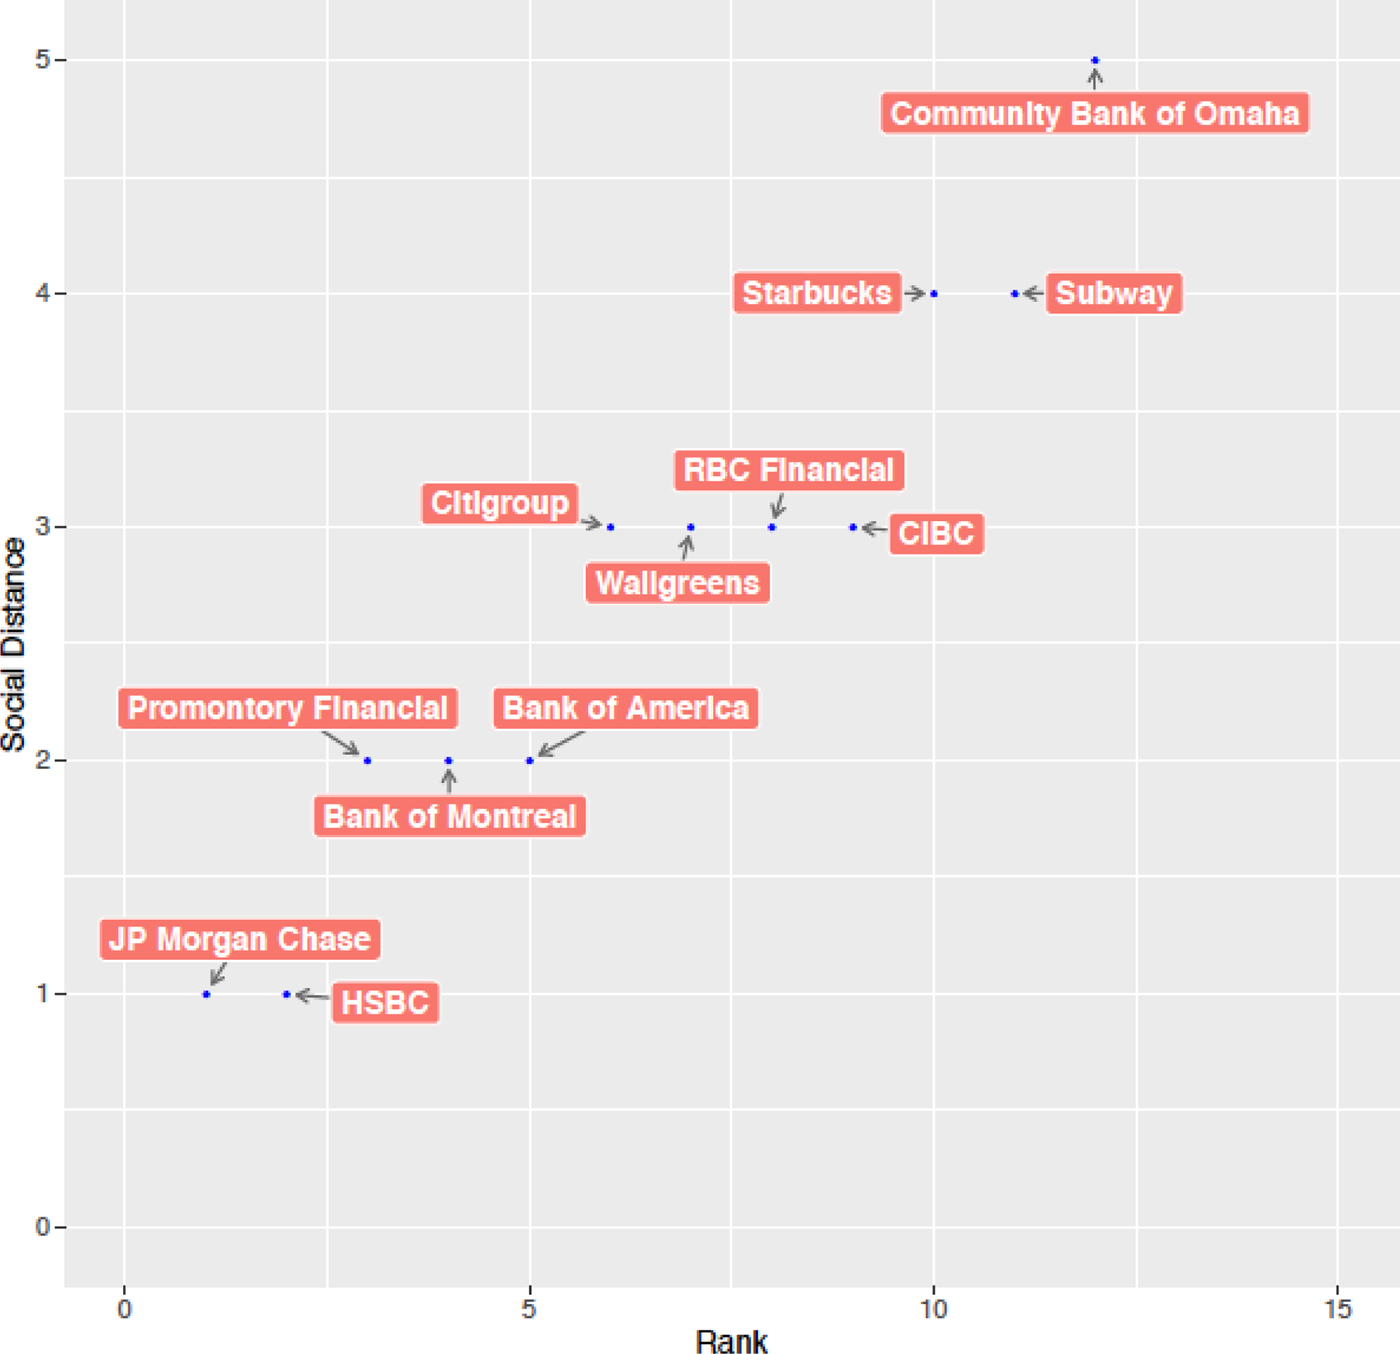
The trend clearly follows an uneven step pattern; as the rank of a firm diminishes, its social proximity to the regulatory body increases in full numbers of steps. While JPMorgan Chase and HSBC have a social distance of one, as they both directly share employees with the New York Fed, other organizations like Promontory Financial and Bank of America have second-order connections (a social distance of two) and are bridged by employment ties of the first two firms. These “hops” help to understand the number of corporations through which information must travel to reach the regulatory body it intends to influence. While first-order connections are in this way most valuable, the logic of these “hops” allows for diminished influence through indirect ties of second- and third-order connections; information has the potential to travel farther than the confines of a pair of organizations.
While the number of “hops” offers an understanding of how far the information must travel to reach a target organization, the weight of the employment ties along a path within the network is also incorporated into social distance scores. The incorporation of weights helps an analyst to move from measurements of groups, such as organizations with first-, second-, and n-order connections, to a system with unique scores for each organization based on its structural position in the network relative to a specific actor. Figure 3 offers the same illustration as figure 2, but accounts for the weight of ties between corporations and the New York Fed in calculating social distances.
Social distance to the New York Fed among twelve firms, using weighted ties
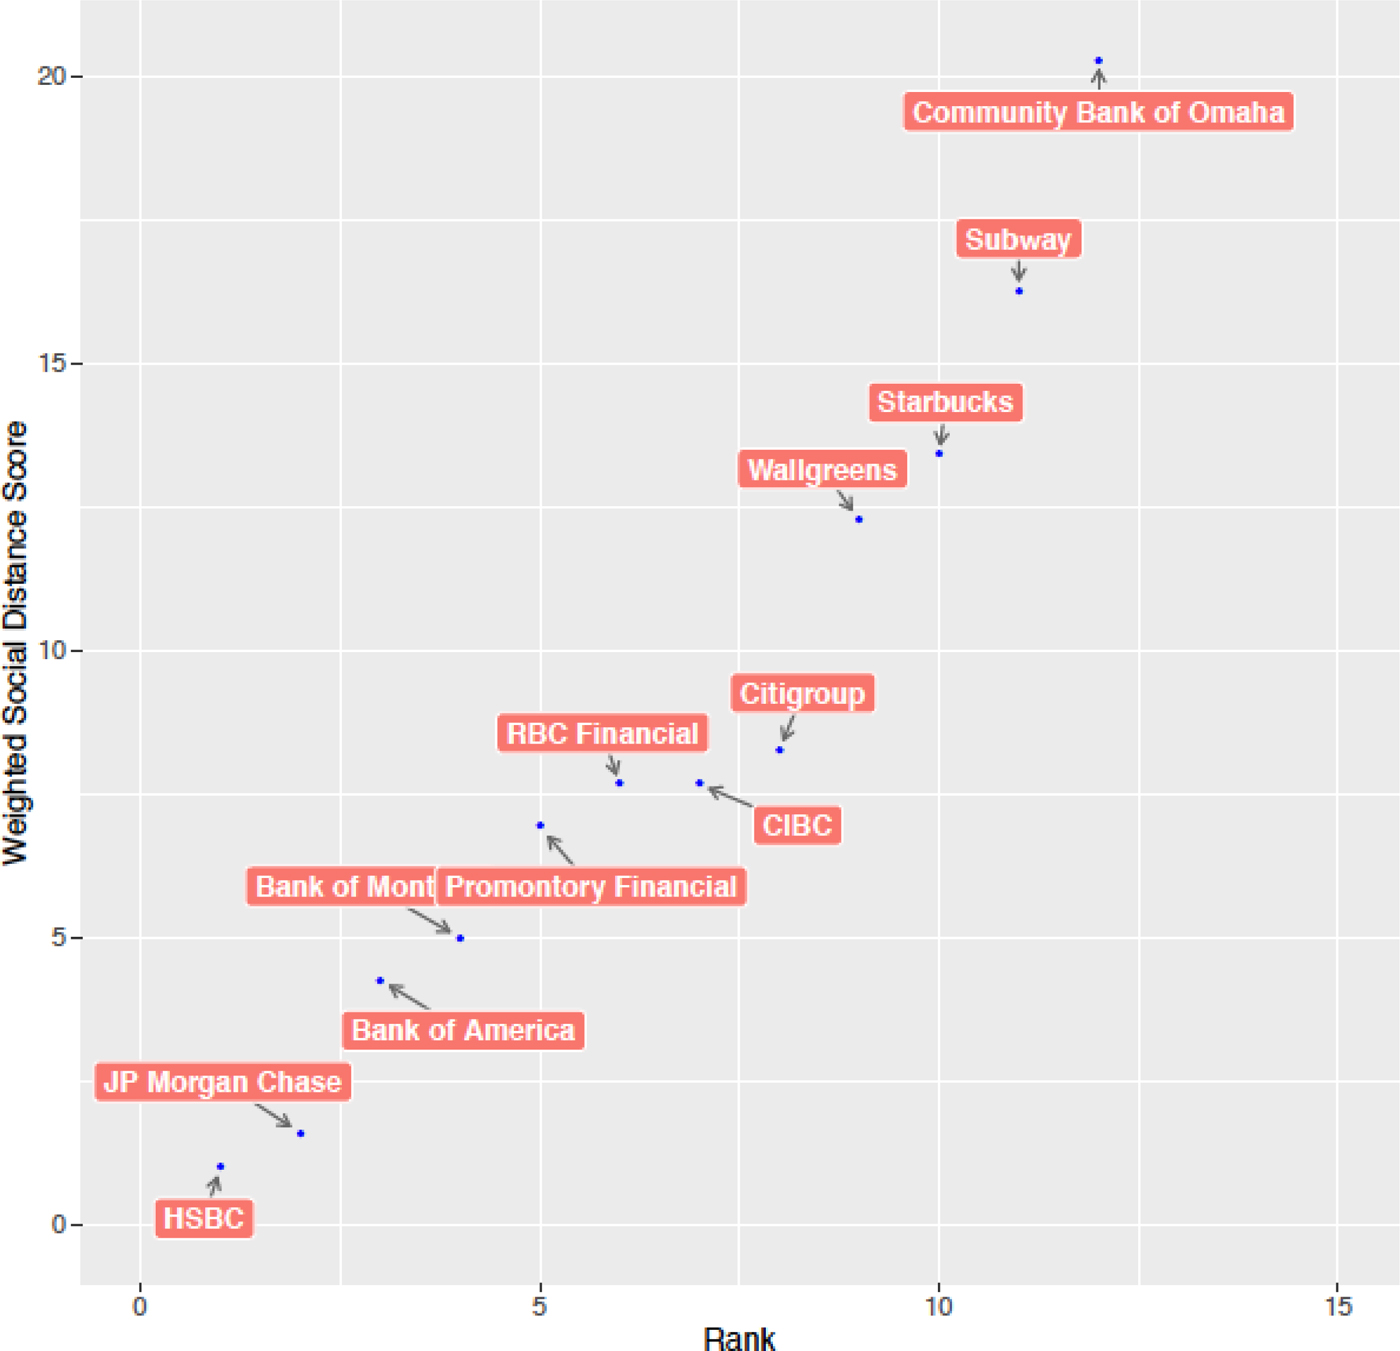
This offers a sharper perspective on the social proximity to a regulatory body afforded to each firm by employment ties. HSBC takes clear precedence above JPMorgan Chase in this instance because of its visually stronger ties in the network, meaning HSBC shares more employees with the New York Fed than JPMorgan Chase. Bank of America, however, is socially closer to the New York Fed than Bank of Montreal because the former shares stronger ties with its bridge, JPMorgan Chase, than the latter does with its bridge, HSBC. The weighted distance to a given actor in a network as measured in this manner affords nuance and precision in estimating social proximity through channels such as employment. A blunter, binary measurement risks masking the possibility that the density of flows makes a difference. Our more nuanced measure that includes the density of ties between organizations we believe is closer to most scholars' intuition: that a link between two organizations that is constituted by 100 employees flowing between them is meaningfully different than an organization with five.
Measuring social proximity with real employment ties
The above example illustrates a replicable method for ascertaining a given firm's social distance to a given regulator. While this process can be scaled up to any size, the key question is how to obtain data on ties between organizations and individual employees. We utilized the BoardEx database as our main source of data for this purpose, a data source that has been used for a variety of existing studies to date.Footnote 54
BoardEx is a proprietary database of information about employment ties between organizations from all over the world and in-depth background knowledge of these employees. BoardEx describes itself as “the leader in the emerging field of Relationship Capital Management” and, as such, generates data about connections between organizations. The data that it compiles is ideal for the study of elites because it contains information about the senior personnel of over 800,000 organizations, both public and private, over the last fifteen years.
The use of large-scale network data is fraught with challenges. Data quality is never perfect, and addressing issues of data quality in large corporate network data is becoming a major issue in the study of business and politics.Footnote 55 To improve the quality of the data we deployed a series of “entity resolution” solutions to our data, rather than using it “off the shelf.” Entity resolution is critical in network analysis, because network computations distinguish between two entities of slightly different names—for example, “Goldman Sachs” and “Goldman Sachs Securities” are treated as separate entities, with distorting effects on the structure of the network emerging as a result, and thus bias, in any measure of social distance.
We deployed several. First, inconsistencies in company names within the BoardEx dataset were addressed using information on the structure of corporate hierarchies, which entailed looking up the name variants within the list of subsidiaries, holding companies, etc. that are part of the ultimate global parent. We deployed string-matching algorithms to address the complex corporate hierarchies within the largest 500 global parents in the world, ranked by assets on a global ultimate owners basis. After doing this, we still found inconsistencies in the spelling and formatting of names over time—for example “Bank of America Securities” and “Bank of America NA.” To address these inconsistencies, we deployed a second method: We used the structure or “topology” of the network itself to identify problem areas and algorithmically replace names. Specifically we used a community detection algorithm to detect clusters of strong relationships— communities—based on common collective ties among firms. These clusters of firms were then assessed in terms of commonalities among names within a given cluster. In this way clusters that formed in the data because there are many ties among “MetLife Securities,” “MetLife NA,” and “MetLife Canada” could be identified and reduced to the singular “MetLife.” Firms within each community were then reduced to the first word of their company name if that name appeared more than once in the given community, occurred in the top 0.1 percent of frequent first words in company names across the dataset, and was not also a common English term. If these conditions were not met, company names were reduced to the first fifteen characters of their original if that string occurred more than once within a given community. If none of these conditions applied, the name remained as it was. We subjected each network to two iterations of this community-based entity resolution method, and was resolved a final time with a third method of entity resolution—the same string-matching algorithms were used as described above but based on shared ties rather than grouping within communities. Finally, we also limited the range of ties within our date to those that have clear beginning and end dates. A small minority of ties (less than 5 percent) in the data we used also constituted “other activities”—these are ties that exist between organizations that are not necessarily employment but for example being on an advisory board of a non-profit organization, or on the board of trustees or board of governors of an organization that constitutes part of the professional profile of an individual but which does not constitute a traditional paid employment relationship.
Our data on advocacy behavior spans from 1995 to 2014 and thus we needed to generate relevant elite networks for that period. Yet existing qualitative scholarship on social relationships between firms and financial regulators suggests that these relationships are not static but shift over time.Footnote 56 Our measure of social distance thus needs to accommodate the fact that a tie between two firms in 1999 might not be as relevant as connections formed in 2012 when a firm is trying to lobby a regulator in 2013. We assume that the social valence of the kinds of ties we are studying here—mainly employment ties—retain their social valence for several years but eventually are no longer relevant. In the absence of a clear “window” of time in which these ties matter, we chose a five-year rolling window.Footnote 57 Thus, we did not generate one network but rather sixteen—constituting rolling five-year windows over the period 1999–2014, built from employment ties between the period 1995–2014. As such, we only included employment ties that have clear start and end dates.
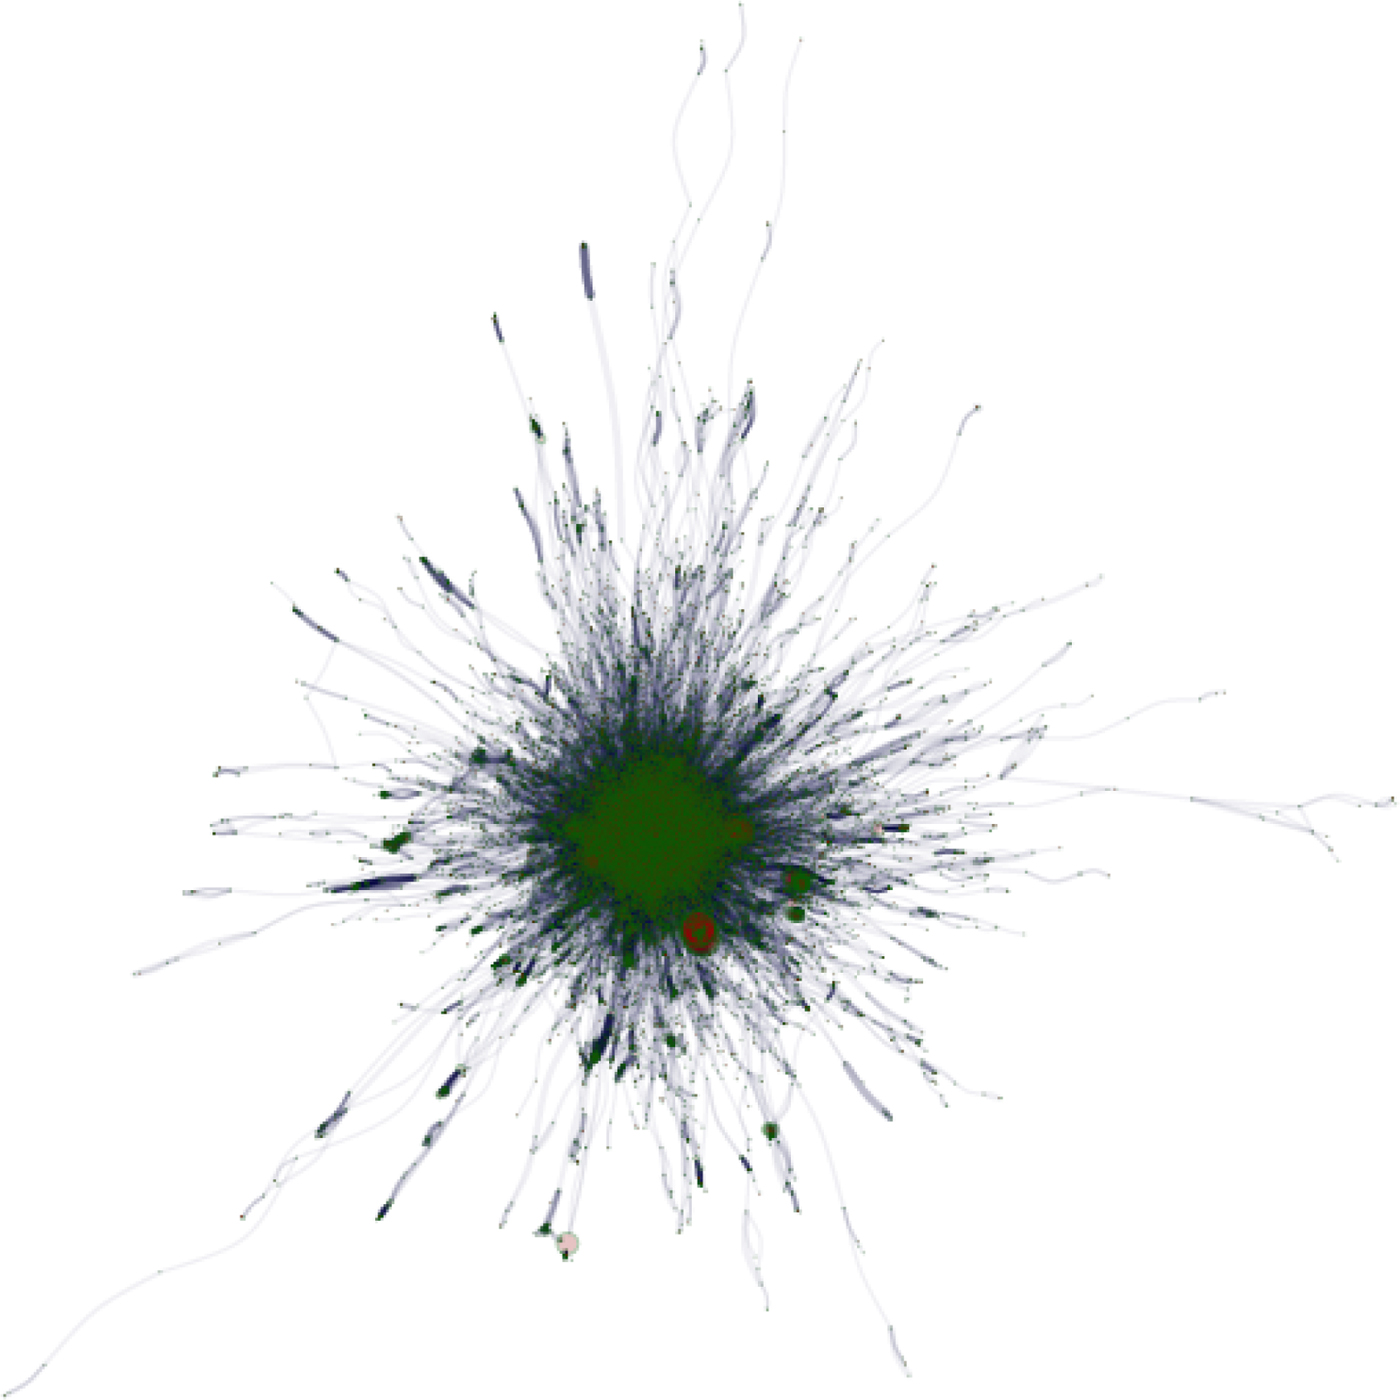
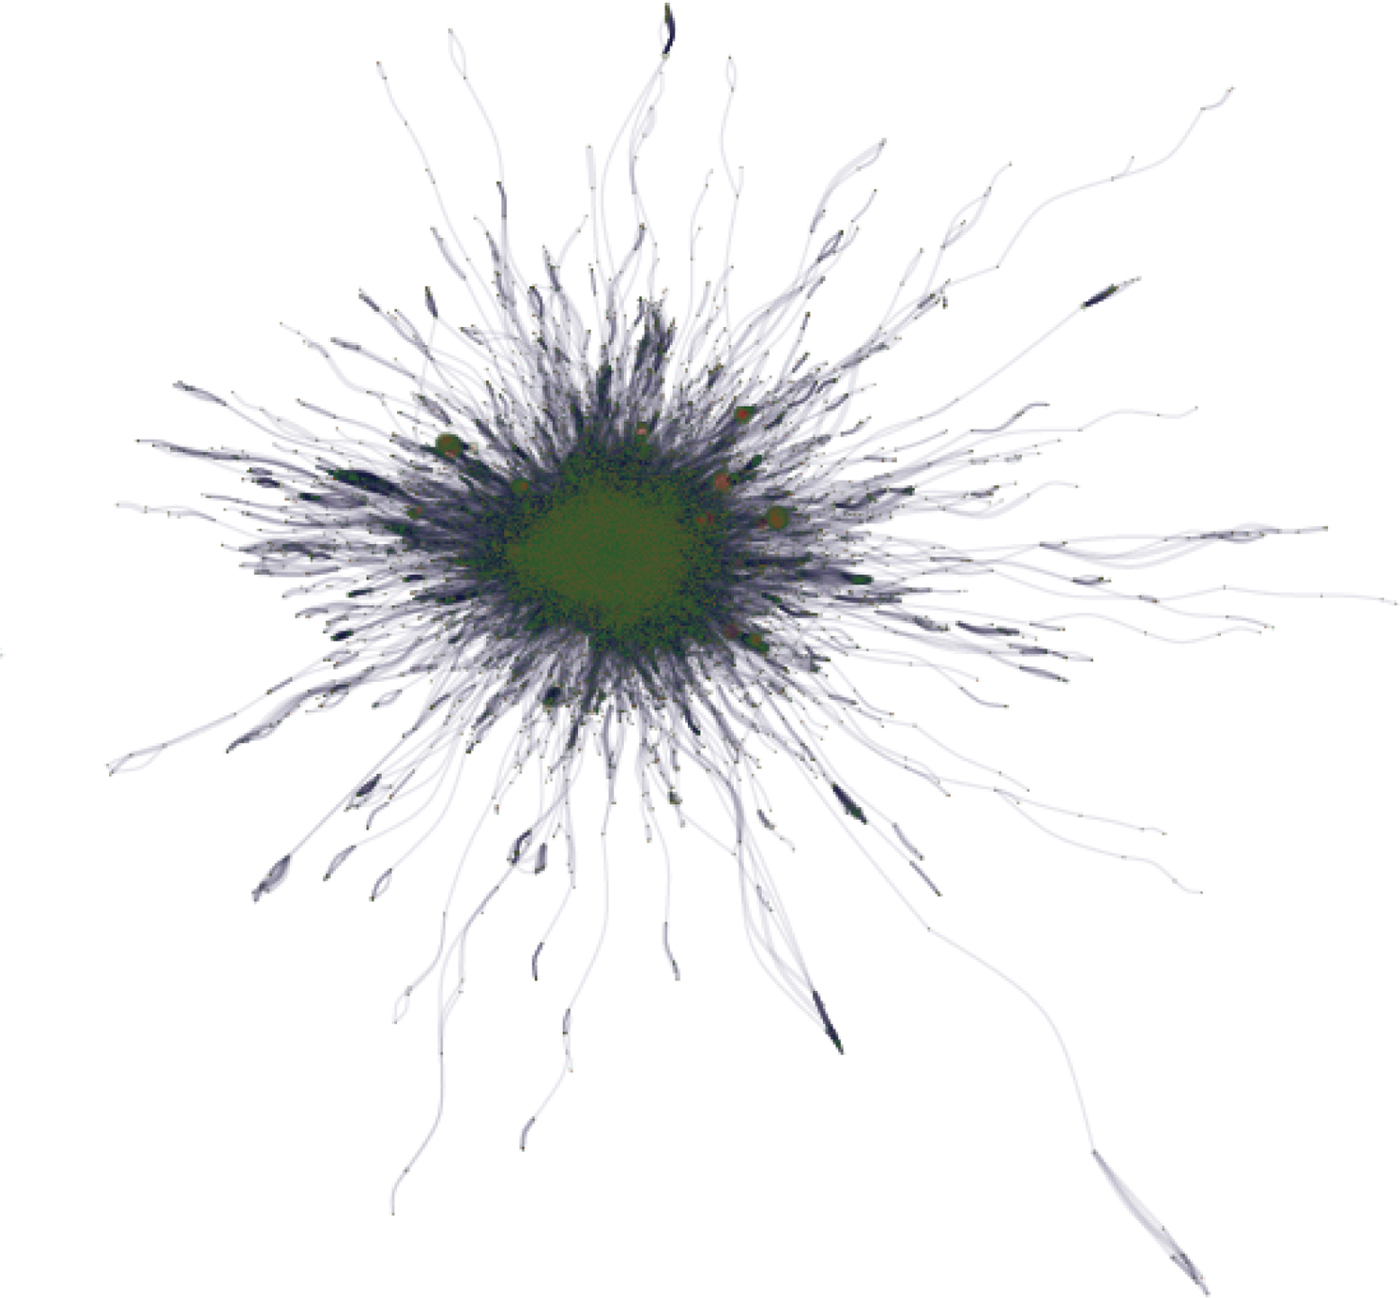
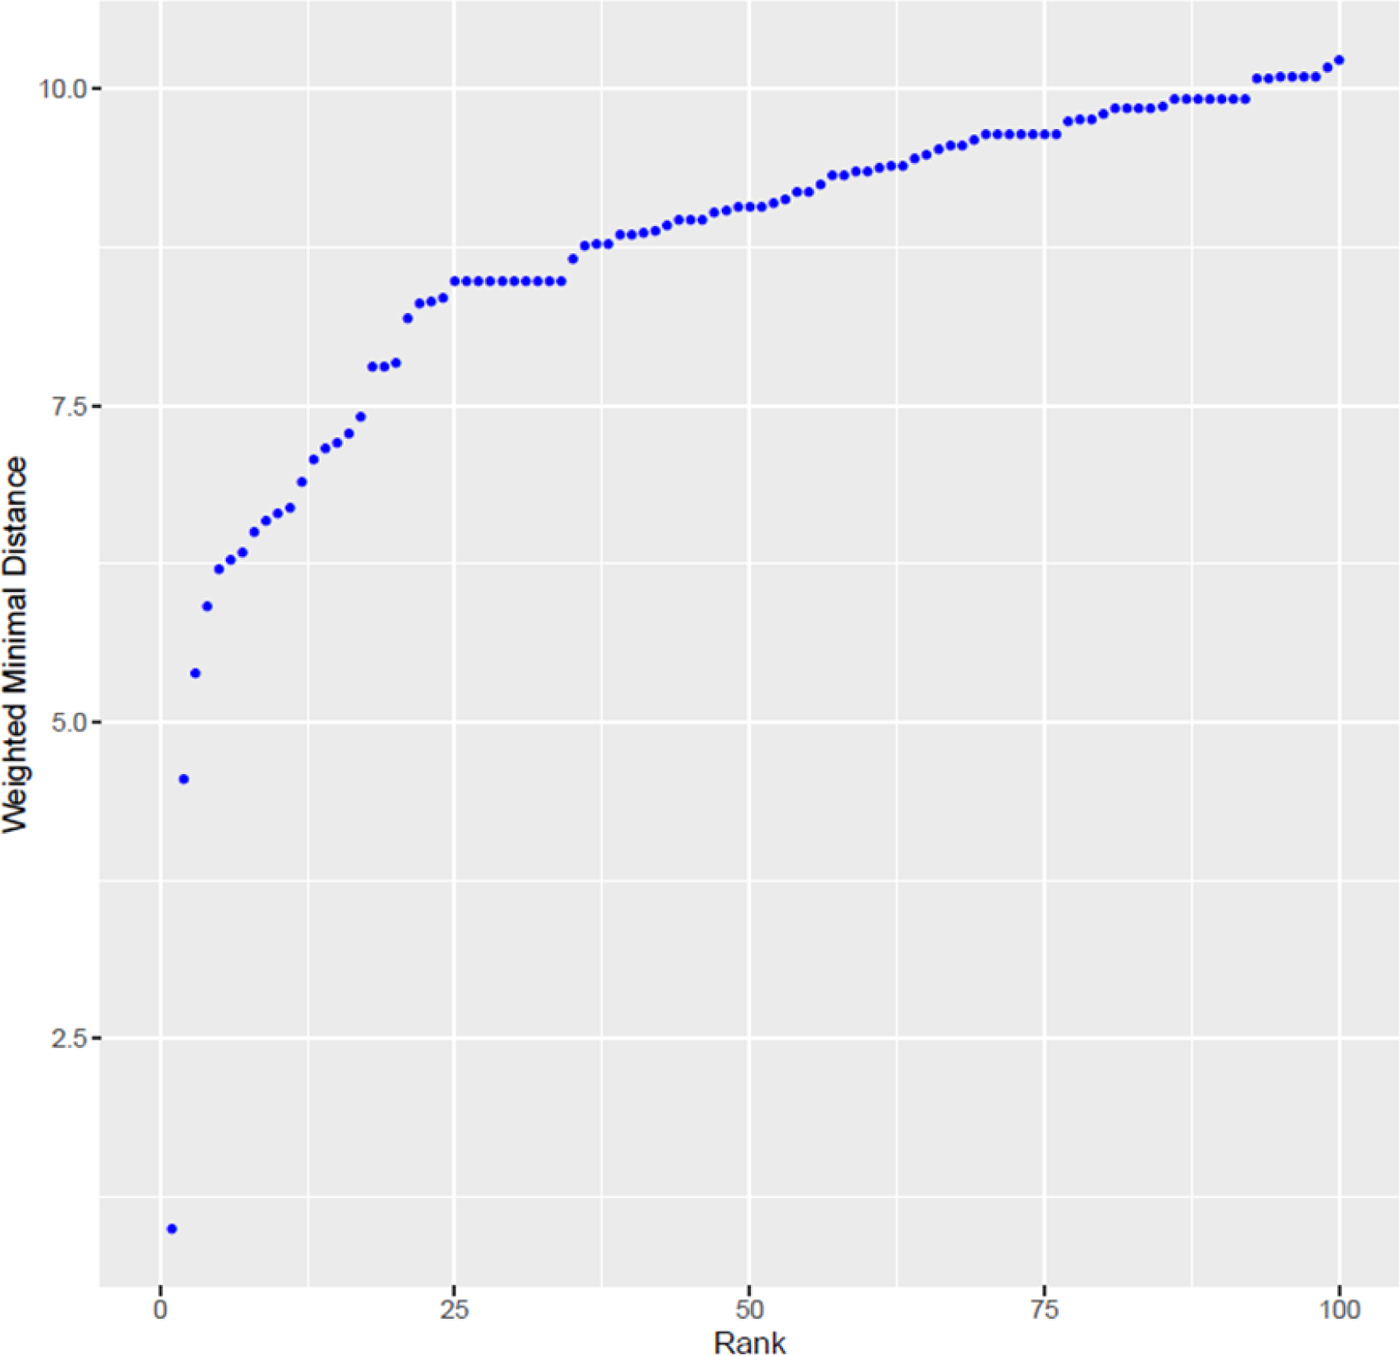
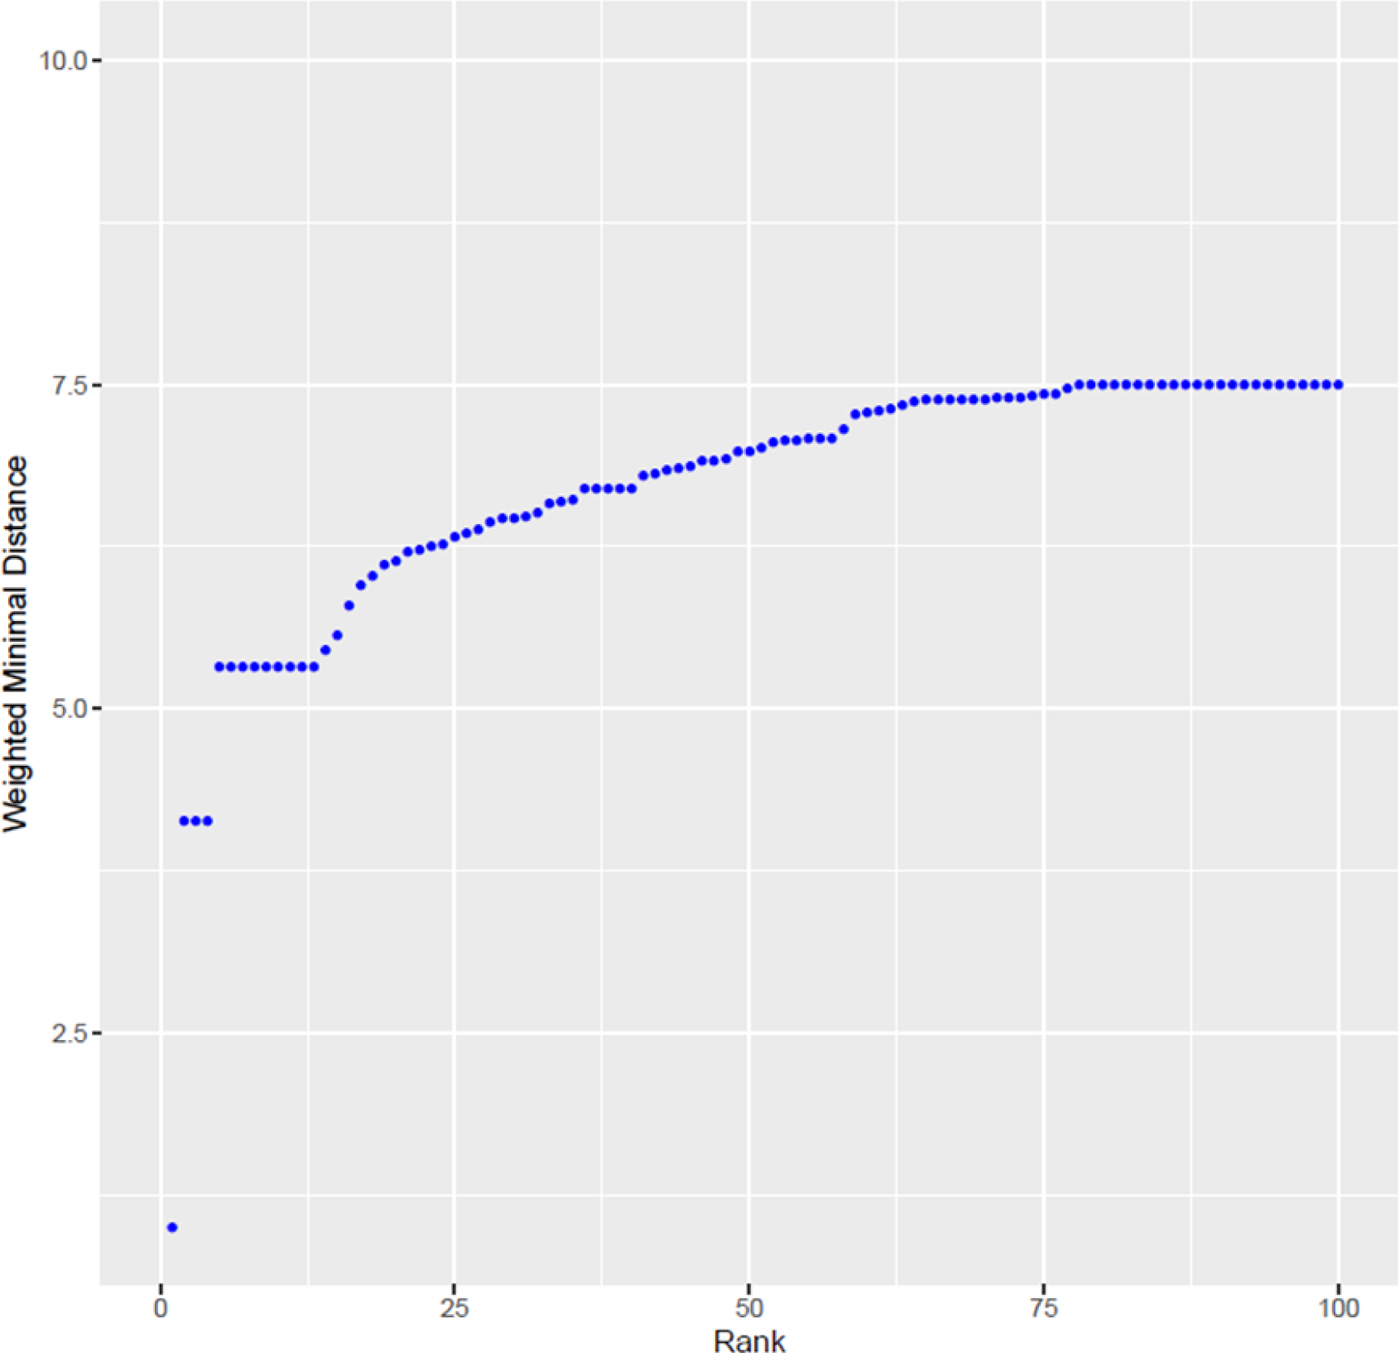
This approach of rolling windows allows our approach to be sensitive to changes in time. Networks connecting firms to the SEC have different topologies in 2003 than in 2010. Figures 4 and 5 illustrate what these large and extremely complex networks, with dense cores look like. While their structure changes over time, it is impossible to make any inferences based on position within these large networks. Positions in the networks need to be compared based on a precise measurement—such as the method of social distance measurement described above. Figures 6 and 7 illustrate the differences in the social distance scores for the “closest” 100 firms in our data, revealing the differences in distribution of such proximity over time.
Network of ties to the SEC for 2003 Constituted by Weighted Employment Ties Between 1998–2002
Network of ties to the SEC for 2010 Constituted by Weighted Employment Ties Between 2005–2009
Top 100 “closest” firms to the SEC in 2003
Top 100 “closest” firms to the SEC in 2010
Measuring The Frequency of Advocacy
In order to know if the social distance between organizations and the SEC correlates with the frequency of their advocacy we need to measure the lobbying activity of these organizations. There are of course multiple ways to examine advocacy activity of firms. One common way is to measure quantities such as spending on lobbying. Another way is to count the volume of comment letters sent to regulators during a formal consultation process. The latter is common in studies of lobbying of financial regulation in particular because business mobilization is, at best, deemed to be both closely linked to the information contained in advocacy letters, and at minimum is traced through simple counts of advocacy letters.Footnote 58 In using a count of advocacy letters to the SEC, we follow well-established literature on the study of interest group activity that uses such data as a way to trace patterns of interest group activity and to track overall trends in mobilization.Footnote 59 As Pagliari and Young point out, while comment letter responses certainly do not represent the only mechanism available for advocacy, the existing literature regards these responses as nevertheless providing a relatively systematic “trace” of interest group mobilization.Footnote 60
We recorded the names of all organizations and individuals that sent comment letters to the SEC during this time period.Footnote 61 After recording which organizations submitted letters, we were able to count how often each organization lobbied each year and over each proposed rule. This gives us a count of the frequency of advocacy for each organization in the network. In addition to simple counts of letters sent in a given year, we also generated an alternative measure, which calibrates this count to the total volume of advocacy in a given year. After all, not all years are equal in terms of policymaking activity. As such we looked at the lobbying behavior of firms for any given SEC proposed rule in a given year. Just because firm A sends five letters to the SEC about a proposed rule does not mean that it will stand out in the SEC's eyes. Perhaps that proposal is highly salient so the SEC was expecting a lot of letters. If every other firm that lobbies over this proposal also sends five letters, then firm A is acting just like its peers, regardless of its social proximity to the SEC. Furthermore, a firm may have written five letters over one given proposal and no letters regarding the other proposals put forth by the SEC. Consequently, we generated a score on the proportion of total possible proposals over which each firm lobbied in each year. For example, if there were twenty proposals in one year and a firm wrote five total letters regarding four of those proposals, their score would be 0.25. This measure affords insight into the breadth of advocacy in place of simple volume.
4 Analysis of the relationship between social distance and advocacy frequency
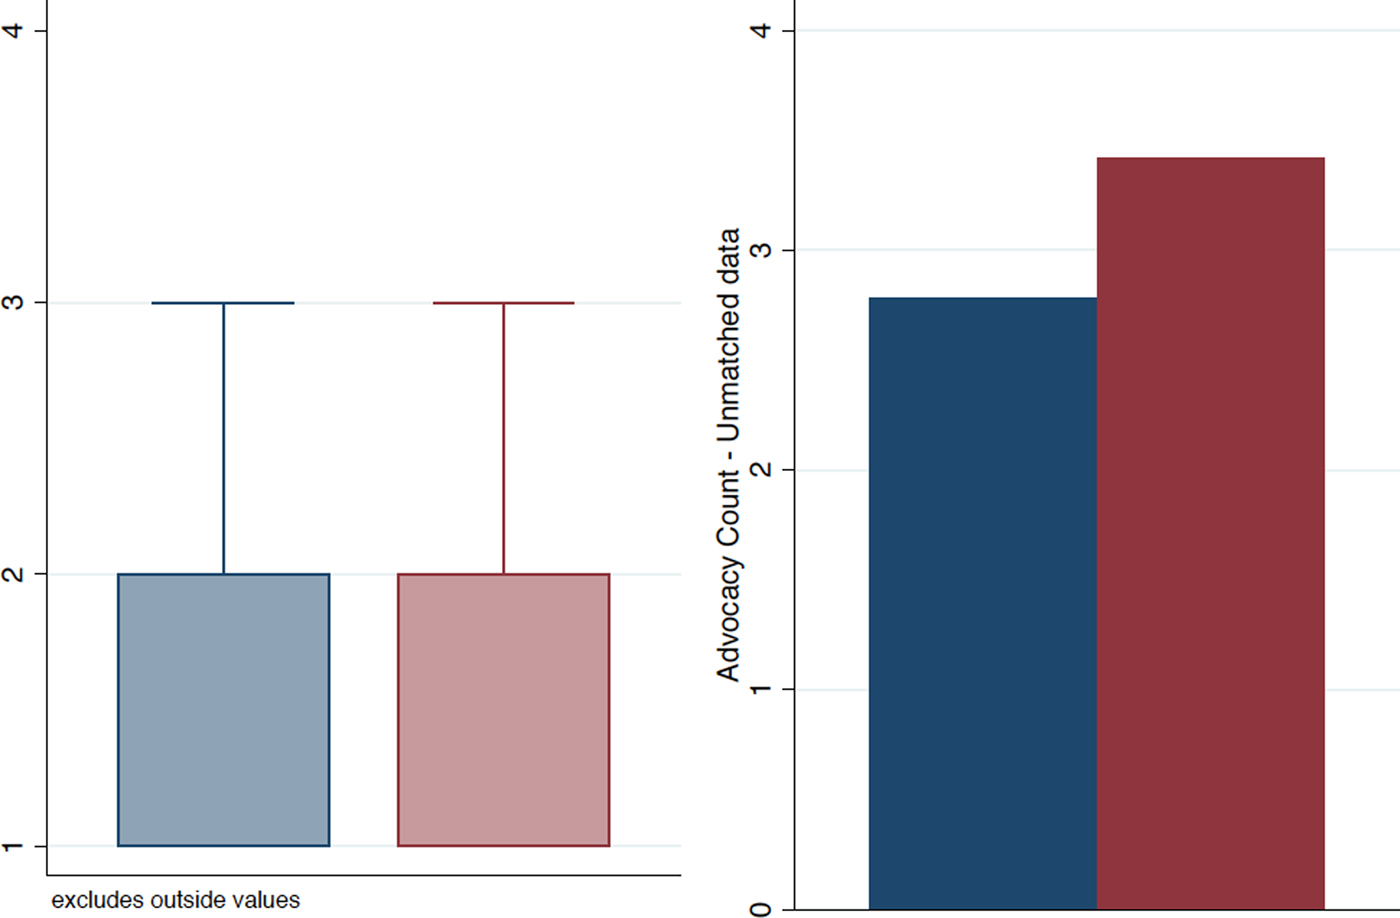
To test our two hypotheses, we need to compare firms' social proximity to the SEC with their frequency of advocacy. To do this we needed to match a large volume of organizations that advocated over at least one SEC regulatory policy proposal between 1995 and 2014 and the much larger volume of organizations that are in our employment network data. This was completed first by identifying partial string matches across the two sets of company names, which were coded for correctness. We then manually connected the social distance and letter data for the top 100 global ultimate owner firms, combining it with the string matching results to generate a larger key of firm names. Of 7,830 different organizations that lobbied the SEC over our time period, we managed to accurately match 3,509 of them (45 percent) into the large SEC-connected employment network described above. This name matching process does not constitute a random sample. However, it also does not represent a subset of the data that would be prone to likely bias on either social distance or advocacy behavior. This is because mismatches are associated with the variance in content of firm names, which is unlikely to be related to other factors. Moreover, the volume does represent a large enough sample to be representative, since the number of matches exceeds the minimal subset for representative coverage. An important question in this context is whether the sample we have is systematically different in terms of advocacy frequency measures. We examined this and found that the matched data had a slightly higher mean level of advocacy than the non-matched data. This is not only due to some large outliers but because there are a larger number of organizations who only lobbied once that were unmatched. Appendix Figure 1 shows the distribution of advocacy frequency counts for all organizations that lobbied the SEC and the matched sample we use in our data.
Some organizations that engaged in advocacy were not found within the SEC-connected employment network for a given year. Such scores of “infinite distance” caused us to generate an inverse measure, whereby these cases have a social proximity score of zero while all others are calibrated above that score. Because we want to understand differences across many different organizations, we also measured our social distance scores against the average of all social distance scores in a given year. (We also test a simpler alternative in a robustness check, see regression results below) We pooled the data by year because we are not interested in conducting a time-series panel analysis. To calculate the averages, we take the simple average level of social distance and advocacy frequency measures for a given organization over the time period. Consequently, all organizations lobbied the SEC at least once in the data are reported below. It is important to note that the members of the network do not change between the five-year periods of our networks. We do not bias our results by restricting each network to only those organizations that lobbied frequently in a given five-year period.
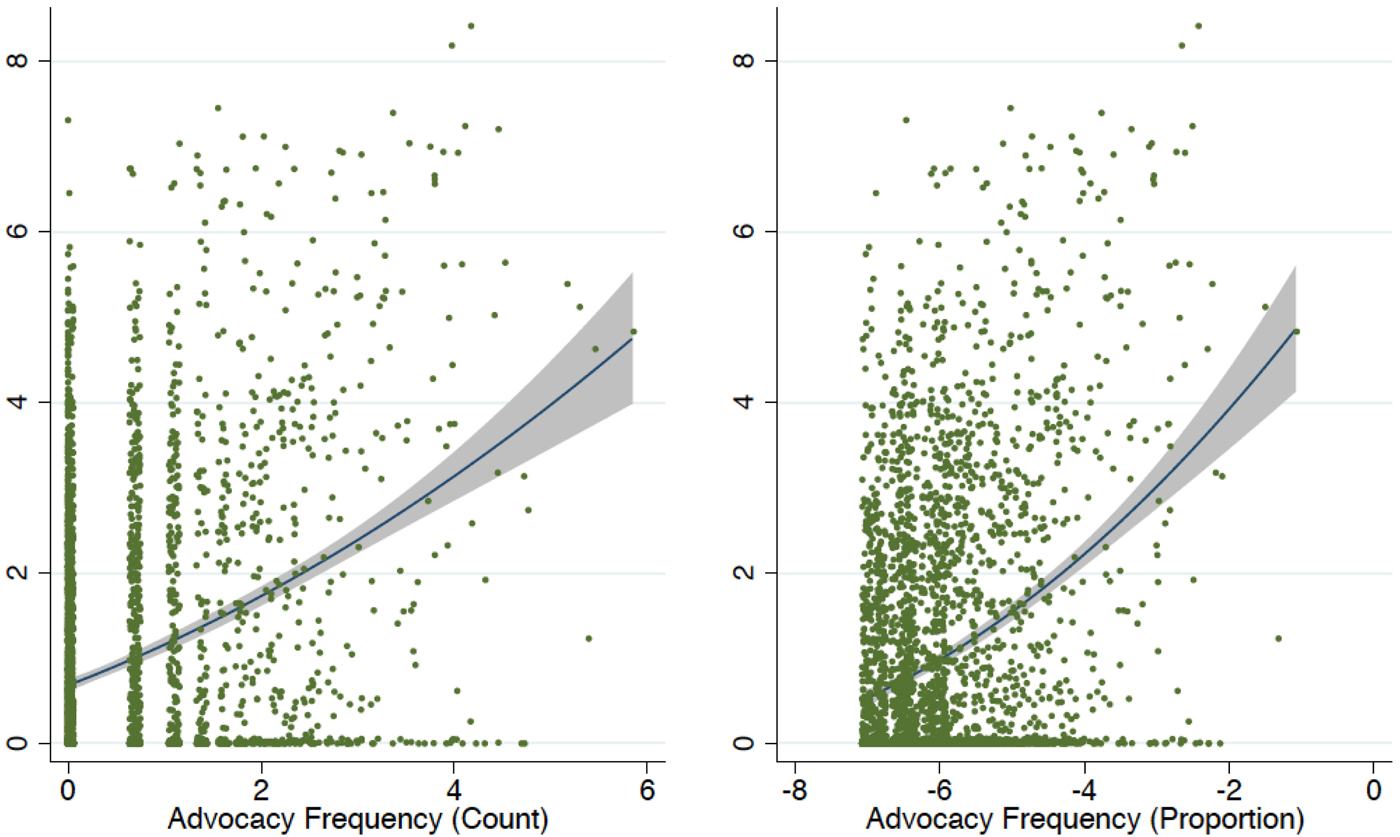
To test our hypotheses we first plotted the simple relationship between advocacy frequency and social distance. Because of the distribution of advocacy frequency (and its likely diminishing returns), we took the natural logarithm as our measure for visualization. Figure 8 and 9 below plots this relationship between social distance and advocacy frequency, and fits a quadratic trend line, with 95 percent confidence intervals, to capture any nonlinearities in the relationship. Figure 8 shows this relationship for all organizations that lobbied the SEC, and shows a positive relationship both when we measure advocacy frequency by means of a simple count and when we measure it as a proportion of all lobbying. Figure 9 then offers the same analysis but with only financial industry firms included in the sample.
Relationship between advocacy frequency and social distance to SEC
Relationship between financial firms' advocacy frequency and social distance to SEC
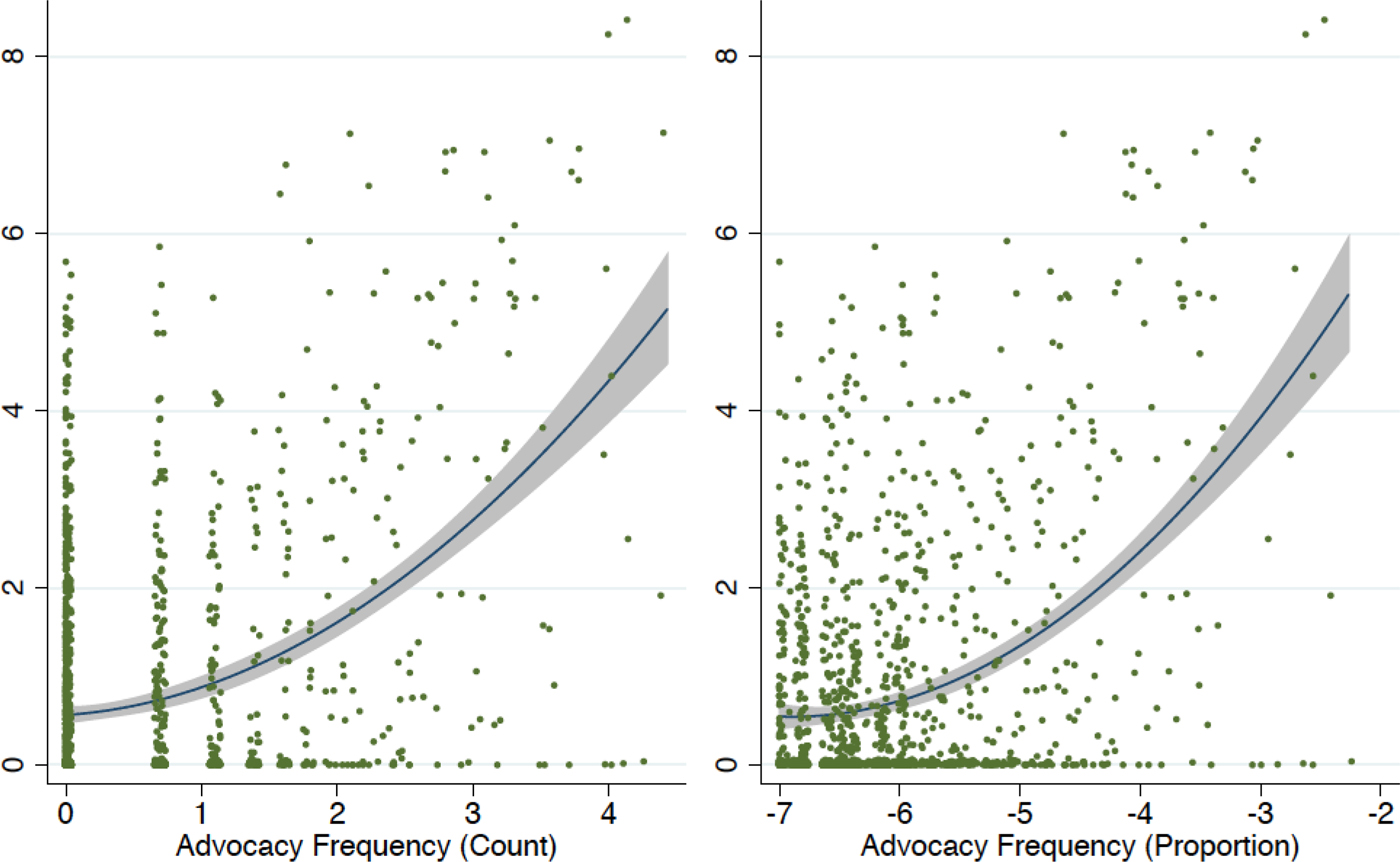
These results show a positive relationship between social distance and advocacy frequency; firms “closer” to the SEC in the employment network tended to submit more letters, according to both measures of letter count. When interpreting the plots it is important to remember that a social distance of zero (on the y-axis) represents infinite distance to the SEC. As the value of the y-axis increases, social distance between an organization and the SEC decreases (the organization gets closer to the SEC). This relationship offers tentative validation for H1, that firms advocate more frequently when they are closer to their regulatory body.
We then sought to explore the extent to which this positive relationship between social proximity and advocacy frequency held up in a statistical environment in which we controlled for various characteristics that might condition this relationship. To do so, we first coded whether or not a given organization was a business association, as this may induce more frequent lobbying. As the financial sector has perhaps the greatest incentive to be close to the SEC we coded whether an organization was a financial organization or not. The SEC has also been documented in earlier work to be close to the legal profession;Footnote 62 moreover, because many organizations that lobby the SEC are themselves registered legal lobbying organizations, we coded whether an organization was a law or formal lobbying organization or not. Organized labor is understood to be socially distant to the culture of the financial community and an infrequent mobilizer over financial regulationFootnote 63 and, thus we coded this as well. Finally, because the strucutral prominence of a given organization may make a difference (it could be potentially exercising structural power advantages in its advocacy strategyFootnote 64 ) we coded whether or not a given organization (always a firm) is an extremely large firm, ranked by assets. This overrepresents financial firms but as we already control for that factor, we believed it to be a good control for potential confounding effects of structural prominence on the relationship we seek to measure. Of the largest 100 firms in the world, only forty-seven of these lobbied the SEC during the period.
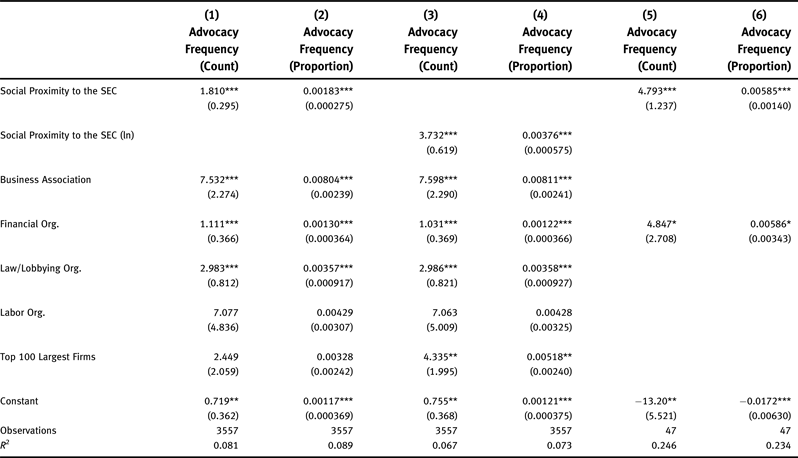
Table 1 below reports our regression results. Model 1 and 2 are simple linear regressions which use the full battery of controls against the net effect of social proximity to the SEC. Model 1 uses the simple count of advocacy letters sent to the SEC as the dependent variable, while model 2 uses the proportional score discussed above. To test our findings further models 3 and 4 take the natural-logarithm measure of social proximity as the key explanatory variable.Footnote 65 Models 5 and 6 restrict the sample to only the structurally prominent firms to see if the relationship still persists. In the last two models, the only control that is present is whether or not a firm is a financial firm (since all observations are firms and none are legal/lobbying firms).
Regression results for effect of social distance on advocacy frequency
Notes: Standard errors in parentheses, *p < 0.10, **p < 0.05, ***p < 0.01
In each model, social proximity to the SEC is significant at the .01 level, and the relationship is positive. This suggests that organizations that are socially closer to the SEC will lobby more frequently than organizations that are socially further from the SEC. The magnitude of this effect on the frequency of lobbying is greater when we restrict our analyses to only structurally prominent firms, as in models 5 and 6. This means that while social distance affects most organizations, it has a stronger effect on structurally prominent firms. This is significant for studies of different forms of social distance, such as the revolving door and regulatory capture. These literatures show a concern about the influence of structurally powerful firms on their regulators. Our results indicate that structurally powerful firms that are closer to the SEC attempt to influence the SEC through comment letters more frequently than their peers that are less close. Even amongst structurally prominent firms, social distance matters. This finding adds to the recent interest in exploring the differences among firms which are structurally prominent.Footnote 66
These results do not indicate that as a particular organization moves closer to the SEC, it advocates more frequently. We would have to track the changes in the social distance of each organization over the period of our study in order to make this conclusion. Instead, our findings point to general results over the time period under study. Our analysis enables us to see that social distance in an employment network is systematically related to advocacy behavior, regardless of the organizational identity of those within the network. Future research could track the changes in social distance and advocacy behavior at the level of the individual organization, and examine advocacy strategy in a more fine-grained way at that level.
Not surprisingly, being a business association, a financial firm or a legal firm is also associated with a significant statistical increase in an organization's lobbying frequency in each of our models, while being a labor union has the opposite effect. Such findings are complementary with recent research that suggests a crowding of not only the financial industry, but business in general, into financial regulatory politics and few countervailing groups.Footnote 67 Importantly, in models 1 and 2, being a structurally prominent firm does not significantly correlate with higher advocacy frequency but a significant correlation does exist for models 3 and 4. This suggests that the importance of being a structurally prominent firm is sensitive to the measurement of social distance (i.e., whether a natural log measurement is used or not). Consequently, we wanted to explore whether only the top 100 firms shared the same general pattern being tested in our hypotheses.
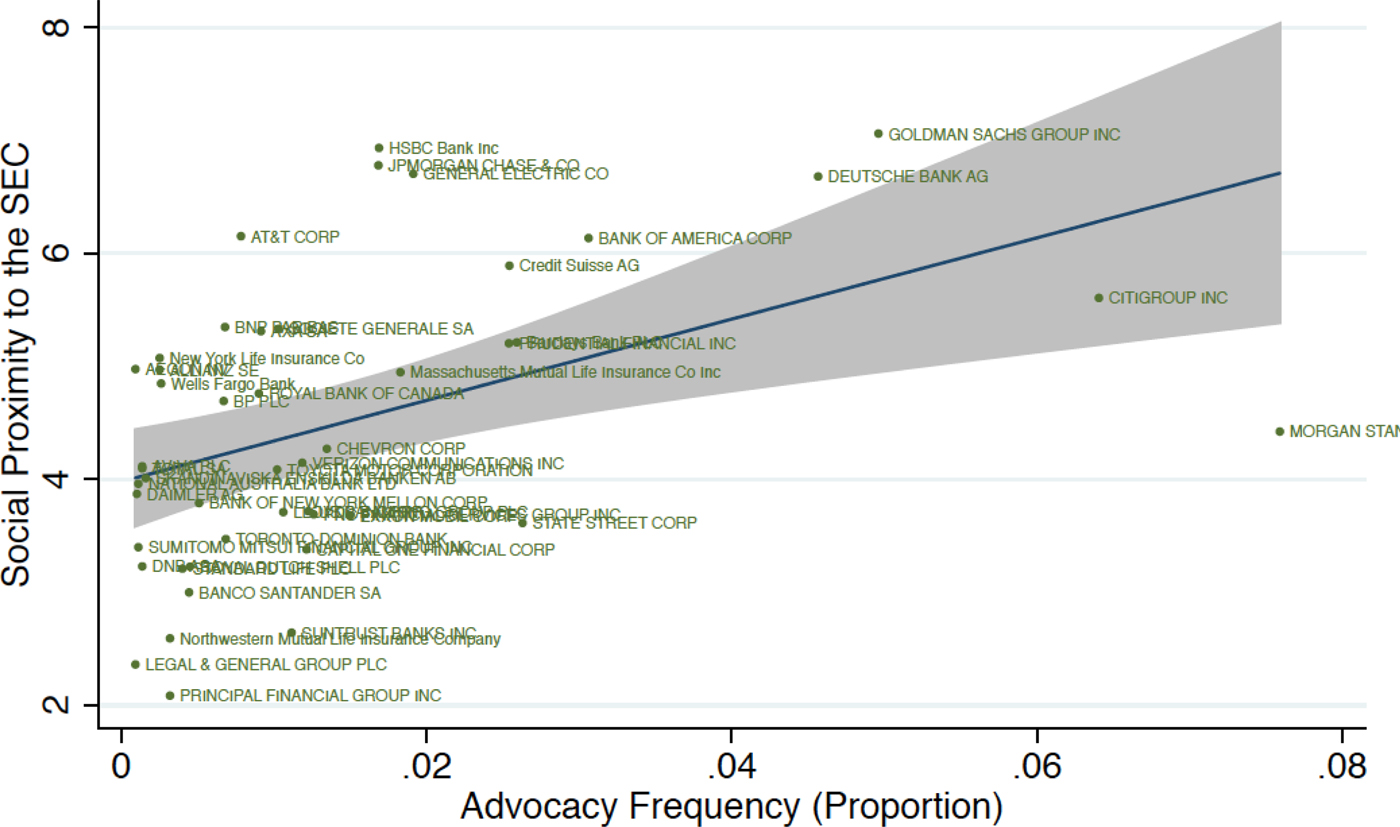
Models 5 and 6 are restricted to only the top 100 firms ranked by assets. In these models we test how variations in social distance among the top 100 firms affect the advocacy behavior of the top 100 firms. The control variable for the top 100 firms is not applicable to these models since all the firms in the models are top 100 firms and thus no results for the control are presented in models 5 and 6. There are no business associations, labor unions, or law firms among the top 100 firms so these controls also are not reported in models 5 and 6. Regression results show that, among structurally prominent firms, those that are socially closer to the SEC do lobby more frequently. Figures 10 and 11 below illustrate the results for just the forty-seven structurally prominent organizations in our sample.Footnote 68 By both measures, there is a positive relationship between social distance to the SEC and how often these firms lobby the SEC. This offers further compelling evidence in favor of H1, with the ability to see individual cases.
Largest corporations in the world by assets
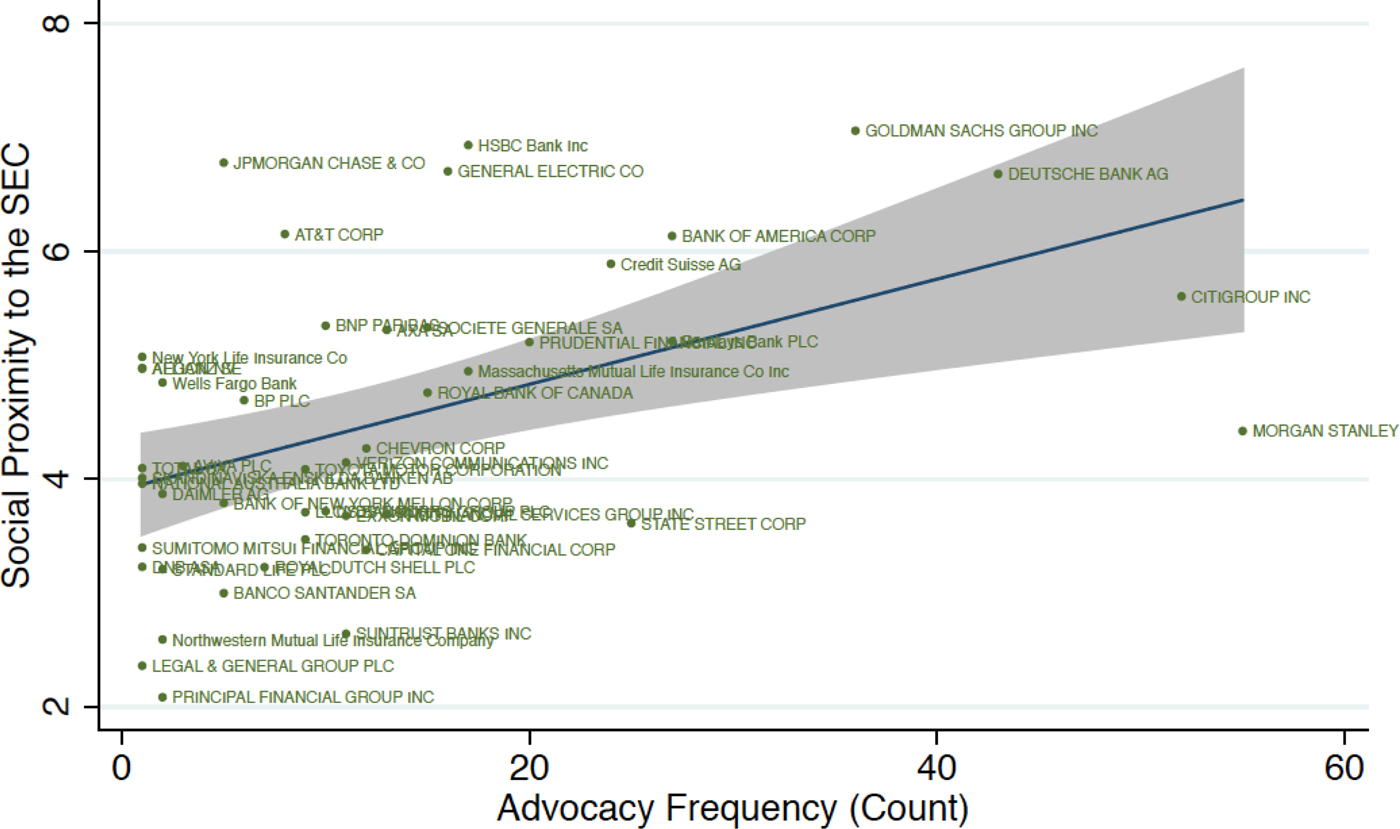
Largest corporations in the world by assets
Conclusion
Social relationships between financial firms and financial regulators have been a mainstay of discussions about financial regulation for some time. We have argued that a latent concept within much of literature is that of “social distance”—existing scholarship describes existing relationships and diagnoses these in terms of how “close” or “distant” a given organization is to a regulatory agency at a given point in time.
While notions like social distance are widely acknowledged and discussed, social scientists are only just learning to measure and assess these relationships empirically. We have argued that network analysis can aid in the empirical measurement of social distance, how it varies over time, and how it varies from one organization to another, vis-à-vis a specific financial regulator. Of course, social relationships are extremely complex and as such call for multiple avenues of analysis to understand this complexity. Yet network analysis helps accommodate part of this complexity and can be complementary with other methodological tools.
Our analysis focused on the frequency of lobbying directed at the U.S. Securities and Exchange Commission (SEC). Using a large sample of approximately 3,500 organizations, all of which lobbied the SEC at least once, we found that social proximity between firms and the SEC was positively related to the advocacy frequency of these firms. Firms that are closer to the SEC—in particular, prominent firms (which tend to be close already)—tend to advocate more. This is significant for the study of interest groups in the financial sector because there is little known about what induces variation in advocacy behavior to begin with. Social proximity—a long theorized concept running through a great deal of political economy scholarship from analyses of regulatory capture to regulatory independence to revolving door analyses—can be shown to have a significant association with the frequency of advocacy.
One important question that we cannot answer in this study is the causal direction of the relationship we identify. Do organizations move closer to their regulator because they want to lobby more or do they lobby more because they move closer? Future research could address this question with the use of time series panel data and by exploiting change in social distance as a potential variable, which is a possibility stemming directly from the approach used here. The ultimate question pertaining to the relationship between social distance and advocacy frequency, however, does not require a temporal dimension. Our work uncovers important dynamics of advocacy rooted in elite social relationships, and lays the groundwork for further investigation of this phenomenon in a temporal framework.
The method of analysis that we deploy has ramifications for studying social distance in other contexts and potentially for analyzing complex systems within the financial system more generally. We think there are two promising directions of future research opened up by our findings. The first focuses on better understanding the overlapping networks of financial regulation. Global finance has many regulatory bodies (public and private regulatory bodies) operating at different geographic scales (national, sub-national, and international). Taken as a whole, the global financial system exhibits characteristics of polycentricity.Footnote 69 Future research could map out the social distance between regulators other than the SEC and the organizations that lobby them, acknowledging this polycentricity of the regulatory arena. This would enable us to know if the relationship between social distance and advocacy behavior is a phenomenon general to global finance or particular to only specific financial regulatory authorities or specific arenas of governance.
Other future research could focus on the agency within a given network's evolution over time instead of the structure of the network in a static setting. As we mention above, tracing the movement of structurally prominent firms through a network over time would enable us to know more about the corporate strategies of these firms. If we do not assume that all actors have the same goals, share the same beliefs, or use the same cognitive processes to make a decision,Footnote 70 then we can understand how actors carve out niches that satisfy their interests within complex social networks. In financial markets, this can lead firms to pursue different risk behaviors. Where some firms see too much risk others see high profit opportunities. Firms that pursue similar risk strategies create niches for themselves within the ecology of finance. Future research could determine if firms also prefer to differentiate themselves from others in their social distance to regulators. Just as firms clump together in niches of risk behavior, so they might clump together in niches of lobbying strategies based on social proximity.
Appendix
Distribution of advocacy frequency (All advocacy data in blue, matched advocacy data used in analysis in red)
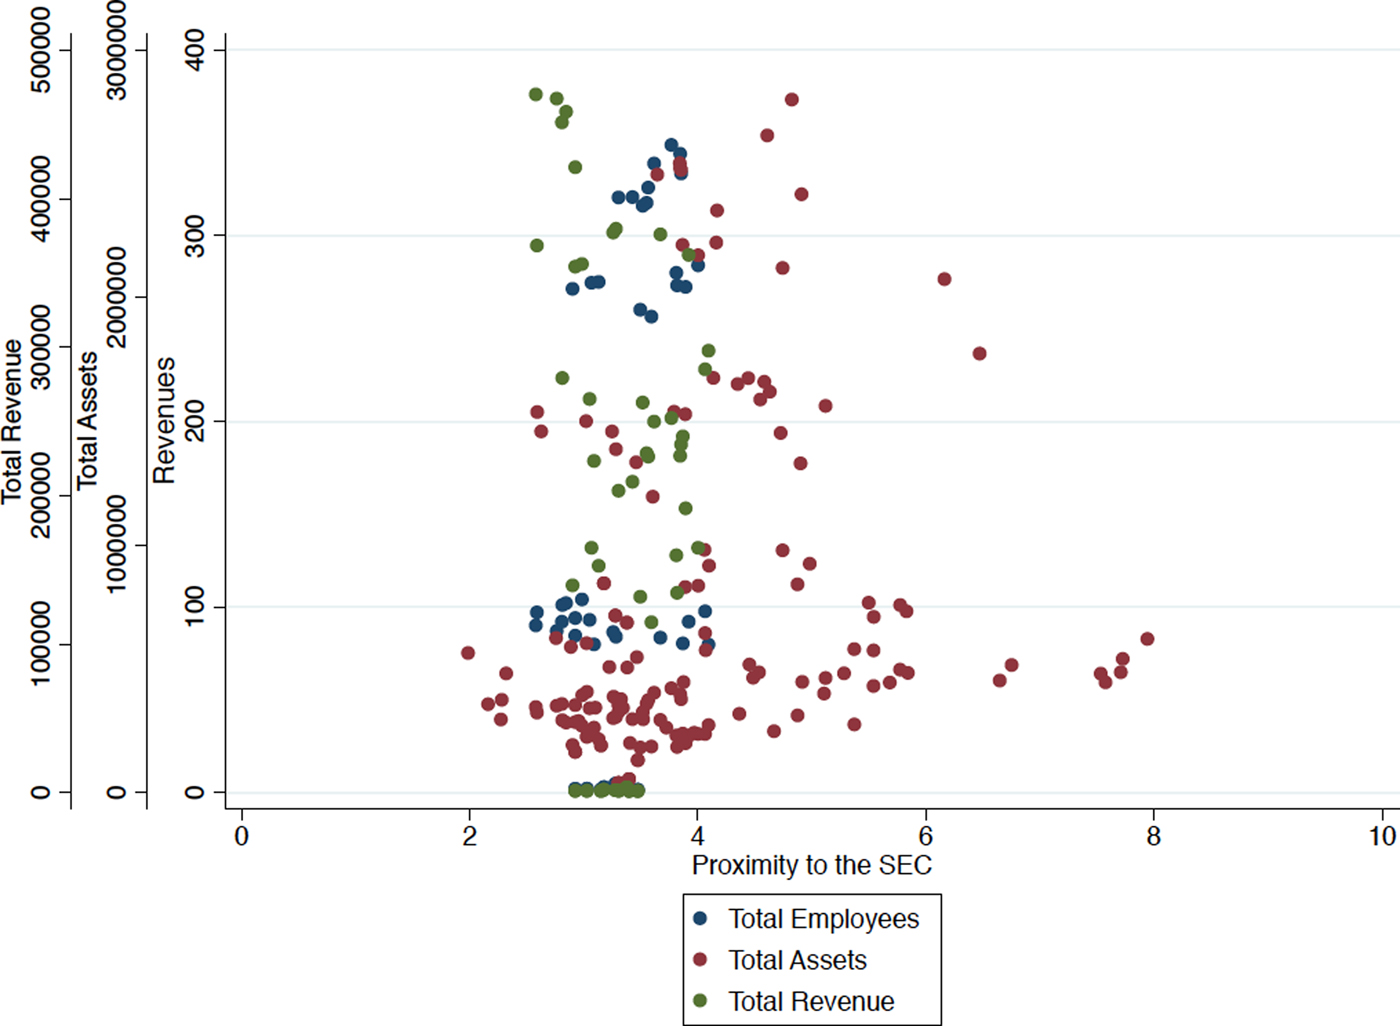
Firm size and social proximity to the SEC: Total employees, total assets, and total revenues (millions of USD)