

Introduction
Since the discovery of the remote South Atlantic island of St Helena in 1502 its endemic avifauna has been subject to the effects of large-scale environmental damage and has fared particularly badly. The island's natural vegetation, predominantly woodland, has been almost entirely destroyed by over-grazing, deliberate removal and inappropriate agricultural practices. Indigenous plant communities are now largely confined to small tracts on the highest ridges.
At least nine endemic bird species are known to have occurred on the island (Olson Reference Olson1975). Eight of these are now extinct and it is likely that the disappearance of at least six has been due to anthropogenic factors. In addition, at least six wider-ranging seabird species have been lost as breeders from St Helena during the historical period.
The only endemic bird now surviving on St Helena is the Wirebird or St Helena Plover Charadrius sanctaehelenae, a close relative of Kittlitz's Plover C. pecuarius and the Madagascar Plover C. thoracicus. Despite recent interest, the Wirebird remains a relatively poorly known species. Only three short studies of its ecology have been carried out to date (Alexander Reference Alexander1985, McCulloch Reference McCulloch1991, Reference McCulloch1992, McCulloch and Norris Reference McCulloch and Norris2002). Data on a number of aspects of Wirebird behaviour, breeding biology and, in particular, demography are therefore limited. Current information indicates that the Wirebird's ecology and behaviour are broadly typical of the African sand plovers but all observations have necessarily been made under recently prevailing conditions and nothing is known of the ecology of the species or population size prior to the environmental degradation that occurred following human colonisation of the island.
The Wirebird has the smallest range of any Charadriiform bird – the area of St Helena is 122 km2 and only some 30 km2 has been regularly used by Wirebirds during the past 20 years (McCulloch and Norris Reference McCulloch and Norris2002). Only 10% of this area is currently covered by protective legislation. All Wirebirds today utilise an environment substantially altered by human activity. The majority are currently dependent on wholly anthropogenic habitat in the form of dry, middle altitude pastureland. Most of the remainder inhabit the peripheral semi-desert areas, which are probably broadly similar to the species’ natural habitat. During the 1988–89 survey the average Wirebird density on pasture was almost three times higher than in semi-desert, with the largest number of individuals being found on Deadwood Plain, a 200 ha grassland site in the north of the island (McCulloch Reference McCulloch1991).
Very little is known about past variation in numbers and distribution. Prior to the work of Alexander in 1984, assessment of Wirebird numbers tended to be based on subjective impressions gained during short visits rather than on systematic counts. Even Alexander's figure (200–300 individuals) was based partly on extrapolation because of incomplete coverage of sites (Alexander Reference Alexander1985). This has resulted in a disparity of published estimates, ranging from “not more than 100 pairs” (Haydock Reference Haydock1954) to “just under 1000” (A. Loveridge, in Pitman Reference Pitman1965), from which it is difficult to discern any historical trends or patterns of fluctuation.
In 1988–89 the first full censuses were carried out and the three counts undertaken in 1989 produced a mean of 425 adult individuals (McCulloch Reference McCulloch1992). During the early 1990s, surveys by St Helena's Agriculture and Natural Resources Department (ANRD) indicated a substantial decline to less than 350 individuals (R. Cairns-Wicks in litt. 1994). This led to the Wirebird being classified as ‘Endangered’ by IUCN and BirdLife International (BirdLife International 2000). Research carried out during the period 1998–2001 confirmed that a decline had taken place and evidence suggested that agricultural changes, particularly reduction of livestock numbers at a small number of key pastureland sites, had been an important factor (McCulloch and Norris Reference McCulloch and Norris2001). By 2000–01, however, numbers appeared to be stabilising and a mean of 362 adults was recorded (McCulloch and Norris Reference McCulloch and Norris2002). Surveys of the 11 most important Wirebird sites by ANRD in early 2005 suggested that the species was again declining and that the rate of decline had increased.
St Helena is a UK Overseas Territory and supports a human population of some 4,000. Access is currently only possible by sea. As a result, the island's economy has long suffered from its extreme isolation. In an attempt to rectify this situation, the construction of an airport on the island has recently been proposed. This project, and subsequent spin-off development, has the potential, if not sensitively managed, to have a large negative impact on indigenous biodiversity in general and the Wirebird in particular. The danger has been recognised by both the UK and St Helena Governments and a wide-reaching Environmental Impact Assessment programme for the airport project was initiated in 2005. This provided an opportunity to reassess the status and distribution of the Wirebird and the condition of its habitat. The results of a census carried out between November 2005 and January 2006, which confirm the recent decline, are presented below. It was not possible to carry out a full investigation of the causes of decline within the time available but preliminary analysis of habitat change from two major Wirebird sites is also included and other possible contributory factors are discussed.
Methods
All 31 Wirebird sites identified during the 1988–89 study were re-censused between 21 November 2005 and 16 January 2006 using identical methods to those of 1988–89 and 1998–2001 (see Figure 1 for site locations). Investigation of changes in vegetation composition and structure was constrained by both the terms of reference of the environmental impact assessment and the limited time available. Consequently, vegetation surveys were carried out only at the two sites (Prosperous Bay Plain and Deadwood Plain) likely to be directly affected by the airport development. The results of the vegetation surveys were compared with those obtained during 2000–01. The abundance of invertebrate prey at Deadwood Plain was also compared with 2000–01 levels.
Map of St Helena showing Wirebird census areas (numbered). Sites were classified as dry grassland (DG), wet grassland (WG), semi-desert (SD) or other (O) (see Estimation of Wirebird numbers for details). Areas lacking a specific local name have been given names of convenience and are indicated by an asterisk. Key: 1. Cow Path/High Knoll (O); 2. Donkey Plain (O); 3. Cleugh's Plain (O); 4. Rosemary Plain (DG); 5. Francis Plain (DG); 6. Barren Hill (WG); 7. The Dungeon (WG); 8. Prospect Pastures (WG); 9. Sane Valley (DG); 10. Banks’ Ridge (SD); 11. Deadwood Plain (DG); 12. Longwood Farm (DG); 13. Longwood Golf Course (DG); 14. Bottom Woods (DG); 15. *Longwood Erosion Zone (SD); 16. *Weather Station Ridge (SD); 17. Horse Point Plain (SD); 18. *Prosperous Bay North (SD); 19. Fisher's Valley Pastures (DG); 20. Prosperous Bay Plain (SD); 21. *Upper Prosperous Bay (SD); 22. Woody Ridge (DG); 23. Stone Top Ridge (SD); 24. *Central Pastures (WG); 25. Pouncey's (WG); 26. Oaklands Pastures (WG); 27. Broad Bottom (DG); 28. Horse Pasture (O); 29. Blue Hill/Head o’ Wain (WG); 30. *Southern Pastures (DG); 31. Man and Horse (DG).

Census
Wirebirds are territorial, relatively tame, reluctant to fly and are easily detectable within open habitats. This has allowed direct counts to be made with a good level of accuracy since 1989. Census areas were delimited on the basis of habitat discontinuities or major physical features. The sites can be classified into three habitat categories: dry grassland, wet grassland and semi-desert (see Figure 1). These were defined on the basis of altitude, rainfall and vegetation communities. Dry grassland generally lies at 400–600 m a.s.l., receives less than 600 mm rain annually and has a moderately dense sward well mixed with broad-leaved herbs and interspersed with patches of bare earth. Wet grassland typically lies above 600 m, has an annual rainfall exceeding 600 mm and is characterised by a lush, herb-poor sward containing a relatively high proportion of coarse, tussock-forming grasses. In cases where large grassland sites extended over a wide altitudinal range (e.g. Broad Bottom) classification was weighted by the nature of the vegetation in those areas of the site most heavily used by Wirebirds. A small number of heavily man-modified sites did not fit readily into this classification and were grouped in the category ‘other’.
At each site birds were counted along a transect route that brought the observer within 25 m of all points within the site boundary. Birds were allocated to three age classes: adult, juvenile and chick. Juveniles included all fledged birds not yet in full adult plumage; chicks included those in down and those feathered but not yet fledged. Birds only seen in flight were excluded, as were those that flew in and landed from the direction of areas of the site already surveyed. Multiple counts obtained using this method in 1988–89 and 1998–2001 have produced good levels of consistency within seasons (McCulloch Reference McCulloch1991, McCulloch and Norris Reference McCulloch and Norris2002).
Vegetation survey
The condition of Wirebird habitat, with respect to vegetation composition and structure, was subjectively assessed at all 31 sites visited during the census. This was based on personal experience of these sites during previous visits to St Helena at the same time of year. A similar comparative assessment of intensity of grazing was also made at grassland sites.
Changes in vegetation cover were investigated by sampling at Deadwood Plain and Prosperous Bay Plain. These areas are both important Wirebird sites and are typical of the dry grassland and semi-desert habitats respectively. Observations throughout the island indicated that vegetation changes at these sites were typical of those generally occurring within these habitats.
Vegetation cover was sampled using quadrats of 0.25 m2 area laid at a frequency of one quadrat ha−1. At Prosperous Bay Plain, quadrats were laid within sub-sets of 10–20 (total 180). As several well-defined vegetation communities occurred in discrete patches within the site, the number of quadrats allocated to each vegetation type was proportionate to its total area so as to ensure a representative coverage of the whole area. At Deadwood Plain, distribution of quadrats (total 300) was based on the 19 paddocks that comprise the census area. The number of quadrats allocated to each paddock was based on the area of the paddock and ranged from 13 to 40 and was proportional to area for those paddocks larger than 5 ha.
At both sites, the position of each quadrat within each sub-set was randomized. From a starting point in approximately the centre of each sub-area or paddock, the direction taken and distance moved between individual quadrats were determined using computer-generated random numbers. Two series of numbers were used. The first, varying between 1 and 12, determined the direction from the starting point in terms of a clock-face. The second series, ranging from 1 to 100, indicated the number of paces to be moved. If a boundary was encountered before the required number of paces was completed, the surveyor retraced the line of approach for the remaining distance. All species present within each quadrat were listed and the percentage of the total area covered by each species, or by bare earth, rock or dung was recorded. The data were further grouped into broad summary groups: grasses, herbs, shrubs (woody species) and ‘minor vegetation’, the latter including bryophytes and lichens. Percentage coverage by each of these classes was also calculated for each quadrat and averaged over the site.
Point sampling of sward height was carried out for each of the 16 individual paddocks making up Deadwood Plain sensu stricto. The three remaining peripheral paddocks were excluded as these were either already severely degraded or not sampled in 2000. An identical number of points to those sampled in 2000 were sampled in each paddock at randomized positions (number of paces) along transects traversing the paddock starting from, and perpendicular to, points themselves selected at random from a pool of numbered fence-posts. In larger paddocks, sampling was stratified by area on the basis of physical features or vegetation discontinuities to ensure proportional coverage of all parts of the paddock. The tallest point of non-woody vegetation closest to the tip of the observer's leading foot was measured to the nearest millimetre using a metre stick. Vegetation at Prosperous Bay Plain is generally of such patchy occurrence and low density that its height has little bearing on Wirebird behaviour and therefore no measurement of sward height was made at this site.
In addition to the main vegetation survey, ten quadrats were laid independently at random positions within each Wirebird territory at both sites. In cases where birds were incubating, or had young chicks, this was done cumulatively over two to three days. Percentage vegetation cover was recorded and the component means across all territories were compared with those for the site as a whole in an attempt to identify key vegetation or substrate characters that might influence territory location. At Deadwood Plain sward height was also measured at 20 randomly allocated points within each territory.
Invertebrate abundance
The limited observations obtained to date indicate that Wirebirds take a wide range of invertebrate prey, beetles being particularly important (McCulloch Reference McCulloch1992). The abundance of ground-living invertebrates at Deadwood Plain, relative to that observed in December 2000 was estimated by pitfall trapping to assess any change in food supply. Traps were distributed throughout the plain on a random basis, stratified by paddock, with each paddock being allocated five traps. Sampling was carried over a single 24-hour period. The trapping pots used were plastic drinking cups, 9 cm deep and 7 cm diameter. These were placed in holes in the ground with the rim level with the soil surface. Any gaps around the rim were carefully in-filled. The traps contained no fluid and were not covered. Traps were laid in early morning and collected in the same order as they were laid. Animals caught were classified to Order. Very small (< 1 mm) animals were not recorded as they are unlikely to be significant Wirebird prey. Ants were also excluded from the analysis as trapping rates were strongly affected by soil disturbance and the proximity of ant nests to the trap site.
Five pitfall traps were also deployed at randomised positions in each Wirebird territory at this site, independently of the general invertebrate survey.
Statistical Analysis
Population
Population change between December 2000 and this study was assessed by a paired t-test based on figures from individual sites.
The age structure of the Wirebird population was compared with that observed in October/November 1999 and December 2000 by comparing numbers in each age class (adult, juvenile, chick) by means of a contingency (G) test (Sokal and Rohlf Reference Sokal and Rohlf1981).
A single-classification Analysis of Variance was used to test for heterogeneity in the change in numbers among four habitat types (dry grassland, wet grassland, semi-desert, other).
Vegetation
At Deadwood Plain, mean percentage cover for 12 major component plant species and six grouping of species and substrates was compared between December 1998 and December 2005 by means of a series of t-tests (two-tailed) using paired quadrat data (arcsine transformed) from each paddock. A similar test was used to compare vegetation height at this site.
Identical procedure was used to compare vegetation composition between the two years at Prosperous Bay Plain. Quadrats were paired across years within corresponding spatial subsets. Changes in percentage cover by seven individual plant species and three groups of species and substrates were analysed.
Two-tailed t-tests were used to compare vegetation composition (both sites) and vegetation height (Deadwood Plain only) within Wirebird territories with that of the site as a whole.
Invertebrate abundance
At Deadwood Plain, mean abundance for all invertebrates and for beetles was compared between December 2000 and December 2005 by means of a series of t-tests (two-tailed) using paired pitfall trap data from each paddock. Mean catches were also compared between Wirebird territories and the site as a whole. No attempt was made to compare paddock-specific results between years because of the small sample sizes.
Spatial heterogeneity of invertebrate numbers within the site was investigated by comparing catches between paddocks in a single-classification Analysis of Variance.
Results
Census
A total of 235 individual Wirebirds of all ages was found during the census. This figure included 208 adults, 17 fledged juveniles and 10 downy chicks. Counts of adults by site are presented in Table 1. Seven birds were only seen in flight and could not be attributed to a site. These were excluded from the total. No significant difference was found in the age-structure of the population from that observed in October-November 1999 (G 1 = 1.29). The results of all full censuses of the Wirebird population since 1989 are presented in Figure 2.
Wirebird population estimates 1989–2005/06. Figures include all age-classes, as these were not differentiated during the 1991-1993 censuses.

Comparison of habitat quality at lower Deadwood Plain between a) December 1989 and b) December 2005. In 1989 this area was in ideal condition for Wirebirds. Note the increase in sward height by 2005 and the proliferation of the introduced rush ‘Bull Grass’ Juncus capillaceus.

Results of the census of 31 Wirebird sites carried out between November 2005 and January 2006 (adult figures only) compared with the corresponding means of two censuses from 2000–01, two censuses from 1998-99 and three censuses from 1989. Percentage changes from the 2000–01 season to 2005 are also given.

Nineteen of the 31 sites show declines in adult Wirebird numbers (Table 1). Only three sites, Francis Plain, Banks’ Ridge (both minor sites usually holding fewer than six birds) and Woody Ridge, showed an increase. The changes at the former two sites are consistent with short-term fluctuations observed there since 1988. At Woody Ridge, however, the unprecedented increase consisted principally of birds confirmed as holding territories. Declines (excluding sites where numbers are known to vary frequently due to intermittent foraging by non-residents) ranged from 13% (Man and Horse) to 87% (Longwood Farm Pastures), while Sane Valley, Rosemary Plain and Oaklands Pastures appeared to have been completely abandoned as breeding sites. When compared with the mean adult counts for all sites in 2000–01 the current figures represent a statistically significant overall decline of 43% (t = 2.54, dt = 30, P = 0.008). The greatest loss in absolute terms was 57 birds from Deadwood Plain, with the next highest being 17 from Upper Prosperous Bay.
Losses of adult Wirebirds from 2000–01 to 2005 were compared among the habitat categories. These ranged from 35% in wet grassland to 44% in dry grassland and semi-desert. There was no significant difference between habitats (F 3,29 = 0.116, P = 0.949).
Vegetation survey
Deadwood Plain - The mean percentage ground-cover for major elements of the plant community is presented for the entire site in Table 2 and compared with the corresponding result from December 1998. Grass cover and the extent of unvegetated ground remained constant, but a number of species indicative of degradation of conditions for Wirebirds showed statistically significant (P < 0.05) increases. These included Mat Grass Stenotaphrum secundatum, which is likely to be unfavourable to Wirebirds due to its very dense ground cover and stiff leaves, the rush Bull Grass Juncus capillaceus, the tall herb Everlasting Helichrysum bracteatum, Creeper Carpobropus edulis, the shrubs Lantana Lantana camara and Wild Coffee Chrysanthemoides monilifera and woody shrubs as a group. There were significant declines in the low herb Monkey's Ear Centella asiatica and in herbs generally.
Mean percentage cover by major vegetation components at Deadwood Plain in December 1998 and December 2005, with results of comparison by paired t-test.
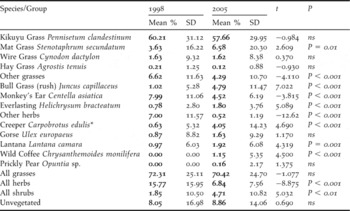
* includes both live plants and dead material
Sward height is considered to be one of the most important factors determining the distribution of Wirebirds within grassland habitats. The sward was sampled within each individual paddock and the results compared with those of December 2000. The results were also combined to give an overall mean height for the plain. All 16 paddocks that could be compared showed highly significant increases in sward height since 2000, with a range of 3–6 cm. The overall mean height for the Plain increased by 5 cm (2000: mean = 3.50 cm, SE = 0.05; 2005: mean = 8.52 cm, SE = 0.16, t = 31.4, d t = 1089, P < 0.001).
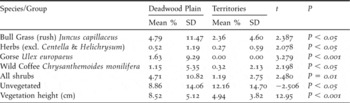
When compared to the mean cover values for the Plain as a whole, the combined data for the 14 territories show a number of statistically significant differences. The invasive rush, Bull Grass, is less abundant within territories than on the Plain generally, as are Gorse Ulex europaeus, Lantana and all shrubs combined (Table 4). The proportion of unvegetated ground within territories was greater than in the site as a whole. The average sward height within territories was 4.94 cm, significantly shorter than the site mean of 8.52 cm
Prosperous Bay Plain –The results of the quadrat survey are presented in Table 3 with comparative data from 1998. Other than the scarce endemic Baby's Toes Hydrodea cryptantha, only those vegetation components averaging at least 0.5% cover overall are included.
Comparison of vegetation characteristics between Wirebird territories and the entire census area at Deadwood Plain (two-tailed t-test). Only variables showing a statistically significant difference (P < 0.05) are shown.
Comparison of cover of major components between years identified only two statistically significant changes. Cover by Sand Grass Eragrostis cilianensis increased from 0.9% to 7.5%, while Ice Plant Mesembryanthemum crystallinum declined from 2.4% to less than 0.1%. The increase in all grasses is wholly an artefact of the Eragrostis increase.
No statistically significant differences were detected between mean percentage cover for any variables within the nine Wirebird territories and that for the site as a whole.
Invertebrate abundance
Pitfall catches indicate that terrestrial invertebrate macrofauna of Deadwood Plain is dominated by woodlice (54% of total catch) and beetles (30%), with millipedes and earwigs being the only other components accounting for more than 5% of the total. The beetle catch consisted predominantly of a small Tenebrionid species, tentatively identified as Gonocephalum simplex. This species is known to be a frequent prey of Wirebirds. Beetles comprised 64% of all observed Wirebird prey in 1988–89 (McCulloch Reference McCulloch1992). There was no difference in total invertebrate abundance between years, but the frequency of occurrence of beetles in the traps was almost twice that observed in 2000 (F 1,173 = 6.68, P = 0.01). There was significant heterogeneity in abundance of both combined invertebrates and beetles amongst paddocks in 2000 (F 18,61 = 4.63, P < 0.001 and F 18,61 = 2.30, P < 0.01 respectively). This spatial variation in abundance of combined invertebrates was maintained in 2005 (F 18,76 = 2.72 , P < 0.01) but beetles showed a similar level of abundance throughout the Plain.
Invertebrate composition within territories was similar to that found on the Plain as a whole, with woodlice and beetles the dominant groups. When data for all 14 territories were combined, the resulting mean for catch rate for all invertebrates (11.8 per trap) was slightly lower than that for the entire site, but the difference was not significant. The difference between the corresponding figures for beetles (all age-classes), 4.6 and 4.1 respectively, was also not significant. There was therefore no evidence that prey was more abundant within territories at Deadwood Plain than elsewhere at the site.
Discussion
The results of this study show that the Wirebird has declined substantially (43%) since 2000–01. Numbers of adults recorded in 2005–06 were the lowest recorded since systematic surveys began. The species has shown an overall declining trend since 1989, amounting to an overall reduction in the adult population of approximately 51%. There appear, however, to have been periods of partial recovery and relative stability during this time. The recent rate of decline has resulted in the Wirebird qualifying for ‘Critically Endangered’ status under the following IUCN criteria (IUCN 2001):
CR C2a(ii) – population < 250 mature individuals, observed continuing decline in numbers of mature individuals and at least 90% of mature individuals in one subpopulation.
The processes governing fluctuations in Wirebird numbers are not well understood at present. A number of different factors may be involved and the relative importance of these may vary over time. Analysis of the relationships between vegetation structure and Wirebird density at grassland sites in 1998/99 indicated that the decline in numbers observed in the early to mid 1990s was almost entirely due to losses from three major grassland sites: Deadwood Plain, Bottom Woods and Broad Bottom. These losses appeared to be associated with localized changes in vegetation structure resulting from alterations to agricultural practice, primarily reduction in grazing by livestock (McCulloch and Norris Reference McCulloch and Norris2001). It is notable that the further decline recorded by the present study has coincided with a widespread reduction in the numbers of grazing livestock on St Helena. Although it was not possible during this study to collect quantitative data from sites other than those directly affected by the airport development, the majority of pasture sites visited during the population census showed varying levels of habitat degradation following stock reduction. At Deadwood Plain, the most important Wirebird site, cattle numbers fell by 61% between 1999 and 2005, while at some smaller sites grazing ceased altogether. Stock numbers have declined as a result of both economic factors and agricultural policy, aimed at reducing over-grazing on seasonally marginal pastures. The pasture conditions previously identified as being associated with high Wirebird densities are those prevailing under heavy grazing. Removal or reduction of livestock rapidly results in increased sward height and density, increased structural heterogeneity and encroachment by invasive rushes and woody species and, in drier pastures, by Carpobrotus edulis and Prickly Pear Opuntia sp., all of which were evident at Deadwood Plain (Table 2). Comparison of habitat characteristics within active Wirebird territories at Deadwood Plain with average values for the site as a whole indicated that the birds were selecting areas with shorter swards, more bare earth and less cover of invasive species (Table 4).
Mean percentage cover by major vegetation components at Prosperous Bay Plain in December 1998 and December 2005, with results of comparison by paired t-test (two-tailed).
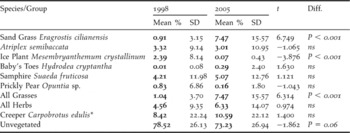
* includes both live plants and dead material
It was not possible to obtain quantitative data on stock reduction at sites other than Deadwood Plain but a subjective assessment of the change in grazing levels could be made, based on past experience. The grassland sites that have maintained grazing at roughly similar levels to those observed in 1998–2001, or have undergone only a small reduction (Broad Bottom and Man & Horse), showed the smallest declines in Wirebird numbers, while at Woody Ridge a substantial increase in grazing pressure coincided with a three-fold increase in Wirebirds (Table 5).
Percentage decline in adult Wirebird numbers at major pasture sites identified in 1989 in relation to estimated change in livestock numbers between 2001 and 2005. Livestock change categories: Decrease = reduction of less than 50%; Large decrease = reduction of at least 50%; Stable = no apparent change; Large increase = increase of at least 50%.
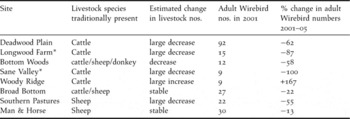
* no livestock present during this study
There are a number of ways in which the observed changes in vegetation structure at grassland sites could potentially result in a decline in Wirebird numbers. Greater sward height and density could restrict the vision of incubating birds, thus making them more vulnerable to mammalian predators, especially cats (Shrubb Reference Shrubb2007). The same changes might reduce prey accessibility, particularly to small chicks, through both lower prey visibility and restriction of chick movement (Galbraith Reference Galbraith1988, Devereux et al. Reference Devereux, McKeever, Benton and Whittingham2004). It is also possible that in wet weather, which can occur at any time of year on St Helena, taller, thicker swards might reduce the survival probability of small chicks, which might suffer thermoregulatory problems if subject to frequent wetting by moisture retained by the vegetation. Establishment of scrub in grassland areas could provide vantage points for Common Mynahs Acridotheres tristis that might increase the likelihood of predation of eggs and chicks. More extensive cover might also make the grasslands more attractive to rats. None of the above can be quantified at present, though all available information suggests that predation of adult Wirebirds by cats is low, and further research is urgently required.
Despite this apparent association between vegetation change and decrease in Wirebird numbers, it is likely that other factors have contributed to the species’ recent decline. The 1998–99 survey found a reduction in Wirebird numbers only at grassland sites. Populations in semi-desert had remained stable or had increased. The magnitude of the decline recorded by the present study was similar in all habitats, despite only small-scale habitat change at semi-desert sites, typified by Prosperous Bay Plain (Table 3). Also, during the period 1998–2001 the Wirebird population underwent an overall increase of 26% in the absence of any increase in grazing pressure. It should be noted, however, that during this period adult numbers only increased by 3.2%. Unfortunately, no vegetation data, other than measurements of sward height at Deadwood Plain, were collected after February 1999 so it is unknown if any general changes in grassland conditions occurred during at this time. If these occurred, they were not of a scale that was obvious during census visits.
Predation would appear to be the most likely additional factor contributing to the Wirebird's decline. The Wirebird has no extant natural predators but a range of introduced species pose a potential threat. These include domestic and feral cats Felis catus, dogs Canis familiaris, Black and Brown Rats Rattus rattus and R. norvegicus, House Mouse Mus musculus and Common Mynahs. Of these, cats and mynahs are the only species for which there is direct evidence of attacks on adult Wirebirds (cats) and their chicks (both species), though dogs are known to occasionally consume eggs. There are no quantitative data on current numbers, distribution or population trends for any of the above species, though truly feral dogs are now very scarce compared to 1989. There is also little current information on the impact of predators on Wirebird productivity. During the period 1999–2001, 35% of nest failures at Deadwood Plain were attributed to predation, though direct evidence was lacking (McCulloch and Norris Reference McCulloch and Norris2002). There are no predation estimates for any other site.
Nest-trampling by livestock, reduction of prey through use of agricultural chemicals (ivermectins), disturbance and development have all been considered as potential contributory factors to the decline of the Wirebird but little supporting evidence has been found. Trampling of nests has frequently been found to be an important cause of nest failure amongst wader species on agricultural land in Europe (e.g. Beintema Reference Beintema1982, O'Connor and Shrubb Reference O'Connor and Shrubb1986, Hart et al. Reference Hart, Milsom, Baxter, Kelly and Parkin2002). This seems to be less of a problem for the Wirebird. The confirmed trampling rate at Deadwood Plain during 1999–2001 was 1.5%, with a maximum possible rate amongst observed nests of 8.3%. The trampling risk and the use of veterinary chemicals will have declined with the reduction in livestock numbers. Permanent loss of Wirebird habitat to development since 1989 has been extremely small and is likely to have had a negligible effect on numbers.
Regular disturbance of breeding birds by humans has been shown to reduce fledging success in some plover species by disrupting incubation and reducing the feeding and brooding time available to the chicks (e.g. Flemming et al. Reference Flemming, Chiasson, Smith, Austin-Smith and Bancroft1988, Yalden and Yalden Reference Yalden and Yalden1990). The potential for disturbance, particularly by vehicles, has undoubtedly increased since 1989 but is still relatively low at most major sites and observations indicate that Wirebirds are extremely tolerant and adaptable, even when nesting.
Recent research has shown that, over the last century, St Helena's climate has displayed trends of rising temperature and decreasing precipitation (Feistel et al. Reference Feistel, Hagen and Grant2003). Despite this, the island's weather, particularly rainfall, remains highly variable on a year to year basis. Consequently, extreme years may have substantial effects on Wirebird numbers through resulting changes in chick survival rate. Most Wirebird nesting occurs during the driest part of the year, October to February, but some breeding takes place in all months (McCulloch Reference McCulloch1992). The importance of wet season nesting to overall annual productivity is unknown but it may be at this time that weather-dependent variation in nest success is greatest. Further research is required.
Future threats
Although the causes of decline have yet to be conclusively identified, the Wirebird population is now at its lowest recorded level and is consequently vulnerable to any additional threats. Construction of an airport for St Helena undoubtedly offers the best hope of regeneration for this extremely isolated community's ailing economy but it will unavoidably involve some negative impact, at least temporarily, on the Wirebird population. The immediate consequences are likely to be large-scale disturbance on-site during the construction phase and permanent loss of habitat within the runway footprint at Prosperous Bay Plain. Runway construction will result in displacement of a proportion of the population and, possibly, degradation of neighbouring habitat. Permanent loss of habitat at the airport site was estimated to include five existing territories in 2006 (McCulloch Reference McCulloch2006). Under proposals current in 2006 for the location of additional infrastructure and access routes, which avoid Deadwood Plain, it is improbable that there would be any significant permanent habitat loss away from the main airport site, though this has yet to be finalised. Permanent habitat loss on the scale currently envisaged appears unlikely, in itself, to significantly alter the extinction risk to the Wirebird.
Although Wirebirds have not previously been subject to disturbance on a scale comparable to that expected around the airport site, the species has shown itself remarkably adaptable to the presence of substantial human activity including the construction and operation of wind turbines (pers. obs. 1998–2006). It therefore seems likely that once the airport is operational a proportion of displaced birds will return to its periphery. Given the low expected frequency of aircraft movements and the Wirebird's relative reluctance to take to the air, the likelihood of collisions with aircraft is low.
The greatest potential threat to the Wirebird arising from construction of an airport may come from subsequent development associated with attempts to establish a tourism industry on St Helena. At present there are no firm proposals but potentially damaging concepts have already been aired. It is essential that the island's government ensures that important Wirebird sites are adequately protected by policy and legislation before actual planning applications are received from developers (see below). Currently only Deadwood Plain and Prosperous Bay Plain are covered by such legislation.
Conservation action
The proposal to construct an airport on St Helena has served to raise awareness of environmental issues on the island. This may be fortuitous for the Wirebird in that the will to take action on these issues, both on the island and internationally, has gained momentum. The impact on the Wirebird of the airport project itself can be minimized by ensuring that the status of the species throughout the remainder of the island is satisfactory. At present this is manifestly not the case. The Wirebird population has fluctuated over the past 20 years (McCulloch and Norris Reference McCulloch and Norris2002) but the overall trend has been one of decline. The results of the present study demonstrate that the rate of decline has accelerated during the past five years. Previous studies have shown that the highest Wirebird densities occur on St Helena's drier grasslands and the maintenance of these areas in suitable condition is likely to enhance the survival prospects of the species (McCulloch Reference McCulloch1992, McCulloch and Norris Reference McCulloch and Norris2002).
This study cannot demonstrate conclusively that the recent decline is principally attributable to changes in pastureland vegetation, but it would seem prudent, as a first step, to restore current and formerly important grassland sites close to the airport to a condition similar to that prevailing in 1989. This needs to be undertaken urgently, both as a mitigation measure for sub-populations directly affected by the development and to promote a general recovery in Wirebird numbers. Similar restoration of suitable sites should be encouraged throughout the island and should be based on a management prescription for sward condition maintenance and control of invasive species derived from experimental work currently being undertaken on Deadwood Plain by the St Helena National Trust, in collaboration with The Royal Society for the Protection of Birds (UK). Given the currently low economic return on livestock production within St Helena, it is unlikely that many graziers would be willing or able to increase stocking densities or hire additional manpower for adequate control of invasive plant species. It may therefore be necessary to obtain external funding for the establishment of a subsidy scheme to assist with appropriate management at key sites.
It is essential that development proposals located on or adjacent to Wirebird sites are subject to full environmental impact assessments and, if approved, carried out in such a way as to avoid or minimize the displacement of birds or degradation of their habitat. Deadwood Plain and Prosperous Bay Plain are already protected by legislation, but all other important Wirebird breeding sites should also be given effective formal protection restricting inappropriate land use and activities and requiring the implementation of recommended habitat management practices.
The effects of predation on the Wirebird have yet to be quantified. Consideration should be given, however, to the precautionary improvement of the effectiveness of control measures for those introduced species that may pose a threat, particularly cats, rats and mynahs. Regular trapping of feral cats should be reinstated in areas where this was formerly practiced and should also be extended to areas where cats are known to be concentrated. Neutering of domestic cats should be strongly encouraged. There is currently a rat control programme on the island. Resources should be sought to extend and intensify this. Given the mobility of mynahs and the relative inaccessibility of much of the island, it is unlikely that any attempt to eradicate the species would be successful. A mynah control project should, however, be initiated with a view to reducing numbers substantially and preventing subsequent recovery.
Further research into Wirebird ecology and demography and on the effects of predation is urgently needed to allow more effective conservation planning and use of limited resources. Better knowledge of the Wirebird's vital rates would allow identification of the stages of the life-cycle having greatest influence on population size. It would seem likely from similar species that adult survival rate would tend to be high and relatively constant, while productivity would be more liable to vary as a consequence of environmental factors. At present, however, we have insufficient data on adult survival, first-year survival of fledglings and age at first breeding, while data on hatching rate and chick survival exist for only one site. There is very little information on nesting frequency and success outside the peak season as only one wet season has been covered during the various studies since 1988. Anecdotal information suggests that wet season nesting may be more common than previously thought and thus may contribute substantially to annual productivity. Investigation of the roles of the various potential predators in causing variation of the above rates would also be extremely useful. Cats, for example, could have a very serious effect by reducing the adult breeding population, while all predators listed above could affect productivity by taking eggs and/or chicks. There may also be interactions between predators, various alternative prey species and weather conditions which affect Wirebird numbers but which are not currently understood and would repay investigation.
Conclusion
The St Helena Wirebird has undergone a decline of 43% in adult numbers since 2001 (51% since the first census in 1989). It now qualifies as ‘Critically Endangered’. The recent decline appears to be associated with a reduction of grazing by domestic livestock throughout the island although the limited data that could be collected during this study are inadequate to demonstrate this conclusively. At grassland sites conditions have generally deteriorated from those that were associated with high Wirebird densities in 1989, i.e. sward height less than 5 cm, high percentage cover of broad-leaved herbs, frequent patches of bare earth and absence of scrub.
The recent decline differs from that which occurred in the mid-1990s in that numbers have been reduced by similar levels in all habitats, whereas previously the decline had been confined to grassland sites. This suggests that factors other than grazing reduction are also involved. The most important of these are appear likely to be predation and weather but quantitative data, especially for the former, are lacking. Feral and domestic cats and Common Mynahs are likely to be the most important predators.
The Wirebird's small population size leaves it vulnerable to any additional threats. It is unlikely that the planned construction of an airport on St Helena will, in itself, add substantially to the extinction risk to the species. Extreme care will be necessary, however, to ensure that any spin-off developments, such as those associated with tourism, do not result in damage to, or loss of, important Wirebird sites.
The Wirebird's ecology and demography remains relatively poorly known and many opportunities exist for further research, which is urgently needed.
Acknowledgements
Fieldwork on St Helena during 2005–2006 was funded by the UK Government's Department for International Development, where Mr Richard Beales was a source of valuable advice. The project was managed for the Royal Society for the Protection of Birds (RSPB) by Sarah Sanders. Stella Rumbles and Judith O'Brien assisted with travel arrangements and administrative matters. I am extremely grateful to the Governor of St Helena, His Excellency Mr Michael Clancy, for permission to carry out research on the island. On St Helena, the assistance of the St Helena Government's Environmental Co-ordinator, Ms Isabel Peters, Dr Rebecca Cairns-Wicks of the St Helena National Trust, Mr Vincent Williams and Mrs Marjorie Fowler of the Environmental Conservation Section of the Agriculture and Natural Resources Department and Ms Kathryn Thorp and Dr William Latimer of Faber Maunsell Consultants, Ms Sophie Thorpe and Mr Woodrow Stevens was greatly appreciated. I also thank the Chief Executive and directors of the Environment and Heritage Service (Northern Ireland) for allowing me to take special leave in order to carry out this study, and especially Professor Howard Platt, Mr Ian Enlander and Mr Gregor Watson for supporting my participation in the project.


