


Introduction
The Second Amendment of the United States Bill of Rights unequivocally enshrines the right to firearm ownership. However, the scope and application of this right have long been the subject of debate among lawmakers, scholars, and the public. Although the federal government does not provide publicly available estimates of firearm ownership, Pew Research estimates that as of 2023, approximately 30% of US adults own a firearm (Schaeffer Reference Schaeffer2024). Firearms are deeply embedded in American culture – but as a consequence, so too are mass shootings and firearm-related deaths.
Firearm legislation remains a critical issue at the intersection of politics and public health. In 2021, the United States experienced 14.6 firearm-related deaths per 100,000 people, with significant variation across states (Gramlich Reference Gramlich2023). Mississippi had the highest rate (33.9 per 100,000), whereas Massachusetts had the lowest (3.4 per 100,000). Nationally, firearm-related deaths were primarily attributed to suicide (54%) and homicide (43%), with firearms involved in approximately 80% of US homicides. In comparison, heart disease – the leading cause of death in the US – accounted for 209.6 deaths per 100,000 people (Centers for Disease Control and Prevention 2021).
Research has suggested that restrictive firearm policies, including universal background checks and violent misdemeanor laws, are associated with reductions in firearm-related homicides by 14.9% and 18.1%, respectively (Siegel et al. Reference Siegel, Pahn, Xuan, Fleegler and Hemenway2019). Yet, as of 2019, only 11 states have adopted background checks for all firearm purchases at the point of sale (Siegel Reference Siegel2020).Footnote 1 Conversely, “shall issue” laws, which mandate the issuance of concealed carry permits to qualified applicants, have been linked to a 9% increase in homicides. These findings have spurred further investigation into the political and demographic factors influencing firearm policy adoption.
Government responses to firearm violence vary widely across jurisdictions, with federal, state, and local entities implementing diverse policy measures. Understanding the impact of these policies is essential for reducing firearm-related deaths and addressing firearm violence effectively. The stark difference in firearm-related deaths between states brings to light several questions. Researchers have explored the impact of firearm policies across the United States on the incidence of mass shootings (Siegel et al. Reference Siegel, Goder-Reiser, Duwe, Rocque, Fox and Fridel2020), how a state’s firearm laws are associated with firearm-related deaths in nearby states (Liu, Siegel, and Sen Reference Liu, Siegel and Sen2022), the diffusion of punitive firearm preemption laws (Macinko et al. Reference Macinko, Silver, Clark and Pomeranz2023), the association of state firearm laws with firearm ownership and mortality (Ventura et al. Reference Ventura, Macinko, Marín and Porfiri2024), and the factors that create opportunities for state-level enactment of firearm law provisions over time (Clark, Macinko, and Porfiri Reference Clark, Macinko and Porfiri2022; McElroy Reference McElroy2024).
I extend these findings by employing a policy diffusion framework, an approach that has been limited in application to research on firearm policy adoption. Although previous studies have utilized negative binomial models, exponential random graph models (ERGMs), and pooled event history analysis (EHA; see McElroy Reference McElroy2024, Clark, Macinko, and Porfiri Reference Clark, Macinko and Porfiri2022, and Schiller and Sidorsky Reference Schiller and Sidorsky2022, respectively), this study advances the methodological approach by incorporating network event history analysis (NEHA; Harden et al. Reference Harden, Desmarais, Brockway, Boehmke, LaCombe, Linder and Wallach2023). By leveraging NEHA within the theoretical context of policy diffusion, I offer a robust statistical framework that better accounts for discrete events and network effects. My theoretical framework argues that restrictive firearm policy is most likely to be adopted and diffuse as a consequence of policy learning. I account for the significant influence of demographics, politics, and institutions in this process and propose that public health outcomes are crucial to the adoption of firearm regulations. By using data on 129 firearm regulatory policies from 1991 to 2019, I find that high rates of firearm suicides and homicides inform the adoption of restrictive firearm policy. Despite the sharp increase in firearm-related fatalities, most states have implemented few policies to address this public health issue. My article examines the state-level factors that drive policy responses to this trend. By elucidating the role public health measures play in the diffusion of firearm policy, I aim to inform scholars, activists, and policymakers’ political decisions.
Literature review
The adoption of firearm policy
Researchers in diverse fields have long been interested in the diffusion of ideas, cultural norms, and health outcomes across individuals or political systems. In models of policy diffusion, policies spread across state lines to become especially prominent in neighboring or characteristically similar states.
Previous studies have connected state-level variables to the adoption of firearm policy. McElroy (Reference McElroy2024) examines the factors that predict state adoption of firearm laws using a negative binomial model. The results suggest that some characteristics that predict individual firearm ownership overlap and correlate with the state’s adoption of firearm policy. The author observes that unemployment, the Republican nature of the state legislature, the proximity to states that have adopted firearm laws, and the state region are predictive in the adoption of the 134 firearm policies the article analyzes. Notably, although significant predictors of firearm ownership at the individual level, gender and racial differences at the state level do not appear significant in predicting the adoption of firearm policy at the state level (Kelley Reference Kelley2022; Ward et al. Reference Ward, Uzzi, Hudson, Webster and Crifasi2023). Synthesizing these findings suggests that citizen preferences may be largely incongruent with the firearm policies being adopted.
Other research has integrated the theory of policy diffusion into the study of firearm policy. Clark, Macinko, and Porfiri (Reference Clark, Macinko and Porfiri2022) examine which factors drive state firearm law adoption by utilizing ERGMs and a bipartite network. Results suggest that both restrictive and permissive firearm policies are related to ideology; states with an ideological leaning toward the Democratic Party are more likely to adopt restrictive policies, and Republicans appear favorable of permissive policies; restrictive laws are equally as likely to be adopted as permissive policies; and the state’s population and homicide rate are positively correlated with the adoption of restrictive policies. Finally, the authors provide evidence that states are more likely to adopt a firearm policy if their bordering neighbors have adopted the same law. Both articles provide important developments for the study of firearm policy adoption by implicating several demographic and geographic variables in the process.
Consistent with research studying policy diffusion, Macinko et al. (Reference Macinko, Silver, Clark and Pomeranz2023) employ an EHA framework with state dyads and estimate the factors associated with the adoption and diffusion of firearm punitive preemption laws from 2009 to 2018. A firearm punitive preemption policy is a law that allows for lawsuits and other penalties against local governments and lawmakers who pass preemptive firearm laws as a means to forestall. The authors observe that “states’ enactment of punitive firearm preemption laws is likely driven by both internal and external factors, among these, the number of neighboring states that have enacted such laws.” In sum, the authors provide evidence that a subset of firearm policies follows the core tenets of policy diffusion.
Finally, using pooled EHA, Schiller and Sidorsky (Reference Schiller and Sidorsky2022) explore how federalism exacerbates gender inequality among women by explaining the diffusion of domestic violence laws. By using a dataset of domestic violence firearm law (DVFL) enactments across all 50 states in the United States from 1990 to 2017, the analysis suggests that the number of gun-related homicides, partisan control of the legislature, citizen ideology, federal policy, and election years each influence the likelihood of DVFL enactments, providing evidence that DVFLs diffuse across the United States.
These findings are the foundation of this article. If proximity to states that have adopted firearm policies has been found significant in predicting adoption rates, and preemption laws and domestic violence laws have been shown to diffuse, is it the case that restrictive firearm policy as a whole diffuses? In the next section, I outline my hypotheses and explain the expected importance of the policy learning mechanism and public health in the diffusion of restrictive firearm policy.
Firearm violence and the adoption of firearm policy
My theoretical expectation is that the mechanism of policy learning is the driving force behind the diffusion of firearm regulations, and I explain the relative importance of both state legislators and the public in the process. First, however, the likelihood that legislators address firearm violence must be assessed; I contend that there exist electoral incentives for governments to learn and respond effectively. Reny et al. (Reference Reny, Newman, Holbein and Hassell2023) provide evidence that mass shootings act as “focusing events,” causing large surges in Americans’ engagement with firearm policy, including internet searches, streaming documentaries, social media discussions, petition signing, and donating to political action committees. It should be noted that for direct electoral behavior, other research has found that public mass shootings do not heighten voter turnout or impact party choice (Hassell and Holbein Reference Hassell and Holbein2025; Hassell, Holbein, and Baldwin Reference Hassell, Holbein and Baldwin2020). Nonetheless, Jashinsky et al. (Reference Jashinsky, Magnusson, Hanson and Barnes2017) demonstrate that media narratives following mass shootings significantly shift blame toward policymakers, holding lawmakers responsible in 30% of news coverage before a shooting but in 66% of coverage immediately afterward. This shift is likely to create an increasingly informed public that expects policy responses from lawmakers. Porfiri et al. (Reference Porfiri, Sattanapalle, Nakayama, Macinko and Sipahi2019) observe that media coverage following mass shootings heightens public anxiety about stricter firearm regulations, leading to increased firearm purchases and ownership. The media’s tendency to frame lawmakers as accountable, combined with rising public participation, suggests that the convolution of the media and public following mass shootings creates political incentives for policymakers to act.
Crisis management and policy learning
To theoretically explain the role of policy learning, I examine the crisis management literature. A core tenet of crisis management is the accumulation of wisdom by “learning together from the event in order to prevent, lessen the severity of, or improve upon responses to future crises” (Hillyard Reference Hillyard2000). According to Comfort (Reference Comfort1988), the crisis response network is “necessarily a learning system” because it is dependent “upon the ability of its participants to generate valid information, facilitate informed choice, and foster timely commitment to action.” Moynihan (Reference Moynihan2008) further highlights that “learning required during crises is inherently greater, demanding new understanding of the most basic aspects of the causes, consequences, and solutions.” However, crises may also limit learning by fostering defensive reactions or opportunism.
The politics of accountability tend to identify guilty actors, overlooking system failures and promoting defensiveness (Drabek Reference Drabek, Dynes and Tierney1994). As a result, individuals may disassociate themselves from negative outcomes and deny that a problem exists, that they made an error, or that they are responsible for a solution (Argyris and Schön Reference Argyris and Schön1997). Firearm policy in the United States has been evidenced to change dynamically in the context of mass shootings to become less restrictive in states with Republican-controlled legislatures (Luca, Malhotra, and Poliquin Reference Luca, Malhotra and Poliquin2020). It is unclear whether this policy change reflects Republicans’ defensiveness and ambition of advancing their political agenda, or a form of crisis management focused on providing a greater portion of the population with a means of self-defense. If this response is believed to be a form of crisis management, it suggests that the government’s response to firearm violence aligns with the learning mechanism of policy diffusion. Conversely, if this response is believed to be a form of policy emulation, it suggests that follower states are seeking to promote a similar policy and political agenda, with less interest in promoting an efficacious policy response.
Finally, Makse and Volden (Reference Makse and Volden2011) find that five key characteristics explain the spread of policy. Specifically, complex policies spread more slowly, whereas compatible policies spread more quickly. Moreover, observability, relative advantage, and trialability (i.e., the ability to experiment) all enhanced the rate of adoption and diffusion. Firearm regulation is generally consistent with these five factors. Although each state has a set of diverse firearm laws, most policies tend to be rather straightforward on paper. For instance, many frequently discussed policies include universal background checks; age, magazine, and ammunition restrictions; or the prohibition of ownership among convicted felons. The relative simplicity of these policies, their direct and measurable outcomes (i.e., rate of firearm homicides), and their strong trialability suggest that firearm laws are primed to diffuse as a function of policy learning. Therefore, I hypothesize that the adoption of firearm regulations is likely characterized by policy diffusion.
Hypothesis 1: The adoption of state firearm regulations is characterized by policy diffusion.
The public health connection
Additionally, I have several conditional hypotheses. Given that state firearm regulations exhibit policy diffusion, I hypothesize that states adopt restrictive firearm policies in response to public health concerns, specifically driven by elevated firearm-related violence. I theorized above that the diffusion of firearm regulations may be characterized by crisis management and policy learning. If this is the case, I expect that measures of state firearm homicide rates will be positively significant in predicting the adoption of state firearm regulations. Elevated homicide rates create political pressure and social demand for regulation, making firearm policies a rational response to public safety concerns.
Hypothesis 2: States are more likely to adopt firearm regulations when firearm homicide rates are high.
Firearm suicides also represent a substantial public health crisis. States experiencing high suicide rates may be more inclined to adopt preventive regulations as a crisis response mechanism. Furthermore, awareness of effective policies in other states may accelerate policy diffusion, leading to targeted legislative action aimed at reducing suicide risk through firearm regulation.
Hypothesis 3: States are more likely to adopt firearm regulations when firearm suicide rates are high.
Research design
To examine, visualize, and estimate policy diffusion between states, previous scholars have largely made use of unit-level EHA (Berry and Berry Reference Berry and Berry1990), dyadic EHA (Volden Reference Volden2006), and latent inference methods (i.e., NetInf; Desmarais, Harden, and Boehmke Reference Desmarais, Harden and Boehmke2015) to evidence policy diffusion. In this article, I utilize NEHA (Harden et al. Reference Harden, Desmarais, Brockway, Boehmke, LaCombe, Linder and Wallach2023). NEHA provides several advantages over previous methodologies. In particular, NEHA incorporates latent network inference into conventional discrete-time event history models; by unifying previous methodologies, NEHA estimates “(1) unit-level effects on adoption decisions, (2) dyadic effects on the tendency of units to emulate each other, and (3) residual dyadic ties between units (i.e., latent diffusion networks).” This is important because discrete-time EHA models better match “the measurement precision for data on political choices such as policy adoption than does the continuous-time measurement assumption used in NetInf.” Therefore, NEHA not only permits researchers to identify which units are innovation leaders and which are followers but also provides estimates of the associations between covariates and adoption decisions as in conventional models.
NEHA requires data that are in an event history format; the node, time, event, cascade, and covariates must all be available. In context, the node is the state, the time is the calendar year, the event is a binary indicator of whether adoption occurred in the specified year, and the cascade is the specific policy. In EHA data, a unit (e.g., the state) should only be included in the dataset for a given cascade up to the time that it adopts the specific policy. The inferred network provides useful insights into the mechanism of diffusion driving policy adoption. Under the mechanism of learning, it is expected that the model infers a relatively large number of “seeding” states, each sending directional ties to a group of follower states seeking a similar form of success (Harden et al. Reference Harden, Desmarais, Brockway, Boehmke, LaCombe, Linder and Wallach2023).
It is important to note the NEHA model specifications I utilize to produce the final analysis. As explained above, NEHA incorporates latent network inference into conventional discrete-time event history models. There are two steps to the estimation. The network ties are estimated first through the NEHA model; once the ties are estimated, the model can be visualized, and the output is incorporated into a generalized linear model (GLM) through logistic regression. This approach provides estimates that indicate the importance of each covariate on policy adoption.
Given NEHA’s reliance on GLMs, mixed-effects models can be used to incorporate fixed and random effects into the model specification. Mixed-effects models have been shown to better model the policy diffusion process (Kreitzer and Boehmke Reference Kreitzer and Boehmke2016). I utilize policy-specific random effects; the impetus for this decision is the expectation that there exists unobserved heterogeneity across policies. Policies may have different baseline adoption rates or unobserved characteristics that influence their diffusion. Including policy random effects can account for this variation. Additionally, I include state-fixed effects. This accounts for time-invariant effects, such as unique state cultures that could impact the model estimates. Finally, a critical assumption of EHA models is the independence of adoptions. Therefore, it is necessary to censor data following the first year of adoption. One notable downside of this model restriction is the inability to model the situation in which a state adopts and repeals a policy.
Data: state firearm regulations
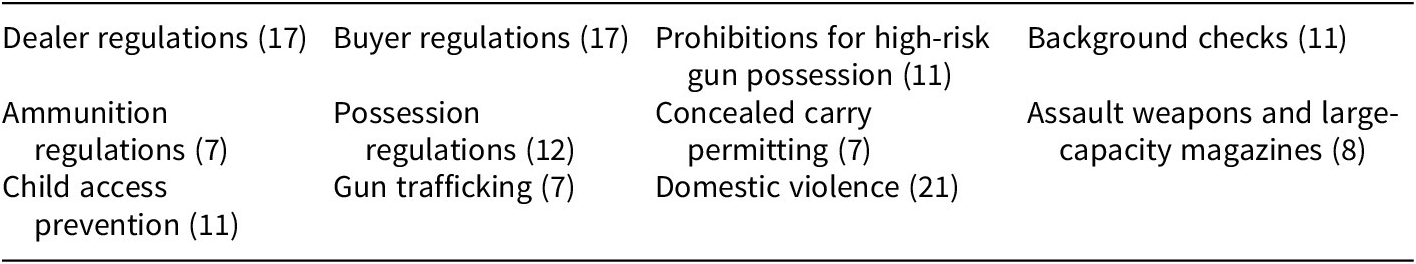
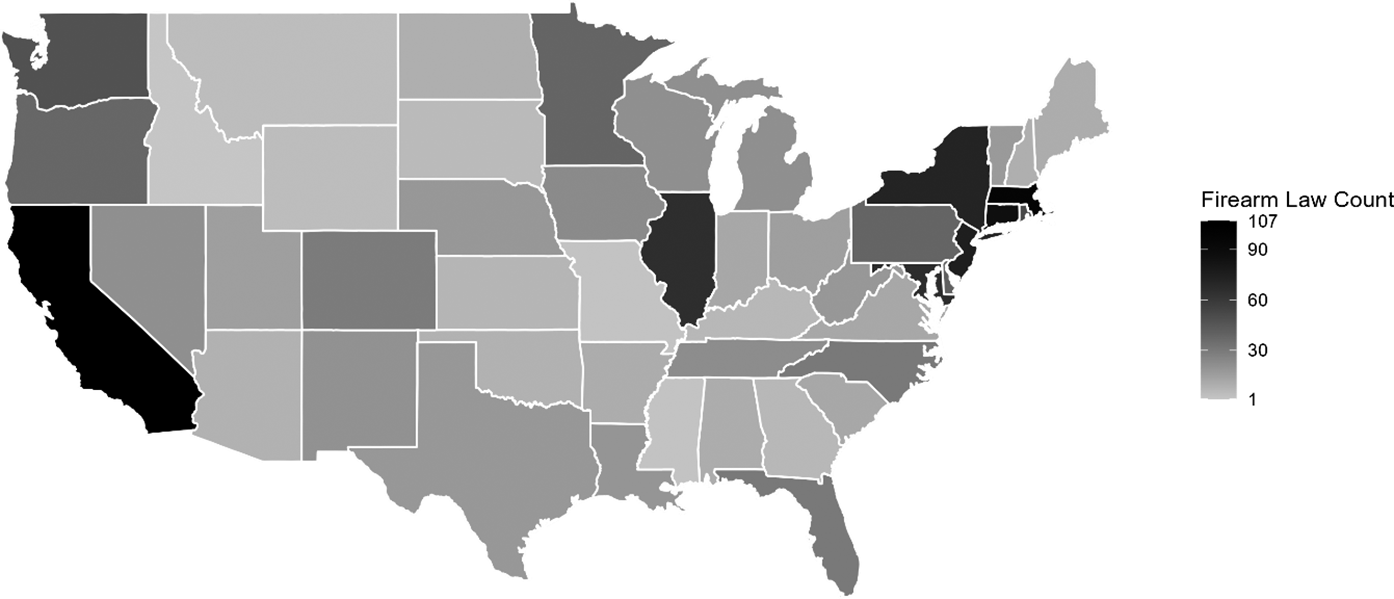
The State Firearm Database catalogs the presence or absence of 129 firearm safety laws in 14 categories covering 29 years from 1991 to 2019 (Siegel Reference Siegel2020). The data are arranged as 129 columns of binary variables, with a 1 indicating that the policy is implemented in the state and a 0 otherwise. The database’s 11 policy categories are indicated in Table 1.Footnote 2 Figure 1 visualizes the count of firearm policies adopted in each state as of 2019. Different states’ adoption of firearm regulations varies drastically – California has 107 firearm regulations, and Idaho has 1.
The 11 categories and counts of the 129 firearm safety policies

The total count of restrictive firearm policies adopted in each state as of 2019.

Selecting control covariates
The covariates I utilize incorporate three primary categories of variables, including demographics, politics, and institutions of the state node. In studying the diffusion of firearm preemption laws, Macinko et al. (Reference Macinko, Silver, Clark and Pomeranz2023) utilize variables that measure the state’s legislative professionalism, unemployment rate, citizen ideology, government ideology, mean income per capita, homicide rate, population, background checks per capita (firearm ownership proxy), neighbors enacting punitive preemption laws, and a count of the state’s permissive firearm laws. I adopt many of the same variables but with key differences discussed below.
Demographic variables
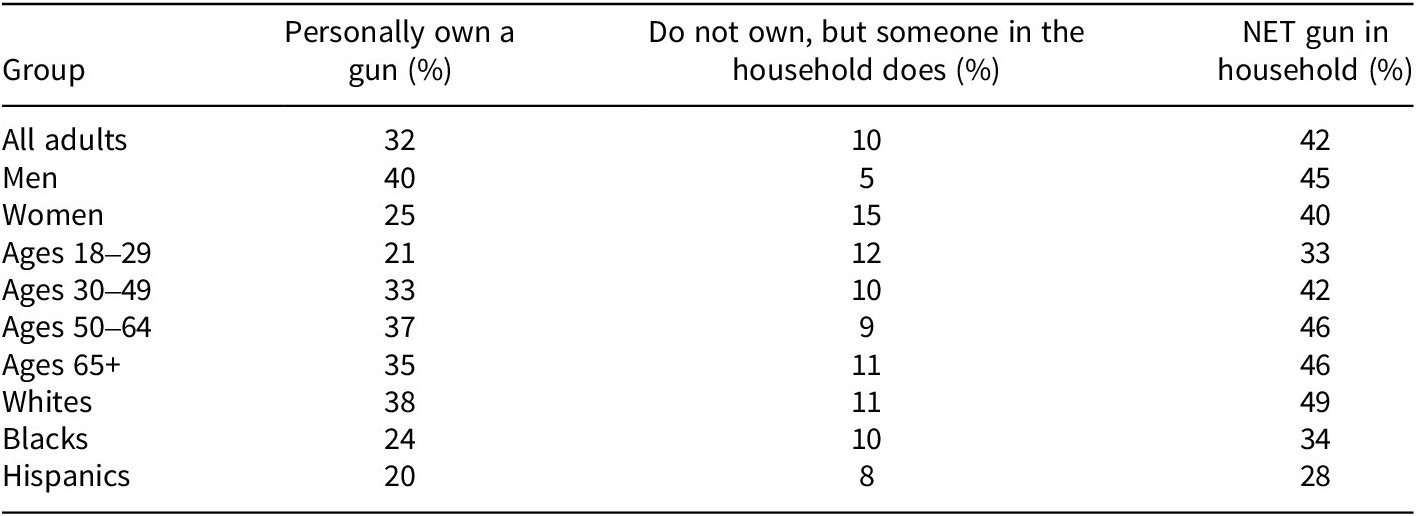
Approximately 30% of US adults own a firearm, though ownership differs extensively by demographic group (Schaeffer Reference Schaeffer2024). Table 2 presents a breakdown of 2023 firearm ownership demographic characteristics.
Demographic characteristics of US firearm owners in 2023 (Schaeffer Reference Schaeffer2024)

Given the varying demographic and geographic diversity of the United States, I employ covariates that measure the proportion of white individuals, the unemployment rate, the mean income, firearm ownership, and the state’s population size. In divergence with Macinko et al. (Reference Macinko, Silver, Clark and Pomeranz2023), I argue that accounting for racial differences is necessary, as states are racially diverse and firearm ownership differs extensively by race. Furthermore, this article utilizes a different estimate of firearm ownership. The federal government does not provide an official count of firearm ownership; therefore, scholars studying public health have used different proxy measures to obtain reasonable estimates. Macinko et al. (Reference Macinko, Silver, Clark and Pomeranz2023) measure firearm ownership by estimating background checks per capita, and Schiller and Sidorsky (Reference Schiller and Sidorsky2022) use a measure of hunting licenses per capita. I utilize another measure produced by Schell et al. (Reference Schell, Peterson, Vegetabile, Scherling, Smart and Morral2020). Schell et al. (Reference Schell, Peterson, Vegetabile, Scherling, Smart and Morral2020) use several firearm ownership proxy measures and a structural equation model to estimate a more robust estimate of household firearm ownership. The authors use four measures, including the proportion of suicides in which a firearm is used, the number of hunting licenses per capita, the number of Guns & Ammo magazine subscriptions per 100 residents, and the number of background checks conducted per 10 residents. These measures are combined into a single value from 0 to 1, and the authors find that the resulting index is an improvement over previous proxy measures.
Political, institutional, and public health variables
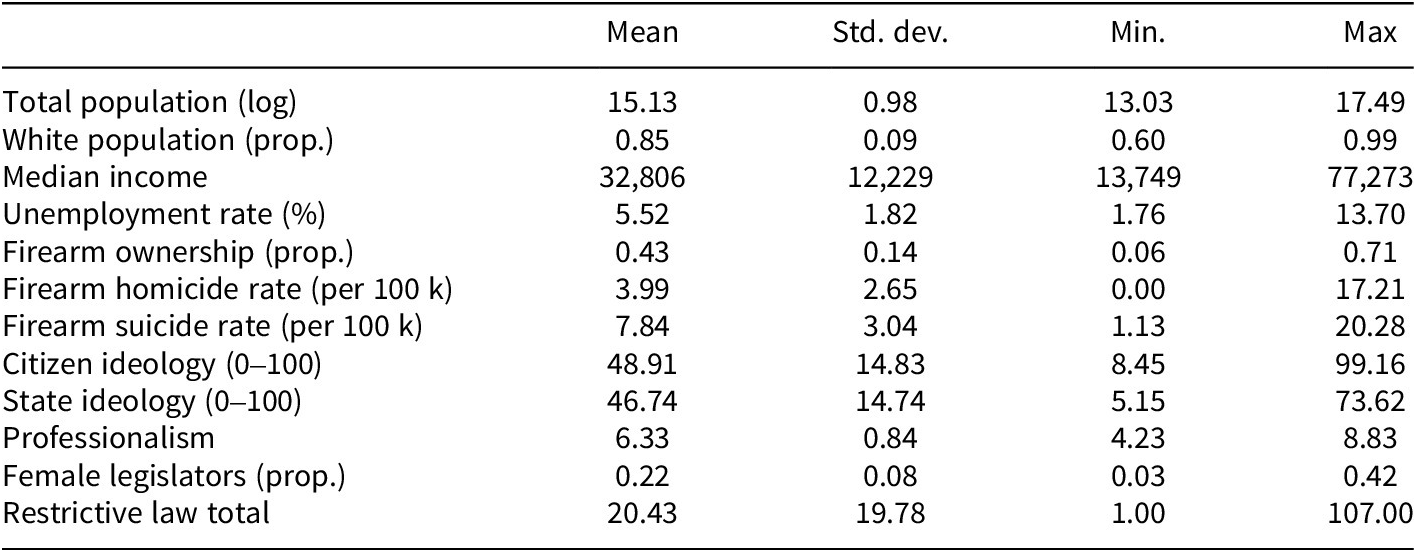
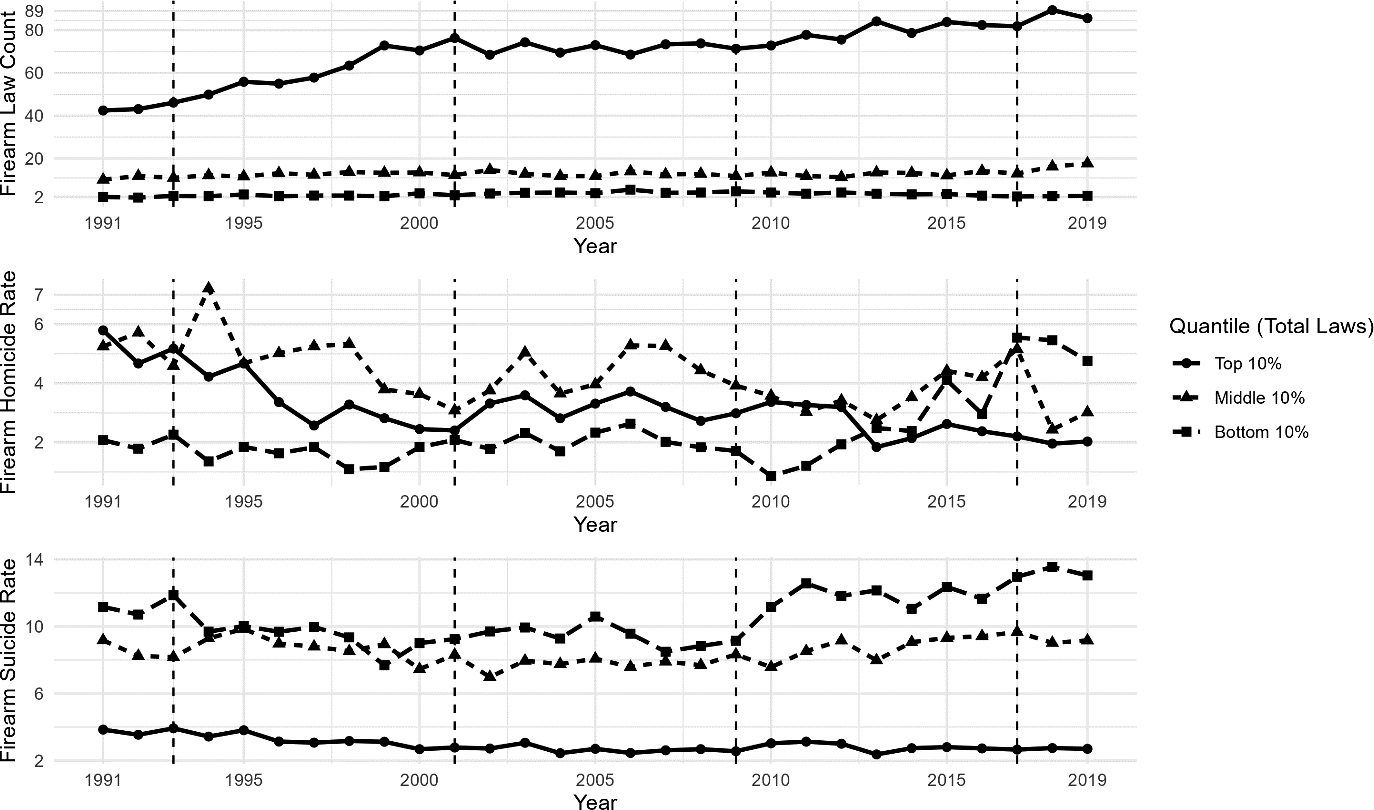
Additionally, I expect that the spread of restrictive firearm policies will differ depending on each state’s firearm homicide rate, firearm suicide rate, government ideology, citizen ideology, legislative professionalism, firearm law count, the proportion of state legislators who are female, and a measure of the proportion of state neighbors enacting a specific firearm policy in the given year. Table 3 presents the summary characteristics of the covariates utilized in the NEHA estimation. Figure 2 visualizes the quantile trend averages for firearm policy adoption, firearm homicides, and firearm suicides.
Summary characteristics from 1991 to 2019

The trend of restrictive firearm law adoption, rate of homicide, and rate of suicide averages among total restrictive law quantiles.
Note: Dashed lines denote a change in presidential administration, and rates were calculated per 100,000 residents.

Results
Interpreting the model
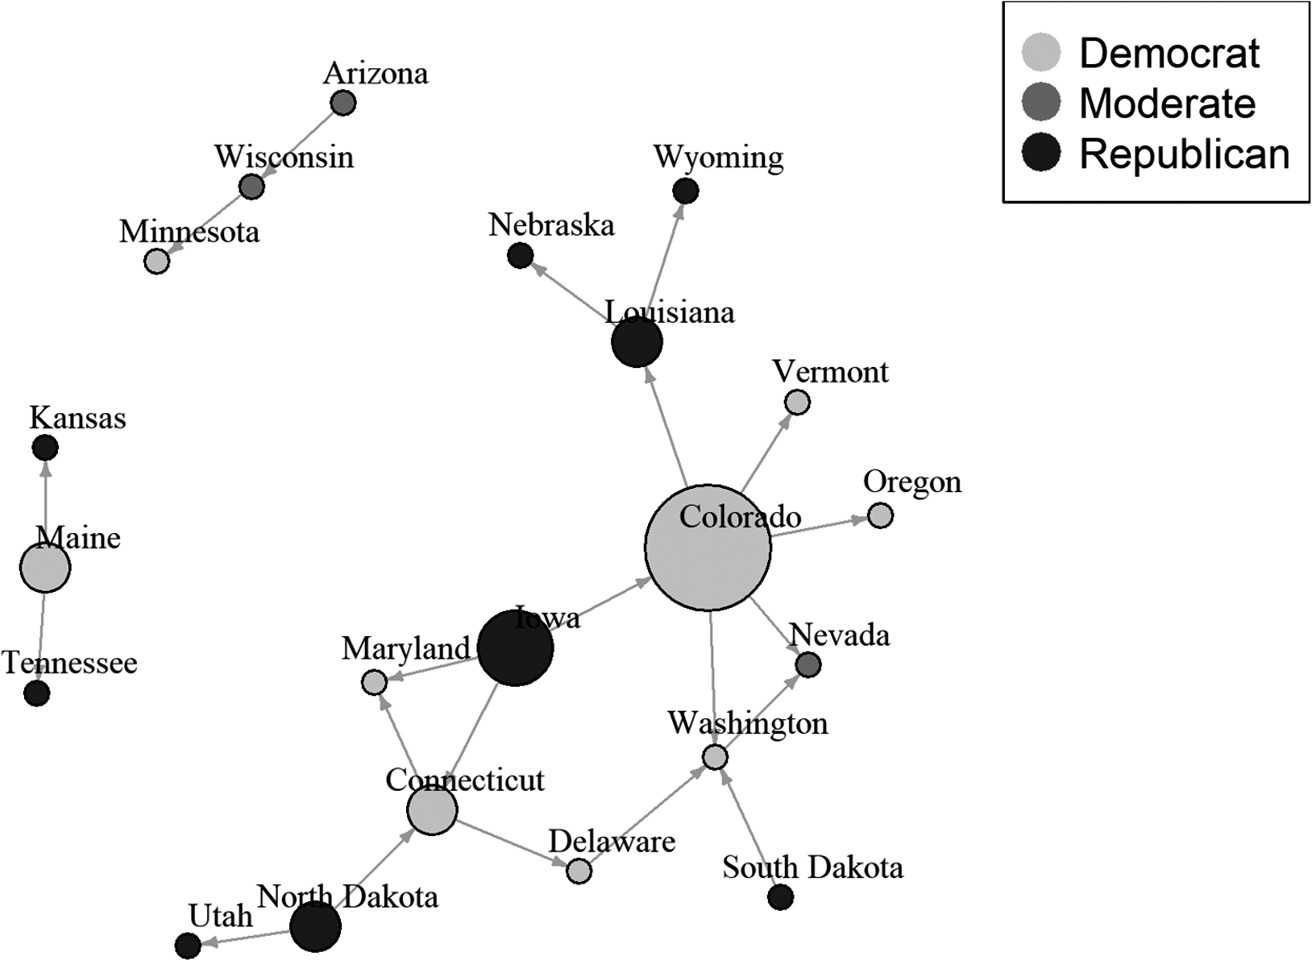
To interpret the results, I have scaled the full dataset used in the logit models to a mean of 0 and a standard deviation of 1 to provide a better understanding of how each covariate affects the aggregate. After applying NEHA to the firearm policy database and the selected covariates, the model produces Figure 3, a visualization of the tie formation:
NEHA estimated visualization.
Note: Each node is colored relative to the 2020 presidential election results. The node size is visualized using a 3-point scale of the node’s out-degree.

This visualization evidences a clear network of diffusion among both permissive and restrictive states. The network suggests that Colorado and Iowa are among the “seeding states,” as they directly impact the adoption of restrictive firearm policy among several follower states; moreover, it appears likely that follower states are seeking a particular policy agenda. Colorado, for instance, is followed by several states characterized by liberal or (in this case) restrictive laws. This suggests that Colorado’s follower states may be either learning from or imitating firearm policy adoptions.
It is not immediately clear why Iowa and Colorado emerge as the most central states in the diffusion of firearm restrictions. One possible explanation is that both states are near the ideological median on firearm regulation. This interpretation is supported by the regression results presented below, which suggest that ideological similarity exerts a prominent role in the diffusion of firearm restrictions.
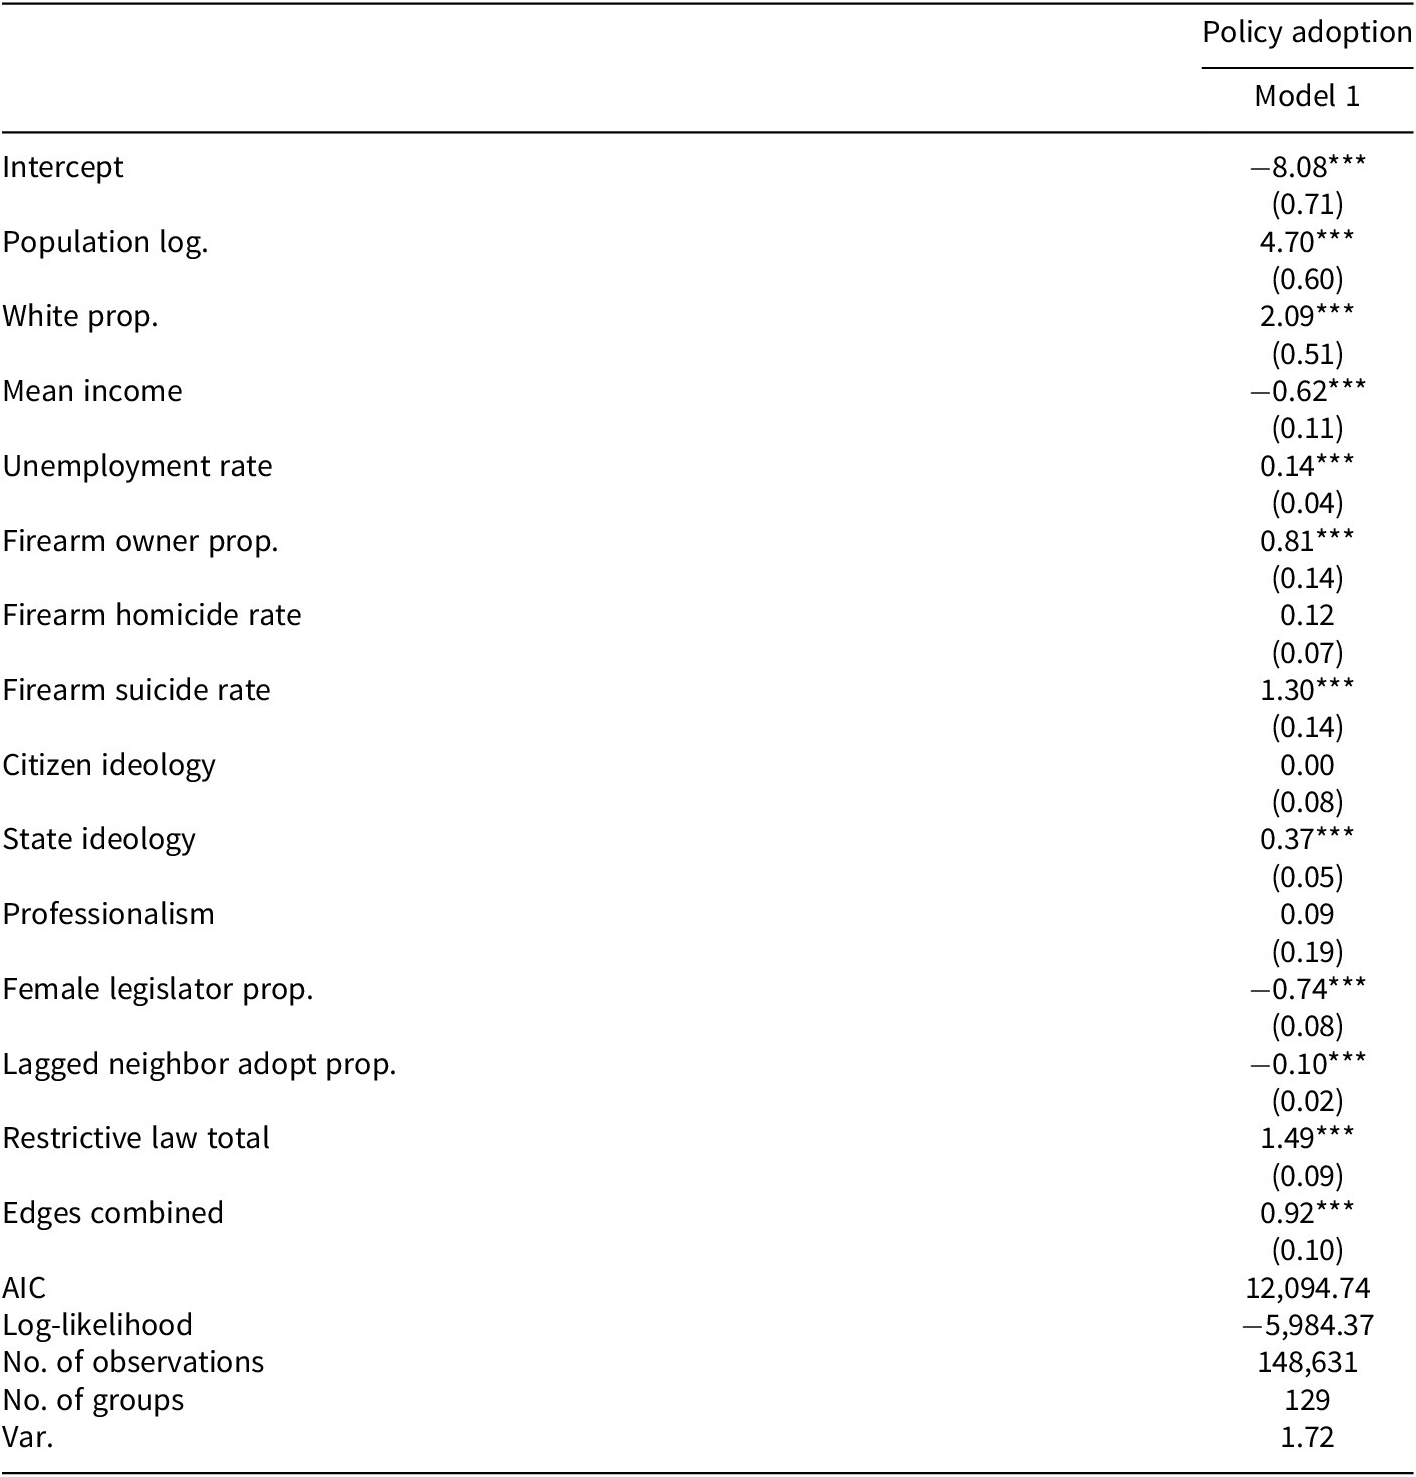
One point to highlight is the absence of New York and California. This is surprising, as both states have some of the most stringent firearm regulations as of 2019 and are leaders in other policy domains (see Bricker and LaCombe Reference Bricker and LaCombe2021). This suggests that both states independently adopted significant firearm legislation with little influence from outside factors and that both states are exerting minimal influence on other states, assuming a well-specified model. Another point to note is the lack of geographic neighbor ties. Although there are a few geographically close connections (e.g., Minnesota and Wisconsin), many of the estimated ties are more similar ideologically than geographically. Models 1–3 (Table 4) provide demographic, political, and unified covariate estimates as they relate to the adoption of restrictive firearm policy.
NEHA estimates of restrictive firearm policy adoption

Note: The data were scaled to a mean of 0 and a standard deviation of 1. AIC, Akaike information criterion; NEHA, network event history analysis. *p < 0.05, **p < 0.01, ***p < 0.001.
In comparing the three estimated models, both the log-likelihood and the Akaike information criterion (AIC) suggest the third and final model is most precisely specified. Of decreasing positive significance are the covariates measuring total population, the white proportion, the restrictive law total, firearm suicides, firearm ownership, neighbor adoptions, state ideology, and firearm homicides. The edges combined variable denotes the effect of sources on the likelihood that a state adopts a policy at a given point. It is initialized by the weighted combination of the times since source states adopted; therefore, if a source state adopts recently, the coefficient increases. The estimate given by the model, 1.45, suggests that moderate to strong network effects are present in the diffusion of restrictive firearm policy. This is further compounded by the neighbor adoption variable, which suggests that firearm policy adoption is positively influenced by geographic neighbor adoptions. Previous research remains divided on this conclusion. Using a dataset of state punitive preemption laws, Macinko et al. (Reference Macinko, Silver, Clark and Pomeranz2023) find that neighbor adoption is positively significant. In contrast, using a dataset of DVFLs, Schiller and Sidorsky (Reference Schiller and Sidorsky2022) find that a lagged neighbor adoption variable is not significant. One potential reason for this variation is the different subsets of policies used. This finding, however, necessitates future research to uncover the reasons for differences between estimations.Footnote 3
Public health predictors
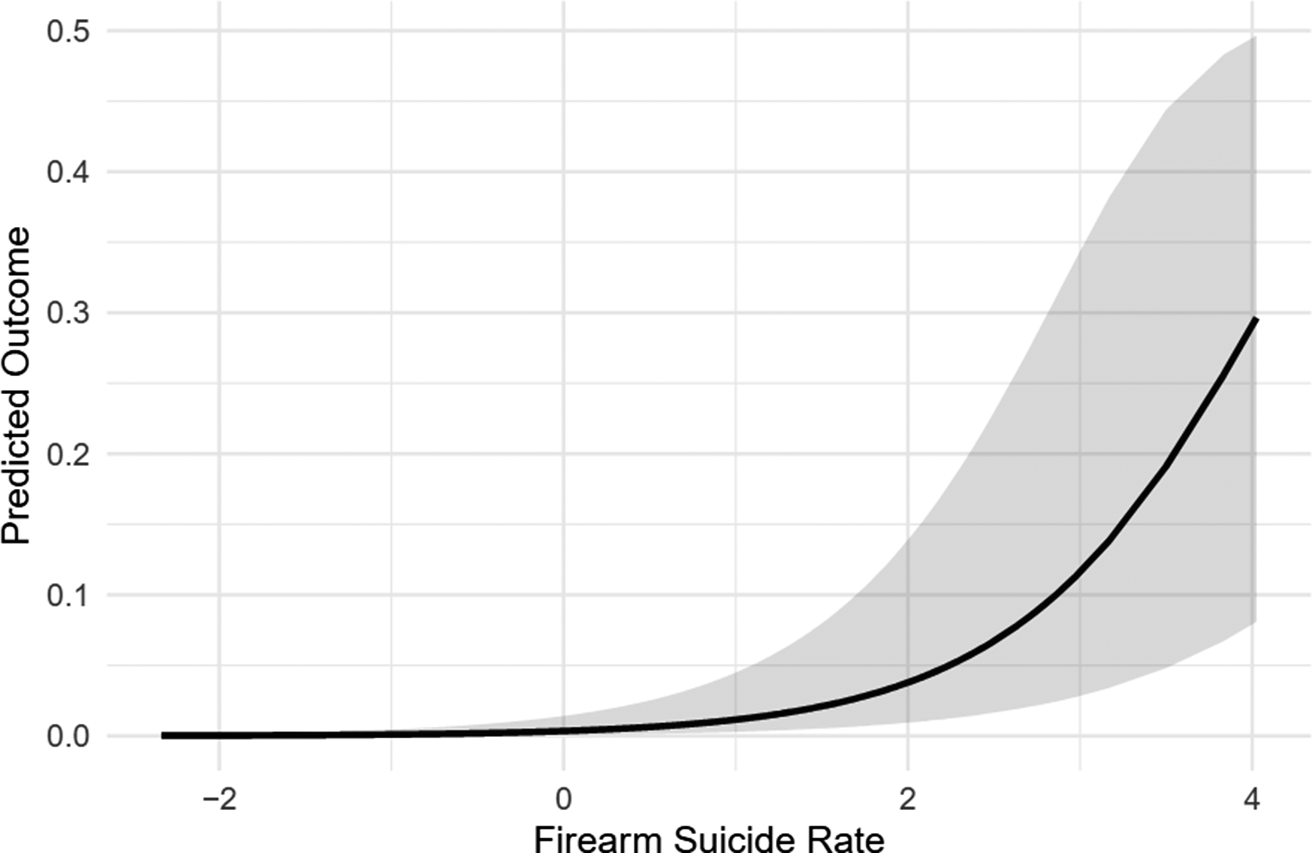
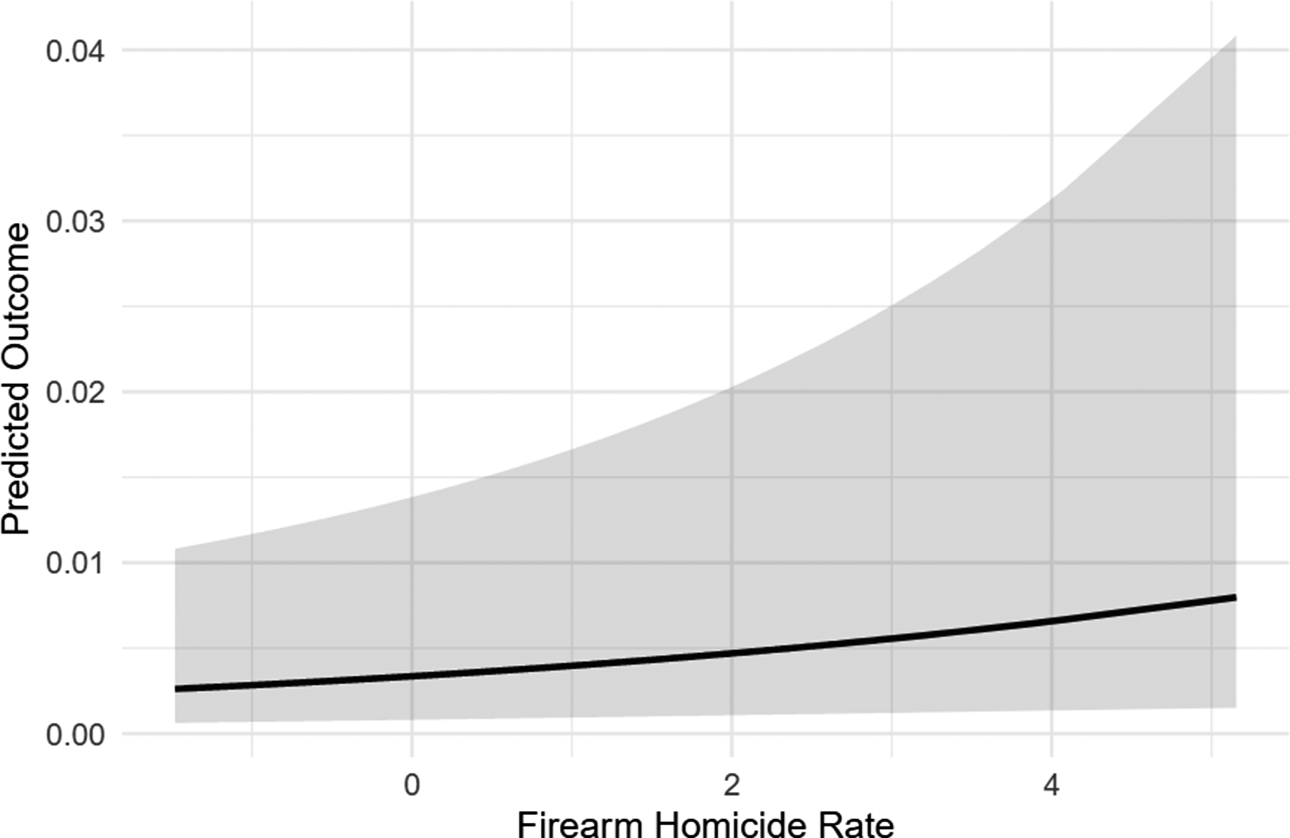
A highlight of this model is the significance of the state’s firearm suicide and homicide rates. Together, both measures suggest that state governments pass firearm policies as a function of rising firearm suicides and homicides. I suggest that the difference in magnitude between both measures results from the crime narrative that permeates political discourse. Although most legislators are unified by the negatives of crime, political parties remain split about addressing this issue, resulting in greater political gridlock and less bipartisanship amongst legislators. However, firearm suicides are not significantly politicized, and suicide remains a persistent problem among all social groups (Centers for Disease Control and Prevention 2024). This likely produces an environment of bipartisanship, creating few political ramifications for legislators who choose to act on remedying the suicide epidemic. Therefore, my hypothesis that deteriorating public health influences the adoption of firearm regulations is supported. Figures 4 and 5 show visualizations of the effect of firearm suicides and homicides on the adoption of restrictive firearm policy.
The predicted effect of the scaled firearm suicide rate on the adoption of policy.

The predicted effect of the scaled firearm homicide rate on the adoption of policy.

Consistent with the logistic regression models reported above, the data used to produce Figures 4 and 5 were scaled to a mean of 0 and a standard deviation of 1. Hence, values on the x-axis represent changes in standard deviations. Zero is equivalent to the average value of the predictor, and each change in the predictor’s value is a change in standard deviation. These figures suggest that, at the mean, firearm suicide and homicide rates have a very weak association with the predicted probability of policy adoption. However, at the highest rates of observed firearm suicides, there is close to a 30% predicted probability of policy being adopted. This is consistent with my crisis management and policy learning informed theoretical framework; those with the greatest rates of firearm suicides and homicides are likely responding to this phenomenon by adopting more restrictive firearm policies. Notably, however, discrepancies remain in how police departments across the United States report firearm suicides and homicides. In the case of larger loss-of-life events, such as mass shootings, firearm suicides may also be reported as firearm homicides. Therefore, it may be that the culmination of firearm suicides and homicides creates momentum over time that inspires policymakers to adopt restrictive firearm policies. The evidence in this analysis, nonetheless, suggests that lawmakers are responsive to firearm-related fatalities.
Finally, it must be noted that firearm homicides have shown conflicting estimates in the literature. Schiller and Sidorsky (Reference Schiller and Sidorsky2022) suggest that firearm homicides are positively significant in predicting the adoption of DVFLs, and Macinko et al. (Reference Macinko, Silver, Clark and Pomeranz2023) find no significance in their estimation. The conflicting significance of the firearm homicide rate between analyses is likely due to the subsets of policies used. Furthermore, the difference could be exacerbated by differences in modeling. NEHA is more robust than pooled EHA (Harden et al. Reference Harden, Desmarais, Brockway, Boehmke, LaCombe, Linder and Wallach2023), and I estimate a mixed-effects model, which has been shown to better model the policy diffusion process (Kreitzer and Boehmke Reference Kreitzer and Boehmke2016).
Other explanations
The total population, number of restrictive policies adopted, proportion of white people, and a measure of firearm ownership in a state significantly influence the adoption of restrictive firearm policy in the model. Moreover, higher mean incomes significantly reduce the adoption of firearm policies. Surprisingly, although women own firearms at a lower rate, as the proportion of state legislators who are female increases the adoption of restrictive firearm policies decreases. This unexpected result may be explained by the dynamics of symbolic and substantive representation, and a possible lack of leadership roles for women in legislatures with a high proportion of female members.
Finally, legislatures characterized as more liberal adopt a greater number of restrictive policies. The Republican Party has long supported personal firearm ownership and permissive firearm policies; therefore, unsurprisingly, Democratic-controlled legislatures have a greater adoption rate of firearm regulations. It should be underscored that the ideology of the citizenry is not predictive of firearm policy adoption. This represents policy incongruence or the situation in which governments fail to pass policies consistent with the opinion or preferences of the electorate. According to Pew Research, 61% of Americans believe that it is “too easy” to legally obtain a firearm in the United States. Moreover, 58% of Americans favor stricter firearm laws (Schaeffer Reference Schaeffer2024). There is overwhelming bipartisan support among the electorate for policies that prevent people with mental illness from purchasing firearms; 88% and 89% of Republicans and Democrats strongly or somewhat favor this policy. Yet, as of 2019, only eleven states have adopted background checks for all firearms at the point of sale, and nine of these states have thus far adopted a policy to require background checks on state mental health records. This analysis underscores the difficulty of implementing effective public health measures in an environment of political and affective polarization.
Conclusion
Firearms have long permeated American political discourse. The inclusion of the right to bear arms in the Bill of Rights has spurred significant debate, and modern political parties remain divided on how to address this amendment. Firearms have produced a clear public health concern across the United States. Continued firearm violence and the rising frequency of homicides, suicides, and mass shootings have led to the relative prominence of firearm regulation policy debate within state legislative discourse.
My article is among the first to utilize a comprehensive list of regulatory firearm policies to theorize and model a policy diffusion network among state governments. Despite a dramatic rise in firearm-related fatalities, most states have adopted relatively few policies to address this escalating public health concern. By utilizing 129 firearm regulatory policies from 1991 to 2019, this article uncovers the state-level determinants that drive public policy responses to firearm violence, highlighting the convolution of health, demographic, and political factors that shape the regulatory landscape across the United States. Notably, public health concerns emerge as a significant motivator for legislative action: as state firearm suicide and homicide rates increase, legislatures are demonstrably more inclined to implement restrictive firearm regulations. This analysis reveals how variations in state health metrics, political leanings, and demographics contribute to highly diverse policy environments. By providing a deeper understanding of the mechanisms that influence firearm policy adoption, I seek to inform scholars, activists, and policymakers alike. Understanding the diffusion of firearm regulations illuminates the political dynamics behind policy change and equips political actors with insights necessary to advocate for more effective public safety measures. In doing so, I aim to bridge the gap between research and practical policy applications to inform a strategic approach to addressing firearm violence in the US.
In this article, I provide an overview of policy diffusion as it relates to state firearm regulations, identifying key mechanisms that drive this process. However, several important questions remain unanswered. Future research could empirically examine explanations of policy diffusion – policy learning and imitation – to understand how each mechanism impacts firearm policy adoption and clarify the findings of this article. In addition, it would be valuable to explore the text of firearm bills for latent patterns that might signal emerging trends in regulation. Finally, investigating the role of interest groups could further illuminate how lobbying efforts and advocacy shape the legislative landscape across states.
Data availability statement
Replication materials are available on SPPQ Dataverse at https://doi.org/10.7910/DVN/NTAMVV.
Acknowledgements
The author would like to thank Bruce Desmarais, Tracee Saunders, Michael Nelson, and Charles Seguin for their valuable feedback and guidance.
Funding statement
The authors received no financial support for the research, authorship, and/or publication of this article.
Competing interests
The authors declare no potential competing interests with respect to the research, authorship, and/or publication of this article.
Appendix
Additional data sources and preprocessing
I derived my covariates from several sources to create my final dataset. The Correlates of State Policy Project (Grossmann, Marty, McCrain Reference Grossmann, Jordan and Joshua2021) provided the population, unemployment, and income estimates. To calculate the proportion of white individuals in each state, I utilized the CDC’s WONDER database. This variable is measured as the proportion of white individuals divided by the total population. The CDC WISQARS database provided estimates of total firearm homicides. The measure of citizen ideology was derived from the revised 1960–2016 citizen ideology series, which is a continuation of the Berry et al. (Reference Berry, Ringquist, Fording and Hanson1998) scores. Similarly, the state ideology score is based on the NOMINATE measure of state government ideology, was originally produced by Berry et al. (Reference Berry, Fording, Ringquist, Hanson and Klarner2010), and has since been updated. I utilized Brown–Mitchell scores of legislative professionalism, which have been demonstrated to have precision advantages compared with previous measures of professionalism (Brown and Mitchell Reference Brown and Mitchell2025). Schiller and Sidorsky (Reference Schiller and Sidorsky2022) provided the proportion of female members in the legislature. Finally, I used Schell et al.’s (Reference Schell, Peterson, Vegetabile, Scherling, Smart and Morral2020) proxy measure of firearm ownership.
After compiling these measures into one dataset, I was left with minimal missingness (~5%). Unemployment, citizen ideology, and state ideology had missing values primarily at the tail end of the dataset’s time frame. To impute these variables, I utilized Kalman filtering-based imputation; this approach models missing data through the use of a structural time-series model. After visually inspecting the imputed data frame, there were no apparent outliers or problematic estimates.
Policies analyzed (129; Siegel Reference Siegel2020)

With lagged neighbor adoption

Note: AIC = Akaike information criterion. *p < 0.05, **p < 0.01, ***p < 0.001.
Nicholas Hemauer is a Ph.D. candidate and computational social scientist at Penn State whose research combines machine learning, state politics, and public health policy.


 Open access