


1. Introduction
Globular clusters are among the oldest stellar systems in the Universe, serving as natural laboratories for studying the evolution of stars and the dynamical processes shaping stellar populations. These dense assemblies of stars provide critical insights into the early formation history of the Milky Way and other galaxies (Searle & Zinn Reference Searle and Zinn1978; Mackey et al. Reference Mackey2019; Monty et al. Reference Monty2023, and references therein). By analysing the colour–magnitude diagrams (CMDs) of globular clusters, one can infer their key parameters such as metallicity [Fe/H], age, distance R from the Sun, and interstellar extinction across multiple filters, which are essential for understanding the evolution of both individual stars and stellar populations (Marín-Franch et al. Reference Marn-Franch2009; Dotter, Sarajedini, & Anderson Reference Dotter, Sarajedini and Anderson2011; VandenBerg et al. Reference VandenBerg, Brogaard, Leaman and Casagrande2013; Stetson et al. Reference Stetson, Pancino, Zocchi, Sanna and Monelli2019; Ying et al. Reference Ying2025), see also the recent CARMA project papers (Massari et al. Reference Massari2023; Aguado-Agelet et al. Reference Aguado-Agelet2025; Ceccarelli et al. Reference Ceccarelli2025, hereafter CARMA). CMDs reveal the distribution of stars across different evolutionary stages, offering a direct way to test stellar evolution models against observational data (Dotter et al. Reference Dotter2010). In addition, the study of CMDs enables the exploration of phenomena such as mass loss, helium enrichment, and the impact of multiple stellar populations, which are crucial for refining theories of stellar and cluster evolution (Carretta et al. Reference Carretta, Bragaglia, Gratton, Recio-Blanco, Lucatello, D’Orazi and Cassisi2010; Milone et al. Reference Milone2017).
In our previous papers, we have estimated the key parameters for 14 Galactic clusters by fitting their CMDs with theoretical isochrones derived from stellar evolution models. Our approach and results are presented in Gontcharov, Mosenkov, & Khovritchev (Reference Gontcharov, Mosenkov and Khovritchev2019, hereafter Paper I), Gontcharov, Khovritchev, & Mosenkov (Reference Gontcharov, Khovritchev and Mosenkov2020, hereafter Paper II), (Gontcharov et al. Reference Gontcharov2021, hereafter Paper III), (Gontcharov et al. Reference Gontcharov2023b, hereafter Paper IV), (Gontcharov et al. Reference Gontcharov2023a, hereafter Paper V), and (Gontcharov et al. Reference Gontcharov2024, hereafter Paper VI). The CMDs in our papers are based on accurate selection of cluster members, using astrometry from the Hubble Space Telescope (HST; Libralato et al. Reference Libralato2022) or Gaia (Gaia Collaboration et al. Reference Collaboration2023), and photometry of these members in ultraviolet (UV), optical, or infrared (IR) filters. We use isochrones from Dartmouth Stellar Evolution Database (DSED, Dotter et al. Reference Dotter2010; Dotter et al. Reference Dotter, Chaboyer, Jevremovic, Kostov, Baron and Ferguson2008)Footnote
a
and a Bag of Stellar Tracks and Isochrones (BaSTI, Hidalgo et al. Reference Hidalgo2018; Pietrinferni et al. Reference Pietrinferni2021),Footnote
b
as they provide comprehensive and well-tested stellar evolution models with broad parameter coverage, including variations in metallicity, age, and $\alpha$
–enhancement, making them ideal for accurately fitting the colour–magnitude diagrams of globular clusters. Both the observations and isochrones successfully reproduce on the CMD the main stages of stellar evolution, including the main sequence (MS), turn-off (TO), subgiant branch (SGB), red giant branch (RGB), horizontal branch (HB), and asymptotic giant branch (AGB).
$\alpha$
–enhancement, making them ideal for accurately fitting the colour–magnitude diagrams of globular clusters. Both the observations and isochrones successfully reproduce on the CMD the main stages of stellar evolution, including the main sequence (MS), turn-off (TO), subgiant branch (SGB), red giant branch (RGB), horizontal branch (HB), and asymptotic giant branch (AGB).
Our previous papers demonstrate that the use of a large number of filters, CMDs, and cross-identified data sets allows us to reduce statistical uncertainties and identify systematic differences between the data sets. Moreover, by calculating interstellar extinction for each filter used, the inclusion of a large number of filters enables precise drawing and analysis of empirical extinction laws, i.e. the dependence of extinction on wavelength, for the globular clusters under consideration. Consequently, in this study, we use as many filters and high-quality data sets as possible, performing a comprehensive cross-identification of these data sets.
The continuous advancements in models, isochrones, photometry, and astrometry compel us to revise all the results presented in Paper I, Paper II, and Paper III, i.e. for NGC 288, NGC 362, NGC 5904 (Messier 5, M5), NGC 6205 (Messier 13, M13), and NGC 6218 (Messier 12, M12). In contrast, the results presented in Paper IV–Paper VI remain unchanged and require no revision. The most significant developments and improvements are: (i) revisions of the BaSTI isochrones, including very significant revision in 2021, (ii) our experience and studies of other authors (e.g. see Mucciarelli & Bonifacio Reference Mucciarelli and Bonifacio2020) approve determination of [Fe/H] as a parameter in our isochrone fitting instead of fixing [Fe/H] from the published results, as done in Paper I–Paper III, (iii) Gaia Data Release 3 (DR3; Gaia Collaboration et al. Reference Collaboration2023) since Paper I and Paper II, (iv) ongoing updates of the UBVRI photometry collection from various ground-based telescopes (Stetson et al. Reference Stetson, Pancino, Zocchi, Sanna and Monelli2019, hereafter SPZ19),Footnote c (v) SkyMapper Southern Sky Survey Data Release 4 (SMSS, SMSS DR4; Onken et al. Reference Onken, Wolf, Bessell, Chang, Luvaul, Tonry, White and Da Costa2024)Footnote d (vi) VISTA Hemisphere Survey catalog Data Release 5 (its older version is presented by McMahon et al. Reference McMahon, Banerji, Gonzalez, Koposov, Bejar, Lodieu, Rebolo and Collaboration2013), (vii) Dark Energy Survey Data Release 2 (DES DR2; Abbott et al. Reference Abbott2021),Footnote e (viii) data sets of Strömgren photometry for many clusters obtained by Jae-Woo Lee with the 1-m telescope at Cerro Tololo Inter-American Observatory (CTIO) and the 0.9-m telescope at Kitt Peak National Observatory (KPNO), which were partially presented by Lee et al. (Reference Lee, Kang, Lee and Lee2009) and (Reference Lee2017), (Reference Lee2021).
Besides our revised analysis of NGC 288, NGC 362, NGC 5904, NGC 6205, and NGC 6218, this study includes an application of our methodology to very interesting NGC 4372 and NGC 1904 (Messier79, M79).
As this is the seventh paper in the series, many details of our analysis are discussed in our previous works. We refer the reader to those papers, especially to Paper IV–Paper VI, which are almost free from the described shortcomings of Paper I–Paper III.
This paper is organised as follows. In Section 2, we consider some properties of the clusters under consideration. In Section 3, we present the data sets used. We provide some analysis of the data and models in Section 4. In Section 5, we present and discuss the results of our isochrone fitting. We summarise our main findings and conclusions in Section 6. Some details of our study and additional CMDs of the clusters are provided in Appendixes and Supplemental Material.
2. Properties of the clusters
The key properties of the clusters under consideration are presented in Table 1. The table highlights that some characteristics of these intriguing clusters remain uncertain and warrant further clarification. This is particularly significant for the relatively distant NGC 1904 and heterogeneously reddened NGC 4372. The data sets obtained with the HST Wide Field Channel of the Advanced Camera for Surveys (ACS) and Wide Field Camera 3 (WFC3) (Nardiello et al. Reference Nardiello2018, hereafter NLP18)Footnote f have been widely used by various authors to derive the cluster properties listed in Table 1. Such data sets are not available for NGC 1904 and NGC 4372.Footnote g As a result, our study provides one of the few available estimates of age, distance, and photometric [Fe/H] for NGC 1904 and NGC 4372.
Some properties of the clusters under consideration.

Coordinates are taken from Goldsbury et al. (Reference Goldsbury, Richer, Anderson, Dotter, Sarajedini and Woodley2010) or calculated by us as medians for cluster members, $r_t/r_c$
is the ratio of tidal and core radii,
$r_t/r_c$
is the ratio of tidal and core radii, $\Delta(V-I)$
is the median colour difference between the HB and RGB from Dotter et al. (Reference Dotter2010), R is the distance from the Sun,
$\Delta(V-I)$
is the median colour difference between the HB and RGB from Dotter et al. (Reference Dotter2010), R is the distance from the Sun, $\delta Y_{2G,1G}$
is the average helium mass fraction difference between the second and first stellar generations,
$\delta Y_{2G,1G}$
is the average helium mass fraction difference between the second and first stellar generations, $\delta Y_{\max}$
is the maximum internal variation of helium mass fraction,
$\delta Y_{\max}$
is the maximum internal variation of helium mass fraction, $\overline{\Delta E(B-V)}$
and
$\overline{\Delta E(B-V)}$
and $\Delta E(B-V)_{\mathrm{max}}$
are the mean and maximum differential reddening from BCK13, respectively,
$\Delta E(B-V)_{\mathrm{max}}$
are the mean and maximum differential reddening from BCK13, respectively, $\Delta E(B-V)$
is the difference between the 98th and the 2nd percentile of differential-reddening distributions from Jang et al. (Reference Jang2022), while
$\Delta E(B-V)$
is the difference between the 98th and the 2nd percentile of differential-reddening distributions from Jang et al. (Reference Jang2022), while $dE(B-V)_{\mathrm{max}}$
is the total differential reddening from Pancino et al. (Reference Pancino2024). We use the R and [Fe/H] estimates of Arellano Ferro (Reference Arellano Ferro2024) for the RRc variable stars, with the [Fe/H] estimates being on the [Fe/H] scale of Carretta et al. (Reference Carretta, Bragaglia, Gratton, D’Orazi and Lucatello2009). The Arellano Ferro Reference Arellano Ferro2024 values without uncertainties are based on the only measurement.
$dE(B-V)_{\mathrm{max}}$
is the total differential reddening from Pancino et al. (Reference Pancino2024). We use the R and [Fe/H] estimates of Arellano Ferro (Reference Arellano Ferro2024) for the RRc variable stars, with the [Fe/H] estimates being on the [Fe/H] scale of Carretta et al. (Reference Carretta, Bragaglia, Gratton, D’Orazi and Lucatello2009). The Arellano Ferro Reference Arellano Ferro2024 values without uncertainties are based on the only measurement.
Among the seven clusters analysed in this study, five (excluding NGC 6218 and NGC 4372) exhibit extremely low, nearly zero extinction. For NGC 288 this is justified by the fact that this cluster is located very close to the South Galactic Pole. Thus, extinction estimates from this study are valuable for establishing a lower limit on total Galactic extinction across the entire Galactic dust layer.
Also, we investigate the parameters influencing the different HB morphology of globular clusters. Specifically, NGC 1904, the currently revised NGC 6205, and NGC 5272 from Paper VI share a similar metallicity of [Fe/H] $\approx-1.6$
, yet exhibit distinct HB morphologies. Furthermore, the HB morphology of a metal-poor cluster NGC 4372 should be compared with that of NGC 5024, NGC 5053, NGC 5466, and NGC 7099 from Paper VI, as they have a similar [Fe/H]
$\approx-1.6$
, yet exhibit distinct HB morphologies. Furthermore, the HB morphology of a metal-poor cluster NGC 4372 should be compared with that of NGC 5024, NGC 5053, NGC 5466, and NGC 7099 from Paper VI, as they have a similar [Fe/H] $\approx-2$
. Finally, the quartet of clusters – NGC 288, NGC 362, NGC 5904, and NGC 6218 – with similar metallicity [Fe/H]
$\approx-2$
. Finally, the quartet of clusters – NGC 288, NGC 362, NGC 5904, and NGC 6218 – with similar metallicity [Fe/H] $\approx-1.3$
is well-known for their distinct HB morphology difference. This difference suggests that one or more parameters beyond metallicity must be responsible for the HB morphology (Lee & Carney Reference Lee and Carney1999; Dalessandro et al. Reference Dalessandro, Salaris, Ferraro, Mucciarelli and Cassisi2013; Lee Reference Lee2024). Various authors have introduced HB morphology indices to emphasise the difference. These indices for the clusters under consideration are presented in Table 1:
$\approx-1.3$
is well-known for their distinct HB morphology difference. This difference suggests that one or more parameters beyond metallicity must be responsible for the HB morphology (Lee & Carney Reference Lee and Carney1999; Dalessandro et al. Reference Dalessandro, Salaris, Ferraro, Mucciarelli and Cassisi2013; Lee Reference Lee2024). Various authors have introduced HB morphology indices to emphasise the difference. These indices for the clusters under consideration are presented in Table 1: $\Delta(V-I)$
defined by Dotter et al. (Reference Dotter2010),
$\Delta(V-I)$
defined by Dotter et al. (Reference Dotter2010), $\tau_{HB}$
defined by Torelli et al. (Reference Torelli2019), and the HB typeFootnote
i
calculated by Torelli et al. (Reference Torelli2019) and Arellano Ferro (Reference Arellano Ferro2024).
$\tau_{HB}$
defined by Torelli et al. (Reference Torelli2019), and the HB typeFootnote
i
calculated by Torelli et al. (Reference Torelli2019) and Arellano Ferro (Reference Arellano Ferro2024).
Furthermore, NGC 362 is interesting posing a challenge in distinguishing its members from the background Small Magellanic Cloud.
NGC 288 and NGC 6218 are interesting as some of the oldest Galactic globular clusters. The important BaSTI revision in 2021 seems to decrease its predicted age by about 1.2 Gyr making the BaSTI age estimates consistent with those from DSED despite the different input physics in these models. Therefore, this study has the potential to deliver some of the most precise estimates of the age of the oldest globular clusters relative to the age of the Universe. $Y_{\mathrm{mix}}$
calculated with formula (1) and adopted for the fitted mix of stellar generations.
$Y_{\mathrm{mix}}$
calculated with formula (1) and adopted for the fitted mix of stellar generations.
 $Y_{\mathrm{1G}}$
is the primordial Y stated by BaSTI for the cluster’s [Fe
$Y_{\mathrm{1G}}$
is the primordial Y stated by BaSTI for the cluster’s [Fe $/{H}]$
,
$/{H}]$
, $N_{\mathrm{1G}}/N_{\mathrm{TOT}}$
is the fraction of 1G stars,
$N_{\mathrm{1G}}/N_{\mathrm{TOT}}$
is the fraction of 1G stars, $\delta Y_{\mathrm{2G,1G}}$
is the average difference between 2G and 1G stars (see the text).
$\delta Y_{\mathrm{2G,1G}}$
is the average difference between 2G and 1G stars (see the text).
The clusters under consideration have, at least, two stellar generations (Lee et al. Reference Lee, Kang, Lee and Lee2009; Lee Reference Lee2017; Lee Reference Lee2021; Milone et al. Reference Milone2017; Jang et al. Reference Jang2025), hereafter designated as 1G and 2G, respectively, with a similar enrichment by $\alpha$
elements [
$\alpha$
elements [ $\alpha$
/Fe]
$\alpha$
/Fe] $\approx0.4$
(Johnson & Pilachowski Reference Johnson and Pilachowski2006; Carretta et al. Reference Carretta, Bragaglia, Gratton, Recio-Blanco, Lucatello, D’Orazi and Cassisi2010; San Roman et al. Reference San Roman2015; Masseron et al. Reference Masseron2019), but a mild difference
$\approx0.4$
(Johnson & Pilachowski Reference Johnson and Pilachowski2006; Carretta et al. Reference Carretta, Bragaglia, Gratton, Recio-Blanco, Lucatello, D’Orazi and Cassisi2010; San Roman et al. Reference San Roman2015; Masseron et al. Reference Masseron2019), but a mild difference $\delta Y_{\rm 2G,1G}$
in helium mass fraction Y between 2G and 1G, as seen from Table 1.
$\delta Y_{\rm 2G,1G}$
in helium mass fraction Y between 2G and 1G, as seen from Table 1.
We choose the clusters with a rather small $\delta Y_{\rm 2G,1G}$
to fit an observed mix of the generations. We adopt the helium mass fraction
$\delta Y_{\rm 2G,1G}$
to fit an observed mix of the generations. We adopt the helium mass fraction $Y_{\mathrm{mix}}$
of the mix calculated as
$Y_{\mathrm{mix}}$
of the mix calculated as
 \begin{equation}Y_{\mathrm{mix}}=Y_{\mathrm{1G}}\cdot N_{\mathrm{1G}}/N_{\mathrm{TOT}}+(Y_{\mathrm{1G}}+\delta Y_{\mathrm{2G,1G}})\cdot(1-N_{\mathrm{1G}}/N_{\mathrm{TOT}}),\end{equation}
where $Y_{\mathrm{1G}}$
is the primordial Y given by BaSTI for the cluster’s [Fe/H] and
$Y_{\mathrm{1G}}$
is the primordial Y given by BaSTI for the cluster’s [Fe/H] and $[\alpha/$
Fe],
$[\alpha/$
Fe], $N_{\mathrm{1G}}/N_{\mathrm{TOT}}$
is the fraction of 1G stars adopted from Jang et al. (Reference Jang2025), Dondoglio et al. (Reference Dondoglio, Milone, Lagioia, Marino, Tailo, Cordoni, Jang and Carlos2021) or adopted for NGC 4372 as 0.3 based on the spectroscopic data from San Roman et al. (Reference San Roman2015),
$N_{\mathrm{1G}}/N_{\mathrm{TOT}}$
is the fraction of 1G stars adopted from Jang et al. (Reference Jang2025), Dondoglio et al. (Reference Dondoglio, Milone, Lagioia, Marino, Tailo, Cordoni, Jang and Carlos2021) or adopted for NGC 4372 as 0.3 based on the spectroscopic data from San Roman et al. (Reference San Roman2015), $\delta Y_{\mathrm{2G,1G}}$
is adopted from Milone et al. (Reference Milone2018) or adopted for NGC 1904 the same as for its metallicity and age analog NGC 6205 and for NGC 4372
$\delta Y_{\mathrm{2G,1G}}$
is adopted from Milone et al. (Reference Milone2018) or adopted for NGC 1904 the same as for its metallicity and age analog NGC 6205 and for NGC 4372 $\delta Y_{\mathrm{2G,1G}}=0.006$
as the average between the estimates for its metallicity and age analogs NGC 5053 and NGC 7099 from Paper VI (see Section 5.3). The uncertainty of
$\delta Y_{\mathrm{2G,1G}}=0.006$
as the average between the estimates for its metallicity and age analogs NGC 5053 and NGC 7099 from Paper VI (see Section 5.3). The uncertainty of $Y_{\mathrm{mix}}$
is calculated from the uncertainties of the input arguments. For
$Y_{\mathrm{mix}}$
is calculated from the uncertainties of the input arguments. For $Y_{\mathrm{mix}}$
of NGC 1904 and NGC 4372, we adopt a higher uncertainty 0.01. All the quantities are presented in Table 2.
$Y_{\mathrm{mix}}$
of NGC 1904 and NGC 4372, we adopt a higher uncertainty 0.01. All the quantities are presented in Table 2.
3. Data sets
For all the clusters, we use cognate data sets acquired using the same telescope and/or processed through a consistent pipeline:
-
1. Gaia DR3 photometry in the G, $G_{\mathrm{BP}}$
and
$G_{\mathrm{RP}}$
filters (Riello et al. Reference Riello2021): 4 067, 4 908, 1 817, 6 933, 9 746, 10 448, and 6 918 cluster members in NGC 288, NGC 362, NGC 1904, NGC 4372, NGC 5904, NGC 6205, and NGC 6218, respectively.Footnote
j
The Gaia CMDs with our best isochrone fitting for all the clusters are shown in Figure 1.Footnote
k
Figure 1.
$G_{\mathrm{BP}}-G_{\mathrm{RP}}$
versus
$G_{\mathrm{RP}}$
CMDs for cluster members from the Gaia DR3. The clusters are ordered by their [Fe/H]: those with [Fe/H]
$\approx-1.3$
are in the left column, while NGC 1904 and NGC 6205 with [Fe/H]
$\approx-1.6$
are in the top of the right column. The NGC 4372 CMDs before and after our DR correction are shown in the bottom of the right column. The isochrones for a primordial
$Y\approx0.25$
from BaSTI (red), BaSTI ZAHB (purple), and DSED (green), isochrones for
$Y=0.275$
from BaSTI (orange), and BaSTI ZAHB (blue), as well as isochrones for
$Y=0.33$
from DSED (luminous green) are calculated with the best-fitting parameters from Table B2. Variable stars are shown by the magenta diamonds.
$G_{\mathrm{BP}}$
and
$G_{\mathrm{RP}}$
filters (Riello et al. Reference Riello2021): 4 067, 4 908, 1 817, 6 933, 9 746, 10 448, and 6 918 cluster members in NGC 288, NGC 362, NGC 1904, NGC 4372, NGC 5904, NGC 6205, and NGC 6218, respectively.Footnote
j
The Gaia CMDs with our best isochrone fitting for all the clusters are shown in Figure 1.Footnote
k
Figure 1.
$G_{\mathrm{BP}}-G_{\mathrm{RP}}$
versus
$G_{\mathrm{RP}}$
CMDs for cluster members from the Gaia DR3. The clusters are ordered by their [Fe/H]: those with [Fe/H]
$\approx-1.3$
are in the left column, while NGC 1904 and NGC 6205 with [Fe/H]
$\approx-1.6$
are in the top of the right column. The NGC 4372 CMDs before and after our DR correction are shown in the bottom of the right column. The isochrones for a primordial
$Y\approx0.25$
from BaSTI (red), BaSTI ZAHB (purple), and DSED (green), isochrones for
$Y=0.275$
from BaSTI (orange), and BaSTI ZAHB (blue), as well as isochrones for
$Y=0.33$
from DSED (luminous green) are calculated with the best-fitting parameters from Table B2. Variable stars are shown by the magenta diamonds. -
2. UBVI photometry from various ground-based telescopes processed by SPZ19: 4 402, 4 981, 2 646, 6 399, 10 704, 9 421, and 6 805 cluster members, common in SPZ19 and Gaia DR3, in NGC 288, NGC 362, NGC 1904, NGC 4372, NGC 5904, NGC 6205, and NGC 6218, respectively. The SPZ19 CMDs with our best isochrone fitting for all the clusters are shown in Figure 2.
Figure 2.
$B-I$
versus I CMDs for cluster members from the cross-identification of the Gaia DR3 and SPZ19 data sets. The clusters are ordered by their [Fe/H] as in Figure 1. The isochrones for a primordial
$Y\approx0.25$
from BaSTI (red), BaSTI ZAHB (purple), and DSED (green), DSED HB/AGB tracks (light green), isochrones for
$Y=0.275$
from BaSTI (orange), and BaSTI ZAHB (blue), as well as isochrones for
$Y=0.33$
from DSED (luminous green) are calculated with the best-fitting parameters from Table B2. Variable stars are shown by the magenta diamonds. -
3. Strömgren byFootnote l photometry obtained with the 1-m telescope at CTIO and the 0.9-m telescope at KPNO for 3074, 5511, 1598, 4722, 16715, 16527, and 5541 cluster members, common with Gaia DR3, in NGC 288, NGC 362, NGC 1904, NGC 4372, NGC 5904, NGC 6205, and NGC 6218, respectively. These data sets are partially presented by Lee et al. (Reference Lee, Kang, Lee and Lee2009) and (Reference Layden, Sarajedini, von Hippel and Cool2017, Reference Lee2021), but entirely represented in this study. The Lee CMDs with our best isochrone fitting for all the clusters are shown in Figure 3.
Figure 3.The same as Figure 2 but for the
$b-y$
versus y CMDs for cluster members from the cross-identification of the Gaia DR3 and Lee data sets. For NGC 5904 the ordinate is the V magnitude. -
4. Wide-field Infrared Survey Explorer (WISE; Wright et al. Reference Wright2010) photometry in the W1 filter from the unWISE catalogue (Schlafly, Meisner, & Green Reference Schlafly, Meisner and Green2019)Footnote m for 470, 623, 333, 1101, 1513, 990, and 813 cluster members, common with Gaia DR3, in NGC 288, NGC 362, NGC 1904, NGC 4372, NGC 5904, NGC 6205, and NGC 6218, respectively. For the distant NGC 1904, the unWISE photometry poorly covers the important TO domain of CMDs and, hence, is not used for the final estimates of extinction.


The following data sets exist for some but not all the clusters:
-
5. The HST WFC3 UV Legacy Survey of Galactic Globular Clusters (the F275W, F336W, and F438W filters) and the ACS (the F606W and F814W filters) survey of Galactic globular clusters (Piotto et al. Reference Piotto2015; Nardiello et al. Reference Nardiello2018): 15 743, 45 479, 61 724, 70 408, 22 921 cluster members in NGC 288, NGC 362, NGC 5904, NGC 6205, and NGC 6218, respectively.
-
6. The Panoramic Survey Telescope and Rapid Response System Data Release I (Pan-STARRS, PS1) photometry in the
$g_{\mathrm{PS1}}$
,
$r_{\mathrm{PS1}}$
,
$i_{\mathrm{PS1}}$
,
$z_{\mathrm{PS1}}$
, and
$y_{\mathrm{PS1}}$
filters (Chambers et al. Reference Chambers2016): 4485, 1909, 9723, 10699, and 6918 cluster members, common with Gaia DR3, in NGC 288, NGC 1904, NGC 5904, NGC 6205, NGC 6218, respectively. -
7. The Sloan Digital Sky Survey (SDSS) photometry in the
$u_{\mathrm{SDSS}}$
,
$g_{\mathrm{SDSS}}$
,
$r_{\mathrm{SDSS}}$
,
$i_{\mathrm{SDSS}}$
, and
$z_{\mathrm{SDSS}}$
filters (An et al. Reference An2008):Footnote
n
9 963 and 9 632 cluster members, common with Gaia DR3, in NGC 5904 and NGC 6205, respectively. -
8. The SMSS DR4 photometry in the
$g_{\mathrm{SMSS}}$
,
$r_{\mathrm{SMSS}}$
,
$i_{\mathrm{SMSS}}$
, and
$z_{\mathrm{SMSS}}$
filters for 2571, 2003, 1065, 2734, 4701, 3071 cluster members, common with Gaia DR3, in NGC 288, NGC 362, NGC 1904, NGC 4372, NGC 5904, and NGC 6218, respectively. -
9. The Strömgren uvby photometry of 9316, 2559, 1889, 6549, 11413 cluster members, common with the Gaia DR3 or NLP18 HST data sets,Footnote o in NGC 288, NGC 362, NGC 1904, NGC 5904, NGC 6205, respectively, obtained by (Grundahl et al. Reference Grundahl, Catelan, Landsman, Stetson and Andersen1999, hereafter GCL99) with the Nordic Optical Telescope (NOT), La Palma.
-
10. The
$Y_{\mathrm{VISTA}}$
,
$J_{\mathrm{VISTA}}$
, and
$K_{\mathrm{VISTA}}$
photometry with the VISTA Hemisphere Survey with the VIRCAM instrument on the Visible and Infrared Survey Telescope for Astronomy (VISTA, VHS DR5) (McMahon et al. Reference McMahon, Banerji, Gonzalez, Koposov, Bejar, Lodieu, Rebolo and Collaboration2013)Footnote
p
for 3202, 1863, 7527, and 8267 cluster members, common with Gaia DR3, in NGC 362, NGC 1904, NGC 4372, and NGC 6218, respectively. -
11. The
$Y_{\mathrm{UKIDSS}}$
,
$J_{\mathrm{UKIDSS}}$
, and
$K_{\mathrm{UKIDSS}}$
photometry with the United Kingdom Infrared Telescope Infrared Deep Sky Survey (UKIDSS) (Hewett et al. Reference Hewett, Warren, Leggett and Hodgkin2006)Footnote
q
for 4127 cluster members, common with Gaia DR3, in NGC 5904. -
12. The VI photometry with the 2.2 m ESO/MPI telescope, La Silla, equipped with the EFOSC2 camera, as well as the fiducial sequence (Bellazzini et al. Reference Bellazzini, Pecci, Ferraro, Galleti, Catelan and Landsman2001) for 2002 and 3243 cluster members, common with Gaia DR3, in NGC 288 and NGC 362, respectively.
-
13. The BV photometry with the 1-m Swope telescope of the Las Campanas Observatory (Narloch et al. Reference Narloch, Kaluzny, Poleski, Rozyczka, Pych and Thompson2017) for 4135, 7728, and 5973 cluster members, common with Gaia DR3, in NGC 362, NGC 5904, and NGC 6218, respectively.
-
14. The UBVI photometry of 4118 cluster members, common with Gaia DR3, in NGC 362 obtained within the Magellanic Clouds Photometric Survey (MCPS) with the 1-m Swope telescope of the Las Campanas Observatory (Zaritsky et al. Reference Zaritsky, Harris, Thompson, Grebel and Massey2002).
-
15. The BVI photometry with the Kitt Peak National Observatory 0.9-m telescope (Hargis, Sandquist, & Bolte Reference Hargis, Sandquist and Bolte2004) for 5276 cluster members, common with Gaia DR3, in NGC 6218.
-
16. The BV photometry with the 2.5-m du Pont telescope of the Las Campanas Observatory (Zloczewski et al. Reference Zloczewski, Kaluzny, Rozyczka, Krzeminski and Mazur2012; Kaluzny et al. Reference Kaluzny, Thompson, Narloch, Pych and Rozyczka2015) for 3 620 cluster members, common with Gaia DR3, in NGC 6218.
-
17. The DES photometry in the
$g_{\mathrm{DECam}}$
,
$r_{\mathrm{DECam}}$
,
$i_{\mathrm{DECam}}$
, and
$z_{\mathrm{DECam}}$
filters obtained by Abbott et al. (Reference Abbott2021) with the Dark Energy Camera (DECam) mounted on the 4-m Blanco telescope at CTIO for 898 cluster members, common with Gaia DR3, in NGC 1904.Footnote
r
-
18. The UBV photometry with the 3.5-m New Technology Telescope (NTT) telescope at the European Southern Observatory, La Silla, with the EMMI camera for 1078 cluster members, common with Gaia DR3, in NGC 1904 (Kravtsov et al. Reference Kravtsov, Ipatov, Samus, Smirnov, Alcaino, Liller and Alvarado1997).Footnote s
-
19. The
$K_{\mathrm{2MASS}}$
(
$K_s$
)Footnote
t
photometry in the Two Micron All-Sky Survey (2MASS, Skrutskie et al. Reference Skrutskie2006) system obtained with SOFI at the NTTFootnote
u
(Coppola et al. Reference Coppola2011) for 2710 cluster members, common with Gaia DR3, in NGC 5904. -
20. The BV photometry of 2075 stars in NGC 6205 with the 2.4-m telescope at Michigan-Dartmouth-MIT Observatory (Rey et al. Reference Rey, Yoon, Lee, Chaboyer and Sarajedini2001).Footnote v


We do not use some data sets for these clusters (including some data sets considered in Paper I–Paper III) due to the reasons explained in Appendix A.
All the data sets with the same filters are independent, e.g. GCL99 versus Lee (Reference Lee2017, Reference Lee2021). The SPZ19 data sets include photometry from various initial sources but not from the other data sets under consideration.
As in our previous papers, we perform comprehensive cross-identification of the data sets.
In total, 26, 24, 28, 17, 35, 27, and 27 filters are used for NGC 288, NGC 362, NGC 1904, NGC 4372, NGC 5904, NGC 6205, and NGC 6218, respectively. Each star has photometry in some but not all filters. The filters used and cleaning of the data sets are described in Appendix B. After the cleaning, the median photometric uncertainty, derived from the data set authors’ uncertainty statements, is a few hundredths of a magnitude for all the filters. The uncertainty statements are used to assess the statistical uncertainty of our results, though the systematic uncertainty is higher, as demonstrated in Sections 4.3 and 5.
3.1. Cluster members
Table 1 presents rather different tidal radius estimates for each cluster. Accordingly, we consider the initial Gaia DR3 samples within some initial radii that exceed any previous radius estimates. We determine truncation radii, listed in Table 1, as the radii at which the cluster member count surface density decreases to the Galactic background (see Section 4.2 in Paper IV). We truncate all the data sets at these radii to reduce contamination from non-members. This truncation allows us to create very clean samples. While we may lose a small number of cluster members beyond the truncation radii, their absence is negligible and does not significantly influence our results.
As in our previous papers, accurate Gaia DR3 parallaxes and proper motions (PMs) are used to select cluster members and derive systemic parallaxes and PMs. We now briefly describe this procedure.
We leave only stars with parallaxes and PMs.Footnote
w
This selects almost all stars brighter than a magnitude in the middle of the MS, as seen in Figures 1–3. Foreground and background stars are rejected as those with measured parallax $\varpi\gt1/R+3\sigma_{\varpi}$
or
$\varpi\gt1/R+3\sigma_{\varpi}$
or $\varpi\lt1/R-3\sigma_{\varpi}$
, where
$\varpi\lt1/R-3\sigma_{\varpi}$
, where $\sigma_{\varpi}$
is the stated parallax uncertainty and R is the distance from the Sun. Initially, we adopt the R estimates from Baumgardt & Vasiliev (Reference Baumgardt and Vasiliev2021, hereafter BV21) presented in Table 1 and then replace them by the R estimates derived from our isochrone fitting repeating the rejection of foreground and background stars iteratively. To select cluster members as stars with appropriate PMs, we start with the initial systemic PM components
$\sigma_{\varpi}$
is the stated parallax uncertainty and R is the distance from the Sun. Initially, we adopt the R estimates from Baumgardt & Vasiliev (Reference Baumgardt and Vasiliev2021, hereafter BV21) presented in Table 1 and then replace them by the R estimates derived from our isochrone fitting repeating the rejection of foreground and background stars iteratively. To select cluster members as stars with appropriate PMs, we start with the initial systemic PM components $\overline{\unicode{x03BC}_{\alpha}\cos(\delta)}$
and
$\overline{\unicode{x03BC}_{\alpha}\cos(\delta)}$
and $\overline{\unicode{x03BC}_{\delta}}$
from Vasiliev & Baumgardt (Reference Vasiliev and Baumgardt2021, hereafter VB21), calculate the standard deviations
$\overline{\unicode{x03BC}_{\delta}}$
from Vasiliev & Baumgardt (Reference Vasiliev and Baumgardt2021, hereafter VB21), calculate the standard deviations $\sigma_{\unicode{x03BC}_{\alpha}\cos(\delta)}$
and
$\sigma_{\unicode{x03BC}_{\alpha}\cos(\delta)}$
and $\sigma_{\unicode{x03BC}_{\delta}}$
, and select cluster members as stars within
$\sigma_{\unicode{x03BC}_{\delta}}$
, and select cluster members as stars within $3\sigma$
, i.e. with
$3\sigma$
, i.e. with $\sqrt{(\unicode{x03BC}_{\alpha}\cos(\delta)-\overline{\unicode{x03BC}_{\alpha}\cos(\delta)})^2+(\unicode{x03BC}_{\delta}-\overline{\unicode{x03BC}_{\delta}})^2}\lt3\sqrt{\sigma_{\unicode{x03BC}_{\alpha}\cos(\delta)}^2+\sigma_{\unicode{x03BC}_{\delta}}^2}$
. With the refined list of the members, we recalculate the median systemic PM components, truncation radii, and coordinates of the cluster centres as medians of the member coordinates (the latter is initially taken from Table 1 and then change negligibly). This selection of members is repeated iteratively until we stop losing stars in the
$\sqrt{(\unicode{x03BC}_{\alpha}\cos(\delta)-\overline{\unicode{x03BC}_{\alpha}\cos(\delta)})^2+(\unicode{x03BC}_{\delta}-\overline{\unicode{x03BC}_{\delta}})^2}\lt3\sqrt{\sigma_{\unicode{x03BC}_{\alpha}\cos(\delta)}^2+\sigma_{\unicode{x03BC}_{\delta}}^2}$
. With the refined list of the members, we recalculate the median systemic PM components, truncation radii, and coordinates of the cluster centres as medians of the member coordinates (the latter is initially taken from Table 1 and then change negligibly). This selection of members is repeated iteratively until we stop losing stars in the $3\sigma$
cut. The importance and efficiency of the selection of cluster members using the Gaia parallaxes and proper motions is illustrated in Appendix C.
$3\sigma$
cut. The importance and efficiency of the selection of cluster members using the Gaia parallaxes and proper motions is illustrated in Appendix C.
Similar to clusters in our previous papers, the final empirical standard deviations $\sigma_{\unicode{x03BC}_{\alpha}\cos(\delta)}$
and
$\sigma_{\unicode{x03BC}_{\alpha}\cos(\delta)}$
and $\sigma_{\unicode{x03BC}_{\delta}}$
are reasonable, but slightly higher than the mean stated PM uncertainties, which may mean an underestimation of the latter.
$\sigma_{\unicode{x03BC}_{\delta}}$
are reasonable, but slightly higher than the mean stated PM uncertainties, which may mean an underestimation of the latter.
Our final systemic parallaxes and PMs are determined as the median values for the cluster members. Hence, our current PM estimates differ from those presented in Paper III due to the adoption of larger truncation radii for these clusters and the use of median values instead of weighted means. Our systemic PMs are presented in Table 3 in comparison with those from VB21 and Vitral (Reference Vitral2021), which are also derived from Gaia DR3 but using different approaches. The total (statistic plus systematic) uncertainty of all these PM estimates is vastly dominated by the same systematics, as shown by VB21, and, hence, is the same regardless of approach. Table 3 shows that all the systemic PM estimates agree within the total uncertainties.
The cluster systemic PMs (mas yr $^{-1}$
). The provided total uncertainties are dominated by the same systematic uncertainties as indicated by VB21.
$^{-1}$
). The provided total uncertainties are dominated by the same systematic uncertainties as indicated by VB21.

We correct the parallaxes of cluster members for the parallax zero-point following Lindegren et al. (Reference Lindegren2021) and present the median corrected parallaxes in Table 4 for comparison with other estimates in Section 5. We adopt the total uncertainty of Gaia DR3 parallaxes, as determined by VB21, to be 0.01 mas.
Parallax estimates (mas) with their total (statistic and systematic) uncertainties for clusters under consideration.

The Rey et al. (Reference Rey, Yoon, Lee, Chaboyer and Sarajedini2001), NLP18, and some GCL99 data sets are not cross-identified with Gaia. The former is cleared from non-members by its authors. The cluster members are effectively selected from the NLP18 data sets (and some GCL99 data sets cross-identified with them) by their authors using dedicated HST PMs (see discussion in Appendix C).
4. Analysis
4.1. Differential reddening
Following the method of Bonatto, Campos, & Kepler (Reference Bonatto, Campos and Kepler2013, hereafter BCK13), we calculate variations of foreground reddening across the cluster field, i.e. differential reddening (DR) for all CMDs, which are based on a data set or a pair of cross-identified data sets with enough ( $\gt$
$\gt$ $3\,000$
) stars. Briefly, the cluster field is divided into a grid of cells, with higher angular resolution in regions containing more stars. Then, the stellar density Hess diagram (including photometric errors) of each cell is matched to the diagram, averaged over the entire cluster field, by its shift along the reddening vector. This shift is then converted into DR in the cell. The same DR correction is applied to all stars in one cell. For illustrative purposes, to present the derived DR maps in Figures 4 and 11, we recalculate them for cells of a constant angular resolution averaging the individual DR corrections for stars in each cell.
$3\,000$
) stars. Briefly, the cluster field is divided into a grid of cells, with higher angular resolution in regions containing more stars. Then, the stellar density Hess diagram (including photometric errors) of each cell is matched to the diagram, averaged over the entire cluster field, by its shift along the reddening vector. This shift is then converted into DR in the cell. The same DR correction is applied to all stars in one cell. For illustrative purposes, to present the derived DR maps in Figures 4 and 11, we recalculate them for cells of a constant angular resolution averaging the individual DR corrections for stars in each cell.
DR maps derived from SFD98, GMS25, and various CMDs for the same NGC 4372 field. The DR maps derived from CMDs are converted from the initial adaptive angular resolution to the constant resolution of 1.5 arcmin for Gaia–unWISE and SMSS maps and 1 arcmin for the remaining CMD-based maps. SFD98 and GMS25 have the resolution of 6.1 arcmin. All the maps are converted into $\Delta E(B-V)$
using the CCM89 extinction law with
$\Delta E(B-V)$
using the CCM89 extinction law with $R_{V}=3.1$
. The white areas have no estimates. The cluster centre is the black cross, the position of bright star HD 107947 is marked by the magenta cross.
$R_{V}=3.1$
. The white areas have no estimates. The cluster centre is the black cross, the position of bright star HD 107947 is marked by the magenta cross.

We do not calculate DR for NGC 1904, since none of its CMDs contains more than 3 000 stars. However, NGC 1904 DR estimated by Pancino et al. (Reference Pancino2024) appears within $-0.005\lt dE(B-V)\lt0.005$
mag, i.e. with a negligible impact on its CMDs.
$-0.005\lt dE(B-V)\lt0.005$
mag, i.e. with a negligible impact on its CMDs.
Generally, NGC 4372 and NGC 6218 demonstrate a considerable DR ( $\Delta E(B-V)\gt0.03$
mag) versus a negligible DR for the remaining clusters. This is in line with the DR estimates in Table 1 obtained by Jang et al. (Reference Jang2022) and Pancino et al. (Reference Pancino2024), but not with those of BCK13, since the latter use the NLP18 data sets covering only a few central arcminutes of the cluster fields, where DR is relatively low and rather uncertain for all these clusters.
$\Delta E(B-V)\gt0.03$
mag) versus a negligible DR for the remaining clusters. This is in line with the DR estimates in Table 1 obtained by Jang et al. (Reference Jang2022) and Pancino et al. (Reference Pancino2024), but not with those of BCK13, since the latter use the NLP18 data sets covering only a few central arcminutes of the cluster fields, where DR is relatively low and rather uncertain for all these clusters.
CMDs without enough stars are not corrected for DR, except for NGC 4372 and NGC 6218 whose such CMDs are corrected using our DR maps derived from the Gaia CMDs (since all the data sets are cross-identified with Gaia).
Examples of CMDs for NGC 4372 before and after applying our DR correction are displayed in Figures 1–3, with additional examples provided in Appendix C. The effectiveness of our corrections is clearly demonstrated in these diagrams by the reduced scatter of points around the isochrones.
Figure 4 presents several DR maps for NGC 4372,Footnote
x
including those based on global extinction/reddening maps, which are the most suitable for this cluster field: reddening map of Schlegel, Finkbeiner, & Davis (Reference Schlegel, Finkbeiner and Davis1998, hereafter SFD98) and our recent 3D extinction map based on the Gaia DR3 astrometry and multi-band photometry (Gontcharov et al. Reference Gontcharov, Marchuk, Savchenko, Mosenkov, Il’in, Poliakov, Smirnov and Krayani2025, hereafter GMS25). Note that other global reddening maps are less appropriate or informative in this field: the Green et al.(Reference Green, Schlafly, Zucker, Speagle and Finkbeiner2019, hereafter GSZ19) reddening map does not cover the NGC 4372 field, the Schlafly & Finkbeiner (Reference Schlafly and Finkbeiner2011) map differs from SFD98 by only a constant term, while the Lallement et al. (Reference Lallement, Babusiaux, Vergely, Katz, Arenou, Valette, Hottier and Capitanio2019) map predicts an unrealistically small reddening (see Table 1) and DR of only $\Delta E(B-V)\approx0.03$
mag. Figure 4 shows nearly the same pattern in all the DR maps: reddening increases from the lower right (South-East) to the upper left (North-West) corner by
$\Delta E(B-V)\approx0.03$
mag. Figure 4 shows nearly the same pattern in all the DR maps: reddening increases from the lower right (South-East) to the upper left (North-West) corner by $\Delta E(B-V)\approx0.15-0.25$
mag. This agrees with the maps presented by Kacharov et al. (Reference Kacharov2014) in their Figure 4, Jang et al. (Reference Jang2022) in their Figures 3 and 4, and by Pancino et al. (Reference Pancino2024) in their Figure A1 .
$\Delta E(B-V)\approx0.15-0.25$
mag. This agrees with the maps presented by Kacharov et al. (Reference Kacharov2014) in their Figure 4, Jang et al. (Reference Jang2022) in their Figures 3 and 4, and by Pancino et al. (Reference Pancino2024) in their Figure A1 .
The high interstellar extinction and high DR in the NGC 4372 field is partially due to the obscuration by the Musca dark nebula (also known as [DB2002b] G300.68-9.40, Sandquist 149 or the Dark Doodad Nebula; Sandqvist Reference Sandqvist1977; Dutra & Bica Reference Dutra and Bica2002; Dobashi et al. Reference Dobashi, Uehara, Kandori, Sakurai, Kaiden, Umemoto and Sato2005; Hacar et al. Reference Hacar, Kainulainen, Tafalla, Beuther and Alves2016). This nebula is a part of the Musca–Chamaeleonis molecular cloud complex. The distance to this nebula can be estimated as $109\pm 11$
pc from the Gaia parallaxes of several young OBA stars, probable members of the Lower Centaurus–Crux association, likely embedded into the nebula. They include, among others, gamma Musca, HD 107947, HD 106676, HD 108735.
$109\pm 11$
pc from the Gaia parallaxes of several young OBA stars, probable members of the Lower Centaurus–Crux association, likely embedded into the nebula. They include, among others, gamma Musca, HD 107947, HD 106676, HD 108735.
The dependence of extinction $A_{V}$
on distance R for eight lines-of-sight within the NGC 4372 field from the 3D extinction map of GMS25 – colour curves. Black line denotes the steepest increase of
$A_{V}$
on distance R for eight lines-of-sight within the NGC 4372 field from the 3D extinction map of GMS25 – colour curves. Black line denotes the steepest increase of $A_{V}$
in the Musca dark nebula at about 150 pc from the Sun.
$A_{V}$
in the Musca dark nebula at about 150 pc from the Sun.

However, GMS25 show dust clouds in the NGC 4372 field beyond the Musca dark nebula as presented in Figure 5. The steepest increases of the extinction profiles in Figure 5 correspond to the Musca dark nebula at $150\pm 50$
pc in a good agreement with the parallaxes of the embedded stars, as well as significant clouds at about 500, 800 and some others up to 1 700 pc (i.e. down to
$150\pm 50$
pc in a good agreement with the parallaxes of the embedded stars, as well as significant clouds at about 500, 800 and some others up to 1 700 pc (i.e. down to $Z=-300$
pc below the Galactic mid-plane). It is seen that these clouds provide a difference between the extinction profiles up to
$Z=-300$
pc below the Galactic mid-plane). It is seen that these clouds provide a difference between the extinction profiles up to $\Delta A_{V}\approx0.5$
mag at 2 kpc (
$\Delta A_{V}\approx0.5$
mag at 2 kpc ( $Z=-343$
pc), i.e. at the edge of the Galactic dust layer. This difference may well explain the DR observed in the NGC 4372 field and presented in Figure 4.
$Z=-343$
pc), i.e. at the edge of the Galactic dust layer. This difference may well explain the DR observed in the NGC 4372 field and presented in Figure 4.
The high DR in the NGC 4372 field prevails over other systematics. This is not the case for other clusters under consideration. For example, DR maps for NGC 6218 are presented in Appendix C.
Since some data sets do not cover the cluster centres, we do not refer our final reddening/extinction estimates to the centres. Instead, our isochrone fitting provides us with an average reddening of all cluster members under consideration, the same before and after our DR correction. The DR correction is applied in addition to the average reddening. Consequently, for each CMD, the DR correction is positive for some stars and negative for others, while the DR correction averaged for all stars in the field is exactly zero.
4.2. Isochrone-to-data fitting
To fit CMDs, we use the $\alpha$
–enhanced [
$\alpha$
–enhanced [ $\alpha$
/Fe]
$\alpha$
/Fe] $=+0.4$
theoretical models of stellar evolution and corresponding isochrones from BaSTI with initial solar
$=+0.4$
theoretical models of stellar evolution and corresponding isochrones from BaSTI with initial solar $Z=0.0172$
and
$Z=0.0172$
and $Y=0.2695$
, overshooting, diffusion, mass loss efficiency
$Y=0.2695$
, overshooting, diffusion, mass loss efficiency $ \unicode{x03B7} =0.3$
, where
$ \unicode{x03B7} =0.3$
, where $\unicode{x03B7}$
is the free parameter in Reimers law (Reimers Reference Reimers1975), as well as from DSED with solar
$\unicode{x03B7}$
is the free parameter in Reimers law (Reimers Reference Reimers1975), as well as from DSED with solar $Z=0.0189$
and no mass loss. Also, as in Paper III–Paper VI, we use the BaSTI extended set of zero-age horizontal branch (ZAHB) models with a stochastic mass loss between the MS and HB, whereas the DSED HB and AGB evolution tracks for a primordial
$Z=0.0189$
and no mass loss. Also, as in Paper III–Paper VI, we use the BaSTI extended set of zero-age horizontal branch (ZAHB) models with a stochastic mass loss between the MS and HB, whereas the DSED HB and AGB evolution tracks for a primordial $Y\approx0.25$
, which exist for some filters, are used for comparison purposes. We use the isochrones from both the models for the primordial
$Y\approx0.25$
, which exist for some filters, are used for comparison purposes. We use the isochrones from both the models for the primordial $Y\approx0.25$
, the BaSTI isochrone for
$Y\approx0.25$
, the BaSTI isochrone for $Y=0.275$
, and the DSED one for
$Y=0.275$
, and the DSED one for $Y=0.33$
in order to interpolate the isochrones for the adopted
$Y=0.33$
in order to interpolate the isochrones for the adopted $Y_{\mathrm{mix}}$
, Such interpolation produces a negligible uncertainty of
$Y_{\mathrm{mix}}$
, Such interpolation produces a negligible uncertainty of $\lt$
$\lt$ $0.01$
mag in any CMD, as the initial isochrones are closely spaced and represented by the same evolutionary points.
$0.01$
mag in any CMD, as the initial isochrones are closely spaced and represented by the same evolutionary points.
In addition to Figures 1–3, C1–C4, and C6–D1, some CMDs with our fitting are presented as a Supplemental Material or are available upon request.
We fit isochrones to hundreds CMDs for our globular clusters. Namely, we fit 6, 6, 3, 1, 4, 6, and 4 reliable independent UV (i.e. with filters within $\lambda_{\mathrm{eff}}\lt440$
nm, see Appendix B) and UV–optical CMDs, such as GCL99
$\lambda_{\mathrm{eff}}\lt440$
nm, see Appendix B) and UV–optical CMDs, such as GCL99 $u-v$
; 15, 12, 18, 8, 19, 16, and 17 (105 in total) reliable independent optical CMDs of 8, 9, 8, 4, 9, 8, and 9 data sets, such as SPZ19
$u-v$
; 15, 12, 18, 8, 19, 16, and 17 (105 in total) reliable independent optical CMDs of 8, 9, 8, 4, 9, 8, and 9 data sets, such as SPZ19 $B-I$
; 7, 26, 9, 14, 18, 5, and 24 reliable independent optical–IR (i.e. with filters within
$B-I$
; 7, 26, 9, 14, 18, 5, and 24 reliable independent optical–IR (i.e. with filters within $\lambda_{\mathrm{eff}}\gt1000$
nm) CMDs, such as SPZ19-unWISE
$\lambda_{\mathrm{eff}}\gt1000$
nm) CMDs, such as SPZ19-unWISE $V-W1$
, for NGC 288, NGC 362, NGC 1904, NGC 4372, NGC 5904, NGC 6205, and NGC 6218, respectively, as well as a hundred CMDs obtained in our cross-identification, such as Gaia-SPZ19
$V-W1$
, for NGC 288, NGC 362, NGC 1904, NGC 4372, NGC 5904, NGC 6205, and NGC 6218, respectively, as well as a hundred CMDs obtained in our cross-identification, such as Gaia-SPZ19 $G_{\mathrm{BP}}-V$
. The optical–IR CMDs involve IR filters: unWISE W1 or VISTA
$G_{\mathrm{BP}}-V$
. The optical–IR CMDs involve IR filters: unWISE W1 or VISTA $Y_{\mathrm{VISTA}}$
,
$Y_{\mathrm{VISTA}}$
, $J_{\mathrm{VISTA}}$
,
$J_{\mathrm{VISTA}}$
, $K_{\mathrm{VISTA}}$
or UKIDSS
$K_{\mathrm{VISTA}}$
or UKIDSS $J_{\mathrm{UKIDSS}}$
,
$J_{\mathrm{UKIDSS}}$
, $K_{\mathrm{UKIDSS}}$
or 2MASS
$K_{\mathrm{UKIDSS}}$
or 2MASS $J_{\mathrm{2MASS}}$
,
$J_{\mathrm{2MASS}}$
, $Ks_{\mathrm{2MASS}}$
. As in our previous studies, the UV, UV–optical, and optical–IR CMDs provide less reliable and less precise estimates of the derived cluster parameters than the optical ones due to higher random and systematic uncertainties of the UV and IR photometry, lower accuracy of models/isochrones for the UV and IR CMDs, and significant segregation of cluster generations in the UV CMDs. Therefore, we use only the aforementioned 105 optical CMDs to derive our parameter estimates, average them into the final ones, and to estimate their uncertainties. The remaining CMDs are used to draw empirical extinction laws based on the derived reddenings and covering a range from the UV to IR.
$Ks_{\mathrm{2MASS}}$
. As in our previous studies, the UV, UV–optical, and optical–IR CMDs provide less reliable and less precise estimates of the derived cluster parameters than the optical ones due to higher random and systematic uncertainties of the UV and IR photometry, lower accuracy of models/isochrones for the UV and IR CMDs, and significant segregation of cluster generations in the UV CMDs. Therefore, we use only the aforementioned 105 optical CMDs to derive our parameter estimates, average them into the final ones, and to estimate their uncertainties. The remaining CMDs are used to draw empirical extinction laws based on the derived reddenings and covering a range from the UV to IR.
The distribution of stars in our CMDs is well defined due to the accurate selection of cluster members. Therefore, as in Paper V and Paper VI, we fit isochrones directly to the bulk of cluster members, without calculating a fiducial sequence. To balance the contributions of different CMD domains, we assign a weight to each data point. The weight is inversely proportional to the number of stars of a given magnitude, i.e. it represents the luminosity function of a given data set. Modern computers enable us to evaluate numerous parameter sets ([Fe/H], distance from the Sun R, reddening, and age) in their 4-dimensional space with their steps of 0.1 dex, 0.01 kpc, 0.001 mag, and 0.5 Gyr, respectively, for each CMD-model pair. For each set of parameters, we calculate the sum of the squares of the residuals between the isochrones and the data points. Table B2 in Appendix C presents the best solutions, i.e. those with the minimal sum of the squares of the residuals.
As in Paper VI (see its Figure 6), we exclude four CMD domains from the fitting: the extremely blue HB (i.e. the area bluer than the turn of the observed HB downward or, in other words, stars with $T_{\mathrm{eff}}\gt9\,000$
K), RR Lyrae stars, some other variable stars, and blue stragglers. As shown in Figures 1–3, some of these clusters contain a significant number of RR Lyrae and other variable stars (Arellano Ferro Reference Arellano Ferro2022, Reference Arellano Ferro2024). They are identified using the SPZ19 Vary (Welch-Stetson variability index) and Weight (weight of the variability index) parameters or Gaia VarFlag=VARIABLE parameter. The latter allows us to detect variable stars in all the data sets cross-identified with Gaia DR3. In addition, we detect variable stars in all the data sets using the variable star database of Clement (Reference Clement2017).Footnote
y
The detection and subsequent removal of variable stars is highly beneficial for accurately determining the HB magnitude and, consequently, the cluster distance. This is particularly important for NGC 362 and NGC 5904, as shown in Figures 1–3, where RR Lyrae variables appear both above and below the BaSTI ZAHB for a primordial
$T_{\mathrm{eff}}\gt9\,000$
K), RR Lyrae stars, some other variable stars, and blue stragglers. As shown in Figures 1–3, some of these clusters contain a significant number of RR Lyrae and other variable stars (Arellano Ferro Reference Arellano Ferro2022, Reference Arellano Ferro2024). They are identified using the SPZ19 Vary (Welch-Stetson variability index) and Weight (weight of the variability index) parameters or Gaia VarFlag=VARIABLE parameter. The latter allows us to detect variable stars in all the data sets cross-identified with Gaia DR3. In addition, we detect variable stars in all the data sets using the variable star database of Clement (Reference Clement2017).Footnote
y
The detection and subsequent removal of variable stars is highly beneficial for accurately determining the HB magnitude and, consequently, the cluster distance. This is particularly important for NGC 362 and NGC 5904, as shown in Figures 1–3, where RR Lyrae variables appear both above and below the BaSTI ZAHB for a primordial $Y\approx0.25$
(purple curve), which is very close to the ZAHB for
$Y\approx0.25$
(purple curve), which is very close to the ZAHB for $Y_{\mathrm{mix}}$
fitted as the lower bound of the non-variable HB stars.
$Y_{\mathrm{mix}}$
fitted as the lower bound of the non-variable HB stars.
4.3. Systematics
As in our previous studies, the results from all CMDs of the same data set (e.g. SPZ19 $U-B$
,
$U-B$
, $B-V$
and
$B-V$
and $V-I$
) appear consistent. Two examples of such a CMD-to-CMD consistency are provided in Appendix C. As a result, the reddening estimates from different CMDs of the same data set always draw a rather smooth and meaningful empirical extinction law as discussed in Section 5.
$V-I$
) appear consistent. Two examples of such a CMD-to-CMD consistency are provided in Appendix C. As a result, the reddening estimates from different CMDs of the same data set always draw a rather smooth and meaningful empirical extinction law as discussed in Section 5.
Our comparison of photometry in the same or similar filters of cross-identified data sets allows us to find systematic differences in colours and magnitudes, i.e. set-to-set systematics. Typically, these differences are within 0.05 mag, while they tend to be slightly higher for distant NGC 1904 or highly reddened NGC 4372. Such differences have been found in our previous studies (see, for example, Figure 1 in Paper III). They are expected due to photometry zero-point variations, point-spread function variations, telescope focus change, distortion, stellar content variations, and other systematics (Anderson et al. Reference Anderson2008).
Generally, we have no information to determine which of the compared data sets is closer to the truth. Therefore, we do not correct any colour or magnitude of any data set (however, we adjust data sets to draw extinction laws as described in Section 5 and Appendix D). Instead, we derive parameter estimates from fitting of the uncorrected data sets and average the estimates for our final results. The systematic differences in magnitudes and colours are translated into set-to-set systematic differences in the derived parameters. These systematic differences are used to determine the total uncertainties of the parameters. Also, we take into account model-to-model systematics, i.e. between the BaSTI and DSED results. We believe that half the difference between maximal and minimal estimates (i.e. half the range) can represent the uncertainty of averaged systematically different estimates. Finally, the total uncertainty of a parameter for a cluster is calculated as the quadrature sum of half the range of estimates for all data sets used (representing the set-to-set systematics), half the difference between the BaSTI and DSED estimates averaged over all data sets used (representing the model-to-model systematics), and the random errors. The latter are much lower than the systematics, as discussed, for example, in Appendix A of Paper II and Section 3.1 of Paper IV.
5. Results
Table 5 presents our final estimates of [Fe/H], age, distance, distance modulus $(m-M)_0$
,
$(m-M)_0$
, $E(B-V)$
, and apparent V-band distance modulus
$E(B-V)$
, and apparent V-band distance modulus $(m-M)_{V}$
in comparison with our estimates from Paper I to Paper III by use of the same or similar models when possible. The uncertainties of our previous estimates are adopted taking into account the significant differences between these estimates for the BaSTI and DSED models, especially for age. Table 5 shows that the current estimates of reddening and apparent V-band distance modulus are similar to the previous ones, while those of age, distance, and distance modulus differ systematically.
$(m-M)_{V}$
in comparison with our estimates from Paper I to Paper III by use of the same or similar models when possible. The uncertainties of our previous estimates are adopted taking into account the significant differences between these estimates for the BaSTI and DSED models, especially for age. Table 5 shows that the current estimates of reddening and apparent V-band distance modulus are similar to the previous ones, while those of age, distance, and distance modulus differ systematically.
Namely, the age estimates, averaged for BaSTI and DSED, become approximately 0.6–0.8 Gyr younger for all the clusters, as expected after the revision of BaSTI in 2021. Our age estimates for the oldest clusters, NGC 288 and NGC 6218, align more closely with those of Dotter et al. (Reference Dotter2010) and VandenBerg et al. (Reference VandenBerg, Brogaard, Leaman and Casagrande2013), as shown in Table 1 , than with those of Valcin et al. (Reference Valcin, Bernal, Jimenez, Verde and Wandelt2020). The relative ages from CARMA agree with ours in the sense that NGC 288 and NGC 6205 are approximately the same age and much older than NGC 362.
Our [Fe/H] (dex), age (Gyr), distance (kpc), distance modulus (mag), $E(B-V)$
(mag), and apparent V-band distance modulus (mag) estimates.
$E(B-V)$
(mag), and apparent V-band distance modulus (mag) estimates.

The previous estimates from Paper I, Paper II, and Paper III (except those adopted from the published results) are presented in the right column. The $E(B-V)$
estimates are calculated from the derived reddenings by use of extinction coefficients from Casagrande & VandenBerg (Reference Casagrande2014); Casagrande & VandenBerg (Reference Casagrande2018a); Casagrande & VandenBerg (Reference Casagrande2018b) or CCM89 with
$E(B-V)$
estimates are calculated from the derived reddenings by use of extinction coefficients from Casagrande & VandenBerg (Reference Casagrande2014); Casagrande & VandenBerg (Reference Casagrande2018a); Casagrande & VandenBerg (Reference Casagrande2018b) or CCM89 with $R_{V}=3.1$
. The uncertainties after the values are standard deviations of the mean. ‘Model
$R_{V}=3.1$
. The uncertainties after the values are standard deviations of the mean. ‘Model $\Delta$
’ and ‘Total’ are half the difference between the models and total uncertainty of the average value, respectively.
$\Delta$
’ and ‘Total’ are half the difference between the models and total uncertainty of the average value, respectively.
Top: the empirical extinction law for NGC 6218 from the isochrone fitting by the different models. The B and V filters are denoted by the vertical lines. The black dotted, solid, and dashed curves show the extinction law of CCM89 with $R_{V}=2.9$
,
$R_{V}=2.9$
, $3.1$
and
$3.1$
and $3.3$
, respectively, with the derived
$3.3$
, respectively, with the derived $A_{V}$
, which is shown by the horizontal line. The error bars are not shown in the top diagram, since they are about the height of the symbols used. Bottom: the data set residuals around the extinction law of CCM89 with
$A_{V}$
, which is shown by the horizontal line. The error bars are not shown in the top diagram, since they are about the height of the symbols used. Bottom: the data set residuals around the extinction law of CCM89 with $R_{V}=3.2$
. The data sets are: NLP18 – red diamonds; Lee data set – open green diamonds; Gaia – yellow snowflakes; SPZ19 – blue squares; Narloch et al. (Reference Narloch, Kaluzny, Poleski, Rozyczka, Pych and Thompson2017) – green circles; Zloczewski et al. (Reference Zloczewski, Kaluzny, Rozyczka, Krzeminski and Mazur2012) – yellow triangles; Hargis et al. (Reference Hargis, Sandquist and Bolte2004) – open brown squares; PS1 – open red circles; SMSS – blue inclined crosses; VISTA and unWISE – purple upright crosses.
$R_{V}=3.2$
. The data sets are: NLP18 – red diamonds; Lee data set – open green diamonds; Gaia – yellow snowflakes; SPZ19 – blue squares; Narloch et al. (Reference Narloch, Kaluzny, Poleski, Rozyczka, Pych and Thompson2017) – green circles; Zloczewski et al. (Reference Zloczewski, Kaluzny, Rozyczka, Krzeminski and Mazur2012) – yellow triangles; Hargis et al. (Reference Hargis, Sandquist and Bolte2004) – open brown squares; PS1 – open red circles; SMSS – blue inclined crosses; VISTA and unWISE – purple upright crosses.

Our current distance estimates are lower than not only our previous ones, but also those from a comprehensive compilation of BV21Footnote z for all the clusters but NGC 362. This discrepancy is in line with the finding of BV21 that isochrone based distance moduli are systematically larger than RR Lyrae based ones by about 0.02 mag. This may be explained by the ignoring of RR Lyrae variable stars in some of isochrone-fitting studies compiled by BV21. Observed at random phase, RR Lyrae in globular clusters may appear much above (brighter) or below (fainter) the observed HB. When one derives distance by fitting a theoretical ZAHB to the lower bound of the observed HB and ignores the RR Lyrae, which appear below the non-variable HB stars, this causes a bias to a higher derived distance or distance modulus. Accordingly, this can explain NGC 362 as the exception: Figures 1–3 show that its RR Lyrae differ in colour (systematically bluer) from the remaining HB stars and, hence, do not contaminate them to derive distance. The detection and removal of the RR Lyrae in this study must eliminate this bias, in contrast to Paper I–Paper III, where we ignored the RR Lyrae.
Anyway, our distance estimates agree with those from BV21 (see Table 1 ) within $0.5\sigma$
,
$0.5\sigma$
, $0.5\sigma$
,
$0.5\sigma$
, $0.6\sigma$
,
$0.6\sigma$
, $1.5\sigma$
,
$1.5\sigma$
, $1.1\sigma$
,
$1.1\sigma$
, $0.3\sigma$
, and
$0.3\sigma$
, and $0.9\sigma$
of their total uncertainties for NGC 288, NGC 362, NGC 1904, NGC 4372, NGC 5904, NGC 6205, and NGC 6218, respectively. Also, our distance estimates agree with those from CARMA. There is significantly less agreement between our distance estimates and those of Valcin et al. (Reference Valcin, Bernal, Jimenez, Verde and Wandelt2020) in Table 1: the latter are systematically higher probably due to ignoring of RR Lyrae.
$0.9\sigma$
of their total uncertainties for NGC 288, NGC 362, NGC 1904, NGC 4372, NGC 5904, NGC 6205, and NGC 6218, respectively. Also, our distance estimates agree with those from CARMA. There is significantly less agreement between our distance estimates and those of Valcin et al. (Reference Valcin, Bernal, Jimenez, Verde and Wandelt2020) in Table 1: the latter are systematically higher probably due to ignoring of RR Lyrae.
We convert our distances and those of BV21, along with their uncertainties, into parallaxes and their corresponding uncertainties to facilitate comparison in Table 4 with parallaxes obtained from our analysis and VB21, both derived from Gaia DR3 astrometry.
The total uncertainty of any astrometric estimate of Gaia DR3 parallax cannot be better than 0.01 mas (Vasiliev & Baumgardt Reference Vasiliev and Baumgardt2021), while the total uncertainty of parallax, derived in isochrone fitting, increases with parallax (i.e. the relative parallax uncertainty is nearly constant as evident from Table 4). Accordingly, Table 4 indicates that the parallax estimates from the Gaia DR3 astrometry are less precise than those from our isochrone fitting for such distant clusters.Footnote aa BV21 estimates also exhibit higher precision than those derived from Gaia DR3 astrometry. Anyway, Table 4 shows that all the parallax estimates are consistent, with only two exceptions: the VB21 estimate is an outlier for NGC 288 and the BV21 estimate contradicts that from our isochrone-fitting for NGC 4372. The latter discrepancy can be attributed to biases and errors in previous estimates, compiled by BV21, for such a reddened cluster.
The total uncertainties in Table 5 appear comparable with those we adopt in Paper V and Paper VI for [Fe/H], age, and distance modulus: $0.1$
dex, 0.8 Gyr, and 0.07 mag, respectively. Comparing half the differences between the models with total uncertainties presented in Table 5, we can conclude that the models agree each other in their estimates of age, distance, and distance modulus, but differ in those of [Fe/H] and reddening. This is expected after our previous studies, since DSED provides a systematically lower [Fe/H] and, hence, a higher reddening than BaSTI. It is known that the lower the metallicity of an isochrone, the higher the reddening derived from its fitting to a CMD and, consequently, the higher the
$0.1$
dex, 0.8 Gyr, and 0.07 mag, respectively. Comparing half the differences between the models with total uncertainties presented in Table 5, we can conclude that the models agree each other in their estimates of age, distance, and distance modulus, but differ in those of [Fe/H] and reddening. This is expected after our previous studies, since DSED provides a systematically lower [Fe/H] and, hence, a higher reddening than BaSTI. It is known that the lower the metallicity of an isochrone, the higher the reddening derived from its fitting to a CMD and, consequently, the higher the $(m-M)_{V}$
. Accordingly, the systematic uncertainty about
$(m-M)_{V}$
. Accordingly, the systematic uncertainty about $0.1$
dex of [Fe/H] is a significant contributor to the systematic uncertainties of our reddening and extinction estimates, resulting in values equivalent to
$0.1$
dex of [Fe/H] is a significant contributor to the systematic uncertainties of our reddening and extinction estimates, resulting in values equivalent to $\sigma_{E(B-V)}\approx0.015$
and
$\sigma_{E(B-V)}\approx0.015$
and $\sigma_{A_{V}}\approx0.05$
mag, respectively.
$\sigma_{A_{V}}\approx0.05$
mag, respectively.
Comparing our [Fe/H] estimates with values from the published results (see Table 1 ), we find that, unlike the comparison for Galactic globular clusters of a lower metallicity in Paper VI, our estimates align more closely with those of Carretta et al. (Reference Carretta, Bragaglia, Gratton, D’Orazi and Lucatello2009) than with those of Mészáros et al. (Reference Mészáros2020). Additionally, they fall between the spectroscopic and photometric estimates provided by Jurcsik & Hajdu (Reference Jurcsik and Hajdu2023). Thus, the arguments of Mucciarelli & Bonifacio (Reference Mucciarelli and Bonifacio2020) in favour of photometrically and against spectroscopically derived [Fe/H] of low-metallicity globular clusters may not be valid for higher metallicity ones. Note that our estimate [Fe/H] $=-2.28\pm 0.09$
for NGC 4372 agrees well with
$=-2.28\pm 0.09$
for NGC 4372 agrees well with $-2.19\pm 0.03$
from high-resolution spectroscopy presented by San Roman et al. (Reference San Roman2015).
$-2.19\pm 0.03$
from high-resolution spectroscopy presented by San Roman et al. (Reference San Roman2015).
5.1. Reddening, extinction, and extinction law
As in our previous studies, we use the optical–IR CMDs to convert the derived reddenings into extinction for each filter under consideration. For example, the extinction $A_{V}$
in the V filter can be calculated as
$A_{V}$
in the V filter can be calculated as
 \begin{equation}A_{V}=(A_{V}-A_{W1})+A_{W1}=E(V-W1)+A_{W1},\end{equation}
where reddening $E(V-W1)$
is obtained from a CMD, while very low extinction
$E(V-W1)$
is obtained from a CMD, while very low extinction $A_{W1}$
in the W1 filter is calculated using the Cardelli, Clayton, & Mathis (Reference Cardelli, Clayton and Mathis1989, hereafter CCM89) extinction law with a certain
$A_{W1}$
in the W1 filter is calculated using the Cardelli, Clayton, & Mathis (Reference Cardelli, Clayton and Mathis1989, hereafter CCM89) extinction law with a certain $R_{V}$
,Footnote
bb
which, in turn, is derived from the fitting of extinctions in all the filters by the CCM89 extinction law.
$R_{V}$
,Footnote
bb
which, in turn, is derived from the fitting of extinctions in all the filters by the CCM89 extinction law. $R_{V}$
and the extinctions in all the filters are updated iteratively, starting with an initial value of
$R_{V}$
and the extinctions in all the filters are updated iteratively, starting with an initial value of $R_{V}=3.1$
. For all the clusters under consideration, any variation of
$R_{V}=3.1$
. For all the clusters under consideration, any variation of $R_{V}$
between 2.2 and 5.0 leads to a variation of
$R_{V}$
between 2.2 and 5.0 leads to a variation of $A_{W1}$
within
$A_{W1}$
within $\pm 0.01$
mag (
$\pm 0.01$
mag ( $\pm 0.025$
mag for NGC 4372 due to its higher extinction). Equation (2) shows that this variation becomes an additional uncertainty of any derived extinction, albeit negligible w.r.t. its total uncertainty.
$\pm 0.025$
mag for NGC 4372 due to its higher extinction). Equation (2) shows that this variation becomes an additional uncertainty of any derived extinction, albeit negligible w.r.t. its total uncertainty.
For each combination of cluster, data set, and model we derive a set of $R_{V}$
and extinctions, which draws an independent empirical extinction law. To draw it more accurately, we reduce the scatter of extinction estimates by adjustment of data sets as described in our previous papers and in Appendix D. An example of the empirical extinction law for NGC 6218 by use of two models and various data sets is presented in Figure 6. A rather low scatter is seen not only for different CMDs of the same data set (the series of the same symbols in Figure 6) but also for different data sets (the different series of the symbols in Figure 6). Finally, Figure 6 displays for NGC 6218 an excellent agreement of the extinctions, derived for all the filters, following the CCM89 extinction law with
$R_{V}$
and extinctions, which draws an independent empirical extinction law. To draw it more accurately, we reduce the scatter of extinction estimates by adjustment of data sets as described in our previous papers and in Appendix D. An example of the empirical extinction law for NGC 6218 by use of two models and various data sets is presented in Figure 6. A rather low scatter is seen not only for different CMDs of the same data set (the series of the same symbols in Figure 6) but also for different data sets (the different series of the symbols in Figure 6). Finally, Figure 6 displays for NGC 6218 an excellent agreement of the extinctions, derived for all the filters, following the CCM89 extinction law with $R_{V}=3.2\pm 0.1$
. Note that the VISTA and UKIDSS IR photometry appears especially useful in this study to obtain more precise
$R_{V}=3.2\pm 0.1$
. Note that the VISTA and UKIDSS IR photometry appears especially useful in this study to obtain more precise $R_{V}$
and extinction estimates than those in Paper I–Paper III.
$R_{V}$
and extinction estimates than those in Paper I–Paper III.
Our final estimates with their total uncertainties are $A_{V}=$ $0.09\pm 0.06$
,
$0.09\pm 0.06$
, $0.09\pm 0.06$
,
$0.09\pm 0.06$
, $0.11\pm 0.06$
,
$0.11\pm 0.06$
, $1.58\pm 0.06$
,
$1.58\pm 0.06$
, $0.13\pm 0.06$
,
$0.13\pm 0.06$
, $0.09\pm 0.06$
, and
$0.09\pm 0.06$
, and $0.67\pm 0.06$
, as well as
$0.67\pm 0.06$
, as well as $R_{V}=3.9\pm 0.7$
,
$R_{V}=3.9\pm 0.7$
, $3.0\pm 0.5$
,
$3.0\pm 0.5$
, $3.8\pm 0.5$
,
$3.8\pm 0.5$
, $2.9\pm 0.4$
,
$2.9\pm 0.4$
, $2.9\pm 0.2$
,
$2.9\pm 0.2$
, $3.6\pm 0.7$
, and
$3.6\pm 0.7$
, and $3.2\pm 0.1$
for NGC 288, NGC 362, NGC 1904, NGC 4372, NGC 5904, NGC 6205, and NGC 6218, respectively. Thus, NGC 288 and NGC 1904 exhibit an extinction law with
$3.2\pm 0.1$
for NGC 288, NGC 362, NGC 1904, NGC 4372, NGC 5904, NGC 6205, and NGC 6218, respectively. Thus, NGC 288 and NGC 1904 exhibit an extinction law with $R_{V}\gt3.1$
, while the extinction laws for the remaining clusters are consistent with the common value of
$R_{V}\gt3.1$
, while the extinction laws for the remaining clusters are consistent with the common value of $R_{V}=3.1$
.
$R_{V}=3.1$
.
The relative estimates presented as cluster sequences along ascending or descending parameter.

Comparing our reddening estimates with those in Table 1, we find that our values align closely with those of SFD98, Schlafly & Finkbeiner (Reference Schlafly and Finkbeiner2011), and Meisner & Finkbeiner (Reference Meisner and Finkbeiner2015) for all the clusters. The estimates from Harris (Reference Harris1996) and Lallement et al. (Reference Lallement, Babusiaux, Vergely, Katz, Arenou, Valette, Hottier and Capitanio2019) for NGC 4372, as well as the Lallement et al. (Reference Lallement, Babusiaux, Vergely, Katz, Arenou, Valette, Hottier and Capitanio2019) estimate for NGC 6218, are outliers and seem to be erroneous.
Six of the clusters are located at middle or high Galactic latitudes. The lowest $A_{V}$
they exhibit is 0.09 mag, though this value is somewhat uncertain. Hence, these clusters confirm our conclusion from Paper VI, based on our estimates for five other high-latitude clusters, that the typical total Galactic extinction from the Sun to extragalactic objects at high latitudes is
$A_{V}$
they exhibit is 0.09 mag, though this value is somewhat uncertain. Hence, these clusters confirm our conclusion from Paper VI, based on our estimates for five other high-latitude clusters, that the typical total Galactic extinction from the Sun to extragalactic objects at high latitudes is $A_{V}\gt0.08$
mag.
$A_{V}\gt0.08$
mag.
5.2. Relative estimates
The systematic differences between the models are relatively large. However, these differences are expected to cancel out in relative estimates of the cluster parameters, especially for [Fe/H] and $E(B-V)$
demonstrating a high model-to-model systematics. Their relative estimates can be obtained with the uncertainties 0.05 dex and 0.005 mag, respectively. The relative estimates of age and distance can possibly be obtained with the uncertainties 0.4 Gyr and 0.1 kpc, respectively. To derive the relative estimates, we use three optical CMDs available for all the clusters: (i) Gaia DR3
$E(B-V)$
demonstrating a high model-to-model systematics. Their relative estimates can be obtained with the uncertainties 0.05 dex and 0.005 mag, respectively. The relative estimates of age and distance can possibly be obtained with the uncertainties 0.4 Gyr and 0.1 kpc, respectively. To derive the relative estimates, we use three optical CMDs available for all the clusters: (i) Gaia DR3 $G_{\mathrm{BP}}-G_{\mathrm{RP}}$
, (ii) SPZ19
$G_{\mathrm{BP}}-G_{\mathrm{RP}}$
, (ii) SPZ19 $B-I$
, and (iii) Lee’s
$B-I$
, and (iii) Lee’s $b-y$
.
$b-y$
.
Our count of the blue HB, RR Lyrae, and red HB stars and calculated HB type of the clusters. The clusters are divided into 3 groups with similar [Fe/H] and sorted by their derived age (Gyr) within each group. The [Fe/H] and age estimates are taken from Table 5.

Table 6 presents the relative estimates of the parameters by red-coloured values between the cluster names ranked by ascending or descending parameter. A small value between a pair of clusters means their similarity in this parameter, while a large value means a significant difference between them. Table 6 confirms nearly identical [Fe/H] values for the quartet NGC 5904, NGC 288, NGC 6218, and NGC 362, as well as for NGC 1904 and NGC 6205. For NGC 1904, NGC 6218, NGC 288, NGC 6205, and NGC 4372, the age decreases slightly but, taking into account its uncertainty, it can still be regarded as nearly the same, around 13 Gyr. In contrast, NGC 5904 is significantly younger, and NGC 362 is even younger, potentially making it one of the youngest globular clusters in the Galaxy. The relative age estimates for the quartet ensure that NGC 288 and NGC 6218 have nearly the same age, significantly older ( $1.5\pm 0.4$
Gyr) than NGC 5904, which is older (
$1.5\pm 0.4$
Gyr) than NGC 5904, which is older ( $1.0\pm 0.4$
Gyr) than NGC 362. In total, NGC 288 and NGC 6218 are
$1.0\pm 0.4$
Gyr) than NGC 362. In total, NGC 288 and NGC 6218 are $2.5\pm 0.4$
Gyr older than NGC 362. Consequently, this confirms that age can be the second parameter influencing HB morphology of this quartet. Also, Table 6 confirms that NGC 288, NGC 362, NGC 6205, and NGC 1904 have nearly the same reddening.
$2.5\pm 0.4$
Gyr older than NGC 362. Consequently, this confirms that age can be the second parameter influencing HB morphology of this quartet. Also, Table 6 confirms that NGC 288, NGC 362, NGC 6205, and NGC 1904 have nearly the same reddening.
5.3. The HB morphology
Tables 5 and 6 show a negligible difference between the derived [Fe/H] for the quartet of clusters with [Fe/H] $\approx-1.3$
. Therefore, their HB morphology differences cannot be attributed to metallicity. However, variations in their age estimates can mainly explain the observed differences in their HB morphology.
$\approx-1.3$
. Therefore, their HB morphology differences cannot be attributed to metallicity. However, variations in their age estimates can mainly explain the observed differences in their HB morphology.
Similarly, the HB morphology difference between NGC 1904, NGC 6205, and NGC 5272 (the latter from Paper VI) with [Fe/H] $\approx-1.6$
can be attributed to their age difference, although age alone does not provide a complete explanation, as discussed later.
$\approx-1.6$
can be attributed to their age difference, although age alone does not provide a complete explanation, as discussed later.
Comparing NGC 4372 with the metal-poor clusters NGC 5024, NGC 5053, NGC 5466, and NGC 7099 from Paper VI, we note that they have very similar ages of approximately 12.8 Gyr, except for the slightly younger NGC 5466. [Fe/H] of NGC 4372 is slightly lower than that those of the remaining clusters, while its HB closely resembles those of NGC 5053 and NGC 7099 in the sparse population of their blue HB.
We calculate HB types of the clusters by counting the HB stars in the Gaia, SPZ19, and NLP18 data sets, except for NGC 1904 and NGC 4372, for which only the Gaia and SPZ19 data sets are used. Our choice of the data sets is due to NLP18 covers only few central arcminutes of the cluster fields, while Gaia and SPZ19, cross-identified with Gaia, cover the remaining outer parts of the fields. In addition, Gaia and SPZ19 allow us to detect some variable stars omitted in the Clement (Reference Clement2017) data base using their variability parameters mentioned in Section 4.2.Footnote cc All the three data sets are cross-identified each other in order to count each HB star once. This provides a complete count of the HB stars of the clusters presented in Table 7 together with the calculated HB types. Table 1 shows a good agreement of our HB types with published results.
The uncertainties of our HB type estimates are calculated by a Monte-Carlo simulation (except for NGC 4372 due to its high DR, although it seems that NGC 4372 has no red HB stars and RR Lyrae and, hence, its HB type is exactly $+1$
). Briefly, we take into account the probability for a blue HB, RR Lyra or red HB star to be out of the correspondent CMD domain or the probability for an extraneous star to be in these domains based on the star’s photometric and DR uncertainty and variability amplitude. The star position in the CMD and the residual contamination of the clean samples by field stars are simulated with the TRILEGAL code (Girardi et al. Reference Girardi, Groenewegen, Hatziminaoglou and da Costa2005). It is worth noting that the accurate count of the red HB stars and RR Lyrae affects the HB types much more than that of the blue HB stars, as indicated in Paper VI.
$+1$
). Briefly, we take into account the probability for a blue HB, RR Lyra or red HB star to be out of the correspondent CMD domain or the probability for an extraneous star to be in these domains based on the star’s photometric and DR uncertainty and variability amplitude. The star position in the CMD and the residual contamination of the clean samples by field stars are simulated with the TRILEGAL code (Girardi et al. Reference Girardi, Groenewegen, Hatziminaoglou and da Costa2005). It is worth noting that the accurate count of the red HB stars and RR Lyrae affects the HB types much more than that of the blue HB stars, as indicated in Paper VI.
The clusters in Table 7 are divided into 3 groups with similar [Fe/H] and sorted by their derived age within each group. It is seen that this sorting almost perfectly follows the decrease of their HB type. This confirms that metallicity is the first and age is the second parameter of the HB morphology. The only exception is the pair of NGC 1904 and NGC 6205. Table 6 indicates that the former is $\Delta$
[Fe/H]
$\Delta$
[Fe/H] $=0.04$
metal poorer and 0.5 Gyr older, i.e. the both factors are in contradiction with its shorter tail of the blue HB stars in Figures 1–3 and corresponding lower HB type in Table 7.
$=0.04$
metal poorer and 0.5 Gyr older, i.e. the both factors are in contradiction with its shorter tail of the blue HB stars in Figures 1–3 and corresponding lower HB type in Table 7.
To understand the HB morphology, it is important to note that HB stars demonstrate a strong correlation between their mass, effective temperature, and colour. The mass increases (from about 0.48 to 0.80 solar masses) as the temperature decreases (from about 32000 to 5300 K) and the dereddened colour index increases [from about $(B-I)_0=-0.57$
to
$(B-I)_0=-0.57$
to $+1.5$
], moving from left to right across the CMDs shown in Figures 1–3.
$+1.5$
], moving from left to right across the CMDs shown in Figures 1–3.
The best-fitting BaSTI isochrones for the MS, TO, SGB, RGB, and AGB, i.e. the red and orange curves in Figures 1–3 for a primordial $Y\approx0.25$
and
$Y\approx0.25$
and $0.275$
, respectively, describe regular stellar evolution including a moderate mass loss with its efficiency
$0.275$
, respectively, describe regular stellar evolution including a moderate mass loss with its efficiency $\eta=0.3$
.Footnote
dd
$\eta=0.3$
.Footnote
dd
In contrast, any HB or AGB star far from a red or orange curve in Figures 1–3 needs an additional explanation beyond the regular stellar evolution. The BaSTI extended set of ZAHB models with a stochastic mass loss between the MS and HB, presented in Figures 1–3 by the purple and blue curves, gives us such an additional explanation. Namely, a higher mass loss efficiency produces less massive (hotter and bluer) HB stars and, hence, shifts them leftward along purple or blue curves in Figures 1–3. Conversely, a lower mass-loss efficiency would shift HB stars to the right on the CMD.
Figures 1–3 show that all the clusters, except NGC 362 and NGC 4372, demonstrate many HB stars located to the left of the red or orange regular evolution isochrone curves.Footnote
ee
Moreover, the distribution of these HB stars along their mass (as well as effective temperature and colour), i.e. along the purple or blue ZAHB curves in Figures 1–3, is nearly Gaussian, as expected in the case of stochastic mass loss (Catelan Reference Catelan2009). This means that the HB morphology of these five clusters can be explained by a higher mass loss efficiency $\eta\gt0.3$
as the third parameter after metallicity and age. Moreover, the longer the cluster’s blue HB tail along the purple/blue ZAHB curves, the higher its mass loss efficiency. In particular, the NGC 6205 mass loss efficiency is much higher than that in NGC 1904, while their [Fe/H] and age are nearly the same. Also, a comparison of Figures 1–3 with Figures 1 and 3 from Paper VI for NGC 5272 indicates that the latter is significantly younger than NGC 1904 and NGC 6205. However, NGC 5272 also demonstrates a higher mass loss efficiency
$\eta\gt0.3$
as the third parameter after metallicity and age. Moreover, the longer the cluster’s blue HB tail along the purple/blue ZAHB curves, the higher its mass loss efficiency. In particular, the NGC 6205 mass loss efficiency is much higher than that in NGC 1904, while their [Fe/H] and age are nearly the same. Also, a comparison of Figures 1–3 with Figures 1 and 3 from Paper VI for NGC 5272 indicates that the latter is significantly younger than NGC 1904 and NGC 6205. However, NGC 5272 also demonstrates a higher mass loss efficiency $\unicode{x03B7} \gt0.3$
, as evident from the presence of numerous HB stars to the left of all regular evolution isochrones, as discussed in Paper VI.
$\unicode{x03B7} \gt0.3$
, as evident from the presence of numerous HB stars to the left of all regular evolution isochrones, as discussed in Paper VI.
A higher helium mass fraction, such as $Y\gt0.3$
, as alternative to a higher mass loss efficiency, cannot account for the long blue HB tails of these clusters, since both theory (e.g. the best-fitting BaSTI isochrones in Figures 1–3) and observations (Y estimates for different generations of these clusters) deny very high Y for these clusters. Moreover, it is difficult to disentangle the effects of increased helium mass fraction and mass loss on the observed HBs, as both lead to a decrease in the mass of HB stars, making them bluer. However, Tailo et al. (Reference Tailo2020) appear to resolve this degeneracy with their approach. They derive estimates of
$Y\gt0.3$
, as alternative to a higher mass loss efficiency, cannot account for the long blue HB tails of these clusters, since both theory (e.g. the best-fitting BaSTI isochrones in Figures 1–3) and observations (Y estimates for different generations of these clusters) deny very high Y for these clusters. Moreover, it is difficult to disentangle the effects of increased helium mass fraction and mass loss on the observed HBs, as both lead to a decrease in the mass of HB stars, making them bluer. However, Tailo et al. (Reference Tailo2020) appear to resolve this degeneracy with their approach. They derive estimates of $\eta$
, albeit for only a subset of clusters, which align with and confirm our suggestions: NGC 288, NGC 5904, NGC 6205 and NGC 6218 demonstrate mass loss much higher than the common
$\eta$
, albeit for only a subset of clusters, which align with and confirm our suggestions: NGC 288, NGC 5904, NGC 6205 and NGC 6218 demonstrate mass loss much higher than the common $ \unicode{x03B7} =0.3$
:
$ \unicode{x03B7} =0.3$
: $\unicode{x03B7}=0.52\pm 0.02$
,
$\unicode{x03B7}=0.52\pm 0.02$
, $0.40\pm 0.03$
,
$0.40\pm 0.03$
, $0.53\pm 0.03$
, and
$0.53\pm 0.03$
, and $0.54\pm 0.03$
, respectively. Moreover, Tailo et al. (Reference Tailo2020) estimates divide other clusters from our studies into NGC 5272, NGC 6362, NGC 6397, NGC 6723, and NGC 6809 with rather high
$0.54\pm 0.03$
, respectively. Moreover, Tailo et al. (Reference Tailo2020) estimates divide other clusters from our studies into NGC 5272, NGC 6362, NGC 6397, NGC 6723, and NGC 6809 with rather high $\unicode{x03B7}=0.46\pm 0.02$
,
$\unicode{x03B7}=0.46\pm 0.02$
, $0.48\pm 0.03$
,
$0.48\pm 0.03$
, $0.37\pm 0.02$
,
$0.37\pm 0.02$
, $0.40\pm 0.03$
, and
$0.40\pm 0.03$
, and $0.37\pm 0.02$
, respectively, versus NGC 5024, NGC 5053, NGC 5466, and NGC 7099 with lower
$0.37\pm 0.02$
, respectively, versus NGC 5024, NGC 5053, NGC 5466, and NGC 7099 with lower $\unicode{x03B7}=0.26\pm 0.02$
,
$\unicode{x03B7}=0.26\pm 0.02$
, $0.32\pm 0.02$
,
$0.32\pm 0.02$
, $0.26\pm 0.02$
, and
$0.26\pm 0.02$
, and $0.19\pm 0.02$
, respectively, in a good agreement with the existence and length of their blue HB tails.
$0.19\pm 0.02$
, respectively, in a good agreement with the existence and length of their blue HB tails.
Thus, the majority (at least, 9 among 16) of clusters studied by us indicate a high mass-loss efficiency with $\unicode{x03B7}\gt0.3$
, which suggests a substantial amount of expelled intracluster gas and dust. Recent research by Pancino et al. (Reference Pancino2024) provides insights into the characteristics and distribution of this intracluster medium.
$\unicode{x03B7}\gt0.3$
, which suggests a substantial amount of expelled intracluster gas and dust. Recent research by Pancino et al. (Reference Pancino2024) provides insights into the characteristics and distribution of this intracluster medium.
No Tailo et al. (Reference Tailo2020) estimates for NGC 362, NGC 1904, and NGC 4372. The long blue HB tail suggesting a high mass-loss efficiency is evident for NGC 1904 in Figures 1–3, while the case of NGC 362 and NGC 4372 is uncertain. NGC 362 has a nearly Gaussian distribution of the HB stars in colour and, accordingly, in mass and effective temperature,Footnote
ff
while NGC 4372 demonstrates a non-Gaussian distribution with an abrupt cutoff on its HB blue side. This cutoff corresponds to the elimination of all HB stars with masses $\lt$
$\lt$ $0.642\pm 0.017$
solar masses (Gratton et al. Reference Gratton, Carretta, Bragaglia, Lucatello and D’Orazi2010) or
$0.642\pm 0.017$
solar masses (Gratton et al. Reference Gratton, Carretta, Bragaglia, Lucatello and D’Orazi2010) or $\lt$
$\lt$ $0.66\pm 0.01$
solar masses by our estimate using BaSTI. Note that these estimates differ due to an older model and different DR correction used by Gratton et al. (Reference Gratton, Carretta, Bragaglia, Lucatello and D’Orazi2010).
$0.66\pm 0.01$
solar masses by our estimate using BaSTI. Note that these estimates differ due to an older model and different DR correction used by Gratton et al. (Reference Gratton, Carretta, Bragaglia, Lucatello and D’Orazi2010).
In Paper VI, we discussed such an abrupt cutoff in the distribution of the HB stars or, in other words, the absence of the lowest mass HB stars, for the core collapse cluster NGC 7099 and the loose clusters NGC 5053 and NGC 5466, attributed to their dynamical evolution and mass segregation. In particular, loose cluster must lose stars due to two-body encounters and a tidal shock in a rapidly changing Galactic potential during its crossing of the Galactic disk (Odenkirchen & Grebel Reference Odenkirchen, Grebel, Prada, Martinez Delgado and Mahoney2004; Sollima et al. Reference Sollima, Dalessandro, Beccari and Pallanca2017). Thus, probably, both core-collapse and loose clusters lose low-mass stars more efficiently than clusters with intermediate star concentrations (Meylan & Heggie Reference Meylan and Heggie1997). NGC 5053, NGC 5466, and NGC 7099 demonstrate nearly the same cutoff level as NGC 4372: $0.660\pm 0.005$
,
$0.660\pm 0.005$
, $0.670\pm 0.005$
, and
$0.670\pm 0.005$
, and $0.650\pm 0.005$
, respectively (the higher value for NGC 5466 is due to its younger age). For comparison, NGC 5024, with similar metallicity and age but without such a cutoff, demonstrates a lower minimum HB mass of
$0.650\pm 0.005$
, respectively (the higher value for NGC 5466 is due to its younger age). For comparison, NGC 5024, with similar metallicity and age but without such a cutoff, demonstrates a lower minimum HB mass of $0.640\pm 0.005$
solar masses. Thus, NGC 4372 can be considered an analog of NGC 5053 and NGC 7099. However, NGC 4372 seems to be neither a core-collapse nor a loose cluster, although Kacharov et al. (Reference Kacharov2014) suggest it as a re-bounced, post-core-collapse cluster. On the other hand, NGC 362 and NGC 1904 are core-collapse clusters (as confirmed by their high core density and the ratio of tidal to core radii presented in Table 1), but they do not show an evident loss of low-mass HB stars.
$0.640\pm 0.005$
solar masses. Thus, NGC 4372 can be considered an analog of NGC 5053 and NGC 7099. However, NGC 4372 seems to be neither a core-collapse nor a loose cluster, although Kacharov et al. (Reference Kacharov2014) suggest it as a re-bounced, post-core-collapse cluster. On the other hand, NGC 362 and NGC 1904 are core-collapse clusters (as confirmed by their high core density and the ratio of tidal to core radii presented in Table 1), but they do not show an evident loss of low-mass HB stars.
It seems that a detailed analysis of cluster evolution and orbit may resolve this issue, as it has been proposed by Meylan & Heggie (Reference Meylan and Heggie1997) for the trio of core-collapse clusters with a similar [Fe/H], age, but different blue HB tails – NGC 6397, NGC 7078, and NGC 7099. To lose low-mass stars, it may be more important to have many slow disk crossings than to be a core-collapse or loose cluster. Therefore, it is probably important that the Galactic orbit of NGC 4372 involves many slow disk crossings (Kacharov et al. Reference Kacharov2014; Baumgardt & Vasiliev Reference Baumgardt and Vasiliev2021). This follows from the NGC 4372’s rather short orbital period of $98^{+2}_{-4}$
Myr, very low orbital inclination of
$98^{+2}_{-4}$
Myr, very low orbital inclination of $27\pm 1^{\circ}$
, and recent time
$27\pm 1^{\circ}$
, and recent time $45\pm 1$
Myr since the last disk crossing compared to such values
$45\pm 1$
Myr since the last disk crossing compared to such values $220^{+6}_{-4}$
Myr,
$220^{+6}_{-4}$
Myr, $68^{+24}_{-9}$ $^{\circ}$
, and
$^{\circ}$
, and $92\pm 1$
Myr for the unlike NGC 1904 and
$92\pm 1$
Myr for the unlike NGC 1904 and $344^{+30}_{-14}$
Myr,
$344^{+30}_{-14}$
Myr, $75\pm 1^{\circ}$
, and
$75\pm 1^{\circ}$
, and $188\pm 2$
Myr for the unlike NGC 5024 (Bajkova & Bobylev Reference Bajkova and Bobylev2022). The impact of evolution history of Galactic globular clusters into their HB morphology should be investigated further.
$188\pm 2$
Myr for the unlike NGC 5024 (Bajkova & Bobylev Reference Bajkova and Bobylev2022). The impact of evolution history of Galactic globular clusters into their HB morphology should be investigated further.
Thus, the HB morphology difference between metal-poor clusters from Paper VI and this study can be explained by their age as the second parameter. Additionally, their regular stellar evolution with moderate mass loss ( $\unicode{x03B7}\approx0.3$
) generates few low-mass blue HB stars making mass loss efficiency the third parameter. The different evolutionary histories of the clusters seem to be the fourth parameter. These histories eliminate low-mass HB stars in the loose clusters NGC 5053 and NGC 5466, the core-collapse cluster NGC 7099, and NGC 4372, which is probably a re-bounced, post-core-collapse cluster or has been disrupted by its frequent slow crossings of the Galactic disk.
$\unicode{x03B7}\approx0.3$
) generates few low-mass blue HB stars making mass loss efficiency the third parameter. The different evolutionary histories of the clusters seem to be the fourth parameter. These histories eliminate low-mass HB stars in the loose clusters NGC 5053 and NGC 5466, the core-collapse cluster NGC 7099, and NGC 4372, which is probably a re-bounced, post-core-collapse cluster or has been disrupted by its frequent slow crossings of the Galactic disk.
6. Conclusions
Following our approach developed in Paper I–Paper VI, we have estimated metallicity [Fe/H], age, distance R from the Sun, reddenings, extinctions in various filters, and extinction-to-reddening ratio $R_{V}$
for NGC 1904 and NGC 4372. We have also re-estimated these parameters for NGC 288, NGC 362, NGC 5904, NGC 6205, and NGC 6218 from Paper I–Paper III to account for the significant upgrade of the data sets and isochrones in recent years. We fitted BaSTI and DSED theoretical isochrones for [
$R_{V}$
for NGC 1904 and NGC 4372. We have also re-estimated these parameters for NGC 288, NGC 362, NGC 5904, NGC 6205, and NGC 6218 from Paper I–Paper III to account for the significant upgrade of the data sets and isochrones in recent years. We fitted BaSTI and DSED theoretical isochrones for [ $\alpha$
/Fe]
$\alpha$
/Fe] $=+0.4$
to CMDs based on multi-band photometry from the HST, Gaia DR3, PS1, SDSS, SMSS DR4, UKIDSS, VISTA VHS DR5, unWISE, a large compilation of the UBVRI ground-based observations by SPZ19, and other data sets. The filters under consideration span a wide wavelength range from the UV to mid-IR. Gaia DR3 and HST proper motions and parallaxes are used to select cluster members in almost all the data sets and to calculate the median parallax and systemic proper motion of the clusters. Besides the selection of members, cross-identification of the data sets to each other allowed us to consider systematic differences between them and calculate the most probable empirical extinction law for each cluster. These laws are generally close to the CCM89 extinction law with
$=+0.4$
to CMDs based on multi-band photometry from the HST, Gaia DR3, PS1, SDSS, SMSS DR4, UKIDSS, VISTA VHS DR5, unWISE, a large compilation of the UBVRI ground-based observations by SPZ19, and other data sets. The filters under consideration span a wide wavelength range from the UV to mid-IR. Gaia DR3 and HST proper motions and parallaxes are used to select cluster members in almost all the data sets and to calculate the median parallax and systemic proper motion of the clusters. Besides the selection of members, cross-identification of the data sets to each other allowed us to consider systematic differences between them and calculate the most probable empirical extinction law for each cluster. These laws are generally close to the CCM89 extinction law with $R_{V}=3.1$
, except for NGC 288 and NGC 1904, which have
$R_{V}=3.1$
, except for NGC 288 and NGC 1904, which have $R_{V}=3.9\pm 0.7$
and
$R_{V}=3.9\pm 0.7$
and $3.8\pm 0.5$
, respectively.
$3.8\pm 0.5$
, respectively.
We present the obtained estimates of [Fe/H], age, R, distance modulus, reddening $E(B-V)$
, and apparent V-band distance modulus for all the clusters in Table 5. We estimated the severe differential reddening up to
$E(B-V)$
, and apparent V-band distance modulus for all the clusters in Table 5. We estimated the severe differential reddening up to $\Delta E(B-V)=0.5$
in the NGC 4372 field due to foreground Musca dark nebula and other dust clouds detectable in our 3D extinction map. Six of the clusters are located at middle or high Galactic latitudes. With the lowest extinction estimate
$\Delta E(B-V)=0.5$
in the NGC 4372 field due to foreground Musca dark nebula and other dust clouds detectable in our 3D extinction map. Six of the clusters are located at middle or high Galactic latitudes. With the lowest extinction estimate $A_{V}=0.09$
mag for them, these clusters confirm our conclusion for five other high-latitude clusters in Paper VI that the typical total Galactic extinction from the Sun to extragalactic objects at middle and high latitudes is
$A_{V}=0.09$
mag for them, these clusters confirm our conclusion for five other high-latitude clusters in Paper VI that the typical total Galactic extinction from the Sun to extragalactic objects at middle and high latitudes is $A_{V}\gt0.08$
mag.
$A_{V}\gt0.08$
mag.
We calculated the HB types of the clusters under consideration and analysed the distribution of their HB stars in colour, effective temperature, and mass using the BaSTI isochrones. This allowed us to confirm the suggestion of Paper VI that the HB morphology difference of Galactic globular clusters can be explained by their different metallicity, age, mass loss efficiency, and loss of low-mass members, including the bluest HB stars, during cluster evolution. The latter process seems to be particularly important for NGC 4372. The majority of 16 clusters from our studies indicate a relatively high mass-loss efficiency, consistent with the Reimers mass-loss law with $\unicode{x03B7} \gt 0.3$
.
$\unicode{x03B7} \gt 0.3$
.
Supplementary material
The supplementary material for this article can be found at https://doi.org/10.1017/pasa.2026.10146
Acknowledgements
J.-W. Lee performed Strömgren observations with the 1-m telescope at CTIO and the 0.9-m telescope at KPNO for all the clusters (see Section 3), their processing and analysis with the financial support from the Basic Science Research Program (grant Nos. 2019R1A2C2086290 and RS-2025-20252972) through the National Research Foundation of Korea (NRF). All the remaining investigations were performed with the financial support from the Russian Science Foundation (grant no. 20–72–10052).
We thank the anonymous reviewer for useful comments. We thank Armando Arellano Ferro for very fruitful discussion of the cluster RR Lyrae stars, Anisa Bajkova for discussion of cluster orbital parameters, Vadim Bobylev for discussion of the NGC 4372 area, Santi Cassisi for providing the valuable BaSTI isochrones with his exceptionally useful comments, Aaron Dotter for his comments on DSED, Gregory Green for discussion of extinction/reddening estimates in the fields of globular clusters, Frank Grundahl for providing his valuable Strömgren data sets with very useful comments, Weronika Narloch for her comments on some data sets and variable stars, Christopher Onken for his help in using the SkyMapper Southern Sky Survey, Peter Stetson for providing and having discussion of his valuable UBVRI photometry, Don VandenBerg for discussion of many aspects of globular clusters, Eugene Vasiliev for his very useful comments on the cluster properties.
This work has made use of BaSTI and DSED web tools; Filtergraph (Burger et al. Reference Burger, Stassun, Pepper, Siverd, Paegert, De Lee and Robinson2013), an online data visualization tool developed at Vanderbilt University through the Vanderbilt Initiative in Data-intensive Astrophysics (VIDA) and the Frist Center for Autism and Innovation (FCAI, https://filtergraph.com); the resources of the Centre de Données astronomiques de Strasbourg, Strasbourg, France (http://cds.u-strasbg.fr), including the SIMBAD database, the VizieR catalogue access tool (Ochsenbein, Bauer, & Marcout Reference Ochsenbein, Bauer and Marcout2000) and the X-Match service; observations made with the NASA/ESA Hubble Space Telescope; data products from the Wide-field Infrared Survey Explorer, which is a joint project of the University of California, Los Angeles, and the Jet Propulsion Laboratory/California Institute of Technology; data products from the Pan-STARRS Surveys (PS1); data products from the Sloan Digital Sky Survey; data products from the SkyMapper Southern Sky Survey, SkyMapper is owned and operated by The Australian National University’s Research School of Astronomy and Astrophysics, the SkyMapper survey data were processed and provided by the SkyMapper Team at ANU, the SkyMapper node of the All-Sky Virtual Observatory (ASVO) is hosted at the National Computational Infrastructure (NCI); data products from the Two Micron All Sky Survey, which is a joint project of the University of Massachusetts and the Infrared Processing and Analysis Center/California Institute of Technology, funded by the National Aeronautics and Space Administration and the National Science Foundation; data from the European Space Agency (ESA) mission Gaia (https://www.cosmos.esa.int/gaia), processed by the Gaia Data Processing and Analysis Consortium (DPAC, https://www.cosmos.esa.int/web/gaia/dpac/consortium), and Gaia archive website (https://archives.esac.esa.int/gaia); data products from the VISTA Hemisphere Survey catalog DR5 based on observations made with ESO Telescopes at the La Silla or Paranal Observatories under programme ID(s) 179.A-2010(A), 179.A-2010(B), 179.A-2010(C), 179.A-2010(D), 179.A-2010(E), 179.A-2010(F), 179.A-2010(G), 179.A-2010(H), 179.A-2010(I), 179.A-2010(J), 179.A-2010(K), 179.A-2010(L), 179.A-2010(M), 179.A-2010(N), 179.A-2010(O).
Data availability statement
The data underlying this article will be shared on reasonable request to the corresponding author.
Competing interests
None.
Appendix A. Rejected data sets
We do not use some available data sets for clusters under consideration (some were considered in Paper I–Paper III) due to the following reasons.
The HST ACS photometry by Sarajedini et al. (Reference Sarajedini2007) has been replaced by NLP18. The HST Wide Field and Planetary Camera 2 (WFPC2) data sets (Piotto et al. Reference Piotto2002) for NGC 362, NGC 1904, NGC 4372, NGC 5904, NGC 6205, and NGC 6218 show large differences between photometry from different CCD chips used. The HB, AGB, and RGB are saturated in the Parallel-Field Catalogues of the HST UV Legacy Survey of Galactic Globular Clusters (Simioni et al. Reference Simioni2018) for NGC 5904 and NGC 6218 as well as in the HST WFPC2 data set by Layden et al. (Reference Layden, Sarajedini, von Hippel and Cool2005) for NGC 5904. The HST photometry by Cohen et al. (Reference Cohen, Hempel, Mauro, Geisler, Alonso-Garcia and Kinemuchi2015) for NGC 6205 is of unacceptable quality due to significant photometric errors and contamination by non-members. The $JK_s$
photometry obtained by Cohen et al. (Reference Cohen, Hempel, Mauro, Geisler, Alonso-Garcia and Kinemuchi2015) with Infrared Side Port Imager mounted on the 4-m Blanco telescope at CTIO for NGC 288 and NGC 362 is not precisely referred to the 2MASS system (as evident from our isochrone fitting) and, hence, has a poorly defined system. The IR photometry in the 3.6-
$JK_s$
photometry obtained by Cohen et al. (Reference Cohen, Hempel, Mauro, Geisler, Alonso-Garcia and Kinemuchi2015) with Infrared Side Port Imager mounted on the 4-m Blanco telescope at CTIO for NGC 288 and NGC 362 is not precisely referred to the 2MASS system (as evident from our isochrone fitting) and, hence, has a poorly defined system. The IR photometry in the 3.6- $\unicode{x03BC}$
m filter of the Spitzer Space Telescope Infrared Array Camera obtained by Gordon et al. (Reference Gordon2011) within the Surveying the Agents of Galaxy Evolution in the Tidally-Disrupted, Low-Metallicity Small Magellanic Cloud (SAGE) for NGC 362 is related only to stars brighter than TO and not modeled by BaSTI. The Strömgren vby photometry from the Isaac Newton Telescope – Wide Field Camera (Savino et al. Reference Savino, Massari, Bragaglia, Dalessandro and Tolstoy2018) for NGC 6205 shows unacceptable quality in the observations of valuable bright stars, such as those on the HB, AGB, and RGB.
$\unicode{x03BC}$
m filter of the Spitzer Space Telescope Infrared Array Camera obtained by Gordon et al. (Reference Gordon2011) within the Surveying the Agents of Galaxy Evolution in the Tidally-Disrupted, Low-Metallicity Small Magellanic Cloud (SAGE) for NGC 362 is related only to stars brighter than TO and not modeled by BaSTI. The Strömgren vby photometry from the Isaac Newton Telescope – Wide Field Camera (Savino et al. Reference Savino, Massari, Bragaglia, Dalessandro and Tolstoy2018) for NGC 6205 shows unacceptable quality in the observations of valuable bright stars, such as those on the HB, AGB, and RGB.
Some data sets have been included into the current version of the SPZ19 data sets and, hence, are not used by us separately: the VI photometry by Rosenberg et al. (Reference Rosenberg, Aparicio, Saviane and Piotto2000a,b) for all the clusters, BV photometry with the Wide Field Imager mounted on the 2.2-m telescope, ESO, La Silla for NGC 288 and NGC 6218 (Sollima et al. Reference Sollima, Dalessandro, Beccari and Pallanca2017), UBVRI photometry by Viaux et al. (Reference Viaux, Catelan, Stetson, Raffelt, Redondo, Valcarce and Weiss2013) for NGC 5904, VI photometry for NGC 4372 by Kacharov et al. (Reference Kacharov2014) obtained with the Wide Field Imager at the 2.2-m MPG/ESO telescope at La Silla, and others.
We do not use any data set represented only by a fiducial sequence (i.e. without data for individual stars), as this does not allow for cross-identification, which is essential to our approach. Such data sets used in Paper I–Paper III are the BV photometry obtained for NGC 288 with the 4-m and 0.9-m telescopes at CTIO (Bolte Reference Bolte1992); the JK photometry obtained for NGC 288 and NGC 6205 with the 3.6-m Canada–France–Hawaii Telescope (CFHT) (Davidge & Harris Reference Davidge and Harris1995; Davidge & Harris Reference Davidge and Harris1997); the ugriz photometry obtained for NGC 6205 with the MegaCam wide-field imager on CFHT (Clem, Vanden Berg, & Stetson Reference Clem, Vanden Berg and Stetson2008); the BV photometry obtained for NGC 6205 with the 1.23-m telescope at the German-Spanish Astronomical Center, Calar Alto, Spain (Paltrinieri et al. Reference Paltrinieri, Ferraro, Carretta and Pecci1998); the JK photometry obtained for NGC 5904 and NGC 6205 with the WIRCam imager on CFHT (Brasseur et al. Reference Brasseur and Stetson2010).
Also, we do not use the promising ugriz photometry obtained by Shanks et al. (Reference Shanks2015) with the Very Large Telescope ATLAS survey for NGC 288, as it is not precisely calibrated to the SDSS system (as evident from our isochrone fitting) and therefore has a poorly defined photometric system.
The adopted effective wavelength $\lambda_{\mathrm{eff}}$
(nm) for the filters under consideration, data set numbers (see text), and typical photometric uncertainty cut (mag) applied (slightly varying depending on cluster and data set). We relax the photometry cuts by 0.03 mag for distant NGC 1904, while tight them by 0.02 mag for highly contaminated NGC 362.
$\lambda_{\mathrm{eff}}$
(nm) for the filters under consideration, data set numbers (see text), and typical photometric uncertainty cut (mag) applied (slightly varying depending on cluster and data set). We relax the photometry cuts by 0.03 mag for distant NGC 1904, while tight them by 0.02 mag for highly contaminated NGC 362.

Appendix B. Filters used and cleaning of the data sets
Table B1 presents the effective wavelength $\lambda_{\mathrm{eff}}$
in nm for the filters used, their correspondence with the data sets, and typical photometric uncertainty cut level. This cut level is equal to
$\lambda_{\mathrm{eff}}$
in nm for the filters used, their correspondence with the data sets, and typical photometric uncertainty cut level. This cut level is equal to $3\,\sigma$
of the average photometric uncertainty
$3\,\sigma$
of the average photometric uncertainty $\sigma$
stated by the authors of the data sets. We eliminate stars with inaccurate photometry as those with a photometric uncertainty larger than the cut level. As an exception, we increase the cut level to 0.15 mag for the WISE W1 filter for better representation of the TO and bright MS stars.
$\sigma$
stated by the authors of the data sets. We eliminate stars with inaccurate photometry as those with a photometric uncertainty larger than the cut level. As an exception, we increase the cut level to 0.15 mag for the WISE W1 filter for better representation of the TO and bright MS stars.
As in our previous papers, to clean the data sets, we follow the recommendations of their authors to select single star-like objects with reliable photometry. The HST WFC3 and ACS data sets are cleaned by selecting stars with $|{{sharp}}|\lt0.15$
, quality fit
$|{{sharp}}|\lt0.15$
, quality fit $\gt0.9$
, and membership probability
$\gt0.9$
, and membership probability $\gt0.9$
or
$\gt0.9$
or $-1$
(this probability is discussed in Appendix C). For cleaning of the SPZ19, GCL99, SDSS, and other data sets with the stated
$-1$
(this probability is discussed in Appendix C). For cleaning of the SPZ19, GCL99, SDSS, and other data sets with the stated $\chi$
and sharp parameters, we select stars with
$\chi$
and sharp parameters, we select stars with $\chi\lt3$
and
$\chi\lt3$
and $|{{sharp}}|\lt0.3$
.
$|{{sharp}}|\lt0.3$
.
We leave Gaia stars with astrometric_excess_noise $\lt1$
(
$\lt1$
( $\epsilon i\lt1$
); a renormalised unit weight error not exceeding
$\epsilon i\lt1$
); a renormalised unit weight error not exceeding $1.4$
(RUWE
$1.4$
(RUWE $\lt1.4$
); and a corrected excess factor phot_bp_rp_ excess_factor (i.e. E(BP/RP)Corr) between
$\lt1.4$
); and a corrected excess factor phot_bp_rp_ excess_factor (i.e. E(BP/RP)Corr) between $-0.14$
and
$-0.14$
and $0.14$
(see Riello et al. Reference Riello2021).
$0.14$
(see Riello et al. Reference Riello2021).
The results of our isochrone fitting for two models and some key CMDs.

In all the CMDs, the colour is the abscissa, the reddening is the colour excess, and the magnitude in the redder filter is the ordinate, except the Lee’s data set for NGC 5904 where the ordinate is the V magnitude. Each derived reddening is followed by corresponding $E(B-V)$
, given in parentheses and calculated using extinction coefficients from Casagrande & VandenBerg (Reference Casagrande2014, Reference Casagrande2018a,b) or CCM89 with
$E(B-V)$
, given in parentheses and calculated using extinction coefficients from Casagrande & VandenBerg (Reference Casagrande2014, Reference Casagrande2018a,b) or CCM89 with $R_{V}=3.1$
. Age is in Gyr, cluster distance from the Sun R is in kpc. The complete table is available online.
$R_{V}=3.1$
. Age is in Gyr, cluster distance from the Sun R is in kpc. The complete table is available online.
We have to eliminate the brightest stars ( $V\lt14.5$
mag) from the data set of Zloczewski et al. (Reference Zloczewski, Kaluzny, Rozyczka, Krzeminski and Mazur2012) as well as such stars (
$V\lt14.5$
mag) from the data set of Zloczewski et al. (Reference Zloczewski, Kaluzny, Rozyczka, Krzeminski and Mazur2012) as well as such stars ( $Y_{\mathrm{VISTA}}\lt12.5$
,
$Y_{\mathrm{VISTA}}\lt12.5$
, $J_{\mathrm{VISTA}}\lt12$
or
$J_{\mathrm{VISTA}}\lt12$
or $K_{\mathrm{VISTA}}\lt11.5$
) from the VISTA data sets due to their unacceptable systematics (e.g. see Figure C4).
$K_{\mathrm{VISTA}}\lt11.5$
) from the VISTA data sets due to their unacceptable systematics (e.g. see Figure C4).
Appendix C. Some more details of the study
Figure C1 presents some examples of CMDs before and after the selection of cluster members when the remaining data set cleaning is applied. The crucial importance of this selection is evident.
The determination of the best-fit [Fe/H] from the NLP18 CMDs and its relation to the membership probability in the NLP18 data sets requires the following comments. NLP18 data sets cover only few central arcminutes of the cluster fields where very likely cluster members (NLP18 membership probability $\gt90\%$
) dominate: from
$\gt90\%$
) dominate: from $\gt$
97% among all stars for slightly contaminated clusters such as NGC 5904 down to about 80% for strongly contaminated ones such as NGC 362. This is evident from Figure C2 where very likely members, less likely members (NLP18 membership probability
$\gt$
97% among all stars for slightly contaminated clusters such as NGC 5904 down to about 80% for strongly contaminated ones such as NGC 362. This is evident from Figure C2 where very likely members, less likely members (NLP18 membership probability $\lt90\%$
), and stars with indeterminate membership (membership probability
$\lt90\%$
), and stars with indeterminate membership (membership probability $=-1$
) are shown by different colours in a typical NLP18 CMD for NGC 5904. It is seen that the stars with indeterminate membership probability are mainly faint MS stars. We assume that, similar to the bright MS stars, cluster members dominate among the faint MS stars with indeterminate membership probability. Therefore, we retain them in the data sets in contrast to the eliminated less likely members. These faint MS stars with indeterminate membership probability are important for our determination of [Fe/H] as evident from Figure C3 for the same NLP18 CMD for NGC 5904 best-fitted by isochrones with different [Fe/H] (and other best-fitted parameters changed respectively).
$=-1$
) are shown by different colours in a typical NLP18 CMD for NGC 5904. It is seen that the stars with indeterminate membership probability are mainly faint MS stars. We assume that, similar to the bright MS stars, cluster members dominate among the faint MS stars with indeterminate membership probability. Therefore, we retain them in the data sets in contrast to the eliminated less likely members. These faint MS stars with indeterminate membership probability are important for our determination of [Fe/H] as evident from Figure C3 for the same NLP18 CMD for NGC 5904 best-fitted by isochrones with different [Fe/H] (and other best-fitted parameters changed respectively).
It is worth noting that [Fe/H] can be best determined from fitting of the faint MS or bright RGB stars. The former are used for the determination of the best-fit [Fe/H] from the NLP18 CMDs, since their bright RGBs are sparsely populated, while the latter are used for that from the Gaia, SPZ19, and other data sets, since their faint MSs are incomplete.
DR requires the following comments. Figure C4 presents some examples of CMDs for NGC 4372 before and after applying our DR corrections.
DR maps derived from SFD98, GMS25, GSZ19, and various CMDs for the NGC 6218 field are presented in Figure C5. These DR maps show slight differences in their DR values due to systematics in the data and, consequently, we have to display them on different scales. A similar pattern is seen for SFD98, GMS25, GSZ19, Gaia, SPZ19 $B-V$
and
$B-V$
and $V-I$
and some other maps: the highest and lowest reddenings occur at the upper edge and the center of the field, respectively. The same pattern is seen in the DR map presented by Jang et al. (Reference Jang2022) in their Figure 5 and Pancino et al. (Reference Pancino2024) in their Figure A3. However, this similarity is not so sharp as in the NGC 4372 DR maps. For example, GSZ19 report DR variations four times greater than those in SFD98, likely due to different methods employed in the creation of these maps. Moreover, some disagreement is seen between the DR maps for different data sets and even for different CMDs/colours of the same data set (e.g. SPZ19
$V-I$
and some other maps: the highest and lowest reddenings occur at the upper edge and the center of the field, respectively. The same pattern is seen in the DR map presented by Jang et al. (Reference Jang2022) in their Figure 5 and Pancino et al. (Reference Pancino2024) in their Figure A3. However, this similarity is not so sharp as in the NGC 4372 DR maps. For example, GSZ19 report DR variations four times greater than those in SFD98, likely due to different methods employed in the creation of these maps. Moreover, some disagreement is seen between the DR maps for different data sets and even for different CMDs/colours of the same data set (e.g. SPZ19 $U-B$
versus
$U-B$
versus $B-V$
or
$B-V$
or $V-I$
). Similar to Figure 5 in Paper VI for NGC 7099, Figure C5 illustrates that the DR for NGC 6218 is only marginally greater than the systematic uncertainties in the data sets. The DR in the fields of the remaining clusters is at a level of other systematics.
$V-I$
). Similar to Figure 5 in Paper VI for NGC 7099, Figure C5 illustrates that the DR for NGC 6218 is only marginally greater than the systematic uncertainties in the data sets. The DR in the fields of the remaining clusters is at a level of other systematics.
Table B2 presents the best solutions of our isochrone fitting for two models and some key CMDs.
Figures C6 and C7 present examples of several CMDs of the same data set with the UV and optical filters. A reliable fitting of all the CMDs is evident. Similarly to Table 5, Table B3 presents the best solutions for these CMDs as well as the average estimates of the parameters and their uncertainties as half the range of the parameter estimates. It is seen that the average estimates agree with the final ones in Table 5, while the uncertainties are within our estimates of total uncertainties.
Appendix D. Adjustment
We adjust data sets with similar filters (e.g. SPZ19 V versus Lee Strömgren y versus Gaia $G_{\mathrm{BP}}$
, other pairs can be found in Table B1) following our approach described in section 6 of Paper II and in Paper III.
$G_{\mathrm{BP}}$
, other pairs can be found in Table B1) following our approach described in section 6 of Paper II and in Paper III.
Such similar filters provide CMDs in which the position of stars and isochrones is almost independent of the cluster parameters. Hence, any colour shift of an isochrone w.r.t. a bulk of the stars is due to a systematic error of a data set or an isochrone used (the latter may be, for example, due to a wrong colour– $T_{\mathrm{eff}}$
relation). An example of such CMDs for the SPZ19, Lee, and Gaia similar filters for NGC 6218 is shown in Figure D1. The isochrones of the same model for various age and Y almost coincide. A reasonable variation of reddening, R, and [Fe/H] also changes the isochrone colour negligibly. Figure D1 shows that the MS and HB have a large scatter of the stars, while the RGB is appropriate to analyse the colour shifts.
$T_{\mathrm{eff}}$
relation). An example of such CMDs for the SPZ19, Lee, and Gaia similar filters for NGC 6218 is shown in Figure D1. The isochrones of the same model for various age and Y almost coincide. A reasonable variation of reddening, R, and [Fe/H] also changes the isochrone colour negligibly. Figure D1 shows that the MS and HB have a large scatter of the stars, while the RGB is appropriate to analyse the colour shifts.
Such CMDs present relative colours shifts for ‘data set–data set–isochrone’ triples (e.g. a nearly zero SPZ19–Lee $V-y$
colour of the star bulk w.r.t. the DSED isochrone in Figure D1 (a)), but not those of a data set or an isochrone separately. Therefore,
$V-y$
colour of the star bulk w.r.t. the DSED isochrone in Figure D1 (a)), but not those of a data set or an isochrone separately. Therefore,
The same as Table 4 but for several CMDs of the same data set. ‘Average’ is the average for these CMD estimates, while uncertainty is half the range of the estimates.

we cannot use such diagrams to clarify the systematic errors of a data set or an isochrone. However, we can adjust a series of data sets with similar filters by calculating constant colour corrections to the ‘data set – isochrone pairs’ in order to make the colours of all the data sets in the series closer to each other. For such a calculation we impose an additional condition: an average colour of all the data sets in the series w.r.t. an isochrone is fixed. This condition fixes the derived reddenings and extinctions. It is worth noting that since we correct only colours and since these corrections are rather small (within a few hundredths of a magnitude), all the derived estimates of [Fe/H], R, and age are also fixed. In the case of Figure D1, the corrections of $+0.013$
,
$+0.013$
, $+0.013$
, and
$+0.013$
, and $-0.026$
mag would minimise, respectively, the SPZ19, Lee, and Gaia colour shifts w.r.t. the DSED isochrone, while the corrections of
$-0.026$
mag would minimise, respectively, the SPZ19, Lee, and Gaia colour shifts w.r.t. the DSED isochrone, while the corrections of $+0.01$
,
$+0.01$
, $-0.02$
, and
$-0.02$
, and $+0.01$
mag would do the same w.r.t. the BaSTI isochrone. This adjustment suppresses systematic differences between data sets for the same cluster and fitted by the same model. As a result, this reduces the scatter of extinctions derived from the data sets around an average extinction for the model–cluster pair. Accordingly, this leads to a better determination of empirical extinction law and a higher precision of the extinction-to-reddening ratio
$+0.01$
mag would do the same w.r.t. the BaSTI isochrone. This adjustment suppresses systematic differences between data sets for the same cluster and fitted by the same model. As a result, this reduces the scatter of extinctions derived from the data sets around an average extinction for the model–cluster pair. Accordingly, this leads to a better determination of empirical extinction law and a higher precision of the extinction-to-reddening ratio $R_{V}$
.
$R_{V}$
.
The SMSS $g_{\mathrm{SMSS}}-i_{\mathrm{SMSS}}$
versus
$g_{\mathrm{SMSS}}-i_{\mathrm{SMSS}}$
versus $i_{\mathrm{SMSS}}$
CMDs for six clusters before (left) and after (right) selection of the cluster members using the Gaia parallaxes and proper motions. DR is not corrected. Variable stars are shown by the magenta diamonds. The initial CMD for NGC 362 is strongly contaminated by the Small Magellanic Cloud. The isochrones for a primordial
$i_{\mathrm{SMSS}}$
CMDs for six clusters before (left) and after (right) selection of the cluster members using the Gaia parallaxes and proper motions. DR is not corrected. Variable stars are shown by the magenta diamonds. The initial CMD for NGC 362 is strongly contaminated by the Small Magellanic Cloud. The isochrones for a primordial $Y\approx0.25$
from BaSTI (red), BaSTI ZAHB (purple), and DSED (green), isochrones for
$Y\approx0.25$
from BaSTI (red), BaSTI ZAHB (purple), and DSED (green), isochrones for $Y=0.275$
from BaSTI (orange) and BaSTI ZAHB (blue), as well as isochrones for
$Y=0.275$
from BaSTI (orange) and BaSTI ZAHB (blue), as well as isochrones for $Y=0.33$
from DSED (luminous green) are calculated with the best-fitting parameters.
$Y=0.33$
from DSED (luminous green) are calculated with the best-fitting parameters.

(a) $F606W-F814W$
versus F814W CMD for the NLP18 stars of NGC 5904 with good photometry. Stars with membership probability
$F606W-F814W$
versus F814W CMD for the NLP18 stars of NGC 5904 with good photometry. Stars with membership probability $\gt90\%$
– blue symbols, with membership probability
$\gt90\%$
– blue symbols, with membership probability $\lt90\%$
– brown symbols, with undefined membership probability
$\lt90\%$
– brown symbols, with undefined membership probability $=-1$
– black symbols. Variable stars are shown by the magenta diamonds. The isochrones for a primordial
$=-1$
– black symbols. Variable stars are shown by the magenta diamonds. The isochrones for a primordial $Y\approx0.25$
from BaSTI (red), BaSTI ZAHB (purple), DSED (green), and DSED HB/AGB track (light green), isochrones for
$Y\approx0.25$
from BaSTI (red), BaSTI ZAHB (purple), DSED (green), and DSED HB/AGB track (light green), isochrones for $Y=0.275$
from BaSTI (orange) and BaSTI ZAHB (blue), as well as isochrones for
$Y=0.275$
from BaSTI (orange) and BaSTI ZAHB (blue), as well as isochrones for $Y=0.33$
from DSED (luminous green) are calculated with the best-fitting parameters. (b) Central part of the same CMD.
$Y=0.33$
from DSED (luminous green) are calculated with the best-fitting parameters. (b) Central part of the same CMD.

The MS part of the $F606W-F814W$
versus F814W CMD for the NLP18 stars of NGC 5904 with good photometry. Stars with membership probability
$F606W-F814W$
versus F814W CMD for the NLP18 stars of NGC 5904 with good photometry. Stars with membership probability $\gt90\%$
– blue symbols, with membership probability
$\gt90\%$
– blue symbols, with membership probability $\lt90\%$
– brown symbols, with undefined membership probability
$\lt90\%$
– brown symbols, with undefined membership probability $=-1$
– black symbols. The isochrones for a primordial
$=-1$
– black symbols. The isochrones for a primordial $Y\approx0.25$
from BaSTI (red) and DSED (green), isochrones for
$Y\approx0.25$
from BaSTI (red) and DSED (green), isochrones for $Y=0.275$
from BaSTI (orange) as well as isochrones for
$Y=0.275$
from BaSTI (orange) as well as isochrones for $Y=0.33$
from DSED (luminous green) are calculated with the best-fitting parameters with (a) [Fe/H]
$Y=0.33$
from DSED (luminous green) are calculated with the best-fitting parameters with (a) [Fe/H] $=-1.1$
and
$=-1.1$
and $-1.2$
for the BaSTI and DSED isochrones, respectively, (b) the finally accepted best estimates [Fe/H]
$-1.2$
for the BaSTI and DSED isochrones, respectively, (b) the finally accepted best estimates [Fe/H] $=-1.2$
and
$=-1.2$
and $-1.3$
for the BaSTI and DSED isochrones, respectively, and (c) [Fe/H]
$-1.3$
for the BaSTI and DSED isochrones, respectively, and (c) [Fe/H] $=-1.3$
and
$=-1.3$
and $-1.4$
for the BaSTI and DSED isochrones, respectively.
$-1.4$
for the BaSTI and DSED isochrones, respectively.

The same as Figure 1 but for the NGC 4372 SMSS $g-r$
versus r, SPZ19–VISTA
$g-r$
versus r, SPZ19–VISTA $V-J$
versus J, and Lee–VISTA
$V-J$
versus J, and Lee–VISTA $y-K$
versus K CMDs before (left column) and after (right column) our DR correction. The saturated stars with the VISTA photometry at
$y-K$
versus K CMDs before (left column) and after (right column) our DR correction. The saturated stars with the VISTA photometry at $J_{\mathrm{VISTA}}\lt12$
or
$J_{\mathrm{VISTA}}\lt12$
or $K_{\mathrm{VISTA}}\lt11.5$
are separated by the horizontal line and not used in the DR map construction.
$K_{\mathrm{VISTA}}\lt11.5$
are separated by the horizontal line and not used in the DR map construction.

Figure C5. DR maps derived from SFD98, GMS25, and GSZ19 and various CMDs for the same NGC 6218 field. All the maps are converted into $\Delta E(B-V)$
using the CCM89 extinction law with
$\Delta E(B-V)$
using the CCM89 extinction law with $R_{V}=3.1$
. The white areas have no estimates.
$R_{V}=3.1$
. The white areas have no estimates.
 $U-B$
versus B,
$U-B$
versus B, $B-V$
versus V, and
$B-V$
versus V, and $V-I$
versus I CMDs for the NGC 6205 Gaia DR3 members from the SPZ19 data set. The isochrones for a primordial
$V-I$
versus I CMDs for the NGC 6205 Gaia DR3 members from the SPZ19 data set. The isochrones for a primordial $Y\approx0.25$
from BaSTI (red), BaSTI ZAHB (purple), and DSED (green), DSED HB/AGB tracks (light green), isochrones for
$Y\approx0.25$
from BaSTI (red), BaSTI ZAHB (purple), and DSED (green), DSED HB/AGB tracks (light green), isochrones for $Y=0.275$
from BaSTI (orange) and BaSTI ZAHB (blue), as well as isochrones for
$Y=0.275$
from BaSTI (orange) and BaSTI ZAHB (blue), as well as isochrones for $Y=0.33$
from DSED (luminous green) are calculated with the best-fitting parameters. Variable stars are shown by the magenta diamonds.
$Y=0.33$
from DSED (luminous green) are calculated with the best-fitting parameters. Variable stars are shown by the magenta diamonds.
 $F275W-F336W$
versus F336W,
$F275W-F336W$
versus F336W, $F336W-F438W$
versus F438W,
$F336W-F438W$
versus F438W, $F438W-F606W$
versus F606W, and
$F438W-F606W$
versus F606W, and $F606W-F814W$
versus F814W CMDs for the NLP18 stars of NGC 6218. The isochrones for a primordial
$F606W-F814W$
versus F814W CMDs for the NLP18 stars of NGC 6218. The isochrones for a primordial $Y\approx0.25$
from BaSTI (red), BaSTI ZAHB (purple), DSED (green), and DSED HB/AGB track (light green), isochrones for
$Y\approx0.25$
from BaSTI (red), BaSTI ZAHB (purple), DSED (green), and DSED HB/AGB track (light green), isochrones for $Y=0.275$
from BaSTI (orange) and BaSTI ZAHB (blue), as well as isochrones for
$Y=0.275$
from BaSTI (orange) and BaSTI ZAHB (blue), as well as isochrones for $Y=0.33$
from DSED (luminous green) are calculated with the best-fitting parameters. Variable stars are shown by the magenta diamonds.
$Y=0.33$
from DSED (luminous green) are calculated with the best-fitting parameters. Variable stars are shown by the magenta diamonds.

(a) SPZ19-Lee $V-y$
versus y, (b) Gaia-SPZ19
$V-y$
versus y, (b) Gaia-SPZ19 $G_{\mathrm{BP}}-V$
versus V, and (c) Gaia-Lee
$G_{\mathrm{BP}}-V$
versus V, and (c) Gaia-Lee $G_{\mathrm{BP}}-y$
versus y CMDs for cluster members of NGC 6218. The isochrones for a primordial
$G_{\mathrm{BP}}-y$
versus y CMDs for cluster members of NGC 6218. The isochrones for a primordial $Y\approx0.25$
from BaSTI (red), BaSTI ZAHB (purple), and DSED (green), as well as for
$Y\approx0.25$
from BaSTI (red), BaSTI ZAHB (purple), and DSED (green), as well as for $Y=0.275$
from BaSTI (orange) and BaSTI ZAHB (blue) are calculated with the best-fitting [Fe/H], R, and reddening from Table 8 and age between 12.5 and 14 Gyr. Variable stars are shown by the magenta diamonds.
$Y=0.275$
from BaSTI (orange) and BaSTI ZAHB (blue) are calculated with the best-fitting [Fe/H], R, and reddening from Table 8 and age between 12.5 and 14 Gyr. Variable stars are shown by the magenta diamonds.


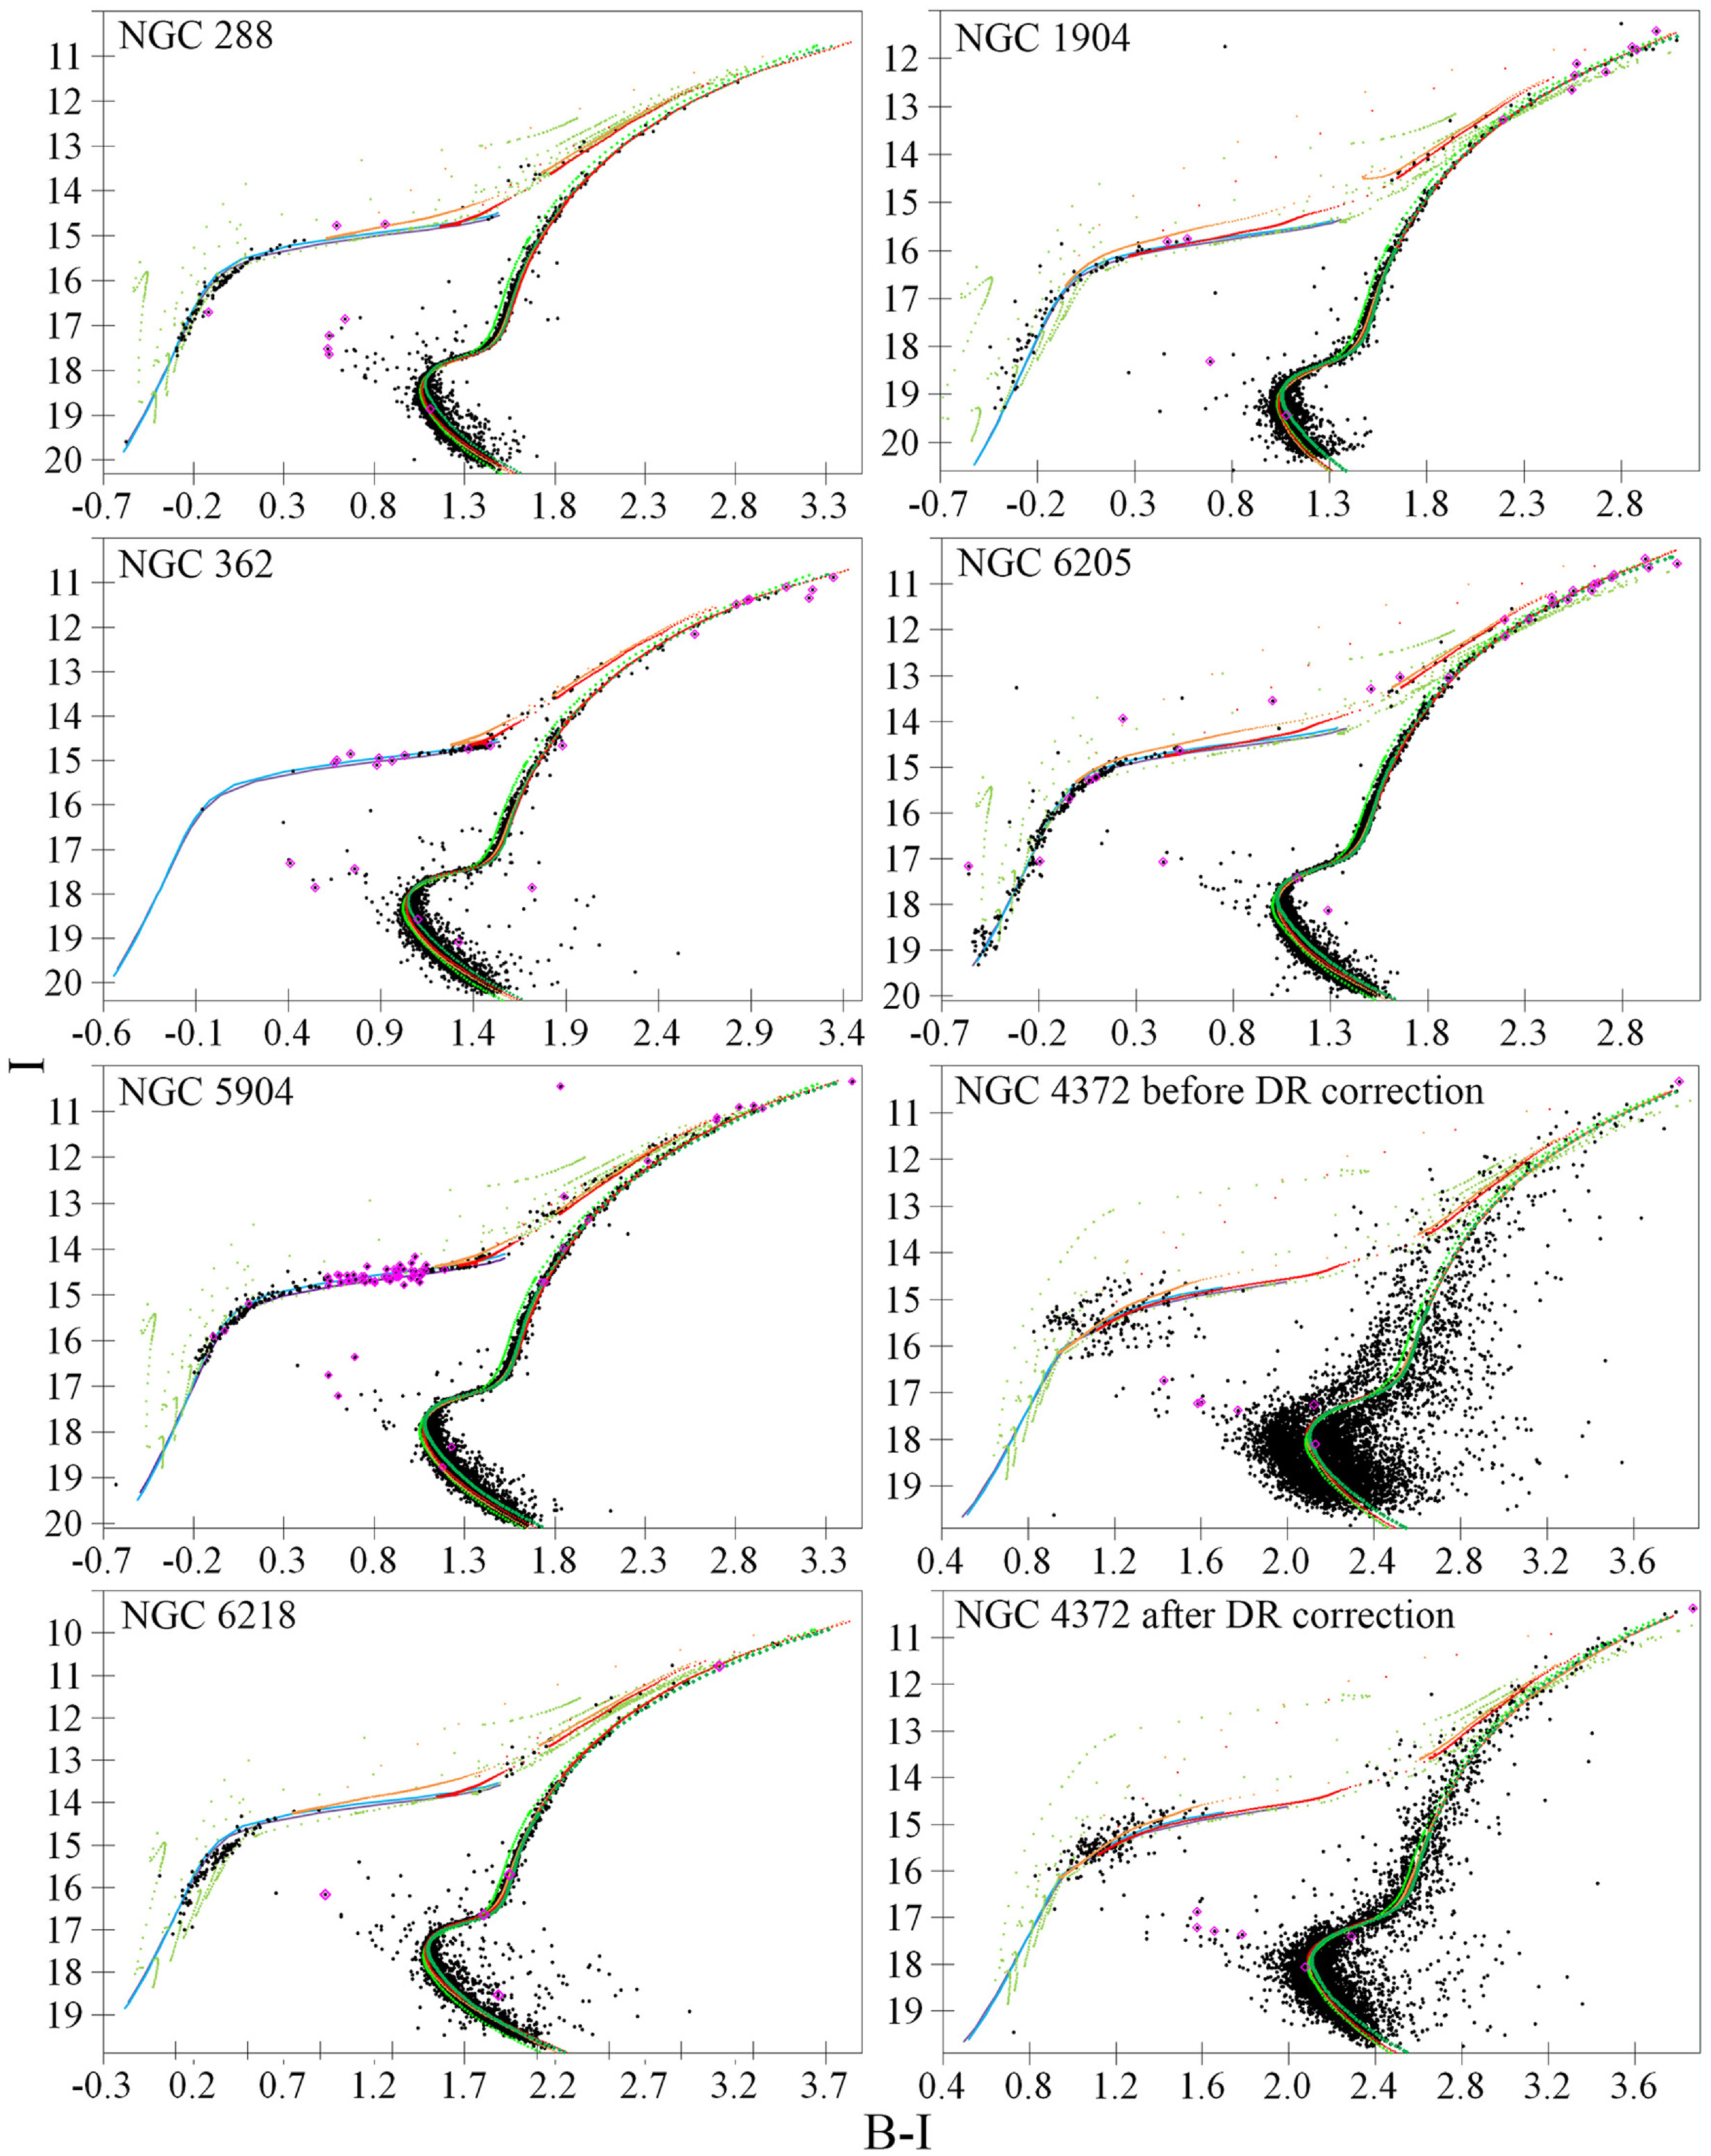


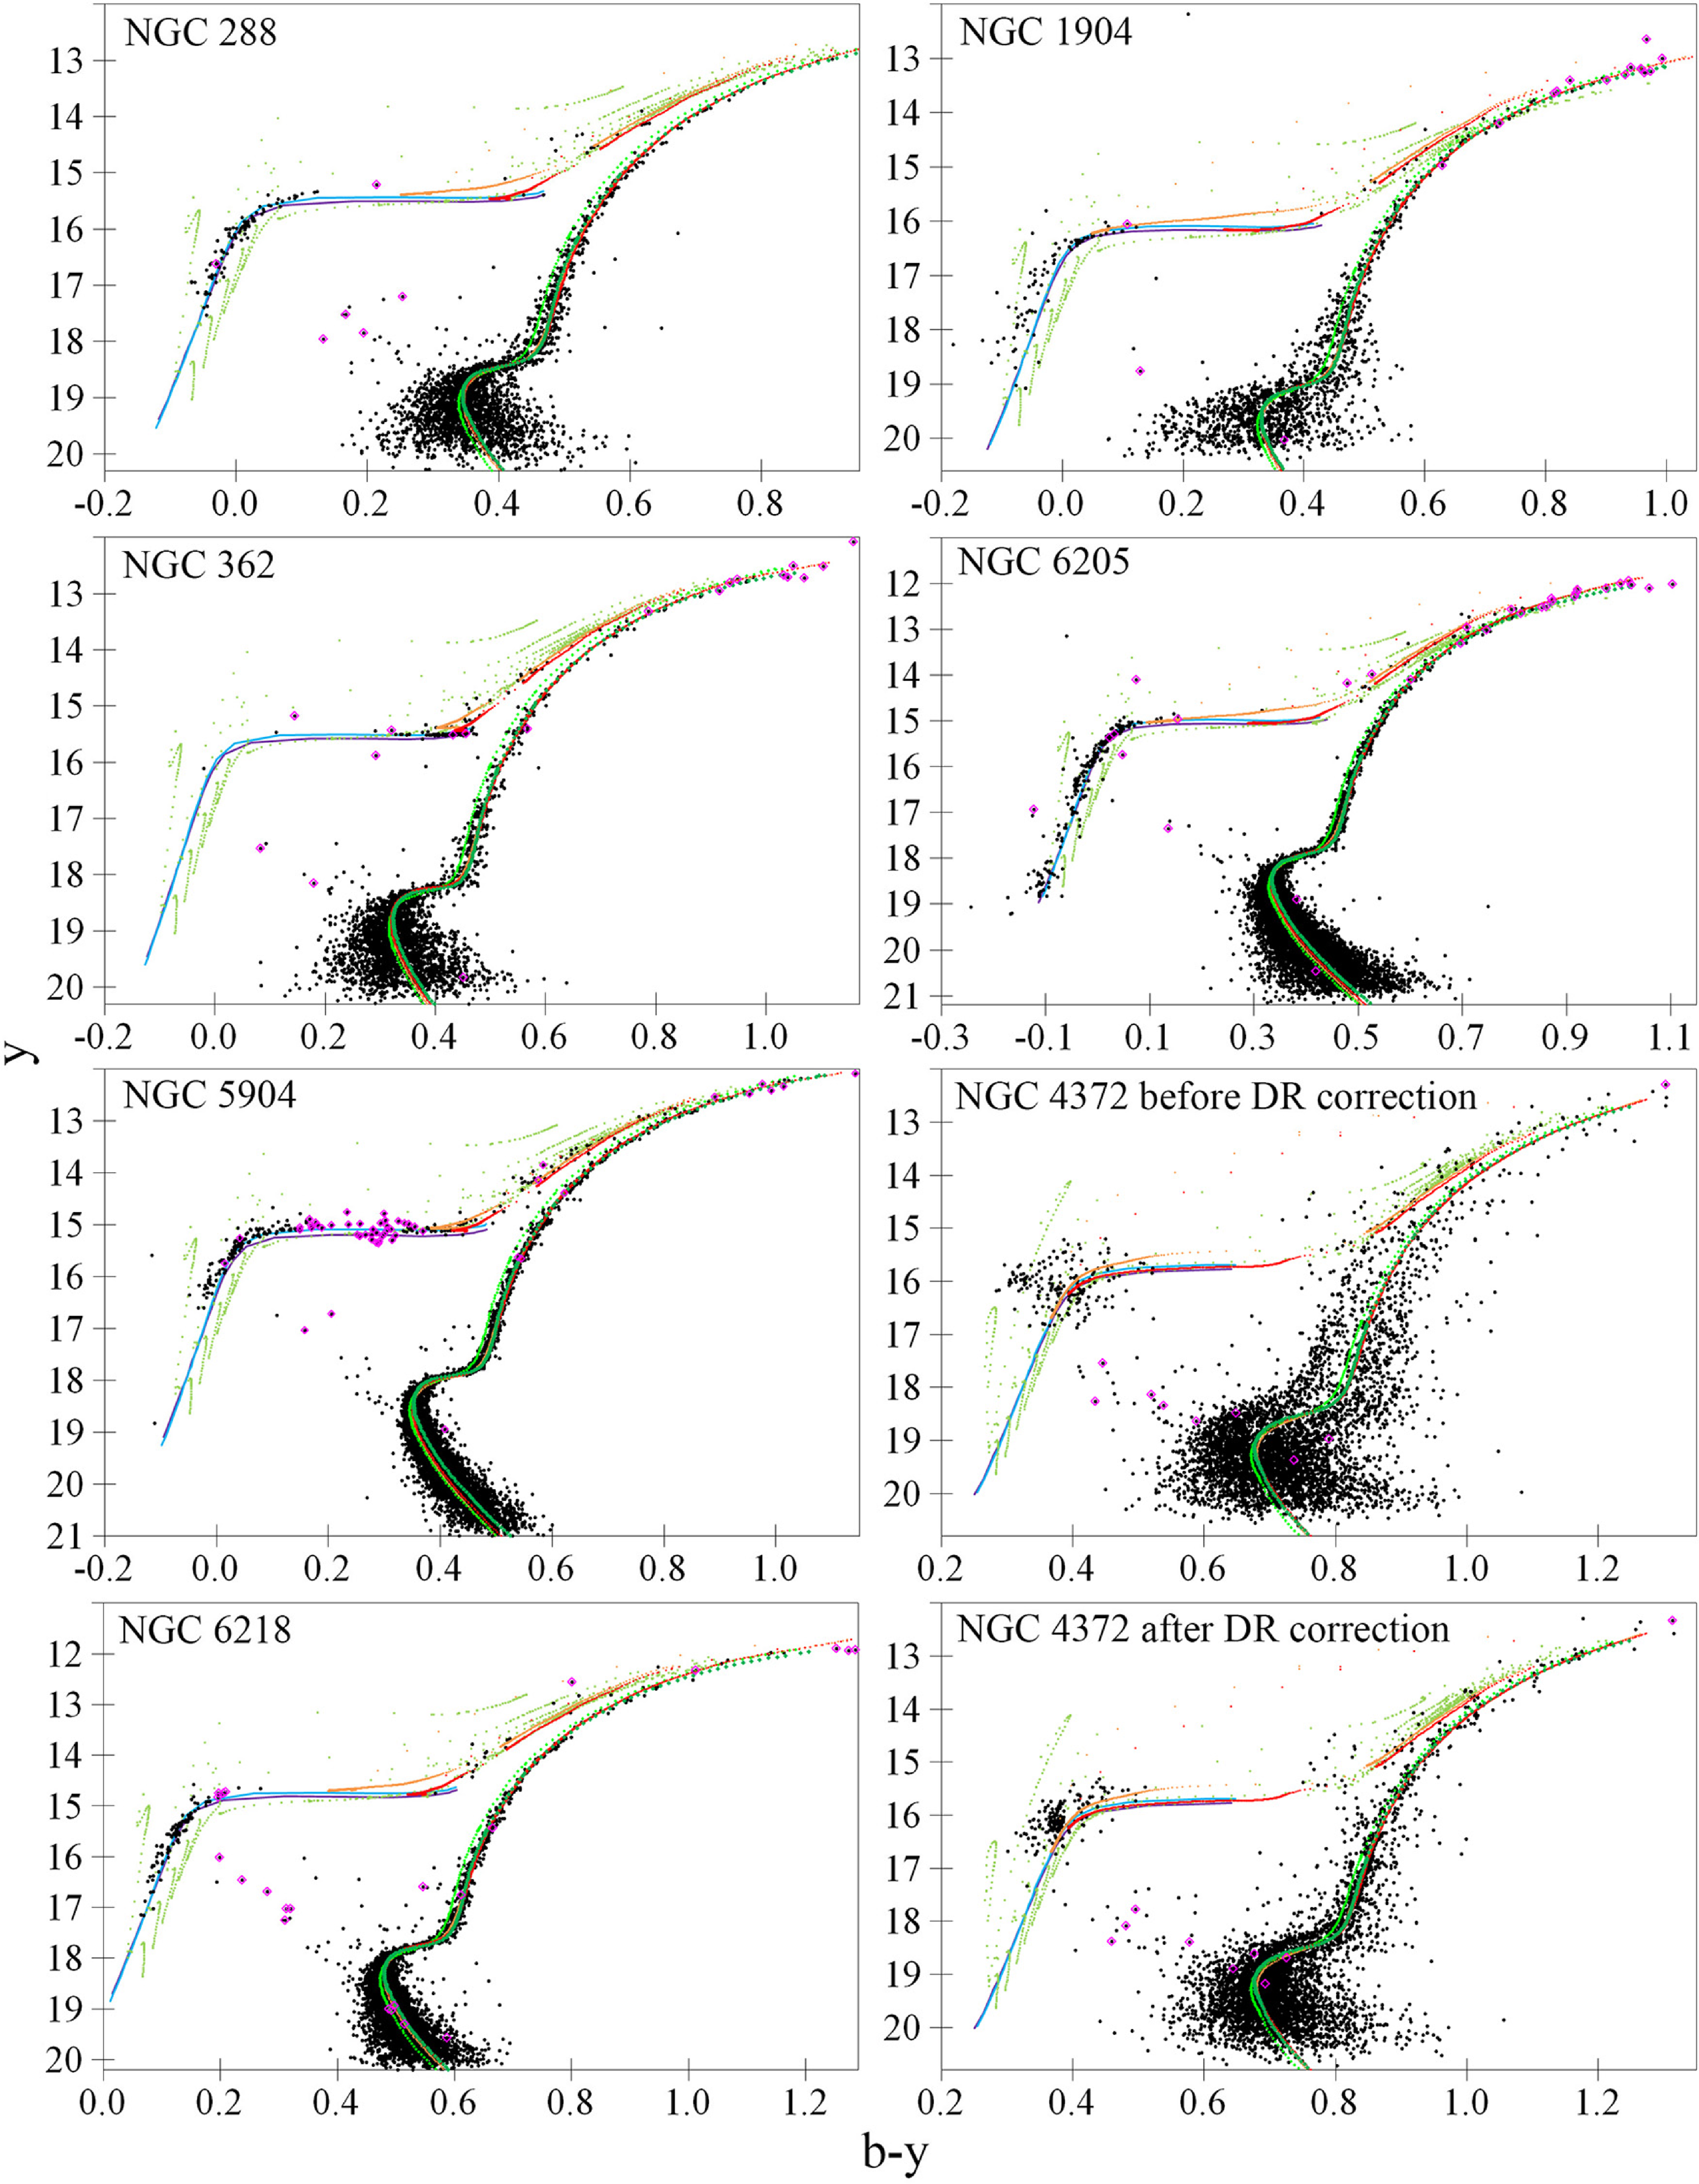

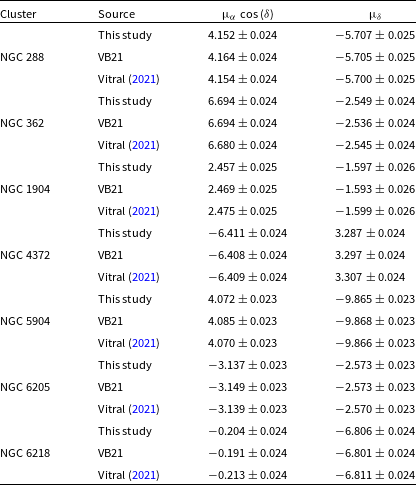

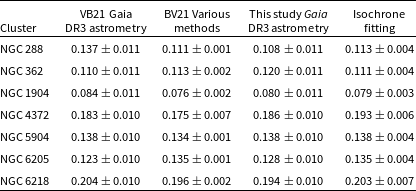


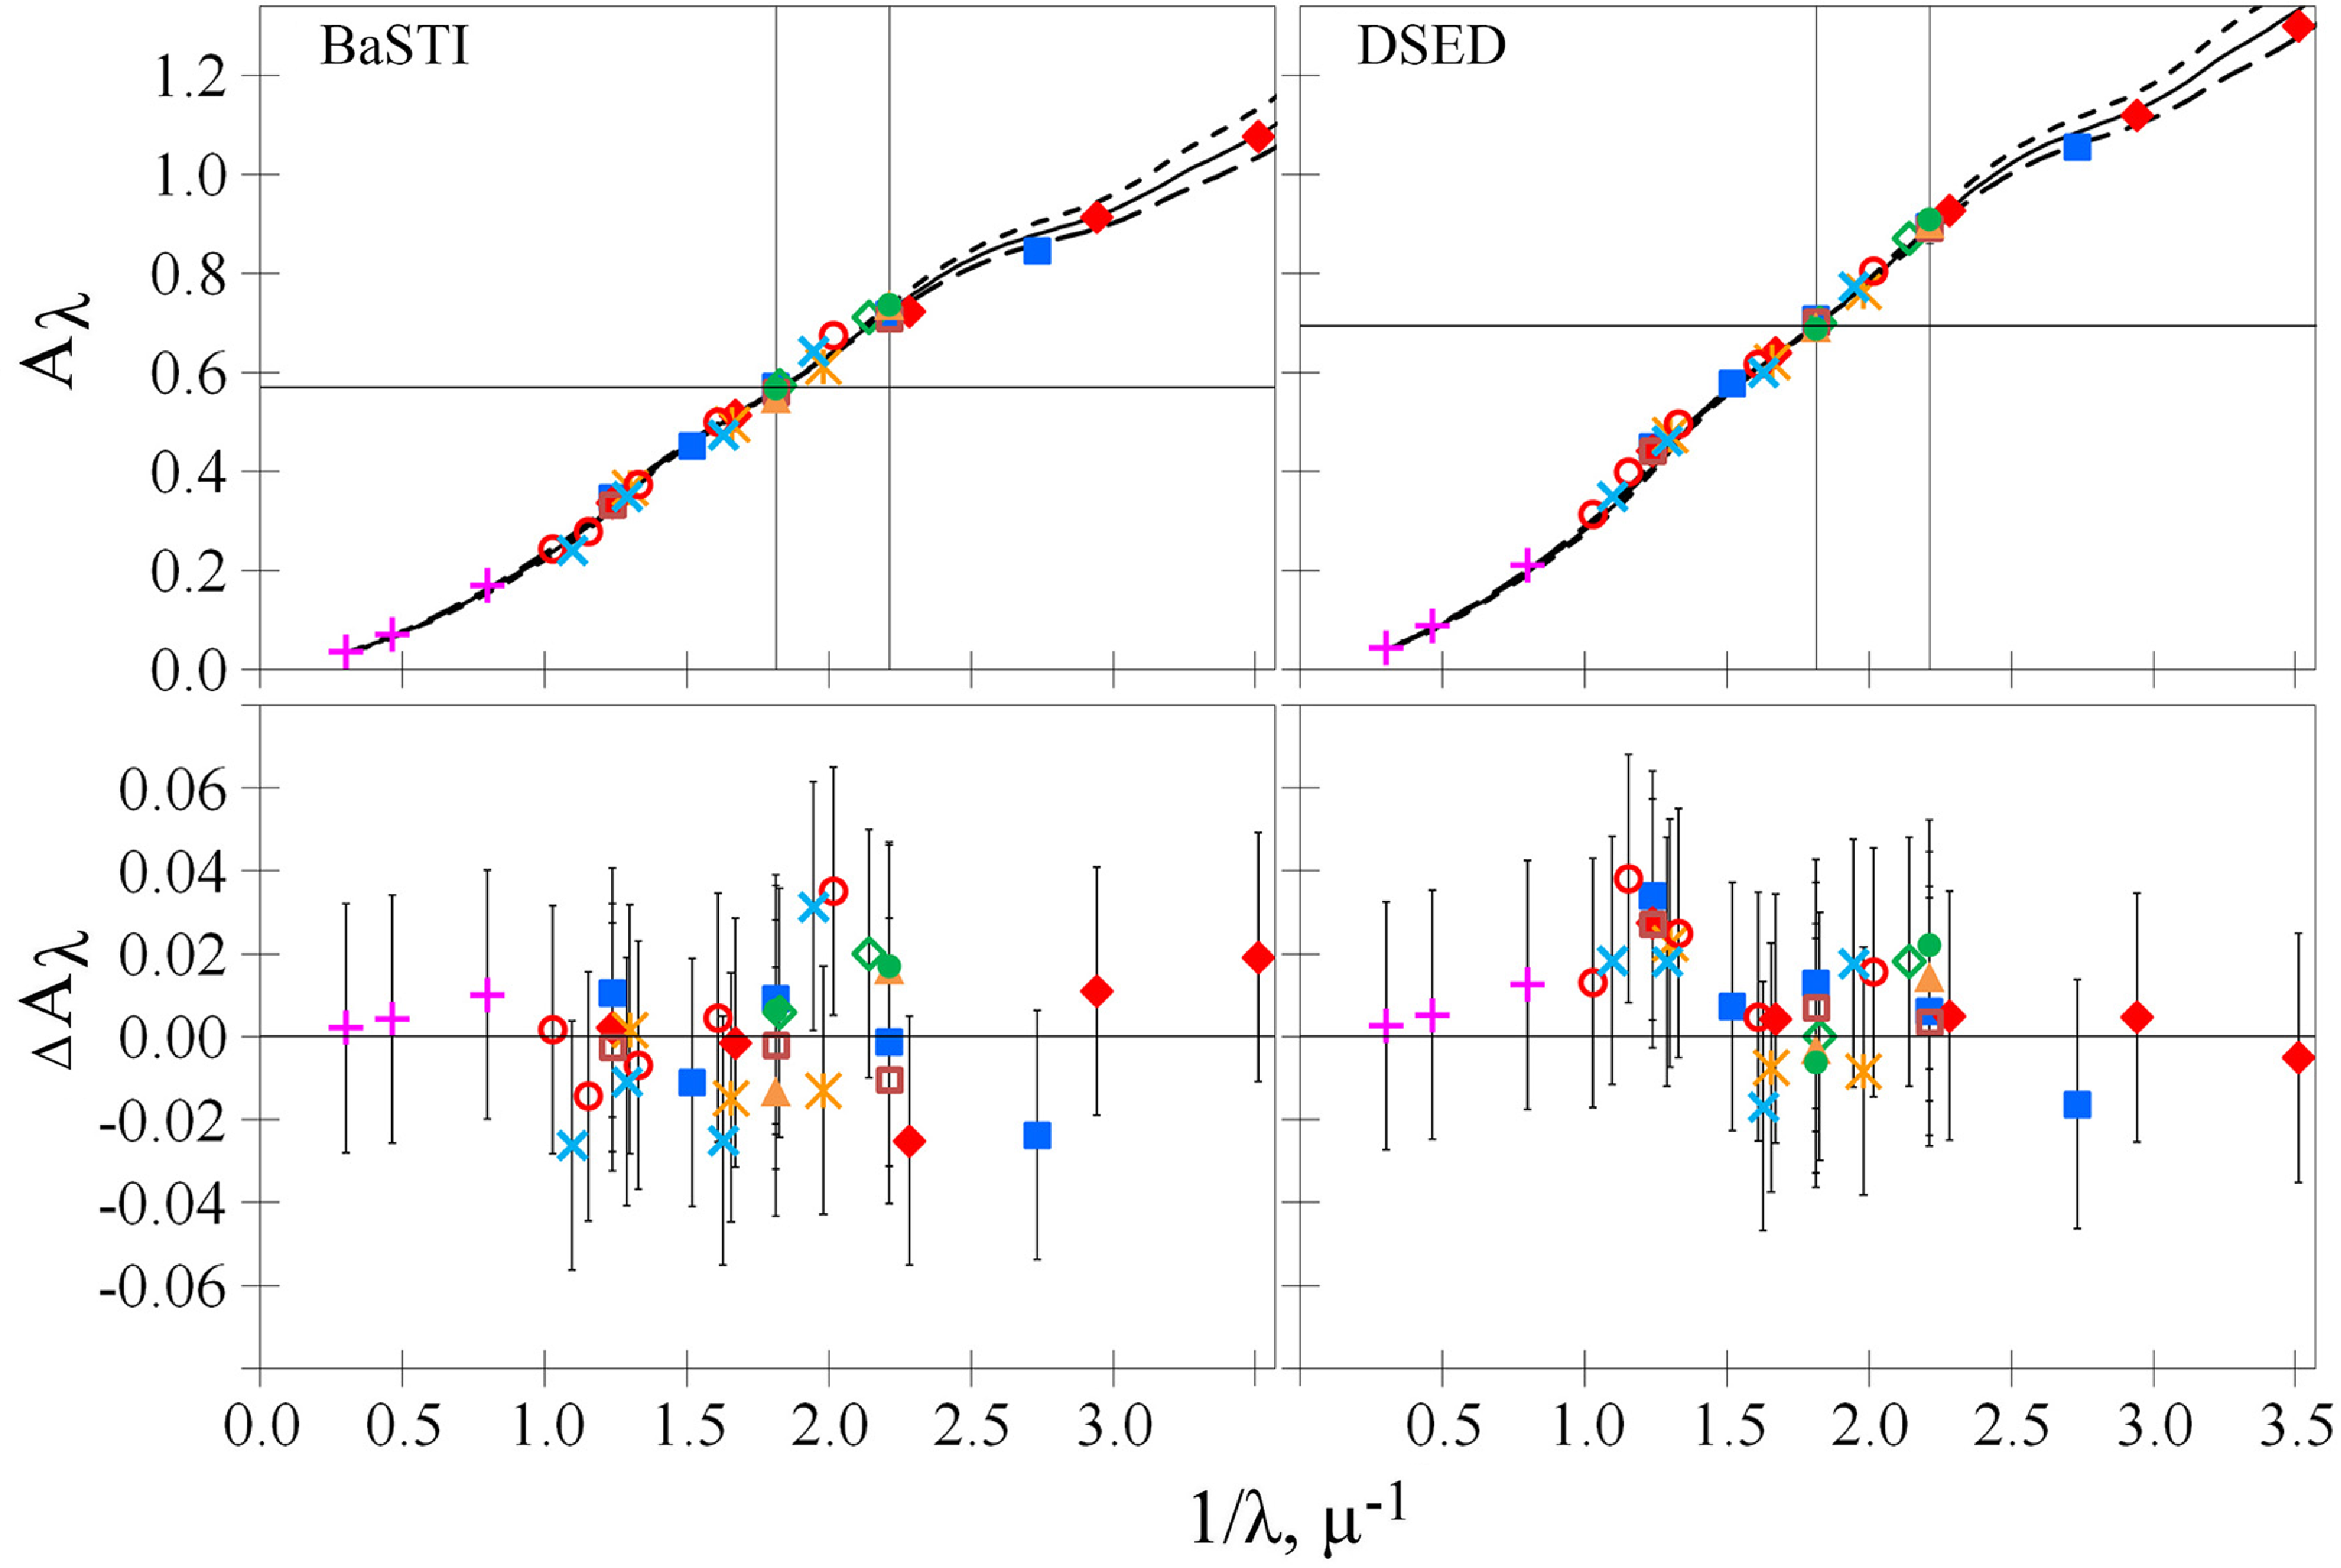


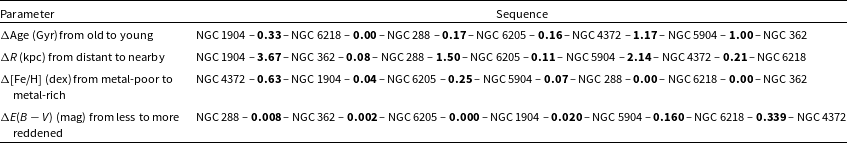

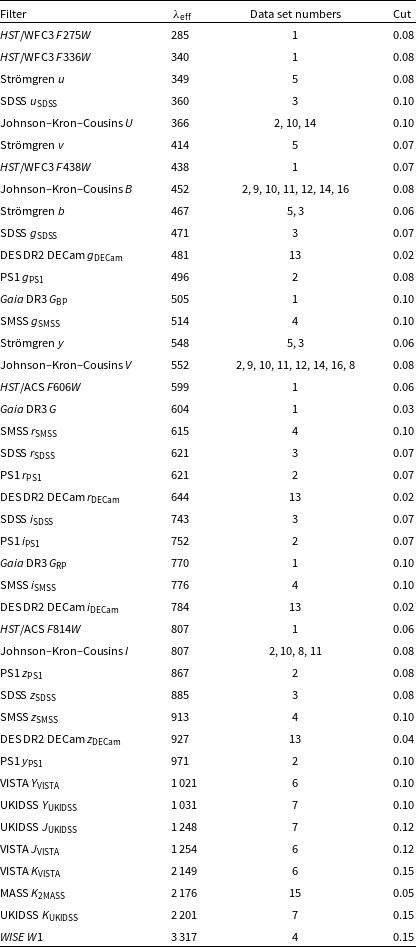


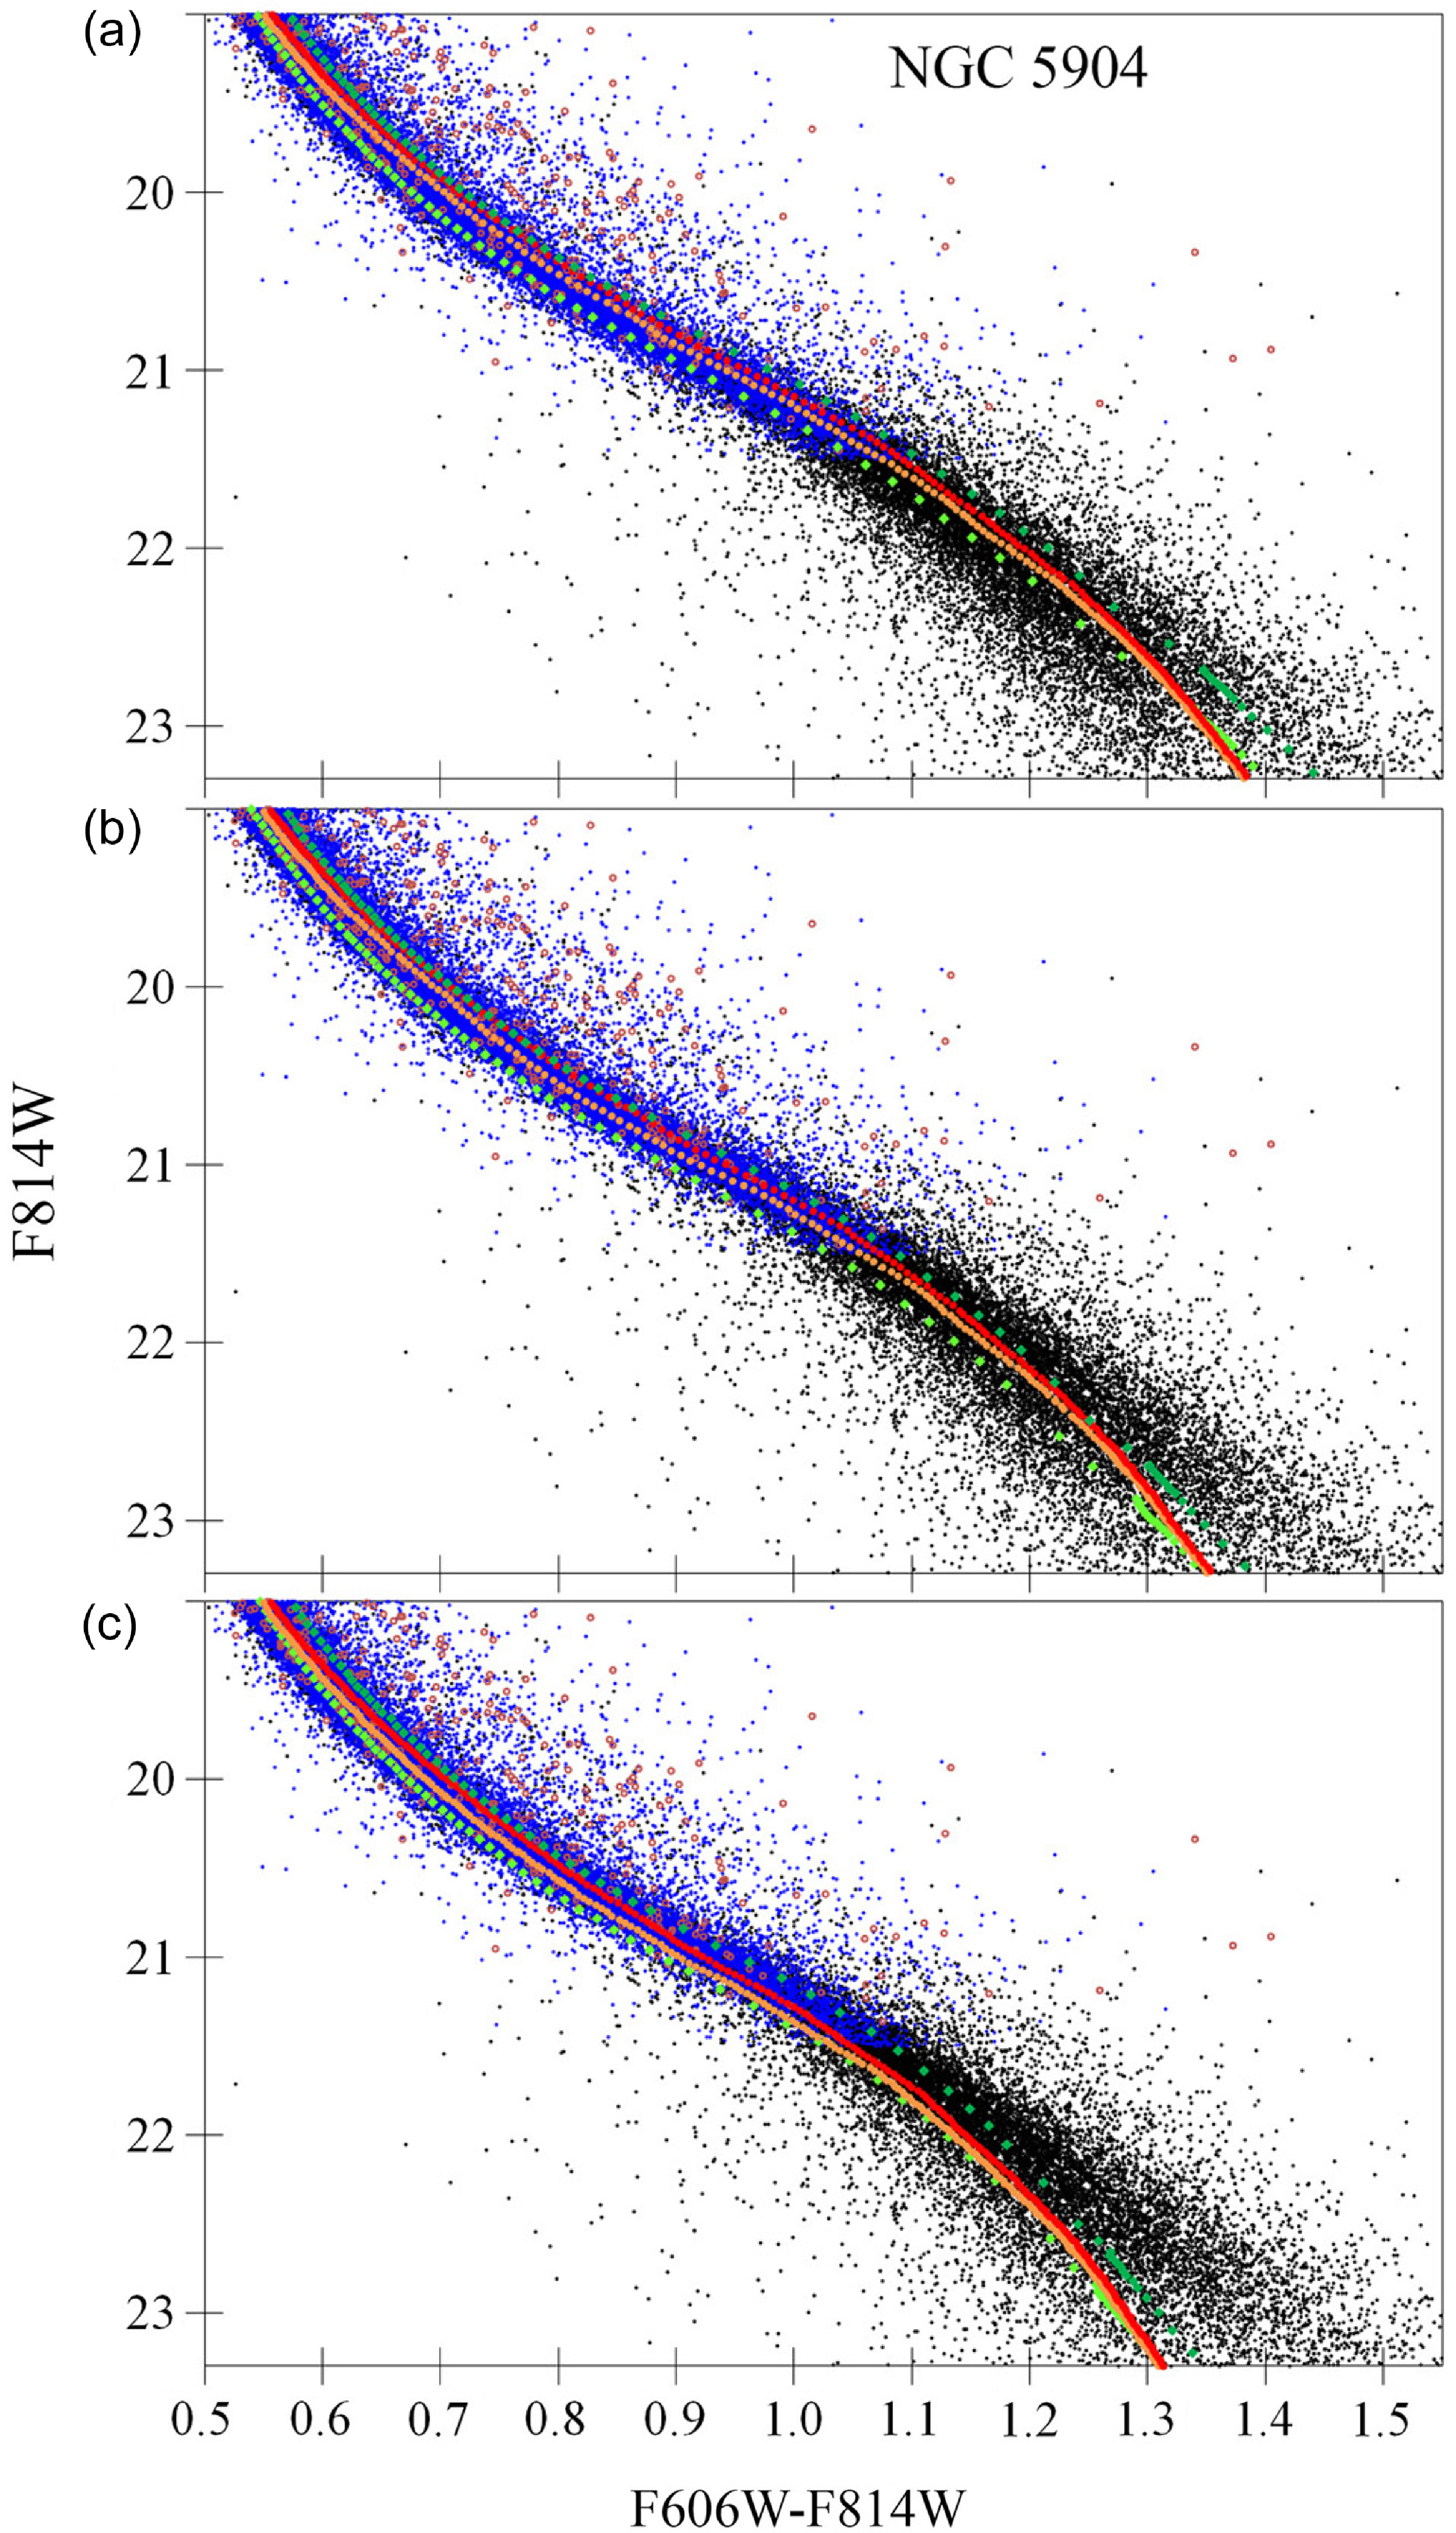


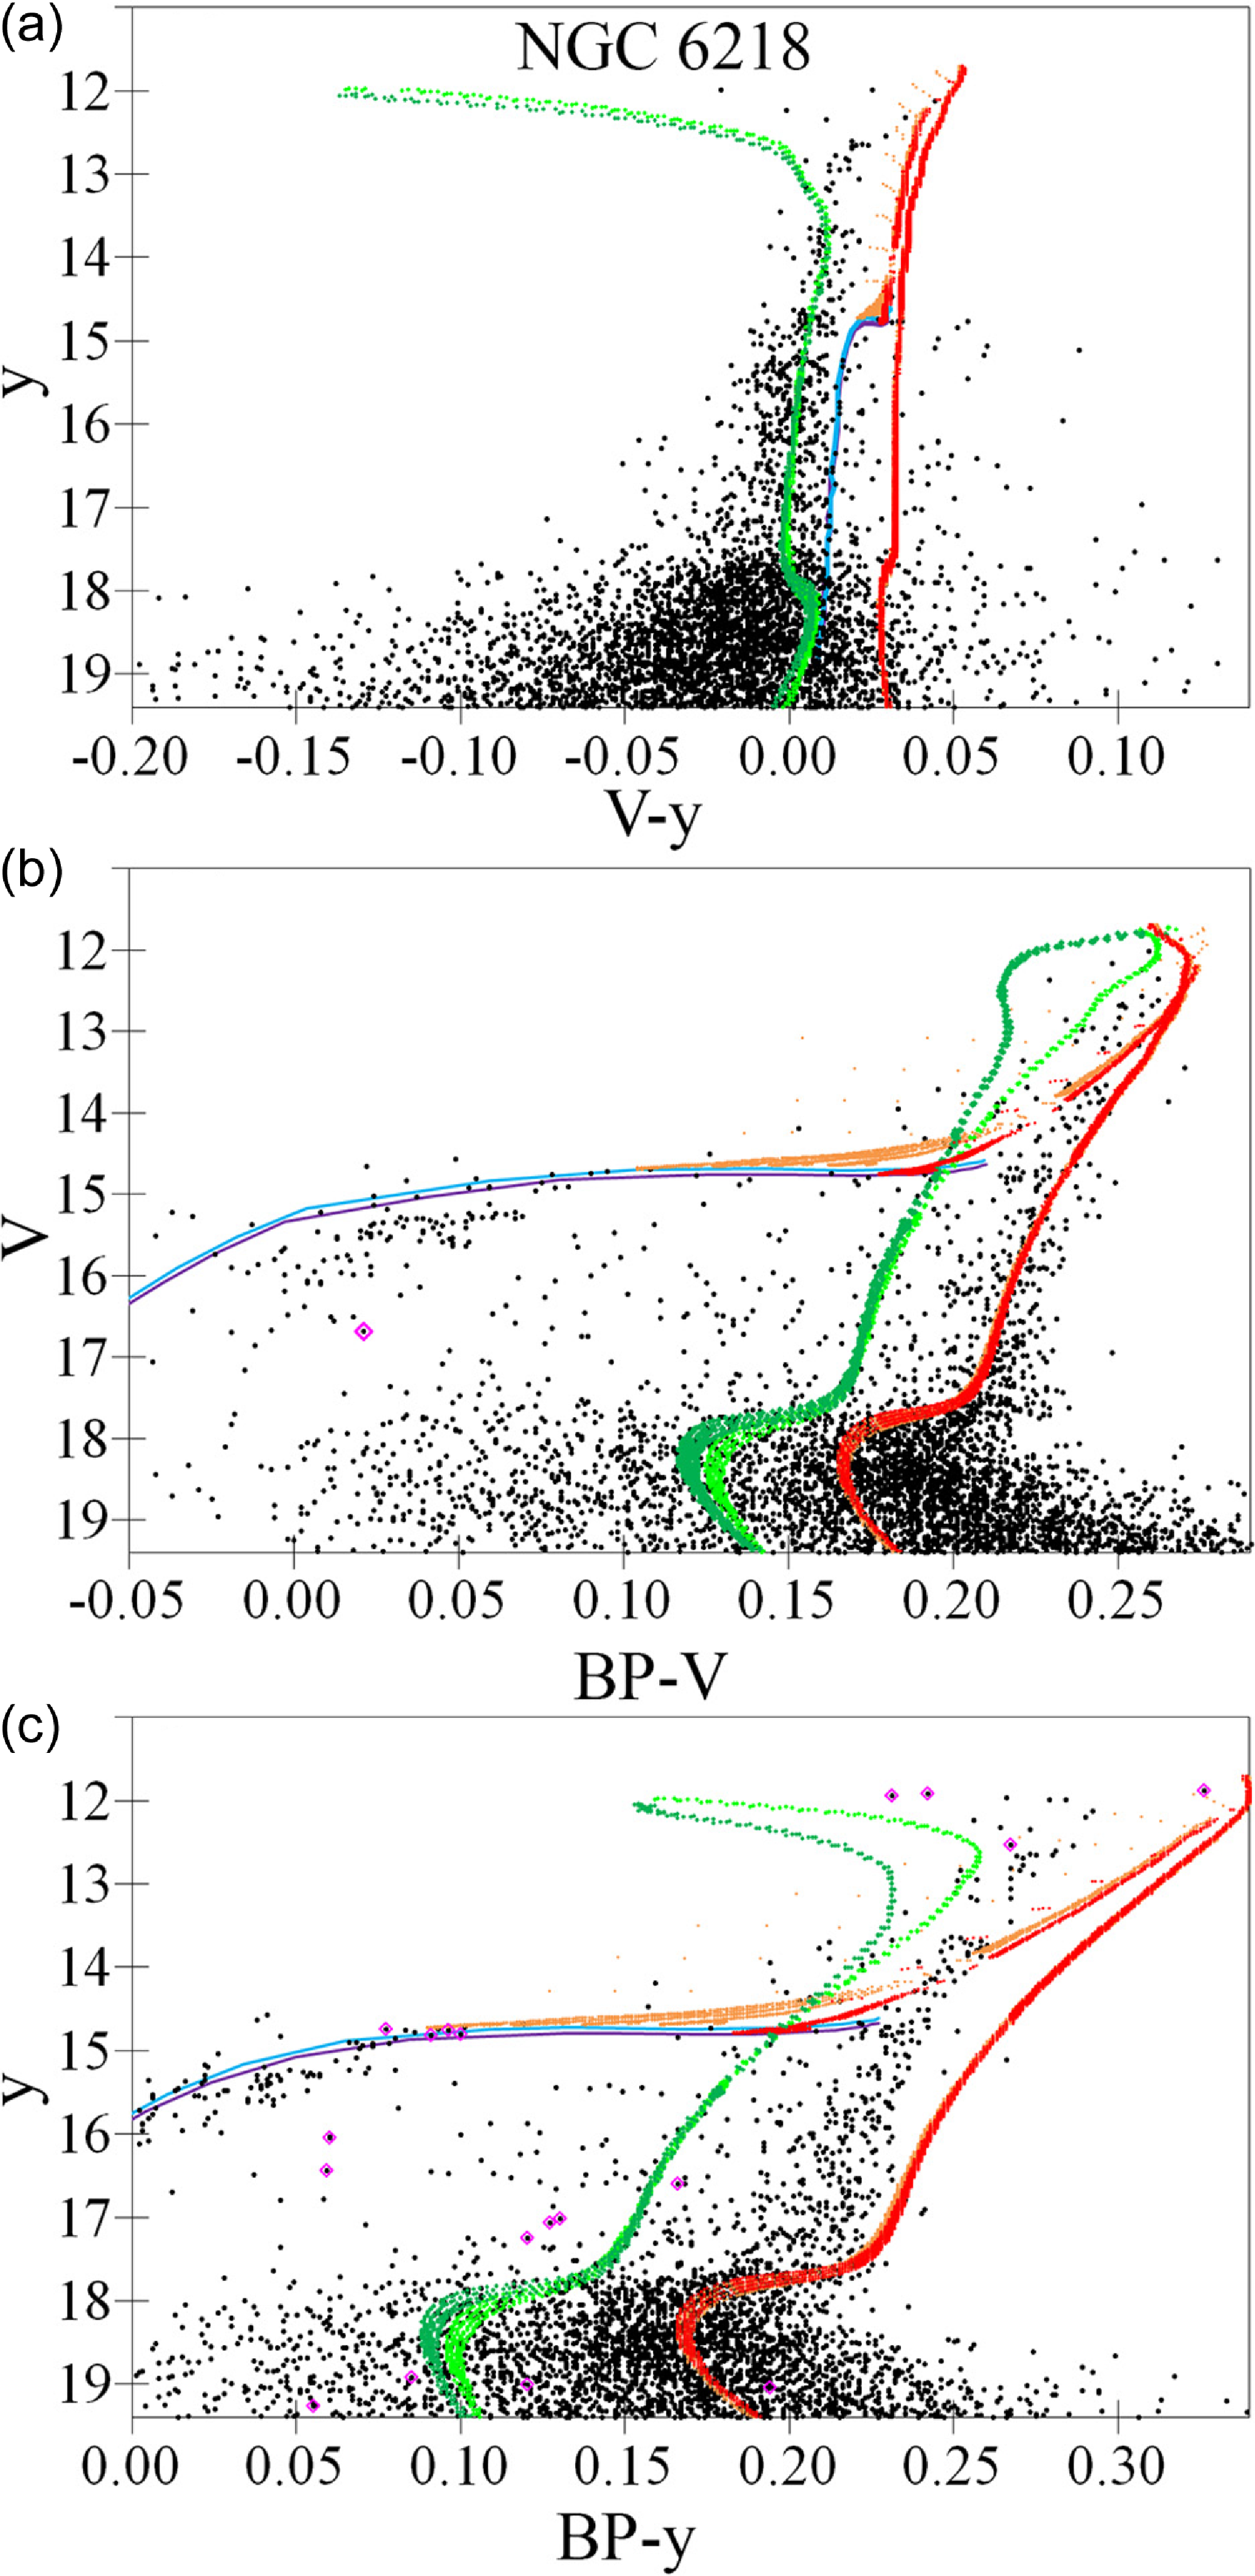


 Open access