





1 Introduction
Multiple-choice items have been a mainstay of educational and psychological assessments for nearly a century (Gierl et al., Reference Gierl, Bulut, Guo and Zhang2017). While single-answer multiple-choice (SAMC) items gained early popularity due to their simplicity and efficiency, they possess inherent limitations in assessing partial knowledge. The all-or-nothing response format of SAMC items is not conducive to partial credit (Bush, Reference Bush2001; Cronbach, Reference Cronbach1941), restricting researchers’ insights into a student’s reasoning. It is difficult to determine whether respondents have partially narrowed down the options or fundamentally lack understanding (Mobalegh & Barati, Reference Mobalegh and Barati2012; Parker et al., Reference Parker, Anderson, Heidemann, Merrill, Merritt, Richmond and Urban-Lurain2012).
To overcome these limitations, innovative item formats like multiple response (MR) items have been developed to capture more nuanced data on respondents’ knowledge. MR items allow respondents to select multiple options, providing richer, more detailed data (Betts et al., Reference Betts, Muntean, Kim and Kao2022; Duncan & Milton, Reference Duncan and Milton1978). The raw response data collected from MR items, known as response combinations (RCs), are also referred to as response patterns or multiple responses (Betts et al., Reference Betts, Muntean, Kim and Kao2022; Muntean & Betts, Reference Muntean and Betts2015). These RCs are defined as the data generated from various combinations of the selected options. They provide a more accurate differentiation of respondents’ latent abilities by capturing partial knowledge (Hsu et al., Reference Hsu, Moss and Khampalikit1984; Pomplun & Omar, Reference Pomplun and Omar1997). These advantages have led to the widespread incorporation of MR items into various assessments, including the Programme for International Student Assessment (PISA), Trends in International Mathematics and Science Study (TIMSS), International English Language Testing System (IELTS), and Graduate Record Examinations (GRE) (Emmerich et al., Reference Emmerich, Enright, Rock and Tucker1991; Rustanto et al., Reference Rustanto, Suciati and Prayitno2023; Suvorov & Li, Reference Suvorov and Li2023).
Despite these benefits, MR items present several analytical challenges. Current analysis approaches based on scoring methods often overlook subtle ability differences indicated by distinct RCs when they lead to identical scores, and they also disregard the information provided by different options. Existing Item Response Theory (IRT) models often struggle to handle the complexity of MR data. These IRT models typically rely on modeling compressed scores (see Section 3), which can lead to a potential loss of valuable information. Furthermore, the diverse range of MR item formats (see Section 2), each with its unique sets of RCs, complicates straightforward comparison and analysis (Schmidt et al., Reference Schmidt, Raupach, Wiegand, Herrmann and Kanzow2022). Finally, local dependencies among options are a common but frequently overlooked feature of MR items (Albanese & Sabers, Reference Albanese and Sabers1988; Bauer et al., Reference Bauer, Holzer, Kopp and Fischer2011; Frisbie & Druva, Reference Frisbie and Druva1986; Smith et al., Reference Smith, Eaton, White Brahmia, Olsho, Zimmerman and Boudreaux2022). Particularly, neglecting such local dependence may result in biased estimates of both item parameters and respondent abilities, as well as an overestimation of test reliability (Pomplun & Omar, Reference Pomplun and Omar1997; Sireci et al., Reference Sireci, Thissen and Wainer1991; DeMars, Reference DeMars2006).
This study introduces a novel psychometric model framework designed to leverage the richness of RC data in MR items. The model overcomes the restrictive nature of traditional scoring methods and the limitations of existing IRT approaches by directly modeling RC data, accounting for local dependencies within items, and accommodating diverse MR item formats. This approach aims to provide more accurate estimates of respondents’ latent abilities and enable a more comprehensive analysis of item characteristics.
The remainder of this paper is organized as follows. Section 2 introduces three common MR item formats and highlights their similarities and differences. Section 3 outlines three scoring methods for MR items and illustrates the impact of different MR item types and scoring methods on the collected data and resulting scores using an example. Section 4 proposes a novel Multiple Response Model (MRM) framework and describes its Bayesian parameter estimation. An empirical study is presented in Section 5, where we administered an MR test based on middle school physics concepts related to light phenomena, demonstrating the advantages of the proposed method in analyzing MR items. Section 6 presents four simulation studies designed to evaluate the parameter estimation performance and robustness of the proposed and traditional models across a wide range of test scenarios. Finally, Section 7 concludes with remarks and a discussion of limitations and future research directions. Important abbreviations employed in this paper are listed in Appendix Table A1.
2 Types of multiple response items
Based on their instructions and the resultant RCs, MR items can be classified into three primary types: multiple true-false (MTF) items, conventional multiple-select (CMS) items, and select-N items. Each MR item encompasses O options, and contingent upon the item type, these options can be merged to generate X possible RCs.
Multiple true-false items: MTF items present multiple options within a single item, each requiring a true or false judgment (Cronbach, Reference Cronbach1939). Typically containing four to six options, MTF items allow any number of correct options. Figure 1 shows an MTF item from the PISA 2012 mathematics test sample (OECD, 2013), which includes four options. Respondents mark each option as either true or false, resulting in $X={2}^O=16$
possible RCs. The correct answer to this item is that all four options are false. MTF items allow for the possibility that all options are selected as incorrect. Hubbard et al. (Reference Hubbard, Potts and Couch2017) noted that MTF items require students to evaluate each option independently rather than simply recognizing a correct answer from a list, which can encourage deeper learning strategies akin to those promoted by free-response questions, making MTF items a valuable alternative to SAMC items.
$X={2}^O=16$
possible RCs. The correct answer to this item is that all four options are false. MTF items allow for the possibility that all options are selected as incorrect. Hubbard et al. (Reference Hubbard, Potts and Couch2017) noted that MTF items require students to evaluate each option independently rather than simply recognizing a correct answer from a list, which can encourage deeper learning strategies akin to those promoted by free-response questions, making MTF items a valuable alternative to SAMC items.
An MTF example item from the PISA 2012 mathematics assessment.

Conventional multiple-select items: CMS items, also referred to as select-all-that-apply items, require respondents to select all correct options while leaving incorrect ones unmarked, making them the most prevalent MR format (Schmidt et al., Reference Schmidt, Raupach, Wiegand, Herrmann and Kanzow2021). In contrast to MTF items, CMS items typically exclude the all-zero RC offering $X={2}^O-1$
possible RCs. For example, Figure 2 shows a National Council Licensure Examination for Registered Nurses (NCLEX-RN) practice sample item. This CMS item presenting six options requires respondents to identify only the correct options, resulting in
$X={2}^O-1$
possible RCs. For example, Figure 2 shows a National Council Licensure Examination for Registered Nurses (NCLEX-RN) practice sample item. This CMS item presenting six options requires respondents to identify only the correct options, resulting in ${2}^6-1=63$
possible RCs. CMS is structurally similar to SAMC, but the allowance of multiple selections expands the response space (Muckle et al., Reference Muckle, Becker and Wu2011), and it is less prone to “acquiescence bias” (the tendency to agree) than MTF items (Cronbach, Reference Cronbach1941).
${2}^6-1=63$
possible RCs. CMS is structurally similar to SAMC, but the allowance of multiple selections expands the response space (Muckle et al., Reference Muckle, Becker and Wu2011), and it is less prone to “acquiescence bias” (the tendency to agree) than MTF items (Cronbach, Reference Cronbach1941).
A CMS example item from the NCLEX-RN practice test.

Select-N items: Also known as pick-N items, they are a variant of CMS items where respondents are informed of the exact number of correct options ( $T$
) to select (Bauer et al., Reference Bauer, Holzer, Kopp and Fischer2011; Schmidt et al., Reference Schmidt, Raupach, Wiegand, Herrmann and Kanzow2022; Schmittlein, Reference Schmittlein1984). Figure 3 presents a select-N item of the 2024 Taiwan General Scholastic Ability Test (GSAT), with five options and three correct answers, and respondents must select precisely three options, yielding
$T$
) to select (Bauer et al., Reference Bauer, Holzer, Kopp and Fischer2011; Schmidt et al., Reference Schmidt, Raupach, Wiegand, Herrmann and Kanzow2022; Schmittlein, Reference Schmittlein1984). Figure 3 presents a select-N item of the 2024 Taiwan General Scholastic Ability Test (GSAT), with five options and three correct answers, and respondents must select precisely three options, yielding $X={C}_O^T={C}_5^3=10$
possible RCs. This structure simplifies the response process and helps lower the cognitive load on respondents as the number of options increases.
$X={C}_O^T={C}_5^3=10$
possible RCs. This structure simplifies the response process and helps lower the cognitive load on respondents as the number of options increases.
A Select-N example item from the GSAT 2024.

3 Scoring methods for multiple response items
MR items inherently generate significantly more RCs than SAMC items, which substantially increases the complexity of scoring. Consequently, researchers have identified over 40 distinct scoring methods for MR items (Kanzow et al., Reference Kanzow, Schmidt, Herrmann, Wassmann, Wiegand and Raupach2023; Schmidt et al., Reference Schmidt, Raupach, Wiegand, Herrmann and Kanzow2021, Reference Schmidt, Raupach, Wiegand, Herrmann and Kanzow2022). These diverse methods primarily aim to compress RC data into either dichotomous or polytomous scores, which are then utilized for calculating overall test scores or estimating latent abilities. This article introduces three commonly used scoring methods that represent distinct points on a spectrum of scoring stringency: from strict, to moderate, to lenient.
Dichotomous scoring (DS): This method serves as a representative of the strictest scoring approach. It is the most demanding scoring method, where respondents receive full credit (typically designated as “1”) only if they answer all options correctly. If any option is incorrect, no points are awarded (Kolstad et al., Reference Kolstad, Briggs, Bryant and Kolstad1983; Lahner et al., Reference Lahner, Lörwald, Bauer, Nouns, Krebs, Guttormsen, Fischer and Huwendiek2018). This “all-or-nothing” approach completely disregards partial knowledge. As the number of options per item increases, the scoring becomes even more demanding. While simple to implement and commonly used, this method overlooks partial understanding and its stringency escalates with the increase in item options.
Ripkey scoring (RS): Representing a moderate, or middle-ground, approach, this scoring method is commonly applied to CMS and select-N items (Ripkey et al., Reference Ripkey, Case and Swanson1996). Each correct selection is awarded $\frac{1}{T}$
point, and incorrect selections are not penalized. However, a crucial caveat is that if the number of options selected exceeds the number of correct answers, the score for that item is zero. Unlike DS, RS allows for partial credit but introduces a penalty for over-selection, thus balancing the recognition of partial knowledge with a demand for response precision.
$\frac{1}{T}$
point, and incorrect selections are not penalized. However, a crucial caveat is that if the number of options selected exceeds the number of correct answers, the score for that item is zero. Unlike DS, RS allows for partial credit but introduces a penalty for over-selection, thus balancing the recognition of partial knowledge with a demand for response precision.
Partial scoring (PS): This method is representative of the most lenient approach and allows for the greatest number of distinct score levels. Also known as the MTF method or true/false testlet, PS is a commonly employed method for MTF and CMS items, awarding $\frac{1}{O}$
for each correct response. It is more forgiving than the other methods because it does not penalize incorrect answers. However, this leniency can incentivize random guessing, as respondents face no penalty for over-selecting options.
$\frac{1}{O}$
for each correct response. It is more forgiving than the other methods because it does not penalize incorrect answers. However, this leniency can incentivize random guessing, as respondents face no penalty for over-selecting options.
To illustrate the impact of item type and scoring method on scoring outcomes, consider a four-option MR item with options C and D as correct. Table 1 presents the valid RCs and their corresponding scores under DS, RS, and PS. For MTF, 1/0 denotes true/false; for CMS and select-N, it denotes selected/not selected. For example, the RC[0,0,0,1] means only option D is endorsed, which yields a score of 0 under DS, 1/2 under RS, and 3/4 under PS. After compression, this item produces two distinct score levels under DS, three under RS, and five under PS (with select-N typically yielding three under PS). These compressed scores can then be analyzed with standard dichotomous or polytomous IRT models.
Response combinations and corresponding scores for MR items (four-option item).

Table 1 Long description
The table has five columns: Number, Response combinations, Dichotomous scoring, Ripkey scoring, and Partial scoring. From top to bottom: Row 1, Number 1, Response 0000 superscript a, scores 0, 0, one half. Row 2, Number 2, Response 1000 superscript a, b, scores 0, 0, one fourth. Row 3, Number 3, Response 0100 superscript a, b, scores 0, 0, one fourth. Row 4, Number 4, Response 0010 superscript a, b, scores 0, one half, three fourths. Row 5, Number 5, Response 0001 superscript a, b, scores 0, one half, three fourths. Row 6, Number 6, Response 1100 superscript a, b, c, scores 0, 0, 0. Row 7, Number 7, Response 1010 superscript a, b, c, scores 0, one half, one half. Row 8, Number 8, Response 1001 superscript a, b, c, scores 0, one half, one half. Row 9, Number 9, Response 0110 superscript a, b, c, scores 0, one half, one half. Row 10, Number 10, Response 0101 superscript a, b, c, scores 0, one half, one half. Row 11, Number 11, Response 0011 superscript a, b, c, scores 1, 1, 1; all values are bolded, indicating the fully correct response. Row 12, Number 12, Response 0111 superscript a, b, scores 0, 0, three fourths. Row 13, Number 13, Response 1011 superscript a, b, scores 0, 0, three fourths. Row 14, Number 14, Response 1101 superscript a, b, scores 0, 0, one fourth. Row 15, Number 15, Response 1110 superscript a, b, scores 0, 0, one fourth. Row 16, Number 16, Response 1111 superscript a, b, scores 0, 0, one half. The note below the table explains that the total score is 1, and defines superscripts: a for multiple true-false, b for conventional multiple-select, c for select-N. The bolded row is the only fully correct response.
Note: The total score of this item is assumed to be 1. Multiple true-false includes all response combinations, denoted as a; conventional multiple-select excludes the response combination where no options are selected, denoted as b; and select-N includes only response combinations where the number of selected options matches the number of correct options, denoted as c. The response combination shown in bold represents the fully correct response.
4 Multiple response model framework
For SAMC items, option-level IRT models, such as the nominal response model (NRM; Bock, Reference Bock, van der Linden and Hambleton1997) and the 3PL nested logit model (Suh & Bolt, Reference Suh and Bolt2010), have been established to provide superior performance over simple dichotomous scoring (Kim, Reference Kim2006; Thissen & Cai, Reference Thissen and Cai2010). In contrast, option-level methods for MR items remain underdeveloped. Traditional score-based approaches typically compress RCs into dichotomous or polychotomous scores, thereby discarding information on option-specific effects (Verbić, Reference Verbić2012). Furthermore, existing optimized modeling strategies face significant limitations. First, treating each option as an independent dichotomous item fails to account for local dependence within an item and proves unsuitable for constrained formats such as select-N (Dudley, Reference Dudley2006). Second, the approach of collapsing dependent options into unordered categories for analysis with the NRM requires prior identification of dependencies, obscures individual option effects, and leads to parameter proliferation as the number of options increases (Smith et al., Reference Smith, Eaton, White Brahmia, Olsho, Zimmerman and Boudreaux2022). To address these problems, this paper introduces the MRM and the MRM with Inter-option Local Dependencies (MRM-LD), specifically developed to directly estimate the probabilities of all possible RCs for an item. Without substantially increasing model complexity, these models both account for the unique contribution of each option to item responses and quantify the local dependencies among options within an item, thereby better preserving the information provided by RC data.
4.1 The multiple response model
The MRM is grounded in the divide-by-total model family (Bolt et al., Reference Bolt, Cohen and Wollack2001; Thissen & Steinberg, Reference Thissen and Steinberg1986), which calculates the response probability of an RC based on the ratio of exponential terms, while being specifically tailored to accommodate RC data from various subtypes of MR items. To formalize the MRM, we define a design matrix ${\boldsymbol{Z}}_j$
that represents all possible RCs for item
${\boldsymbol{Z}}_j$
that represents all possible RCs for item $j$
. Each element
$j$
. Each element ${Z}_{jxo}$
indicates the status of option
${Z}_{jxo}$
indicates the status of option $o$
in RC
$o$
in RC $x$
: for MTF items,
$x$
: for MTF items, ${Z}_{jxo}=1$
means option
${Z}_{jxo}=1$
means option $o$
is endorsed as true, and
$o$
is endorsed as true, and ${Z}_{jxo}=0$
as false; for CMS and select-N items,
${Z}_{jxo}=0$
as false; for CMS and select-N items, ${Z}_{jxo}=1$
means option
${Z}_{jxo}=1$
means option $o$
is selected, and
$o$
is selected, and ${Z}_{jxo}=0$
otherwise. The structure of
${Z}_{jxo}=0$
otherwise. The structure of ${\boldsymbol{Z}}_j$
varies across item types due to differing constraints on permissible RCs. Table 2 presents the
${\boldsymbol{Z}}_j$
varies across item types due to differing constraints on permissible RCs. Table 2 presents the ${\boldsymbol{Z}}_j$
matrices for four-option MTF, CMS, and select-N items with two correct options, which accommodate 16, 15, and 6 unique RCs, respectively. For example, RC[1,1,0,0] corresponds to endorsing the first two options as true in an MTF item (Table 2) or selecting the first two options in CMS and select-N items (Table 2).
${\boldsymbol{Z}}_j$
matrices for four-option MTF, CMS, and select-N items with two correct options, which accommodate 16, 15, and 6 unique RCs, respectively. For example, RC[1,1,0,0] corresponds to endorsing the first two options as true in an MTF item (Table 2) or selecting the first two options in CMS and select-N items (Table 2). ${\boldsymbol{Z}}_j$
Matrix for four-option MTF items,
${\boldsymbol{Z}}_j$
Matrix for four-option MTF items, ${\boldsymbol{Z}}_j$
matrix for four-option CMS items, and
${\boldsymbol{Z}}_j$
matrix for four-option CMS items, and ${\boldsymbol{Z}}_j$
Matrix for four-option MR items across different types.
${\boldsymbol{Z}}_j$
Matrix for four-option MR items across different types.
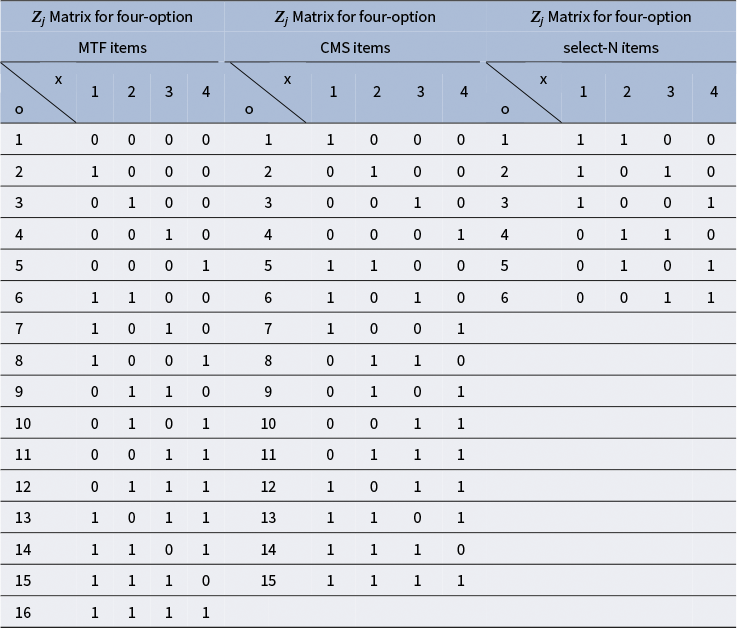
Table 2 Long description
The table consists of 16 rows, each labeled 1 to 16, representing item numbers. Columns are divided into three main groups. The first group, labeled Z sub j matrix for four-option M T F items, has columns o x, 1, 2, 3, 4. The second group, labeled Z sub j matrix for four-option C M S items, has columns o x, 1, 2, 3, 4, with o x spanning two columns. The third group, labeled Z sub j matrix for four-option select-N items, has columns o x, 1, 2, 3, 4. For each item, binary values (0 or 1) are listed under each option. For example, in row 1, M T F options are 0, 0, 0, 0; C M S options are 1, 1, 0, 0, 0; select-N options are 1, 1, 1, 0, 0. Some cells in the select-N group are blank for items 7 to 15, and all are blank for item 16. The table allows comparison of response patterns across item types and options.
The MRM defines the probability of choosing a specific RC as the ratio of the attractiveness of that RC to the sum of the attractiveness values across all ${X}_j$
possible RCs. The probability that respondent
${X}_j$
possible RCs. The probability that respondent $i$
, with latent ability
$i$
, with latent ability ${\theta}_i$
, selects RC
${\theta}_i$
, selects RC $x$
for item
$x$
for item $j$
is given by the Response Combination Probability Function (RCPF):
$j$
is given by the Response Combination Probability Function (RCPF):
 $$\begin{align}P\left({Y}_{ij}=x|{\theta}_i,{\boldsymbol{a}}_j,{\boldsymbol{d}}_j\right)=\frac{\mathit{\exp}\left({h}_{ij x}\right)}{\sum \limits_{m=1}^{X_j}\mathit{\exp}\left({h}_{ij m}\right)}\end{align}$$
where the term ${h}_{ijx}$
represents the total attractiveness of RC
${h}_{ijx}$
represents the total attractiveness of RC $x$
. This total attractiveness is modeled as a linear combination of the attractiveness of its constituent options:
$x$
. This total attractiveness is modeled as a linear combination of the attractiveness of its constituent options:
 $$\begin{align}{h}_{ijx}=\sum \limits_{O=1}^{O_j}{Z}_{jxo}{h}_{ijo}^{\prime }\end{align}$$
Here, the binary element ${Z}_{jxo}$
from the design matrix acts as a selector, determining which options contribute to the attractiveness of RC
${Z}_{jxo}$
from the design matrix acts as a selector, determining which options contribute to the attractiveness of RC $x$
. The attractiveness of each individual option,
$x$
. The attractiveness of each individual option, ${h}_{ijo}^{\prime }$
, is in turn modeled as a linear function of the respondent’s latent ability:
${h}_{ijo}^{\prime }$
, is in turn modeled as a linear function of the respondent’s latent ability:
 $$\begin{align}{h}_{ijo}^{\prime }={a}_{jo}{\theta}_i+{d}_{jo}\end{align}$$
By substituting Formulas (2) and (3) into Formula (1), the full RCPF expression for the MRM is obtained:
 $$\begin{align}P\left({Y}_{ij}=x|{\theta}_i,{\boldsymbol{a}}_j,{\boldsymbol{d}}_j\right)=\frac{\mathit{\exp}\left(\sum \limits_{o=1}^{O_j}{Z}_{jxo}\left({a}_{jo}{\theta}_i+{d}_{jo}\right)\right)}{\sum \limits_{m=1}^{X_j}\mathit{\exp}\left(\sum \limits_{o=1}^{O_j}{Z}_{jmo}\left({a}_{jo}{\theta}_i+{d}_{jo}\right)\right)}\end{align}$$
In this model, ${a}_{jo}$
is the slope parameter for option
${a}_{jo}$
is the slope parameter for option $o$
of item
$o$
of item $j$
. A positive
$j$
. A positive ${a}_{jo}$
indicates a correct option, as its attractiveness increases with higher levels of
${a}_{jo}$
indicates a correct option, as its attractiveness increases with higher levels of ${\theta}_i$
. Conversely, a negative
${\theta}_i$
. Conversely, a negative ${a}_{jo}$
signifies an incorrect option, whose attractiveness decreases as
${a}_{jo}$
signifies an incorrect option, whose attractiveness decreases as ${\theta}_i$
increases. The parameter
${\theta}_i$
increases. The parameter ${d}_{jo}$
is the intercept parameter, representing the baseline attractiveness of option
${d}_{jo}$
is the intercept parameter, representing the baseline attractiveness of option $o$
when
$o$
when ${\theta}_i=0$
.
${\theta}_i=0$
.
A specific consideration for model identifiability arises with select-N items. In this format, every valid RC consists of exactly T selected options. This structural constraint leads to a potential identifiability issue because if a constant value were added to the attractiveness of every individual option, the total attractiveness of every valid RC would increase by an identical amount, leaving the choice probabilities unchanged. This makes a unique parameter solution impossible without further constraints. Therefore, to ensure model identifiability for select-N items, we impose the sum-to-zero constraints: $\sum _{o=1}^{O_j}{a}_{jo}=0\kern0.1em$
and
$\sum _{o=1}^{O_j}{a}_{jo}=0\kern0.1em$
and $\sum _{o=1}^{O_j}{d}_{jo}=0\kern0.1em$
. Consequently, one MTF or CMS item requires the estimation of
$\sum _{o=1}^{O_j}{d}_{jo}=0\kern0.1em$
. Consequently, one MTF or CMS item requires the estimation of ${O}_j$
slope and
${O}_j$
slope and ${O}_j$
intercept parameters (
${O}_j$
intercept parameters ( $2{O}_j$
total), whereas select-N items require
$2{O}_j$
total), whereas select-N items require ${O}_j-1$
slope and
${O}_j-1$
slope and ${O}_j-1$
intercept parameters (
${O}_j-1$
intercept parameters ( $2\left({O}_j-1\right)$
total).
$2\left({O}_j-1\right)$
total).
4.2 Incorporating local dependencies between options
In the MRM, the attractiveness of options is primarily determined by the respondent’s latent ability ${\theta}_i$
. However, beyond this latent ability, local dependencies can naturally exist among options within the same item in MR items (Pomplun & Omar, Reference Pomplun and Omar1997; Verbić, Reference Verbić2012). These dependencies are not related to the respondent’s ability but rather reflect specific interactions between the respondent and the item, arising from the common stimulus of the item stem and knowledge within the item (Beiting-Parrish et al., Reference Beiting-Parrish, Verkuilen, McCluskey, Everson, Wladis, Wiberg, Molenaar, González, Böckenholt and Kim2021). Motivated by the IRT testlet models (Li et al., Reference Li, Bolt and Fu2006, Reference Li, Li and Wang2010; Wang et al., Reference Wang, Bradlow and Wainer2002; Kang et al., Reference Kang, Han, Kim and Kao2022), we propose an extension to the MRM, termed the MRM-LD. The MRM-LD integrates these local dependencies by adding a term that represents person–item interactions into the definition of option attractiveness. This additional term accounts for specific abilities (Li, Reference Li2017) that may influence the respondent’s choice, separate from their general latent ability. The updated definition of attractiveness in the MRM-LD is shown in Formula (5), and the corresponding RCPF is provided in Formula (6):
${\theta}_i$
. However, beyond this latent ability, local dependencies can naturally exist among options within the same item in MR items (Pomplun & Omar, Reference Pomplun and Omar1997; Verbić, Reference Verbić2012). These dependencies are not related to the respondent’s ability but rather reflect specific interactions between the respondent and the item, arising from the common stimulus of the item stem and knowledge within the item (Beiting-Parrish et al., Reference Beiting-Parrish, Verkuilen, McCluskey, Everson, Wladis, Wiberg, Molenaar, González, Böckenholt and Kim2021). Motivated by the IRT testlet models (Li et al., Reference Li, Bolt and Fu2006, Reference Li, Li and Wang2010; Wang et al., Reference Wang, Bradlow and Wainer2002; Kang et al., Reference Kang, Han, Kim and Kao2022), we propose an extension to the MRM, termed the MRM-LD. The MRM-LD integrates these local dependencies by adding a term that represents person–item interactions into the definition of option attractiveness. This additional term accounts for specific abilities (Li, Reference Li2017) that may influence the respondent’s choice, separate from their general latent ability. The updated definition of attractiveness in the MRM-LD is shown in Formula (5), and the corresponding RCPF is provided in Formula (6):
 $$\begin{align}{h}_{ij o}^{\prime }={a}_{jo}{\theta}_i+{d}_{jo}+{W}_{jo}{a}_j^{\ast }{\gamma}_{ij}\end{align}$$
 $$\begin{align}P\left({Y}_{ij}=x|{\theta}_i,{\boldsymbol{a}}_j,{\boldsymbol{d}}_j,{a}_j^{\ast },{\gamma}_{ij}\right)=\frac{\exp \left(\sum \limits_{o=1}^{O_j}\kern0.20em {Z}_{jxo}\left({a}_{jo}{\theta}_i+{d}_{jo}+{W}_{jo}{a}_j^{\ast }{\gamma}_{ij}\right)\right)}{\sum \limits_{m=1}^{X_j}\kern0.20em \exp \left(\sum \limits_{o=1}^{O_j}\kern0.20em {Z}_{jmo}\left({a}_{jo}{\theta}_i+{d}_{jo}+{W}_{jo}{a}_j^{\ast }{\gamma}_{ij}\right)\right)}\end{align}$$
Both ${\gamma}_{ij}$
and
${\gamma}_{ij}$
and ${\theta}_i$
are assumed to follow a standard normal distribution, i.e.,
${\theta}_i$
are assumed to follow a standard normal distribution, i.e., $N\left(0,1\right)$
. Specifically,
$N\left(0,1\right)$
. Specifically, ${\gamma}_{ij}$
represents the respondent’s item-specific ability, reflecting a unique interaction between respondent
${\gamma}_{ij}$
represents the respondent’s item-specific ability, reflecting a unique interaction between respondent $i$
and item
$i$
and item $j$
. Parameter
$j$
. Parameter ${a}_j^{\ast }$
quantifies the magnitude of local dependence within item
${a}_j^{\ast }$
quantifies the magnitude of local dependence within item $j$
and is constrained to interval
$j$
and is constrained to interval $\left(0,+\infty \right]$
. Indicator
$\left(0,+\infty \right]$
. Indicator ${W}_{jo}$
determines the direction of this local dependence: it is set to 1 for correct options and to −1 for incorrect options. This ensures that the effect of local dependence
${W}_{jo}$
determines the direction of this local dependence: it is set to 1 for correct options and to −1 for incorrect options. This ensures that the effect of local dependence ${\gamma}_{ij}$
on option attractiveness depends on both its sign and option correctness: when
${\gamma}_{ij}>0$
, correct options become more attractive and incorrect options less attractive, while when
${\gamma}_{ij}<0$
, the pattern reverses. It is important to note that for select-N items where only one correct answer is selected (
${\gamma}_{ij}$
on option attractiveness depends on both its sign and option correctness: when
${\gamma}_{ij}>0$
, correct options become more attractive and incorrect options less attractive, while when
${\gamma}_{ij}<0$
, the pattern reverses. It is important to note that for select-N items where only one correct answer is selected ( $T=1$
) or only one incorrect answer is excluded (
$T=1$
) or only one incorrect answer is excluded ( $T={O}_j-1$
), the response structure takes the form of SAMC items in which selecting one option automatically excludes all others. Since the SAMC format itself enforces mutual exclusivity among response categories, local dependencies are inherent to this structure and do not require additional local dependence parameters. By setting
$T={O}_j-1$
), the response structure takes the form of SAMC items in which selecting one option automatically excludes all others. Since the SAMC format itself enforces mutual exclusivity among response categories, local dependencies are inherent to this structure and do not require additional local dependence parameters. By setting ${a}_j^{\ast }=0$
, the MRM-LD simplifies to the standard MRM. Furthermore, for these SAMC items (i.e.,
${a}_j^{\ast }=0$
, the MRM-LD simplifies to the standard MRM. Furthermore, for these SAMC items (i.e., $T=1$
or
$T=1$
or ${O}_j-1$
), the MRM is equivalent to the NRM.
${O}_j-1$
), the MRM is equivalent to the NRM.
Figure 4 illustrates the architecture of the MRM-LD. The model’s core principle is that a respondent’s latent ability, ${\theta}_i$
, primarily determines the attractiveness (
${\theta}_i$
, primarily determines the attractiveness ( ${h}_{ijo}^{\prime }$
) of each individual option. For higher-ability respondents, correct options have higher attractiveness values and incorrect options have lower attractiveness values. Building upon this, the respondent’s item-specific ability, represented by
${h}_{ijo}^{\prime }$
) of each individual option. For higher-ability respondents, correct options have higher attractiveness values and incorrect options have lower attractiveness values. Building upon this, the respondent’s item-specific ability, represented by ${\gamma}_{ij}$
, introduces a local dependence effect that further modulates the attractiveness of each option. Finally, the design matrix
${\gamma}_{ij}$
, introduces a local dependence effect that further modulates the attractiveness of each option. Finally, the design matrix ${\boldsymbol{Z}}_j$
is used to aggregate this individual option attractiveness into the overall attractiveness (
${\boldsymbol{Z}}_j$
is used to aggregate this individual option attractiveness into the overall attractiveness ( ${h}_{ijx}$
) for each possible RC. This overall attractiveness, in turn, determines the probability distribution over all possible RCs. The observed response is represented by
${h}_{ijx}$
) for each possible RC. This overall attractiveness, in turn, determines the probability distribution over all possible RCs. The observed response is represented by ${Y}_{ij}$
, which indexes the RC selected by the respondent.
${Y}_{ij}$
, which indexes the RC selected by the respondent.
The MRM-LD model structure diagram.

Figure 4 Long description
At the top center is a single node labeled theta sub i. Arrows extend downward from theta sub i to the uppermost layer of each module, which are arranged horizontally. Each module contains a circle labeled gamma sub i j, pointing right to a row of circles labeled h-prime with subscripts (e.g., h-prime sub i j 1, h-prime sub i j o, h-prime sub i j O j) inside a dashed box. Below, a square labeled z sub j connects upward to the h-prime layer and downward to a second dashed box containing circles labeled h with subscripts (e.g., h sub i j 1, h sub i j x, h sub i j x j). These h nodes are fully connected to the h-prime nodes above. Arrows from the h nodes converge downward to a square labeled Y sub i j, representing the output. This module structure is repeated horizontally for indices 1 through J, with ellipses indicating continuation. All arrows indicate the direction of data flow from theta sub i through gamma, z, h-prime, and h layers to the Y output.
4.3 Bayesian parameter estimation
In this study, both the MRM and MRM-LD models were developed using Stan (Carpenter et al., Reference Carpenter, Gelman, Hoffman, Lee, Goodrich, Betancourt, Brubaker, Guo, Li and Riddell2017) and then compiled and fitted in R through the cmdstanr package (Gabry et al., Reference Gabry, Češnovar, Johnson and Bronder2024). Stan is a probabilistic programming language that utilizes the No-U-Turn Sampler (NUTS) algorithm within the Hamiltonian Monte Carlo (HMC) framework (Hoffman & Gelman, Reference Hoffman and Gelman2014). Following previous research settings (Kim & Bolt, Reference Kim and Bolt2007; Luo & Jiao, Reference Luo and Jiao2018; Natesan et al., Reference Natesan, Nandakumar, Minka and Rubright2016), the prior distributions of the model parameters and responses are set as follows: ${\theta}_i\sim \mathrm{Normal}\left(0,1\right)$
,
${\theta}_i\sim \mathrm{Normal}\left(0,1\right)$
, ${a}_{jo}\sim \mathrm{Normal}\left(0,2\right)$
,
${a}_{jo}\sim \mathrm{Normal}\left(0,2\right)$
, ${d}_{jo}\sim \mathrm{Normal}\left(0,2\right)$
,
${d}_{jo}\sim \mathrm{Normal}\left(0,2\right)$
, ${\gamma}_{ij}\sim \mathrm{Normal}\left(0,1\right)$
,
${\gamma}_{ij}\sim \mathrm{Normal}\left(0,1\right)$
, ${a}_j^{\ast}\sim \mathrm{Lognormal}\left(0,2\right)$
,
${a}_j^{\ast}\sim \mathrm{Lognormal}\left(0,2\right)$
, ${Y}_{ij}\sim \mathrm{Categorical}\left(P\left({Y}_{ij}=x|{\theta}_i,{\boldsymbol{a}}_j,{\boldsymbol{d}}_j,{a}_j^{\ast },{\gamma}_{ij}\right)\right)$
. For select-N items, the following constraints apply:
${Y}_{ij}\sim \mathrm{Categorical}\left(P\left({Y}_{ij}=x|{\theta}_i,{\boldsymbol{a}}_j,{\boldsymbol{d}}_j,{a}_j^{\ast },{\gamma}_{ij}\right)\right)$
. For select-N items, the following constraints apply: $\sum _{o=1}^{O_j}\kern0.1em {a}_{jo}=0,\sum _{o=1}^{O_j}\kern0.1em {d}_{jo}=0$
.
$\sum _{o=1}^{O_j}\kern0.1em {a}_{jo}=0,\sum _{o=1}^{O_j}\kern0.1em {d}_{jo}=0$
.
Thus, the likelihood function for the MRM-LD can be expressed as:
 $$\begin{align}L\left(\boldsymbol{Y}\mid \boldsymbol{\theta}, \boldsymbol{a},\boldsymbol{d},{\boldsymbol{a}}^{\ast},\boldsymbol{\gamma} \right)=\prod \limits_{i=1}^N\kern0.1em \prod \limits_{j=1}^J\kern0.1em \frac{\exp \left(\sum \limits_{o=1}^{O_j}\kern0.20em {Z}_{j,{Y}_{ij},o}\left({a}_{jo}{\theta}_i+{d}_{jo}+{W}_{jo}{a}_j^{\ast }{\gamma}_{ij}\right)\right)}{\sum \limits_{m=1}^{X_j}\kern0.20em \exp \left(\sum \limits_{o=1}^{O_j}\kern0.20em {Z}_{jmo}\left({a}_{jo}{\theta}_i+{d}_{jo}+{W}_{jo}{a}_j^{\ast }{\gamma}_{ij}\right)\right)}\end{align}$$ ${Z}_{j,{Y}_{ij},o}$
specifically refers to the element in
${Z}_{j,{Y}_{ij},o}$
specifically refers to the element in ${\boldsymbol{Z}}_j$
matrix corresponding to this observed response index
${\boldsymbol{Z}}_j$
matrix corresponding to this observed response index ${Y}_{ij}$
. Its value indicates whether option
${Y}_{ij}$
. Its value indicates whether option $o$
was selected (1) or not selected (0) within the specific RC indexed by
$o$
was selected (1) or not selected (0) within the specific RC indexed by ${Y}_{ij}$
. The joint posterior probability of the parameters in the MRM-LD can be expressed as:
${Y}_{ij}$
. The joint posterior probability of the parameters in the MRM-LD can be expressed as:
 $$\begin{align}P\left(\boldsymbol{\theta}, \boldsymbol{a},\boldsymbol{d},{\boldsymbol{a}}^{\ast },\boldsymbol{\gamma} \mid \mathrm{data}\right)\propto L\left(\mathrm{data}\mid \boldsymbol{\theta}, \boldsymbol{a},\boldsymbol{d},{\boldsymbol{a}}^{\ast },\boldsymbol{\gamma} \right)\times P\left(\boldsymbol{\theta} \right)\times P\left(\boldsymbol{a}\right)\times P\left(\boldsymbol{d}\right)\times P\left({\boldsymbol{a}}^{\ast}\right)\times P\left(\boldsymbol{\gamma} \right)\end{align}$$
5 Empirical study
The primary objective of this study is to validate the advantages and practical applicability of the new models in comparison to traditional scoring methods through empirical data analysis, while also offering practical recommendations for theirs implementation. Additionally, this study compares the test performance of three MR item formats—CMS, MTF, and select-N—using the new models to provide empirical evidence for their relative psychometric properties.
5.1 Design
In this study, a set of 16 MR items were developed, each with five options, based on the “Light Phenomena” chapter of eighth-grade physics in Chinese. These items and their options were sourced from the item bank website (https://zujuan.xkw.com) and reviewed by two experienced junior high school physics teachers. Three versions of each item were created: MTF, CMS, and select-N, by modifying the wording of the instructions. Among the 16 items, one item has one correct option, seven items have two correct options, six items have three correct options, and two items have four correct options. The 16 items were divided into two parts, the first eight items and the last eight items, and combined into nine test booklets with different item format pairings (see Table 3). This design ensured anchor item consistency across different item formats; for instance, in test booklets B1, B2, and B3, the first half contains MTF items, making the second half of the booklets comparable. This resulted in nine anchor item combinations. This approach allows the model to estimate parameters that are comparable across items (Betts et al., Reference Betts, Muntean, Kim and Kao2022; Ricker & von Davier, Reference Ricker and von Davier2007).
Empirical study test booklet design.
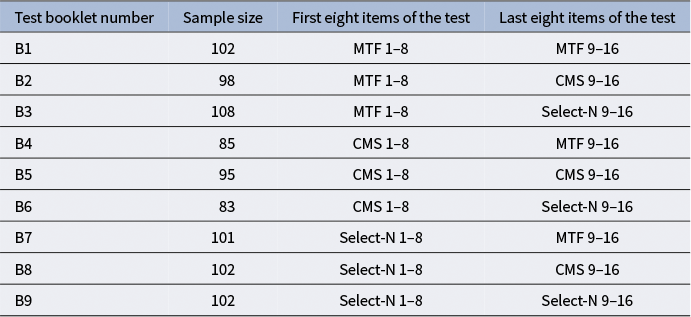
Table 3 Long description
The table has four columns: Test booklet number, Sample size, First eight items of the test, and Last eight items of the test. From top to bottom, booklet B1 has a sample size of 102, first eight items M T F 1 to 8, last eight items M T F 9 to 16. B2: 98, M T F 1 to 8, C M S 9 to 16. B3: 108, M T F 1 to 8, Select-N 9 to 16. B4: 85, C M S 1 to 8, M T F 9 to 16. B5: 95, C M S 1 to 8, C M S 9 to 16. B6: 83, C M S 1 to 8, Select-N 9 to 16. B7: 101, Select-N 1 to 8, M T F 9 to 16. B8: 102, Select-N 1 to 8, C M S 9 to 16. B9: 102, Select-N 1 to 8, Select-N 9 to 16. Each booklet uses a unique combination of item formats (M T F, C M S, Select-N) in the first and last halves of the test.
Note: B1–B9 represent nine test booklets with different combinations of item formats across two halves of the test.
A computerized test was administered to 937 students from 19 classes in the eight grade of a junior high school in China, under the supervision of their teachers. Each student was randomly assigned one of the nine test booklets. Before the test, each student was asked to report their score category (seven ordinal levels: 1 for below 39, 2 for 40–49, 3 for 50–59, 4 for 60–69, 5 for 70–79, 6 for 80–89, and 7 for 90–100) based on their performance in the midterm physics examination, which was administered within one month prior to this test. This information was utilized as a criterion for validation. Since this was a low-stakes test, to prevent estimation bias due to lack of student effort, subjective effort scores on a 10-point (i.e., 1 means least effort and 10 means most effort) item were collected after the test (OECD, 2023). Students who scored 4 or below on the effort scale were excluded, resulting in a final sample size of 876. On average, each item was answered 292 times (SD = 13.3).
Posterior predictive model checks for each model across different MR item types.
Note: Red dashed horizontal lines mark the threshold boundaries at PPP = 0.05 and PPP = 0.95. Red points indicate PPP values outside the 0.05–0.95 acceptable range.

Figure 5 Long description
Starting at the top left, panel a is labeled M R M dash L D, panel b is M R M, panel c is G R M underscore P S, panel d is G R M underscore R S, panel e is G R M underscore D S, panel f is N R M underscore P S, and panel g is N R M underscore R S. Each panel has the y-axis labeled PPP Value from 0.0 to 1.0 and the x-axis labeled Items from 1 to 16. Red dashed horizontal lines at y equals 0.05 and y equals 0.95 mark threshold boundaries. Data points are shown as black squares for M T F, gray circles for C M S, and gray triangles for Select N, connected by lines. Red points indicate PPP values outside the 0.05 to 0.95 range. Most values cluster between the thresholds, but some outliers are present, especially in panels f and g. The legend at the bottom right defines the symbols for item types.
The data were fitted using the new models, MRM and MRM-LD, as well as traditional polytomous models, Graded Response Model (GRM, Samejima, Reference Samejima1968) and NRM. MRM and MRM-LD models were applied to RC data. In contrast, GRM and NRM utilized three distinct types of response data: PS, RS, and DS, forming models such as GRMPS, NRMPS, etc. When using DS data, GRM and NRM are mathematically equivalent; therefore, only the performance of GRMDS is reported. All models were estimated using Stan with two parallel Markov Chain Monte Carlo (MCMC) chains, each with 1,000 samples. To ensure the stability of the sampling, the first 500 samples were discarded. To ensure fair comparisons across models and to align the latent ability in the same direction as the score, the initial value of ${\theta}_i$
for all models was set to the z-score of the total test score under DS, with all other parameters left to be randomly initialized by prior distributions. The convergence of model parameters was evaluated using the potential scale reduction factor (PSRF; Brooks & Gelman, Reference Brooks and Gelman1998). A PSRF value below 1.1 was considered indicating sufficient convergence. In this study, the PSRF of all model parameters was below 1.1, indicating convergence and good mixing of the posterior distribution. All parameter estimates are presented in Supplementary Tables S1–S7.
${\theta}_i$
for all models was set to the z-score of the total test score under DS, with all other parameters left to be randomly initialized by prior distributions. The convergence of model parameters was evaluated using the potential scale reduction factor (PSRF; Brooks & Gelman, Reference Brooks and Gelman1998). A PSRF value below 1.1 was considered indicating sufficient convergence. In this study, the PSRF of all model parameters was below 1.1, indicating convergence and good mixing of the posterior distribution. All parameter estimates are presented in Supplementary Tables S1–S7.
To evaluate model performance, we first assessed absolute fit using Posterior Predictive p-values (PPP) (Gelman et al., Reference Gelman, Meng and Stern1996; Sinharay, Reference Sinharay2005). Relative fit was then compared using the Widely Applicable Information Criterion (WAIC) and Leave-One-Out Cross-Validation (LOO) (Vehtari et al., Reference Vehtari, Gelman and Gabry2015). In addition, we also evaluated measurement precision via marginal IRT reliability (Green et al., Reference Green, Bock, Humphreys, Linn and Reckase1984; Zu & Kyllonen, Reference Zu and Kyllonen2020) and compared test information functions, extending the calculation for MRM and MRM-LD against the GRM and NRM (Lima Passos et al., Reference Lima Passos, Berger and Tan2007; Ostini & Nering, Reference Ostini and Nering2006). Finally, criterion-related validity was examined using Spearman’s rank-order correlation with preliminary physics exam grades. The corresponding computational details for these metrics are presented in Appendix B.
5.2 Empirical study results
5.2.1 Absolute fit
Figure 5 presents the PPP indices for the new models, the MRM-LD and MRM, fitted to the RC data of MR items, as well as for the GRM and NRM fitted to PS, RS, and DS data. The upper and lower red dashed lines in Figure 5 represent the limits of 0.95 and 0.05, respectively. It can be observed that except for the NRM fitted to PS data, where some MTF and CMS items exhibit misfit with PPP values less than 0.05, all other models show no significant discrepancies between model predictions and the data across the MTF, CMS, and select-N items.
5.2.2 Relative fit
Table 4 presents the WAIC and LOO results for the four models across different MR item types. Lower WAIC and LOO values indicate superior model fit. Primarily, across all scenarios, the MRM-LD consistently outperforms the MRM, suggesting that incorporating the local dependence structure in the MRM-LD is crucial for improving the model fit when analyzing MR data. Furthermore, across all data types, the MRM-LD demonstrates the best performance according to both LOO and WAIC values. When compared with the GRM and the NRM, the MRM-LD shows superior performance at all data types. While the GRM and the NRM perform similarly, the GRM slightly outperforms the NRM in most cases.
Results of relative fit indices.
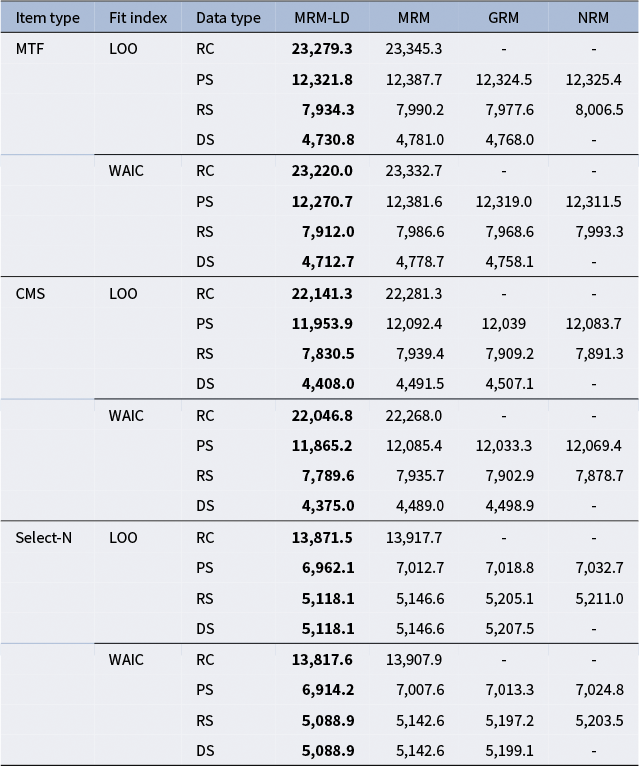
Table 4 Long description
Column headers from left to right are Item type, Fit index, Data type, M R M dash L D, M R M, G R M, N R M. Item types are M T F, C M S, and Select dash N. For each item type, rows are grouped by Fit index L O O or W A I C, then by Data type R C, P S, R S, D S. Within each block, values are listed for each model. Bold values indicate the lowest (best) fit index for that row. For M T F, L O O, R C: M R M dash L D is 23,279.3 (bold), M R M is 23,345.3, G R M and N R M are not available. For P S: M R M dash L D is 12,321.8 (bold), M R M is 12,387.7, G R M is 12,324.5, N R M is 12,325.4. For R S: M R M dash L D is 7,934.3 (bold), M R M is 7,990.2, G R M is 7,977.6, N R M is 8,006.5. For D S: M R M dash L D is 4,730.8 (bold), M R M is 4,781.0, G R M is 4,768.0, N R M is not available. For W A I C, R C: M R M dash L D is 23,220.0 (bold), M R M is 23,332.7, G R M and N R M are not available. For P S: M R M dash L D is 12,270.7 (bold), M R M is 12,381.6, G R M is 12,319.0, N R M is 12,311.5. For R S: M R M dash L D is 7,912.0 (bold), M R M is 7,986.6, G R M is 7,968.6, N R M is 7,993.3. For D S: M R M dash L D is 4,712.7 (bold), M R M is 4,778.7, G R M is 4,758.1, N R M is not available. For C M S, L O O, R C: M R M dash L D is 22,141.3 (bold), M R M is 22,281.3, G R M and N R M are not available. For P S: M R M dash L D is 11,953.9 (bold), M R M is 12,092.4, G R M is 12,039, N R M is 12,083.7. For R S: M R M dash L D is 7,830.5 (bold), M R M is 7,939.4, G R M is 7,909.2, N R M is 7,891.3. For D S: M R M dash L D is 4,408.0 (bold), M R M is 4,491.5, G R M is 4,507.1, N R M is not available. For W A I C, R C: M R M dash L D is 22,046.8 (bold), M R M is 22,268.0, G R M and N R M are not available. For P S: M R M dash L D is 11,865.2 (bold), M R M is 12,085.4, G R M is 12,033.3, N R M is 12,069.4. For R S: M R M dash L D is 7,789.6 (bold), M R M is 7,935.7, G R M is 7,902.9, N R M is 7,878.7. For D S: M R M dash L D is 4,375.0 (bold), M R M is 4,489.0, G R M is 4,498.9, N R M is not available. For Select dash N, L O O, R C: M R M dash L D is 13,871.5 (bold), M R M is 13,917.7, G R M and N R M are not available. For P S: M R M dash L D is 6,962.1 (bold), M R M is 7,012.7, G R M is 7,018.8, N R M is 7,032.7. For R S: M R M dash L D is 5,118.1 (bold), M R M is 5,146.6, G R M is 5,205.1, N R M is 5,211.0. For D S: M R M dash L D is 5,118.1 (bold), M R M is 5,146.6, G R M is 5,207.5, N R M is not available. For W A I C, R C: M R M dash L D is 13,817.6 (bold), M R M is 13,907.9, G R M and N R M are not available. For P S: M R M dash L D is 6,914.2 (bold), M R M is 7,007.6, G R M is 7,013.3, N R M is 7,024.8. For R S: M R M dash L D is 5,088.9 (bold), M R M is 5,142.6, G R M is 5,197.2, N R M is 5,203.5. For D S: M R M dash L D is 5,088.9 (bold), M R M is 5,142.6, G R M is 5,199.1, N R M is not available. Dashes indicate missing values. RC, PS, RS, and DS are response combinations, partial scoring, Ripkey scoring, and dichotomous scoring. Boldface always marks the lowest value per row.
Note: RC, PS, RS, and DS represent four data types: response combinations, partial scoring, Ripkey scoring, and dichotomous scoring, respectively. Boldface indicates the best-fitting model.
Item parameter distributions ( ${a}_{jo}$
and
${a}_{jo}$
and ${d}_{jo}$
) of the MRM-LD for CMS items.
${d}_{jo}$
) of the MRM-LD for CMS items.

Figure 6 Long description
There are 16 panels, each labeled Item 1 through Item 16, arranged in two rows. Each panel contains two vertically stacked plots. The top plot in each panel shows a subscript j o values for five options (option numbers 1 to 5 on the x-axis), with y-axis values ranging from approximately minus 3 to plus 3. Upward triangles represent correct options, downward triangles represent incorrect options. Blue indicates matching direction with p less than 0.05, red indicates mismatched direction with p less than 0.05, and gray indicates p greater than 0.05. Most correct options are blue upward triangles, with one red upward triangle in Item 13. The bottom plot in each panel shows d subscript j o values for the same options, with y-axis values ranging from approximately minus 5 to plus 5, represented by gray circles. The legend at the right explains the triangle orientation, color coding, and statistical significance. The x-axis for all panels is labeled Option Number, and the y-axis is labeled parameter.
5.2.3 Item parameters
The fit indices consistently demonstrate that the MRM-LD is the optimal model for analyzing this real dataset. Given this finding, our subsequent analysis centers on the item parameters estimated by the MRM-LD model. These parameters are detailed in Supplementary Table S1.
Taking CMS items as an example, Figure 6 illustrates the distributions of the estimated slope ( ${a}_{jo}$
) and intercept (
${a}_{jo}$
) and intercept ( ${d}_{jo}$
) parameters from the MRM-LD. Appendix A includes Figures A1 and A2, which present similar distributions for MTF and select-N items, respectively.
${d}_{jo}$
) parameters from the MRM-LD. Appendix A includes Figures A1 and A2, which present similar distributions for MTF and select-N items, respectively.
At the option level, the sign and statistical significance of ${a}_{jo}$
parameter in relation to the predefined answer key (
${a}_{jo}$
parameter in relation to the predefined answer key ( ${W}_{jo}$
) can reveal potential directional inconsistencies. When option
${W}_{jo}$
) can reveal potential directional inconsistencies. When option $o$
for item
$o$
for item $j$
is designated as correct (
$j$
is designated as correct ( ${W}_{jo}=1$
, indicated by an upward triangle in Figure 6), the expected
${W}_{jo}=1$
, indicated by an upward triangle in Figure 6), the expected ${a}_{jo}$
parameter should be positive. Conversely, if it is designated as incorrect (
${a}_{jo}$
parameter should be positive. Conversely, if it is designated as incorrect ( ${W}_{jo}=-1$
, indicated by a downward triangle in Figure 6), the expected
${W}_{jo}=-1$
, indicated by a downward triangle in Figure 6), the expected ${a}_{jo}$
should be negative. A significant
${a}_{jo}$
should be negative. A significant ${a}_{jo}$
parameter whose sign is consistent with the designated answer (i.e., matches the expected direction) is marked in blue. A significant
${a}_{jo}$
parameter whose sign is consistent with the designated answer (i.e., matches the expected direction) is marked in blue. A significant ${a}_{jo}$
parameter whose sign contradicts the intended direction (marked in red) indicates a discrepancy with the specified answer. Options with non-significant
${a}_{jo}$
parameter whose sign contradicts the intended direction (marked in red) indicates a discrepancy with the specified answer. Options with non-significant ${a}_{jo}$
parameters (marked in gray) are considered ambiguous or low-discriminating, suggesting areas for further item optimization.
${a}_{jo}$
parameters (marked in gray) are considered ambiguous or low-discriminating, suggesting areas for further item optimization.
Item characteristic curves of the MRM-LD and GRMPS for MTF, CMS and select-N item (item 5).
Note: Scores calculated using Partial Scoring method (1 point per correctly judged option). For each score level, 1st RC and 2nd RC indicate the most and second-most probable response combinations. Cumulative Probability shows the total probability of all RCs with that score. For MRM-LD, RC probabilities are calculated conditional on ${\gamma}_{ij} = 0$
.
${\gamma}_{ij} = 0$
.

Figure 7 Long description
Starting from the top-left, the first row displays M T F item 5. The left panel shows M R M dash L D response combination characteristic curves, with six plots for scores 0 to 5. Each plot has probability density on the y-axis and latent trait theta on the x-axis. Blue and green lines represent the first and second most probable response combinations, labeled as R C, while the red line shows cumulative probability. For example, score 0 has R C colon 11000, score 1 has R C colon 11100, and score 5 has R C colon 00111. The right panel shows G R M P S category characteristic curves for the same item and scores, with only a red probability line per plot. The second row repeats this structure for C M S item 5, with response combinations such as R C colon 11000 for score 0 and R C colon 00111 for score 5. The third row presents select dash N item 5, with response combinations like R C colon 11010 for score 0 and R C colon 00111 for score 2. Across all panels, the probability curves vary in shape, with cumulative probability generally increasing with higher scores. All axes and labels are precisely transcribed as shown.
Using CMS items as an example, we observe that the vast majority of options (83.75%) align with the theoretically expected direction of the
${a}_{jo}$
parameter with $p<.05$
(i.e., the 95% credible interval of estimates does not include zero). This indicates that for most options, the estimated
$p<.05$
(i.e., the 95% credible interval of estimates does not include zero). This indicates that for most options, the estimated ${a}_{jo}$
parameters are statistically significant and consistent with the intended direction based on the predefined answer key. A smaller proportion (15%) show non-significant
${a}_{jo}$
parameters are statistically significant and consistent with the intended direction based on the predefined answer key. A smaller proportion (15%) show non-significant ${a}_{jo}$
values, indicating potential ambiguity issues in these options. However, a notable contradiction emerged for the second option of item 13. Specifically,
${a}_{jo}$
values, indicating potential ambiguity issues in these options. However, a notable contradiction emerged for the second option of item 13. Specifically, ${a}_{13,2}$
was estimated at 0.69 (
${a}_{13,2}$
was estimated at 0.69 ( $p<.05$
). According to the original item design, the fully correct RC was specified as RC[0,0,0,1,1], meaning option 2 (corresponding to the second position in the vector) was intended to be an incorrect option. Yet, the empirical results indicate that option 2 exhibits a significant positive attraction. This suggests that as a respondent’s latent ability (
$p<.05$
). According to the original item design, the fully correct RC was specified as RC[0,0,0,1,1], meaning option 2 (corresponding to the second position in the vector) was intended to be an incorrect option. Yet, the empirical results indicate that option 2 exhibits a significant positive attraction. This suggests that as a respondent’s latent ability ( ${\theta}_i$
) increases, the probability of selecting this option also increases, which is contrary to the item’s design intention. This specific item will be further analyzed in detail in the next section.
${\theta}_i$
) increases, the probability of selecting this option also increases, which is contrary to the item’s design intention. This specific item will be further analyzed in detail in the next section.
5.2.4 Response combination characteristic curve
Based on Formula (6), response combination characteristic curves (RCCCs) depict how the probability of each RC varies with latent ability, offering a fine-grained view beyond score categories. Figure 7 compares the RCCCs from the MRM-LD with category characteristic curves from GRMPS for item 5 across MTF, CMS, and select-N formats. In the MTF format, dominant RCs “migrate” as ability increases: respondents typically transition from easier RCs, through intermediate ones (e.g., RC[1,1,0,1,0] → RC[1,1,1,1,0]), ultimately to the fully correct RC[0,0,1,1,1]. This progression reveals an implicit difficulty ordering among RCs. Notably, RCCCs demonstrate that among RCs sharing the same score, different RCs dominate at different ability levels. For example, among RCs with a score of 3, RC[1,1,1,1,1] dominates at lower abilities, whereas RC[0,1,1,1,0] dominates at higher abilities. A similar pattern is observed for CMS items, whereas the select-N format, by design, involves fewer RCs and score levels due to its structure. Although the MRM-LD and GRMPS can produce similar probabilities at the score level, only the MRM-LD captures and resolves respondents’ behavior at the detailed RC level.
The potential issue of unexpected direction with option 2 of item 13, as previously noted, is further elucidated by the RCCC analysis. Figure 8 shows that the fully correct RC[0,0,0,1,1] remains below 5% across the ability range, while the partially correct RC[0,1,0,1,1] increases with ability and becomes dominant among high-ability respondents. A closer examination of the item stem and option content clarifies this pattern. The item asks respondents to identify correct statements regarding plane mirror imaging. Option 2 states: “Conducting multiple experiments to obtain multiple sets of data is to reduce errors.” This wording is subtly misleading. While repeating measurements to “reduce error” is appropriate when estimating a fixed quantity, it is less applicable when verifying a general law such as plane mirror imaging; in the latter context, multiple trials primarily serve to increase the reliability of conclusions. High-ability students appear to overgeneralize the “repetition reduces error” principle, leading them to select option 2.
Item characteristic curves of the MRM-LD and GRMPS for CMS item type (item 13).
Note: Scores calculated using Partial Scoring method (1 point per correctly judged option). For each score level, 1st RC and 2nd RC indicate the most and second-most probable response combinations. Cumulative Probability shows the total probability of all RCs with that score. For MRM-LD, RC probabilities are calculated conditional on
${\gamma}_{ij} = 0$
.

Figure 8 Long description
The left panel, titled C M S Item 13 dash Response Combination Characteristic Curves open parenthesis M R M dash L D close parenthesis, displays six plots for scores 0 to 5. Each plot shows three curves: 1st R C in teal, 2nd R C in blue, and Cumulative Probability in red. For score 0, the highest probability is for R C 1 1 1 0 0 at low theta. For score 1, R C 1 1 0 0 0 and R C 1 1 1 1 0 dominate at low theta. For score 2, R C 1 1 0 1 0 and R C 0 1 0 0 0 are most probable. For score 3, R C 0 1 0 1 0 and R C 0 1 0 0 1 peak at moderate theta. For score 4, R C 0 1 0 1 1 and R C 0 0 0 1 0 rise at higher theta. For score 5, R C 0 0 0 1 1 is most probable at high theta. The cumulative probability curve in red increases with score and theta. The right panel, titled C M S Item 13 dash Category Characteristic Curves open parenthesis G R M underscore P S close parenthesis, shows only one red probability curve per plot. For score 0, probability is highest at low theta and decreases as theta increases. For scores 1 and 2, probability peaks at moderate theta and declines. For scores 3 to 5, probability increases with theta, peaking at high theta. All axes are labeled Probability Density on the y axis and Latent Trait theta on the x axis. Legends indicate curve colors and meanings.
The distribution of the estimate local dependence parameters ${a}_j^{\ast }$
with 95% CIs for the MRM-LD.
${a}_j^{\ast }$
with 95% CIs for the MRM-LD.

Figure 9 Long description
The y-axis is labeled a j super star and ranges from 0.00 to 1.20. The x-axis is labeled Item and lists items 1 through 16. Each item displays one symbol: green upward triangles for C M S, orange diamonds for M T F, and purple squares for Select-N. Each symbol has a vertical line indicating the 95 percent confidence interval. Three horizontal red dotted lines mark y equals 0.25, 0.50, and 1.00. Most estimates fall below 1.00, with some C M S items reaching above 0.80. M T F and Select-N items generally cluster below 0.60. The legend at the right identifies the item types by symbol and color.
5.2.5 Inter-option local dependence
Figure 9 displays the estimated mean local dependence parameters ( ${a}_j^{\ast }$
) and their 95% confidence intervals by the MRM-LD. Values exceeding 0.5, which typically represent a non-negligible or moderate level of local dependence (Kang et al., Reference Kang, Han, Kim and Kao2022; Wainer et al., Reference Wainer, Bradlow and Wang2007; Wang & Wilson, Reference Wang and Wilson2005), were found in MTF items 3, 6, 11, 12; CMS items 2, 4, 6, 7, 9, 12, 13; and select-N item 12. This widespread local dependence explains the better model fit of the MRM-LD over the standard MRM. It implies that responding to these items requires secondary skills beyond the main ability construct. For example, item 12 requires specific calculations for multiple mirror reflections. A student knowing the formula can solve for several options at once, creating strong dependence among them.
${a}_j^{\ast }$
) and their 95% confidence intervals by the MRM-LD. Values exceeding 0.5, which typically represent a non-negligible or moderate level of local dependence (Kang et al., Reference Kang, Han, Kim and Kao2022; Wainer et al., Reference Wainer, Bradlow and Wang2007; Wang & Wilson, Reference Wang and Wilson2005), were found in MTF items 3, 6, 11, 12; CMS items 2, 4, 6, 7, 9, 12, 13; and select-N item 12. This widespread local dependence explains the better model fit of the MRM-LD over the standard MRM. It implies that responding to these items requires secondary skills beyond the main ability construct. For example, item 12 requires specific calculations for multiple mirror reflections. A student knowing the formula can solve for several options at once, creating strong dependence among them.
5.2.6 IRT reliability
Table 5 presents the IRT reliability for each model across three item types. The results indicate that both the MRM-LD and MRM yield superior IRT reliability compared to the three traditional methods. Furthermore, while the IRT reliability for MTF and CMS item types showed negligible differences, both were slightly superior to the select-N item type. Overall, the latent ability estimates ${\theta}_i$
derived from the MRM-LD and MRM are more reliable and exhibit lower measurement error compared to those obtained from traditional methods. Notably, the IRT reliability of the MRM was found to be higher than that of the MRM-LD. This finding aligns with previous research on local dependence modeling (Bradlow, Reference Bradlow1999; Li et al., Reference Li, Li and Wang2010; Lucke, Reference Lucke2005; Marais, Reference Marais, Christensen, Kreiner and Mesbah2012), which has demonstrated that unaccounted-for dependence can lead to an overestimation of ability measurement precision.
${\theta}_i$
derived from the MRM-LD and MRM are more reliable and exhibit lower measurement error compared to those obtained from traditional methods. Notably, the IRT reliability of the MRM was found to be higher than that of the MRM-LD. This finding aligns with previous research on local dependence modeling (Bradlow, Reference Bradlow1999; Li et al., Reference Li, Li and Wang2010; Lucke, Reference Lucke2005; Marais, Reference Marais, Christensen, Kreiner and Mesbah2012), which has demonstrated that unaccounted-for dependence can lead to an overestimation of ability measurement precision.
IRT reliability of different models across item types.
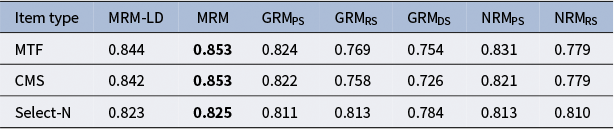
Table 5 Long description
The table has three rows for item types: M T F, C M S, and Select-N. Columns from left to right are M R M dash L D, M R M, G R M sub P S, G R M sub R S, G R M sub D S, N R M sub P S, and N R M sub R S. For M T F, values are 0.844, bold 0.853, 0.824, 0.769, 0.754, 0.831, 0.779. For C M S, values are 0.842, bold 0.853, 0.822, 0.758, 0.726, 0.821, 0.779. For Select-N, values are 0.823, bold 0.825, 0.811, 0.813, 0.784, 0.813, 0.810. Bold values indicate the best model for each item type.
Note: Boldface indicates the best model.
5.2.7 Criterion-related validity
Table 6 presents the criterion-related validity of the four models across nine test booklets and different data types. The results reveal that both MRM and MRM-LD consistently achieve comparable criterion-related validities. Notably, the latent ability estimates from MRM-LD and MRM exhibit a stronger correlation with prior physics test scores across most test booklets, compared to those derived from the GRM and NRM (which are based on three traditional scoring methods).
Criterion-related validity across nine booklets.
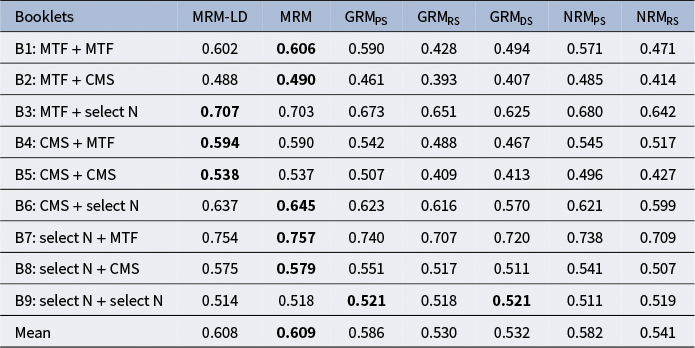
Table 6 Long description
The table consists of ten rows and eight columns. The header row lists Booklets, M R M dash L D, M R M, G R M sub P S, G R M sub R S, G R M sub D S, N R M sub P S, and N R M sub R S. Each subsequent row represents a booklet, labeled B1 through B9, with the last row showing the mean. For each booklet, the table provides correlation coefficients for each model. In each row, the highest coefficient is in bold, indicating the best model. For B1, the highest value is 0.606 under M R M. For B2, 0.490 under M R M. For B3, 0.707 under M R M dash L D. For B4, 0.594 under M R M dash L D. For B5, 0.538 under M R M dash L D. For B6, 0.645 under M R M. For B7, 0.757 under M R M. For B8, 0.579 under M R M. For B9, 0.521 under both G R M sub P S and G R M sub D S. The mean row shows the highest value, 0.609, under M R M. All coefficients are significant at p less than 0.001.
Note: Boldface indicates the best model. All correlation coefficients in the table are significant at the p < 0.001 level.
5.2.8 Information curve
Figure 10 illustrates the test information yielded by the four models at different data types across the three MR item types. It is evident that the MRM-LD and the MRM display similar test information curves. For MTF and CMS items, the two new models provide substantially greater information than other models within the ability range of −3 to 0 (i.e., from low to moderate ability), with their peaks occurring at an ability level of approximately −1. Within the ability range of 1 to 3, the information they provide is on par with other models. However, for select-N items, the test information provided is relatively lower compared to the information volume offered by MTF and CMS items. The comparison of different scoring methods yields results consistent with previous research: PS retains the most test information, followed by RS and then DS (Betts et al., Reference Betts, Muntean, Kim and Kao2022; Muckle et al., Reference Muckle, Becker and Wu2011). This study further employed RC data modeling within the MRM framework to optimize response utilization by unlocking the potential information in uncompressed RC data that distinguishes respondents’ abilities. This approach significantly enhances test information and improves the reliability of the test.
Test information curves for each model across different item types.
Note: Information curves for MRM-LD are conditional on
${\gamma}_{ij} = 0$
.

Figure 10 Long description
Each panel shows test information on the y-axis from 0 to 25 and latent trait theta on the x-axis from minus 4 to 4. The left panel, labeled CMS, displays six curves: MRM-LD (solid green) and MRM (dashed green) both peak sharply above 20 at theta near zero. GRM_PS (solid orange) and GRM_RS (dot-dash orange) are lower, peaking near 5 and 2, respectively. NRM_PS (solid purple) and NRM_RS (dash-dot purple) peak near 7 and 5. The middle panel, MTF, shows similar patterns: MRM-LD and MRM peak above 20, NRM_PS and NRM_RS peak near 10 and 8, GRM_PS and GRM_RS are lower. The right panel, Select-N, shows all curves with lower peaks: MRM-LD and MRM peak near 10, NRM_PS and NRM_RS near 6, GRM_PS and GRM_RS below 3. The legend below identifies each model by color and line style.
6 Simulation studies
6.1 Simulation study 1
6.1.1 Design
This study systematically evaluates parameter estimation accuracy through Monte Carlo simulations under conditions mirroring the empirical study. The simulation replicates key elements: 16 five-option MR items with three structures (MTF, CMS, select-N), nine test booklets, sample size N = 876, and an average of 292 responses per item.
Based on MRM-LD parameter estimates (Supplementary Table S1), which demonstrated optimal fit in the empirical study, response probability vectors were calculated using Formula (6). Simulated RC data were generated via categorical distribution: ${Y}_{ij}\sim \mathrm{Categorical}\left(P\left({Y}_{ij}=x|{\theta}_i,{\boldsymbol{a}}_j,{\boldsymbol{d}}_j,{a}_j^{\ast },{\gamma}_{ij}\right)\right)$
, and then converted using PS, RS, and DS scoring methods. Both RC and converted datasets were analyzed using MRM, MRM-LD, GRM, and NRM models, following identical empirical settings (i.e., prior distributions, MCMC iterations, convergence criteria). Across 30 replications, all models converged with PSRF <1.1.
${Y}_{ij}\sim \mathrm{Categorical}\left(P\left({Y}_{ij}=x|{\theta}_i,{\boldsymbol{a}}_j,{\boldsymbol{d}}_j,{a}_j^{\ast },{\gamma}_{ij}\right)\right)$
, and then converted using PS, RS, and DS scoring methods. Both RC and converted datasets were analyzed using MRM, MRM-LD, GRM, and NRM models, following identical empirical settings (i.e., prior distributions, MCMC iterations, convergence criteria). Across 30 replications, all models converged with PSRF <1.1.
6.1.2 Evaluation metrics
The accuracy of parameter estimation is evaluated using bias and root mean square error (RMSE) indices: $\mathrm{Bias}\left(\phi \right)=\frac{1}{R}\sum _{r=1}^R\kern0.1em \left(\hat{\phi}^{(r)}-\phi \right)$
and
$\mathrm{Bias}\left(\phi \right)=\frac{1}{R}\sum _{r=1}^R\kern0.1em \left(\hat{\phi}^{(r)}-\phi \right)$
and $\mathrm{RMSE}\left(\phi \right)=\sqrt{\frac{1}{R}\sum _{r=1}^R\kern0.20em {\left(\hat{\phi}^{(r)}-\phi \right)}^2}$
, where
$\mathrm{RMSE}\left(\phi \right)=\sqrt{\frac{1}{R}\sum _{r=1}^R\kern0.20em {\left(\hat{\phi}^{(r)}-\phi \right)}^2}$
, where $\phi$
represents the true parameter value and
$\phi$
represents the true parameter value and $\hat{\phi}^{(r)}$
is the estimated value obtained from the
$\hat{\phi}^{(r)}$
is the estimated value obtained from the $r$
-th replication. These two indices were computed for the estimated values of
$r$
-th replication. These two indices were computed for the estimated values of ${a}_{jo}$
,
${a}_{jo}$
, ${d}_{jo}$
,
${d}_{jo}$
, ${a}_j^{\ast }$
, and
${a}_j^{\ast }$
, and ${\theta}_i$
. Subsequently, the mean values of these indices across all relevant parameters were reported. In addition to these, for person parameters, the Pearson correlation coefficient between the true and estimated latent abilities is also calculated:
${\theta}_i$
. Subsequently, the mean values of these indices across all relevant parameters were reported. In addition to these, for person parameters, the Pearson correlation coefficient between the true and estimated latent abilities is also calculated: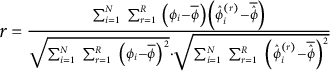 $r=\frac{\sum _{i=1}^N\kern0.20em \sum _{r=1}^R\kern0.20em \left({\phi}_i-\overline{\phi}\right)\left(\hat{\phi}_i^{(r)}-\overline{\hat{\phi }}\right)}{\sqrt{\sum _{i=1}^N\kern0.20em \sum _{r=1}^R\kern0.20em {\left({\phi}_i-\overline{\phi}\right)}^2}\cdotp \sqrt{\sum _{i=1}^N\kern0.20em \sum _{r=1}^R\kern0.20em {\left(\hat{\phi}_i^{(r)}-\overline{\hat{\phi }}\right)}^2}}$
.
$r=\frac{\sum _{i=1}^N\kern0.20em \sum _{r=1}^R\kern0.20em \left({\phi}_i-\overline{\phi}\right)\left(\hat{\phi}_i^{(r)}-\overline{\hat{\phi }}\right)}{\sqrt{\sum _{i=1}^N\kern0.20em \sum _{r=1}^R\kern0.20em {\left({\phi}_i-\overline{\phi}\right)}^2}\cdotp \sqrt{\sum _{i=1}^N\kern0.20em \sum _{r=1}^R\kern0.20em {\left(\hat{\phi}_i^{(r)}-\overline{\hat{\phi }}\right)}^2}}$
.
6.1.3 Simulation study 1 results
The Monte Carlo simulation results based on empirical data (see Table 7) are summarized as follows. For item parameter estimation within the MRM framework, both the MRM-LD and MRM showed absolute biases below 0.011 for ${a}_{jo}$
and
${a}_{jo}$
and ${d}_{jo}$
, with RMSE values not exceeding 0.280 and 0.224, respectively. Furthermore, the MRM-LD exhibited high estimation accuracy for
${d}_{jo}$
, with RMSE values not exceeding 0.280 and 0.224, respectively. Furthermore, the MRM-LD exhibited high estimation accuracy for ${a}_j^{\ast }$
(RMSE = 0.136), confirming its capability to accurately recover local dependence structures. For
${a}_j^{\ast }$
(RMSE = 0.136), confirming its capability to accurately recover local dependence structures. For ${\theta}_i$
parameter, both MRM and MRM-LD substantially outperformed all competing models, achieving RMSE values between 0.388 and 0.389 and correlations with true ability of 0.934. Compared to the GRMPS (correlation = 0.917, RMSE = 0.417) and NRMPS (correlation = 0.884, RMSE = 0.458), both of which are based on PS data, the MRM and MRM-LD, fitted using raw RC data, improved correlation by 1.7%–5.0% and reduced RMSE by 6.9%–15.3%. When compared to models based on DS or RS data (e.g., GRMDS with RMSE = 0.496, correlation = 0.871; GRMRS with RMSE = 0.471, correlation = 0.892), the MRM and MRM-LD achieved RMSE reductions of 17.6%–21.6% and correlation increases of 4.2%–6.3%.
${\theta}_i$
parameter, both MRM and MRM-LD substantially outperformed all competing models, achieving RMSE values between 0.388 and 0.389 and correlations with true ability of 0.934. Compared to the GRMPS (correlation = 0.917, RMSE = 0.417) and NRMPS (correlation = 0.884, RMSE = 0.458), both of which are based on PS data, the MRM and MRM-LD, fitted using raw RC data, improved correlation by 1.7%–5.0% and reduced RMSE by 6.9%–15.3%. When compared to models based on DS or RS data (e.g., GRMDS with RMSE = 0.496, correlation = 0.871; GRMRS with RMSE = 0.471, correlation = 0.892), the MRM and MRM-LD achieved RMSE reductions of 17.6%–21.6% and correlation increases of 4.2%–6.3%.
Parameter estimation accuracy of each model in the simulation study 1.

Table 7 Long description
The table contains four parameter sections, each with metrics listed vertically: Bias, RMSE, and Correlation. The columns from left to right are Parameter, Metric, M R M dash L D, M R M, G R M sub P S, G R M sub R S, G R M sub D S, N R M sub P S, and N R M sub R S. For parameter a sub j o, Bias is negative zero point zero one one for M R M dash L D and negative zero point zero zero eight for M R M, with dashes for other models. RMSE is zero point two eight zero for M R M dash L D and zero point two six two for M R M. For parameter d sub j o, Bias is zero point zero zero nine for M R M dash L D and zero point zero zero seven for M R M, with dashes elsewhere. RMSE is zero point two two four for M R M dash L D and zero point two four one for M R M. For parameter a sub j star, Bias is negative zero point zero one one for M R M dash L D only, with dashes elsewhere. RMSE is zero point one three six for M R M dash L D only. For parameter theta sub i, Bias values are zero point one zero six for M R M dash L D, zero point one zero two for M R M, zero point zero nine five for G R M sub P S, negative zero point zero two two for G R M sub R S, negative zero point zero zero nine for G R M sub D S, zero point one zero three for N R M sub P S, and zero point zero two two for N R M sub R S. RMSE values for theta sub i are zero point three eight nine for M R M dash L D, zero point three eight eight for M R M, zero point four one seven for G R M sub P S, zero point four seven one for G R M sub R S, zero point four nine six for G R M sub D S, zero point four one five for N R M sub P S, and zero point four five eight for N R M sub R S. Correlation values for theta sub i are zero point nine three four for M R M dash L D, zero point nine three four for M R M, zero point nine one seven for G R M sub P S, zero point eight eight four for G R M sub R S, zero point eight seven one for G R M sub D S, zero point nine two zero for N R M sub P S, and zero point eight nine two for N R M sub R S.
Overall, the simulation validation based on empirical data confirms that the test booklet structure, number of items, and sample size configuration within the empirical research framework are highly feasible. The MRM and MRM-LD demonstrated robust parameter recovery performance. These findings further support the conclusions drawn from the empirical study.
6.2 Simulation study 2
6.2.1 Design
This study extends beyond the single setting of simulation study 1 by using Monte Carlo simulations to evaluate MRM-LD and MRM under broader data conditions, examining parameter estimation accuracy across testing scenarios and potential differences among MR item types.
A four-factor experimental design included: (1) item type: MTF, CMS, select-N; (2) test length: $J=5,10,15$
; (3) options per item:
$J=5,10,15$
; (3) options per item: $O=5,7$
; (4) sample size:
$O=5,7$
; (4) sample size: $N=250,500,1000$
; and (5) fitted models: MRM-LD, MRM, GRMPS, GRMRS, GRMDS, NRMPS, and NRMRS, yielding
$N=250,500,1000$
; and (5) fitted models: MRM-LD, MRM, GRMPS, GRMRS, GRMDS, NRMPS, and NRMRS, yielding $3\times 3\times 2\times 3\times 7=378$
conditions. The number of correct options per item was configured proportionally for each test length. For J = 5, the configurations included items with 1, 2, 3 (×2), and four correct options for O = 5, and 2, 3, 4 (×2), and five correct options for O = 7. These patterns were scaled accordingly for J = 10 and J = 15.
$3\times 3\times 2\times 3\times 7=378$
conditions. The number of correct options per item was configured proportionally for each test length. For J = 5, the configurations included items with 1, 2, 3 (×2), and four correct options for O = 5, and 2, 3, 4 (×2), and five correct options for O = 7. These patterns were scaled accordingly for J = 10 and J = 15.
Based on previous research (Kang et al., Reference Kang, Han, Kim and Kao2022; Natesan et al., Reference Natesan, Nandakumar, Minka and Rubright2016) and empirical findings, parameters were set as: ${\theta}_i\sim \mathrm{Norm}\left(0,1\right)$
,
${\theta}_i\sim \mathrm{Norm}\left(0,1\right)$
, ${\gamma}_{ij}\sim \mathrm{Norm}\left(0,1\right)$
,
${\gamma}_{ij}\sim \mathrm{Norm}\left(0,1\right)$
, ${d}_{jo}\sim \mathrm{Norm}\left(0,1\right)$
, and
${d}_{jo}\sim \mathrm{Norm}\left(0,1\right)$
, and ${a}_{jo}\sim \mathrm{Lognormal}\left(0,0.5\right)$
for
${a}_{jo}\sim \mathrm{Lognormal}\left(0,0.5\right)$
for ${W}_{jo}=1$
or
${W}_{jo}=1$
or $-\mathrm{Lognormal}\left(0,0.5\right)$
for
$-\mathrm{Lognormal}\left(0,0.5\right)$
for ${W}_{jo}=-1$
. Local dependence parameters
${W}_{jo}=-1$
. Local dependence parameters ${a}_j^{\ast }$
were set to small (0.25), medium (0.5), and large (1) effects (Kang et al., Reference Kang, Han, Kim and Kao2022). The number of items at each effect level (small, medium, large) was (1, 2, 2) for J = 5, (3, 3, 4) for J = 10, and (5, 5, 5) for J = 15. Responses
${a}_j^{\ast }$
were set to small (0.25), medium (0.5), and large (1) effects (Kang et al., Reference Kang, Han, Kim and Kao2022). The number of items at each effect level (small, medium, large) was (1, 2, 2) for J = 5, (3, 3, 4) for J = 10, and (5, 5, 5) for J = 15. Responses ${Y}_{ij}$
were generated from a categorical distribution based on probabilities from Formula (6), with all other settings consistent with simulation study 1.
${Y}_{ij}$
were generated from a categorical distribution based on probabilities from Formula (6), with all other settings consistent with simulation study 1.
6.2.2 Simulation study 2 results
Supplementary Tables S8 and S9 indicate that both MRM-LD and MRM yielded unbiased (near-zero bias) estimates for the ${a}_{jo}$
and
${a}_{jo}$
and ${d}_{jo}$
parameters. For
${d}_{jo}$
parameters. For ${a}_{jo}$
, the MRM performed slightly better, with a mean RMSE of 0.193 (range: 0.118–0.307), compared to 0.205 (range: 0.124–0.327) for MRM-LD. Conversely, for
${a}_{jo}$
, the MRM performed slightly better, with a mean RMSE of 0.193 (range: 0.118–0.307), compared to 0.205 (range: 0.124–0.327) for MRM-LD. Conversely, for ${d}_{jo}$
, the MRM-LD was slightly more accurate, showing a mean RMSE of 0.147 (range: 0.093–0.260) versus 0.158 (range: 0.105–0.268) for MRM. Sample size was the most significant factor: increasing it from 250 to 1000 reduced RMSE for both parameters by more than 50%. Item type also mattered, as MTF and CMS items yielded higher and comparable accuracy (e.g., the RMSEs of
${d}_{jo}$
, the MRM-LD was slightly more accurate, showing a mean RMSE of 0.147 (range: 0.093–0.260) versus 0.158 (range: 0.105–0.268) for MRM. Sample size was the most significant factor: increasing it from 250 to 1000 reduced RMSE for both parameters by more than 50%. Item type also mattered, as MTF and CMS items yielded higher and comparable accuracy (e.g., the RMSEs of ${d}_{jo}$
for MRM-LD ranged from 0.093 to 0.200 for MTF and from 0.093 to 0.199 for CMS, respectively), outperforming select-N items (e.g., the RMSEs of
${d}_{jo}$
for MRM-LD ranged from 0.093 to 0.200 for MTF and from 0.093 to 0.199 for CMS, respectively), outperforming select-N items (e.g., the RMSEs of ${d}_{jo}$
for MRM-LD ranged from 0.100 to 0.260). Increasing the number of options improved parameter recovery only for select-N items, whereas the number of items had no significant effect on the estimation of
${d}_{jo}$
for MRM-LD ranged from 0.100 to 0.260). Increasing the number of options improved parameter recovery only for select-N items, whereas the number of items had no significant effect on the estimation of ${a}_{jo}$
or
${a}_{jo}$
or ${d}_{jo}$
.
${d}_{jo}$
.
Supplementary Table S10 confirms that MRM-LD provided unbiased estimates for the local dependence parameter ${a}_j^{\ast }$
, demonstrating good recovery performance (mean RMSE was 0.147, with a range of 0.093 to 0.260). Similar to the other parameters, increasing the sample size from 250 to 1000 reduced the RMSE by approximately 50%. A larger number of items also led to a slight improvement in the accuracy of
${a}_j^{\ast }$
, demonstrating good recovery performance (mean RMSE was 0.147, with a range of 0.093 to 0.260). Similar to the other parameters, increasing the sample size from 250 to 1000 reduced the RMSE by approximately 50%. A larger number of items also led to a slight improvement in the accuracy of ${a}_j^{\ast }$
, with MTF and CMS items showing slightly superior recovery than select-N items.
${a}_j^{\ast }$
, with MTF and CMS items showing slightly superior recovery than select-N items.
As shown in Figures 11–13, the MRM-LD consistently achieved the highest estimation accuracy for person parameter ${\theta}_i$
, closely followed by MRM. The overall ranking of accuracy was MRM-LD > MRM > GRMPS/NRMPS > GRMRS/NRMRS > GRMDS. The MRM-LD reduced RMSE by 4.4%—12.2% compared to GRMPS/NRMPS; 5.8%—50.8% compared to GRMRS/NRMRS; and 21.4%—65.1% compared to GRMDS. This pattern was corroborated by Pearson correlation results (see Supplementary Tables S11 and S12), where MRM-LD showed the highest values (0.901–0.972), followed by MRM (0.875–0.971). In contrast, GRMRS (0.716–0.959) and NRMRS (0.751–0.960) showed substantially lower correlations, while GRMDS had the lowest (0.345–0.900). In terms of item types, MTF and CMS items yielded slightly higher accuracy than select-N items. Estimation accuracy also improved with longer tests and a greater number of options. Although sample size minimally affected RMSE but did reduce bias. Notably, even with limited test length (e.g., J = 5), both MRM-LD and MRM maintained high accuracy (RMSE <0.5) and strong correlations (>0.88).
${\theta}_i$
, closely followed by MRM. The overall ranking of accuracy was MRM-LD > MRM > GRMPS/NRMPS > GRMRS/NRMRS > GRMDS. The MRM-LD reduced RMSE by 4.4%—12.2% compared to GRMPS/NRMPS; 5.8%—50.8% compared to GRMRS/NRMRS; and 21.4%—65.1% compared to GRMDS. This pattern was corroborated by Pearson correlation results (see Supplementary Tables S11 and S12), where MRM-LD showed the highest values (0.901–0.972), followed by MRM (0.875–0.971). In contrast, GRMRS (0.716–0.959) and NRMRS (0.751–0.960) showed substantially lower correlations, while GRMDS had the lowest (0.345–0.900). In terms of item types, MTF and CMS items yielded slightly higher accuracy than select-N items. Estimation accuracy also improved with longer tests and a greater number of options. Although sample size minimally affected RMSE but did reduce bias. Notably, even with limited test length (e.g., J = 5), both MRM-LD and MRM maintained high accuracy (RMSE <0.5) and strong correlations (>0.88).
Estimation accuracy of person parameter ${\theta}_i$
by various models in MTF tests.
${\theta}_i$
by various models in MTF tests.

Figure 11 Long description
From left to right, each panel displays two vertically stacked graphs. The leftmost panel shows R M S E on the y-axis and N on the x-axis, with J equals 5, 10, and 15, O equals 5. Bar groups represent M R M dash L D and M R M, while lines and diamonds represent N R M underscore P S, N R M underscore R S, G R M underscore P S, G R M underscore R S, and G R M underscore D S. R M S E decreases as N and J increase. The second panel shows Bias on the y-axis, with similar groupings and trends. The third and fourth panels repeat the structure for O equals 7, showing R M S E and Bias respectively. Legends at the bottom identify each model. Bias values cluster near zero, while R M S E values decrease with larger N and J.
Estimation accuracy of person parameter ${\theta}_i$
by various models in CMS tests.
${\theta}_i$
by various models in CMS tests.

Figure 12 Long description
From left to right, each panel displays two grouped bar and line graphs. The first and third panels show R M S E on the y-axis, with N values (250, 500, 1000) and J values (5, 10, 15) on the x-axis, O equals 5 for the first two panels and O equals 7 for the last two. Bars represent M R M-L D and M R M, while lines and symbols represent N R M_P S, N R M_R S, G R M_P S, G R M_R S, and G R M_D S. R M S E decreases as N and J increase, with M R M-L D and M R M consistently lower than other models. The second and fourth panels show bias on the y-axis, with similar x-axis groupings. Bias values are close to zero for all models, with minor negative deviations for G R M_P S and G R M_R S. Legends at the bottom identify each model. The panels illustrate that estimation accuracy improves with larger N and J, and bias remains minimal across models.
Estimation accuracy of person parameter ${\theta}_i$
by various models in select-N tests.
${\theta}_i$
by various models in select-N tests.

Figure 13 Long description
From left to right, the first and third panels display R M S E values on the y axis for N equals 250, 500, and 1000, with J equals 5, 10, and 15, for O equals 5 and O equals 7 respectively. The second and fourth panels show bias values on the y axis for the same N and J combinations. Each panel includes grouped bars for M R M dash L D and M R M, and lines for N R M underscore P S, N R M underscore R S, G R M underscore P S, G R M underscore R S, and G R M underscore D S. Legends are positioned below each panel. R M S E decreases as N and J increase, while bias remains near zero across models.
Taking the MTF condition with J = 10, O = 5, and N = 500 as an example, the scatterplots of true versus estimated ${\theta}_i$
in Figure 14 provide visual confirmation of these findings. GRMRS showed greater dispersion at high ability levels, while GRMDS failed to differentiate among low-ability respondents. Although GRMPS improved performance compared with GRMRS and GRMDS, the MRM and MRM-LD consistently exhibited the highest accuracy, minimizing estimation error and yielding the strongest correlations between estimated and true
${\theta}_i$
in Figure 14 provide visual confirmation of these findings. GRMRS showed greater dispersion at high ability levels, while GRMDS failed to differentiate among low-ability respondents. Although GRMPS improved performance compared with GRMRS and GRMDS, the MRM and MRM-LD consistently exhibited the highest accuracy, minimizing estimation error and yielding the strongest correlations between estimated and true ${\theta}_i$
parameters.
${\theta}_i$
parameters.
Scatter plots of the true and estimated values of ${\theta}_i$
for the condition: MTF, J = 10, O = 5, and N = 500.
${\theta}_i$
for the condition: MTF, J = 10, O = 5, and N = 500.

Figure 14 Long description
From left to right, each panel displays a scatter plot with the x axis labeled True Value of theta and the y axis labeled Estimated Value of theta by a specific method. Panel one shows M R M dash L D with R M S E equals 0.337 and r equals 0.945. Panel two shows M R M with R M S E equals 0.341 and r equals 0.943. Panel three shows G R M underscore P S with R M S E equals 0.368 and r equals 0.933. Panel four shows G R M underscore R S with R M S E equals 0.537 and r equals 0.849. Panel five shows G R M underscore D S with R M S E equals 0.689 and r equals 0.734. Each plot contains a red diagonal reference line, dense central contours, and scattered points, with correlation decreasing and error increasing from left to right.
6.3 Simulation study 3
6.3.1 Design
This study aimed to investigate the performance of MRM-LD and MRM relative to traditional models under data-generating processes that assume no local dependence. Specifically, we investigated whether MRM-LD can maintain unbiased parameter estimation and correctly identify the absence of local dependence.
Building on the findings from simulation study 2 regarding the significant impact of sample size and MR item type on the estimation of ${a}_j^{\ast }$
, a three-factor experimental design was employed in this study. The factors included: (1) item type: MTF, CMS, select-N; (2) sample size:
${a}_j^{\ast }$
, a three-factor experimental design was employed in this study. The factors included: (1) item type: MTF, CMS, select-N; (2) sample size: $N=250,500,1000$
; and (3) fitted models: MRM-LD, MRM, GRMPS, GRMRS, GRMDS, NRMPS, and NRMRS. This design yielded a total of 63 experimental conditions. The test length (
$N=250,500,1000$
; and (3) fitted models: MRM-LD, MRM, GRMPS, GRMRS, GRMDS, NRMPS, and NRMRS. This design yielded a total of 63 experimental conditions. The test length ( $J=10$
) and number of options (
$J=10$
) and number of options ( $O=5$
) were fixed. The true value of the local dependence parameter
$O=5$
) were fixed. The true value of the local dependence parameter ${a}_j^{\ast }$
was set to 0, making the MRM the true data-generating model. All other settings were consistent with those used in simulation study 1.
${a}_j^{\ast }$
was set to 0, making the MRM the true data-generating model. All other settings were consistent with those used in simulation study 1.
6.3.2 Simulation study 3 results
Supplementary Tables S13 and S14 show the recovery of parameters ${a}_{jo}$
and
${a}_{jo}$
and ${d}_{jo}$
when data were generated by the MRM. Both MRM-LD and MRM exhibited negligible bias, confirming that MRM-LD remains unbiased even without true local dependence. Mean RMSE values were highly comparable between the two models. For
${d}_{jo}$
when data were generated by the MRM. Both MRM-LD and MRM exhibited negligible bias, confirming that MRM-LD remains unbiased even without true local dependence. Mean RMSE values were highly comparable between the two models. For ${a}_{jo}$
, MRM-LD recorded 0.197 versus 0.193 for MRM. For
${a}_{jo}$
, MRM-LD recorded 0.197 versus 0.193 for MRM. For ${d}_{jo}$
, MRM-LD showed 0.131 compared to 0.132 for MRM. These results indicate that estimating the additional local dependence parameter in MRM-LD did not lead to any notable loss of accuracy. Consistent with the findings of simulation study 2, MTF and CMS items exhibited better parameter recovery than select-N items.
${d}_{jo}$
, MRM-LD showed 0.131 compared to 0.132 for MRM. These results indicate that estimating the additional local dependence parameter in MRM-LD did not lead to any notable loss of accuracy. Consistent with the findings of simulation study 2, MTF and CMS items exhibited better parameter recovery than select-N items.
Table 8 details the estimation accuracy of the local dependence parameter ${a}_j^{\ast }$
for MRM-LD when its true value was zero. Across all conditions, a positive bias was observed (ranging from 0.086 to 0.197), indicating a slight tendency to overestimate. This bias decreased progressively as the sample size increased. Similarly, RMSE values decreased with larger samples, with select-N items showing consistently lower RMSEs (0.119–0.179) than MTF (0.154–0.212) and CMS items (0.145–0.213).
${a}_j^{\ast }$
for MRM-LD when its true value was zero. Across all conditions, a positive bias was observed (ranging from 0.086 to 0.197), indicating a slight tendency to overestimate. This bias decreased progressively as the sample size increased. Similarly, RMSE values decreased with larger samples, with select-N items showing consistently lower RMSEs (0.119–0.179) than MTF (0.154–0.212) and CMS items (0.145–0.213).
Estimation accuracy of the local dependence parameter ${a}_j^{\ast }$
for the MRM-LD in simulation study 3.
${a}_j^{\ast }$
for the MRM-LD in simulation study 3.
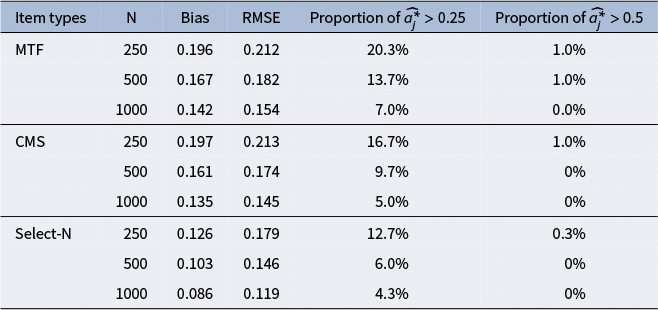
Table 8 Long description
The table has six columns: item types, N, bias, R M S E, proportion of estimated a sub j super asterisk greater than 0.25, and proportion of estimated a sub j super asterisk greater than 0.5. For M T F, at N equals 250, bias is 0.196, R M S E is 0.212, 20.3 percent of estimates exceed 0.25, and 1.0 percent exceed 0.5. At N equals 500, bias is 0.167, R M S E is 0.182, 13.7 percent exceed 0.25, and 1.0 percent exceed 0.5. At N equals 1000, bias is 0.142, R M S E is 0.154, 7.0 percent exceed 0.25, and 0.0 percent exceed 0.5. For C M S, at N equals 250, bias is 0.197, R M S E is 0.213, 16.7 percent exceed 0.25, and 1.0 percent exceed 0.5. At N equals 500, bias is 0.161, R M S E is 0.174, 9.7 percent exceed 0.25, and 0 percent exceed 0.5. At N equals 1000, bias is 0.135, R M S E is 0.145, 5.0 percent exceed 0.25, and 0 percent exceed 0.5. For Select-N, at N equals 250, bias is 0.126, R M S E is 0.179, 12.7 percent exceed 0.25, and 0.3 percent exceed 0.5. At N equals 500, bias is 0.103, R M S E is 0.146, 6.0 percent exceed 0.25, and 0 percent exceed 0.5. At N equals 1000, bias is 0.086, R M S E is 0.119, 4.3 percent exceed 0.25, and 0 percent exceed 0.5. Across all item types, bias and R M S E decrease as N increases, and the proportions of estimates exceeding thresholds also decrease.
To evaluate the practical impact of these estimations, we calculated the proportion of estimated ${a}_j^{\ast }$
values exceeding 0.25 (indicating minor false positives) and 0.50 (indicating substantial false positives), based on criteria from previous research (Glas et al., Reference Glas, Wainer, Bradlow, van der Linden and Glas2000; Ravand, Reference Ravand2015; Wang & Wilson, Reference Wang and Wilson2005; Wang et al., Reference Wang, Bradlow and Wainer2002). At a sample size of 250, the false positive rates were 20.3% for MTF, 16.7% for CMS, and 12.7% for select-N items at the 0.25 threshold, while the rates at the 0.50 threshold were 1.0%, 1.0%, and 0.3%, respectively. When the sample size increased to 1000, the false positive rates at the 0.25 threshold decreased to 7.0% for MTF items, 5.0% for CMS items, and 4.3% for select-N items, and no false positives at the 0.50 threshold occurred occurred for any item type. Item type influenced susceptibility to false positive detection, with MTF items being most susceptible, CMS items performing better, and select-N items demonstrating the best control over false positive rates.
${a}_j^{\ast }$
values exceeding 0.25 (indicating minor false positives) and 0.50 (indicating substantial false positives), based on criteria from previous research (Glas et al., Reference Glas, Wainer, Bradlow, van der Linden and Glas2000; Ravand, Reference Ravand2015; Wang & Wilson, Reference Wang and Wilson2005; Wang et al., Reference Wang, Bradlow and Wainer2002). At a sample size of 250, the false positive rates were 20.3% for MTF, 16.7% for CMS, and 12.7% for select-N items at the 0.25 threshold, while the rates at the 0.50 threshold were 1.0%, 1.0%, and 0.3%, respectively. When the sample size increased to 1000, the false positive rates at the 0.25 threshold decreased to 7.0% for MTF items, 5.0% for CMS items, and 4.3% for select-N items, and no false positives at the 0.50 threshold occurred occurred for any item type. Item type influenced susceptibility to false positive detection, with MTF items being most susceptible, CMS items performing better, and select-N items demonstrating the best control over false positive rates.
Figure 15 shows that MRM-LD and MRM consistently provided superior ${\theta}_i$
estimation, with the smallest RMSEs (0.298–0.343) and highest correlations (0.942–0.956) compared with GRM and NRM. The difference between MRM and MRM-LD was negligible (i.e.,
${\theta}_i$
estimation, with the smallest RMSEs (0.298–0.343) and highest correlations (0.942–0.956) compared with GRM and NRM. The difference between MRM and MRM-LD was negligible (i.e., $\Delta$
RMSE < 0.001), highlighting the MRM-LD’s robustness even when true local dependence was absent.
$\Delta$
RMSE < 0.001), highlighting the MRM-LD’s robustness even when true local dependence was absent.
Estimation accuracy of person parameter ${\theta}_i$
by various models in simulation study 3.
${\theta}_i$
by various models in simulation study 3.

Figure 15 Long description
Top left panel: y-axis is R M S E from zero to 0.8, x-axis groups are M T F, C M S, and Select-N, each with N equals 250, 500, or 1000. Bars and lines show M R M dash L D, M R M, N R M underscore P S, N R M underscore R S, G R M underscore P S, G R M underscore R S, and G R M underscore D S. R M S E is lowest for M R M dash L D and M R M, higher for other models, with little variation across sample sizes. Top right panel: y-axis is bias from negative 0.08 to 0.08, same x-axis. Bars and lines show bias near zero for all models, with M R M dash L D and M R M slightly positive, others slightly negative or near zero. Bottom left panel: y-axis is correlation from 0.7 to 1.0, same x-axis. All models show high correlation above 0.9, with M R M dash L D and M R M highest. Bottom right: legend identifies bar and line styles for each model.
6.4 Simulation study 4
6.4.1 Design
To evaluate the robustness of MRM and its sensitivity to model misspecification, simulation study 4 examined scenarios where the data-generating process deviated from MR assumptions. Specifically, GRMPS and NRMPS, non-MR frameworks using only score information, were employed as data-generating models.
A four-factor experimental design was employed, comprising the following factors: (1) item type: MTF, CMS, select-N; (2) number of options: $O=5$
,
$O=5$
, $O=7$
; (3) data-generating model: GRMPS, NRMPS; and (4) fitted Model: MRM-LD, MRM, GRMPS, GRMRS, GRMDS, NRMPS, NRMRS. This resulted in a total of 84 data conditions, with test length fixed at J = 10 and sample size at N = 500.
$O=7$
; (3) data-generating model: GRMPS, NRMPS; and (4) fitted Model: MRM-LD, MRM, GRMPS, GRMRS, GRMDS, NRMPS, NRMRS. This resulted in a total of 84 data conditions, with test length fixed at J = 10 and sample size at N = 500.
For conditions where GRMPS served as the data-generating model, item slope parameters ( ${a}_j$
) were drawn from a uniform(0.5, 2) distribution, and intercept parameters (
${a}_j$
) were drawn from a uniform(0.5, 2) distribution, and intercept parameters ( ${d}_{jk}$
) were sampled from a standard normal distribution (Kang et al., Reference Kang, Han, Kim and Kao2022; Nye et al., Reference Nye, Joo, Zhang and Stark2020). For NRMPS, item category slope parameters (
${d}_{jk}$
) were sampled from a standard normal distribution (Kang et al., Reference Kang, Han, Kim and Kao2022; Nye et al., Reference Nye, Joo, Zhang and Stark2020). For NRMPS, item category slope parameters ( ${a}_{jk}$
) were drawn from a standard normal distribution with the order constraint
${a}_{jk}$
) were drawn from a standard normal distribution with the order constraint ${a}_{j1}<{a}_{j2}<\cdots <{a}_{j\left({K}_j-1\right)}$
, and intercept parameters (
${a}_{j1}<{a}_{j2}<\cdots <{a}_{j\left({K}_j-1\right)}$
, and intercept parameters ( ${d}_{jk}$
) were sampled from a standard normal distribution (García-Pérez, Reference García-Pérez2018). RC data were generated in three steps. First, item score probabilities were calculated for each respondent under the GRM or NRM with different scoring methods. Second, for each score level, these probabilities were randomly distributed among all possible RCs corresponding to that score. Third, for subsequent GRM and NRM analyses, the resulting RC data were re-aggregated into score-based formats using PS, RS, and DS scoring methods. All other experimental settings remained consistent with those used in the previous simulation studies.
${d}_{jk}$
) were sampled from a standard normal distribution (García-Pérez, Reference García-Pérez2018). RC data were generated in three steps. First, item score probabilities were calculated for each respondent under the GRM or NRM with different scoring methods. Second, for each score level, these probabilities were randomly distributed among all possible RCs corresponding to that score. Third, for subsequent GRM and NRM analyses, the resulting RC data were re-aggregated into score-based formats using PS, RS, and DS scoring methods. All other experimental settings remained consistent with those used in the previous simulation studies.
6.4.2 Simulation study 4 results
Figure 16 presents the estimation accuracy of person parameters ${\theta}_i$
across various models in simulation study 4, which assessed the performance of MRM-LD and MRM under model misspecification. When data were generated by GRMPS, the MRM-LD demonstrated notable robustness, with only a 3.0% increase in mean RMSE and a 0.8% decrease in correlation relative to the true model. In contrast, the standard MRM exhibited considerably greater sensitivity to misspecification, exhibiting a 12% rise in RMSE and a 3.1% reduction in correlation. A similar pattern was observed when NRMPS served as the data-generating model. Compared to the true model, MRM-LD incurred only a 4.6% increase in RMSE and a 1.1% decline in correlation, whereas the standard MRM showed more pronounced deterioration, with a 9.3% rise in RMSE and a 2.7% drop in correlation.
${\theta}_i$
across various models in simulation study 4, which assessed the performance of MRM-LD and MRM under model misspecification. When data were generated by GRMPS, the MRM-LD demonstrated notable robustness, with only a 3.0% increase in mean RMSE and a 0.8% decrease in correlation relative to the true model. In contrast, the standard MRM exhibited considerably greater sensitivity to misspecification, exhibiting a 12% rise in RMSE and a 3.1% reduction in correlation. A similar pattern was observed when NRMPS served as the data-generating model. Compared to the true model, MRM-LD incurred only a 4.6% increase in RMSE and a 1.1% decline in correlation, whereas the standard MRM showed more pronounced deterioration, with a 9.3% rise in RMSE and a 2.7% drop in correlation.
Estimation accuracy of person parameter ${\theta}_i$
by various models in simulation study 4.
${\theta}_i$
by various models in simulation study 4.
Note: True models are highlighted in red.

Figure 16 Long description
Starting from the top left, the first panel shows R M S E on the y-axis, with model types M T F, C M S, and Select-N on the x-axis, grouped under true model equals G R M and true model equals N R M. Bars represent M R M-L D and M R M, with additional lines and symbols for N R M_P S, N R M_R S, G R M_P S, G R M_R S, and G R M_D S. Red diamonds and lines highlight true models. The top right panel displays bias on the y-axis, using the same x-axis grouping and legend. The bottom left panel shows correlation on the y-axis, again with identical x-axis groupings and legend. The legend at the lower right defines all symbols and line types. Across panels, true models are visually emphasized in red, and performance metrics are compared for each estimation method.
Across both generating scenarios, MRM-LD consistently exhibited stronger robustness to model misspecification than the standard MRM. Specifically, the RMSE increase for MRM-LD was only 30–42% of that for the standard MRM, and its correlation loss was approximately one-third as large. These results suggest that the standard MRM, which does not explicitly model within-item local dependence, is more adversely affected by deviations from its underlying assumptions than MRM-LD.
7 Discussion
This study introduced a psychometric model framework that integrates multiple MR item types, such as MTF, CMS, and Select-N, into a unified structure capable of analyzing RC data without losing information through data compression. Within this framework, we developed the MRM-LD and MRM and applied an MCMC algorithm for parameter estimation. Through empirical and simulation studies, we demonstrated that the proposed models outperform traditional scoring methods and existing analytical approaches by improving parameter estimation accuracy and providing more granular insights into respondents’ responses and item characteristics.
7.1 Importance of modeling response combination data in multiple response items
Our empirical study revealed that the MRM-LD model achieved the best fit, higher criterion validity, and greater test information compared to traditional models. Even under simulation conditions with small sample sizes and limited items, MRM-LD and MRM accurately recovered parameters, underscoring their practical applicability in real testing environments. Building upon RC data, the RCCCs enable a more granular representation of item characteristics and illuminate the more nuanced relationship between respondents’ latent abilities and the responses as reflected by the RCs. Furthermore, RCCCs reveal the ranking of option difficulty, which can inform more effective score improvement strategies by guiding respondents to progressively master the knowledge embodied in the options, moving from easier to more difficult ones (Smith & Bendjilali, Reference Smith and Bendjilali2022). Beyond item-score based modeling approaches, the MRM framework, by modeling option parameters, facilitates a deeper analysis of option-level quality. Specifically, the sign and significance of the ${a}_{jo}$
parameter can assist test developers in more effectively evaluating item quality, identifying ambiguous options, and correcting potentially mis-keyed options (Zu & Kyllonen, Reference Zu and Kyllonen2020).
${a}_{jo}$
parameter can assist test developers in more effectively evaluating item quality, identifying ambiguous options, and correcting potentially mis-keyed options (Zu & Kyllonen, Reference Zu and Kyllonen2020).
Compared to using raw RC data, modeling methods that rely on item scores may introduce potential issues. While models using PS data are second only to the MRM and MRM-LD in terms of ability estimation accuracy, their application still faces challenges. Specifically, when employing the PS method, the compression of scores into multiple categories can lead to the absence of certain score categories, particularly for lower score levels (e.g., 0 or 1). This results in insufficient information for polytomous IRT models, especially the NRM, to accurately estimate intercept and slope parameters for each score category, thereby leading to deviations in data fit. Although these data can be handled by collapsing categories, this approach is not only inflexible but also loses the effective representation of lower-level data (Van Dusen & Nissen, Reference Van Dusen and Nissen2020), especially when dealing with small sample sizes and limited items (Battauz, Reference Battauz2020).
While scoring raw RC using RS and DS can reduce complexity and enhance parameter estimation efficiency, it significantly compromises the accuracy of parameter estimates. Empirical study showed that using GRM and NRM with RS and DS data resulted in lower reliability and criterion-related validity for person parameter estimates. Consistent with previous research (Schmidt et al., Reference Schmidt, Raupach, Wiegand, Herrmann and Kanzow2021, Reference Schmidt, Raupach, Wiegand, Herrmann and Kanzow2022), simulations further indicated that RS and DS distort the linear relationship between true ability and estimated values, with DS particularly failing to differentiate low-ability respondents as the number of options increases.
7.2 Practical recommendations for choosing multiple response item types
Our comparisons among MTF, CMS, and select-N item types revealed that MTF and CMS items exhibit similar psychometric properties. In empirical data, the test information functions for both item types, estimated using the MRM-LD and MRM, were nearly identical. Simulation studies supported these findings, showing consistent parameter estimation performance for both types. This similarity suggests that MTF and CMS items can be used interchangeably to some extent. The primary difference lies in the fact that CMS items do not permit a “none selected” response, although in practice, respondents may avoid such responses in MTF items, especially when there are many options.
Nevertheless, select-N items demonstrated relatively poorer performance in both empirical and simulation studies, though still within acceptable ranges. In simulations, a select-N test with five items and five options achieved a correlation of approximately 0.9 between estimated and true person parameters using the MRM-LD. The results of parameter recovery for seven-option select-N items were comparable to those of five-option MTF and CMS items. In the present study, MRM-LD, MRM, GRM, and NRM consistently showed that select-N items yielded lower information and less accurate parameter estimations compared to their MTF and CMS format. However, select-N items required the shortest response times, an advantage in time-constrained contexts. The trade-off between response efficiency and information was not examined in this study but warrants future investigation. A potential underlying reason for this observed diminished performance is the reduced number of possible RCs inherent in the select-N format. This reduction constrains the potential response space, thereby leading to a less fine-grained discrimination of person abilities (Guo et al., Reference Guo, Zu, Kyllonen and Schmitt2016; Samejima, Reference Samejima1968).
7.3 Insights from the local dependence of multiple response items
In empirical study, the local dependence parameter ${a}_{jo}^{\ast }$
derived from the MRM-LD revealed significant local dependencies across many items in the dataset. This finding can explain why the standard MRM sometimes exhibited PPP values close to 0.05 for certain items. The standard MRM fails to capture these within-item random effects. Furthermore, simulation study 4 demonstrated that MRM-LD exhibits greater robustness compared to MRM when the data-generating models were GRM and NRM, respectively. Beyond statistical performance, the local dependence parameters provide additional analytical scope for analyzing MR items. Test developers and researchers can leverage the analysis of highly locally dependent items to identify additional knowledge components involved. By combining this with the slope parameters of the item options, they can ascertain whether the item truly measures the intended knowledge or if it primarily assesses knowledge from other dimensions (Xie, Reference Xie2001).
${a}_{jo}^{\ast }$
derived from the MRM-LD revealed significant local dependencies across many items in the dataset. This finding can explain why the standard MRM sometimes exhibited PPP values close to 0.05 for certain items. The standard MRM fails to capture these within-item random effects. Furthermore, simulation study 4 demonstrated that MRM-LD exhibits greater robustness compared to MRM when the data-generating models were GRM and NRM, respectively. Beyond statistical performance, the local dependence parameters provide additional analytical scope for analyzing MR items. Test developers and researchers can leverage the analysis of highly locally dependent items to identify additional knowledge components involved. By combining this with the slope parameters of the item options, they can ascertain whether the item truly measures the intended knowledge or if it primarily assesses knowledge from other dimensions (Xie, Reference Xie2001).
In empirical study, the ${a}_{jo}^{\ast }$
parameters from MRM-LD showed that CMS items exhibited stronger local dependence characteristics. This dependence might be influenced by test taking strategies, where respondents focus more on the logical relationships between options to select the most appropriate combination. Consequently, this strategic approach by respondents often leads to larger local dependence parameters for CMS compared to MTF items. Conversely, the discrete response format of MTF items suggests that respondents respond options independently, potentially leading to less influence from test taking strategies and cues (Kreiter & Frisbie, Reference Kreiter and Frisbie1989), thereby exhibiting weaker local dependence. In contrast to MTF and CMS, the empirical results indicated that the select-N format yielded lower local dependence, although no significant difference was found when compared to MTF. A potential explanation for this observation lies in the “select exactly T” rule inherent in the select-N format. This rule restricts the response space, preventing other invalid RCs from occurring. For instance, in a select-2 item, once a respondent chooses two options, they are precluded from selecting any further options, thereby limiting how local dependence can influence choices for other options. Another specific case concerns the select-N versions of SAMC items (e.g., empirical items 2, 8, 10). Since their correct answers require the selection of either only one option or four options, these items are functionally equivalent to a SAMC format. Consequently, the MRM-LD model reduces to an NRM for these items, negating the need to estimate additional local dependence parameters.
${a}_{jo}^{\ast }$
parameters from MRM-LD showed that CMS items exhibited stronger local dependence characteristics. This dependence might be influenced by test taking strategies, where respondents focus more on the logical relationships between options to select the most appropriate combination. Consequently, this strategic approach by respondents often leads to larger local dependence parameters for CMS compared to MTF items. Conversely, the discrete response format of MTF items suggests that respondents respond options independently, potentially leading to less influence from test taking strategies and cues (Kreiter & Frisbie, Reference Kreiter and Frisbie1989), thereby exhibiting weaker local dependence. In contrast to MTF and CMS, the empirical results indicated that the select-N format yielded lower local dependence, although no significant difference was found when compared to MTF. A potential explanation for this observation lies in the “select exactly T” rule inherent in the select-N format. This rule restricts the response space, preventing other invalid RCs from occurring. For instance, in a select-2 item, once a respondent chooses two options, they are precluded from selecting any further options, thereby limiting how local dependence can influence choices for other options. Another specific case concerns the select-N versions of SAMC items (e.g., empirical items 2, 8, 10). Since their correct answers require the selection of either only one option or four options, these items are functionally equivalent to a SAMC format. Consequently, the MRM-LD model reduces to an NRM for these items, negating the need to estimate additional local dependence parameters.
However, it is crucial to temper these findings with a note of caution. Results from simulation study 3 indicated that when the data-generating model was the standard MRM, which implies the absence of local dependence, the MRM-LD exhibited a slight tendency to falsely detect local dependence. This tendency was particularly evident at smaller sample sizes (i.e., N = 250 and N = 500). Therefore, when sample sizes are limited, the interpretation of small estimated local dependence parameters (e.g. $\widehat{a_j^{\ast }}<0.25$
) requires careful consideration.
$\widehat{a_j^{\ast }}<0.25$
) requires careful consideration.
7.4 Potential model compatibility issues with the MRM and MRM-LD
Despite the successful implementation of parameter estimation for both MRM-LD and MRM in this study, and the validation of the new models’ accuracy through simulation and empirical studies, the proposed framework still faces several computational challenges. For instance, when fitting empirical data, the computational cost of the new models significantly increases. On an AMD 9950X CPU, with two MCMC chains running in parallel, the MRM-LD required 34 minutes and MRM took 22 minutes, in contrast to GRMPS, which only needed 11.5 minutes.
Moreover, the current research primarily focused on three typical MR item formats with fewer than 10 options. However, technology-enhanced innovative MR items (e.g., highlighting and drag-and-drop items, Kang et al., Reference Kang, Han, Kim and Kao2022) often involve more options, posing more complex modeling challenges. When the number of options in an MR item exceeds 10, the number of possible RCs can reach thousands or even tens of thousands (e.g., a 12-option MTF item corresponds to ${2}^{12}=4096$
RCs), leading to computational difficulties in the categorical distribution sampling process. The current MCMC-based Bayesian estimation method faces efficiency bottlenecks due to the exponential increase in computational complexity. To address this, future research should develop more efficient parameter estimation strategies, such as replacing MCMC algorithms with more efficient alternatives like the EM algorithm or variational inference (Natesan et al., Reference Natesan, Nandakumar, Minka and Rubright2016), to meet the time requirements for parameter estimation in practical assessments.
${2}^{12}=4096$
RCs), leading to computational difficulties in the categorical distribution sampling process. The current MCMC-based Bayesian estimation method faces efficiency bottlenecks due to the exponential increase in computational complexity. To address this, future research should develop more efficient parameter estimation strategies, such as replacing MCMC algorithms with more efficient alternatives like the EM algorithm or variational inference (Natesan et al., Reference Natesan, Nandakumar, Minka and Rubright2016), to meet the time requirements for parameter estimation in practical assessments.
Beyond that, not all possible RCs in the ${\boldsymbol{Z}}_j$
matrix are consistently observed in real test scenarios, especially when sample sizes are small and the number of options is large. This situation warrants further investigation. Although the MRM and MRM-LD define parameters at the option level rather than the RC level, their parameter identifiability can still be compromised under certain conditions. One such condition occurs when a particular option is consistently either selected or unselected across all observed RCs. In this case, the parameter for that option cannot be identified, and it is necessary to remove the corresponding column from
${\boldsymbol{Z}}_j$
matrix are consistently observed in real test scenarios, especially when sample sizes are small and the number of options is large. This situation warrants further investigation. Although the MRM and MRM-LD define parameters at the option level rather than the RC level, their parameter identifiability can still be compromised under certain conditions. One such condition occurs when a particular option is consistently either selected or unselected across all observed RCs. In this case, the parameter for that option cannot be identified, and it is necessary to remove the corresponding column from ${\boldsymbol{Z}}_j$
matrix. Another scenario arises when options within an RC are highly collinear, such as when option 1 and option 2 are always co-selected or co-rejected). This collinearity prevents the models from correctly separating options’ unique contributions and potentially rendering the models non-identifiable. Consequently, the MRM and MRM-LD may not be suitable for type K multiple-choice items (Albanese, Reference Albanese1982, Reference Albanese1993), where the number of possible RCs is very limited and collinearity among options is a common issue. In such cases, one potential solution is to retain only one corresponding column in the
${\boldsymbol{Z}}_j$
matrix. Another scenario arises when options within an RC are highly collinear, such as when option 1 and option 2 are always co-selected or co-rejected). This collinearity prevents the models from correctly separating options’ unique contributions and potentially rendering the models non-identifiable. Consequently, the MRM and MRM-LD may not be suitable for type K multiple-choice items (Albanese, Reference Albanese1982, Reference Albanese1993), where the number of possible RCs is very limited and collinearity among options is a common issue. In such cases, one potential solution is to retain only one corresponding column in the ${\boldsymbol{Z}}_j$
matrix.
${\boldsymbol{Z}}_j$
matrix.
Additionally, existing models, based on the ${\boldsymbol{Z}}_j$
matrix, strictly constrain the combination rules for RCs (e.g., forcing a specific number of options to be selected in select-N items). While such violations were not observed in the computerized administration of our empirical study, they are a concern in actual assessments, especially paper-and-pencil tests, where respondents may violate these constraints (e.g., selecting too many, too few, or invalid combinations). For instance, if a respondent mistakenly selects three options in a select-2 item, the model cannot effectively process such data due to its lack of definition for anomalous RCs, leading to unattainable parameter estimates. One potential approach is to treat anomalous RCs as missing data. However, when the proportion of anomalous RCs is high, this might reflect a systematic behavior. In such cases, anomalous RCs could be modeled as response styles (Albanese, Reference Albanese1993; Brassil & Couch, Reference Brassil and Couch2019; Henninger & Meiser, Reference Henninger and Meiser2020), characterizing the psychological attributes underlying these aberrant responses.
${\boldsymbol{Z}}_j$
matrix, strictly constrain the combination rules for RCs (e.g., forcing a specific number of options to be selected in select-N items). While such violations were not observed in the computerized administration of our empirical study, they are a concern in actual assessments, especially paper-and-pencil tests, where respondents may violate these constraints (e.g., selecting too many, too few, or invalid combinations). For instance, if a respondent mistakenly selects three options in a select-2 item, the model cannot effectively process such data due to its lack of definition for anomalous RCs, leading to unattainable parameter estimates. One potential approach is to treat anomalous RCs as missing data. However, when the proportion of anomalous RCs is high, this might reflect a systematic behavior. In such cases, anomalous RCs could be modeled as response styles (Albanese, Reference Albanese1993; Brassil & Couch, Reference Brassil and Couch2019; Henninger & Meiser, Reference Henninger and Meiser2020), characterizing the psychological attributes underlying these aberrant responses.
Furthermore, the directional constraint on local dependence in the MRM-LD model, where correct options ${W}_{jo}=1$
and incorrect options
${W}_{jo}=1$
and incorrect options ${W}_{jo}=-1$
, may pose adaptability issues in non-cognitive assessment contexts. For example, in attitude surveys or value assessments (Golubovich et al., Reference Golubovich, Seybert, Martin-Raugh, Naemi, Vega and Roberts2017; Kunz & Fuchs, Reference Kunz and Fuchs2019; Smyth et al., Reference Smyth, Dillman, Christian and Stern2006), item options do not have clear “correct” or “incorrect” distinctions, making it difficult to predefine the direction of local dependence. This limitation might weaken the MRM-LD’s applicability to non-cognitive tests. Future research could explore relaxing this structural constraint on the direction of local dependence to broaden the model’s applicability.
${W}_{jo}=-1$
, may pose adaptability issues in non-cognitive assessment contexts. For example, in attitude surveys or value assessments (Golubovich et al., Reference Golubovich, Seybert, Martin-Raugh, Naemi, Vega and Roberts2017; Kunz & Fuchs, Reference Kunz and Fuchs2019; Smyth et al., Reference Smyth, Dillman, Christian and Stern2006), item options do not have clear “correct” or “incorrect” distinctions, making it difficult to predefine the direction of local dependence. This limitation might weaken the MRM-LD’s applicability to non-cognitive tests. Future research could explore relaxing this structural constraint on the direction of local dependence to broaden the model’s applicability.
Supplementary material
To view supplementary material for this article, please visit http://doi.org/10.1017/psy.2025.10073.
Data availability statement
The test materials and detailed parameter estimates from the empirical study, the R code for data generation and the fitting process in simulation study, and the Stan code for models used in this paper are available online in the OSF repository at https://osf.io/ac5n7/. The dataset used in the empirical study is available from the first author upon reasonable request.
Author contributions
WZ contributed to conceptualization, original draft, methodology, data collection, analysis, revision, and editing. LG contributed to supervision, manuscript review, revision, and editing.
Funding statement
This research was supported by the Fundamental Research Funds for the Central Universities (SWU2109222), the Innovation Research 2035 Pilot Plan of Southwest University (SWUPilotPlan006), and the Chongqing Graduate Research Innovation Project (CYS23162).
Competing interests
The authors declare none.
A Appendix A
Abbreviations list.
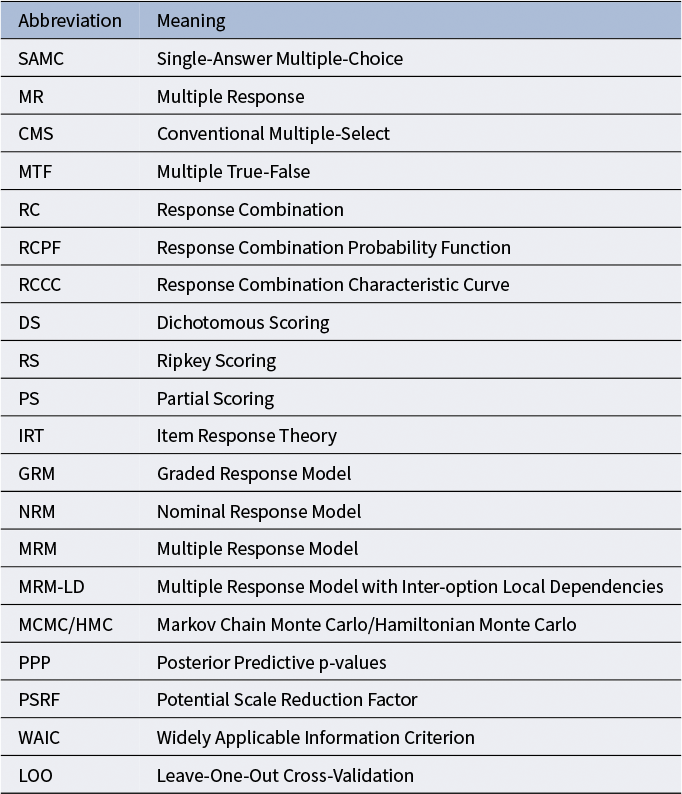
Table A1 Long description
From the top row downward, the left column lists abbreviations and the right column provides their meanings. The pairs are: S A M C is Single-Answer Multiple-Choice, M R is Multiple Response, C M S is Conventional Multiple-Select, M T F is Multiple True-False, R C is Response Combination, R C P F is Response Combination Probability Function, R C C C is Response Combination Characteristic Curve, D S is Dichotomous Scoring, R S is Ripkey Scoring, P S is Partial Scoring, I R T is Item Response Theory, G R M is Graded Response Model, N R M is Nominal Response Model, M R M is Multiple Response Model, M R M dash L D is Multiple Response Model with Inter-option Local Dependencies, M C M C slash H M C is Markov Chain Monte Carlo slash Hamiltonian Monte Carlo, P P P is Posterior Predictive p-values, P S R F is Potential Scale Reduction Factor, W A I C is Widely Applicable Information Criterion, L O O is Leave-One-Out Cross-Validation.
MRM-LD item parameter distributions ( ${a}_{jo}$
and
${a}_{jo}$
and ${d}_{jo}$
) for MTF items in empirical study.
${d}_{jo}$
) for MTF items in empirical study.

Figure A1 Long description
There are 16 panels arranged in a 4 by 4 grid, each labeled Item 1 through Item 16 from top left to bottom right. Each panel contains two vertically stacked scatterplots. The top plot in each panel displays a sub j o values on the y axis, with option numbers 1 to 5 on the x axis. Triangles represent correct (upright) and incorrect (inverted) options, colored blue for matching direction with p less than 0.05, red for mismatched direction with p less than 0.05, and gray for p greater than 0.05. The bottom plot in each panel shows d sub j o values as gray circles for the same options. The y axis for a sub j o ranges from negative to positive values, while d sub j o ranges from approximately negative 2.5 to positive 2.5. A legend at the right explains triangle orientation and color coding. Most a sub j o values are blue, indicating significant matching direction, with some gray and few red points. d sub j o values are mostly centered around zero with some spread. The dashed horizontal line in each plot marks zero for reference.
MRM-LD item parameter distributions ( ${a}_{jo}$
and
${a}_{jo}$
and ${d}_{jo}$
) for select-N items in empirical study.
${d}_{jo}$
) for select-N items in empirical study.

Figure A2 Long description
There are 16 panels arranged in a 4 by 4 grid, each labeled Item 1 through Item 16 at the top. Each panel contains two vertically stacked scatter plots. The top plot in each panel shows a subscript j o values on the y axis from negative two to positive two, with option numbers one to five on the x axis. The bottom plot shows d subscript j o values on the same x axis, with y axis ranging from negative three to positive three. In the top plots, points are triangles, with upward triangles for correct options and downward triangles for incorrect options. Blue triangles indicate matching direction with p less than 0.05, red triangles indicate mismatched direction with p less than 0.05, and gray triangles indicate p greater than 0.05. In the bottom plots, all points are gray circles. The legend at the right explains triangle orientation for option type and color for direction and significance. Most items show blue triangles for correct options, with occasional red triangles and gray points. The d subscript j o plots show scattered gray points without color coding.
B Appendix B—Evaluation metrics in empirical study
The posterior predictive model checking (Béguin & Glas, Reference Béguin and Glas2001; Gelman et al., Reference Gelman, Meng and Stern1996; Sinharay, Reference Sinharay2005; Sinharay et al., Reference Sinharay, Johnson and Stern2006) was used to evaluate the absolute fit of the models to the data. A posterior predictive p-value (PPP) close to 0.5 suggests adequate model–data fit, while values below 0.05 or above 0.95 are generally considered indicative of substantial misfit (Bayarri & Berger, Reference Bayarri and Berger2000). The Pearson chi-square type discrepancy statistic used in the posterior predictive model checking was calculated for each item as:
 $$\begin{align}{D}_j=\sum \limits_{x=1}^{X_j}\sum \limits_{i=1}^N\kern0.1em \frac{{\left({I}_{ijx}-{E}_{ijx}\right)}^2}{E_{ijx}}\end{align}$$
where ${I}_{ijx}$
indicates whether person
${I}_{ijx}$
indicates whether person $i$
’s response to item
$i$
’s response to item $j$
falls into category or score level
$j$
falls into category or score level $x$
, and
$x$
, and ${E}_{ijx}$
denotes the corresponding model-predicted probability. For MRM and MRM-LD,
${E}_{ijx}$
denotes the corresponding model-predicted probability. For MRM and MRM-LD, $x$
refers to the RCs, and
$x$
refers to the RCs, and ${E}_{ijx}$
is directly predicted by the model. For GRM and NRM applied to PS, RS, or DS scores,
${E}_{ijx}$
is directly predicted by the model. For GRM and NRM applied to PS, RS, or DS scores, $x$
indexed score levels, and
$x$
indexed score levels, and ${E}_{ijx}$
represents the probability of obtaining score
${E}_{ijx}$
represents the probability of obtaining score $x$
.
$x$
.
For relative model comparison, the widely applicable information criterion (WAIC) and leave-one-out cross-validation (LOO) were used in this study (Vehtari et al., Reference Vehtari, Gelman and Gabry2015). These criteria have been shown to outperform traditional MCMC-based indices such as the deviance information criterion (DIC) in the context of IRT model comparison (Luo & Al-Harbi, Reference Luo and Al-Harbi2017). The WAIC is computed as follows:
 $$\begin{align}LPPD&=\sum \limits_{i=1}^M\kern0.20em \log \left(\frac{1}{S}\sum \limits_{s=1}^S\kern0.20em P\left({y}_i|{\theta}_s\right)\right)\end{align}$$
 $$\begin{align}pWAIC=\sum \limits_{i=1}^M\kern0.20em {\mathrm{Var}}_{\mathrm{post}}\left(P\left({y}_i|{\theta}_s\right)\right)\end{align}$$
 $$\begin{align}WAIC=-2\times LPPD+2\times pWAIC\end{align}$$
where $S$
denotes the total number of samples from posterior distribution and
$S$
denotes the total number of samples from posterior distribution and $M$
represents the total number of observations. The LOO is calculated as:
$M$
represents the total number of observations. The LOO is calculated as:
 $$\begin{align}\displaystyle \begin{array}{c} LPP{D}_{LOO}=\sum \limits_{i=1}^M\kern0.20em \log \left(\frac{1}{S}\sum \limits_{s=1}^S\kern0.20em P\left({y}_i|{\theta}_{-i,s}\right)\right)\end{array}\end{align}$$
 $$\begin{align}LOO=-2\times LPP{D}_{LOO}\ \ \ \qquad \end{align}$$
where ${\theta}_{-i,s}$
is the
${\theta}_{-i,s}$
is the $s$
-th simulated value from the posterior distribution, conditional on the exclusion of the i-th data point from the analysis.
$s$
-th simulated value from the posterior distribution, conditional on the exclusion of the i-th data point from the analysis.
It should be noted that different models are designed to handle distinct types of data, leading to differing likelihood functions $P\left({y}_i\mid \theta \right)$
. Consequently, the WAIC and LOO values are not directly comparable across models that utilize fundamentally different data formats. However, since the RC data used in MRM and MRM-LD are structurally nested within the scores generated by conventional scoring methods, the likelihoods based on RCs can be aggregated into PS, RS, and DS formats through appropriate scoring transformations. This enables meaningful comparisons between the proposed and traditional models across multiple data types.
$P\left({y}_i\mid \theta \right)$
. Consequently, the WAIC and LOO values are not directly comparable across models that utilize fundamentally different data formats. However, since the RC data used in MRM and MRM-LD are structurally nested within the scores generated by conventional scoring methods, the likelihoods based on RCs can be aggregated into PS, RS, and DS formats through appropriate scoring transformations. This enables meaningful comparisons between the proposed and traditional models across multiple data types.
Specifically, the likelihood at the RC level is defined as $P\left({Y}_{RC}=x\mid \theta \right)$
. The likelihood for each scoring method can then be derived by summing the likelihoods of all RCs that map to the same score
$P\left({Y}_{RC}=x\mid \theta \right)$
. The likelihood for each scoring method can then be derived by summing the likelihoods of all RCs that map to the same score $k$
under that method:
$k$
under that method:
 $$\begin{align}P\left({Y}_{PS}=k|\theta \right)=\sum \limits_{x=1}^X\kern0.1em P\left({Y}_{RC}=x|\theta \right)\times I\left({Y}_{PS}=k|{Y}_{RC}=x\right)\end{align}$$
 $$\begin{align}P\left({Y}_{RS}=k|\theta \right)=\sum \limits_{x=1}^X\kern0.1em P\left({Y}_{RC}=x|\theta \right)\times I\left({Y}_{RS}=k|{Y}_{RC}=x\right)\end{align}$$
 $$\begin{align}P\left({Y}_{DS}=k|\theta \right)=\sum \limits_{x=1}^X\kern0.1em P\left({Y}_{RC}=x|\theta \right)\times I\left({Y}_{DS}=k|{Y}_{RC}=x\right)\end{align}$$
Here, $I\left(\cdot \right)$
represents an indicator function, which equals 1 if the specified condition is satisfied and 0 otherwise. For example,
$I\left(\cdot \right)$
represents an indicator function, which equals 1 if the specified condition is satisfied and 0 otherwise. For example, $I\left({Y}_{PS}=k|{Y}_{RC}=x\right)$
equals 1 if RC
$I\left({Y}_{PS}=k|{Y}_{RC}=x\right)$
equals 1 if RC $x$
corresponds to a score of
$x$
corresponds to a score of $k$
under the PS scoring methods. These transformed likelihood values are subsequently substituted into Formulas (9)–(13) to compute the corresponding WAIC and LOO values.
$k$
under the PS scoring methods. These transformed likelihood values are subsequently substituted into Formulas (9)–(13) to compute the corresponding WAIC and LOO values.
Furthermore, marginal IRT reliability was calculated to evaluate the overall measurement precision of the models (Green et al., Reference Green, Bock, Humphreys, Linn and Reckase1984; Zu & Kyllonen, Reference Zu and Kyllonen2020). The reliability coefficient was computed directly from the MCMC posterior estimates using the formula:
 $$\begin{align}\mathrm{Reliability}=\frac{\mathrm{Var}\left({\hat{\theta}}\right)}{\mathrm{Var}\left({\hat{\theta}}\right)+E\left[\mathrm{PSD}{\left(\theta \right)}^2\right]}\end{align}$$
where $\mathrm{Var}\left({\hat{\theta}}\right)$
denotes the variance of the posterior mean ability estimates and
$\mathrm{Var}\left({\hat{\theta}}\right)$
denotes the variance of the posterior mean ability estimates and $E\left[\mathrm{PSD}{\left(\theta \right)}^2\right]$
represents the mean of the squared posterior standard deviations.
$E\left[\mathrm{PSD}{\left(\theta \right)}^2\right]$
represents the mean of the squared posterior standard deviations.
Additionally, this study extends the computation of the information function to the MRM and MRM-LD and compares the test information functions derived from fitting these different models to various data types. The item information function for the GRM, following Ostini and Nering (Reference Ostini and Nering2006), is given by:
 $$\begin{align}I\left(\theta \right)=\sum \limits_{k=0}^{K_j}\frac{{\left({P}_{jk\mid \theta}^{\ast^{\prime }}-{P}_{jk+1\mid \theta}^{\ast^{\prime }}\right)}^2}{P_{jk\mid \theta}^{\ast }-{P}_{jk+1\mid \theta}^{\ast }}\end{align}$$
where $k$
represents the score level for item
$k$
represents the score level for item $j$
,
$j$
, ${K}_j$
is the maximum score for the item,
${K}_j$
is the maximum score for the item, ${P}_{jk\mid \theta}^{\ast }$
is the probability of scoring at least
${P}_{jk\mid \theta}^{\ast }$
is the probability of scoring at least $k$
given
$k$
given $\theta$
, and
$\theta$
, and ${P}_{jk\mid \theta}^{\ast^{\prime }}$
is its partial derivative with respect to
${P}_{jk\mid \theta}^{\ast^{\prime }}$
is its partial derivative with respect to $\theta$
. For the NRM, the information function is calculated as described by Lima Passos et al. (Reference Lima Passos, Berger and Tan2007):
$\theta$
. For the NRM, the information function is calculated as described by Lima Passos et al. (Reference Lima Passos, Berger and Tan2007):
 $$\begin{align}I\left(\theta \right)=\sum \limits_{k=1}^{K_j}\kern0.20em \left({a}_{jk}^2{P}_{jk\mid \theta}\right)-{\left(\sum \limits_{k=1}^{K_j}\kern0.20em {a}_{jk}{P}_{jk\mid \theta}\right)}^2\end{align}$$
where $k$
represents the category for the item,
$k$
represents the category for the item, ${K}_j$
is the number of categories for item
${K}_j$
is the number of categories for item $j$
,
$j$
, ${P}_{jk\mid \theta }$
is the probability of selecting category
${P}_{jk\mid \theta }$
is the probability of selecting category $k$
given
$k$
given $\theta$
, and
$\theta$
, and ${a}_{jk}$
is the discrimination parameter for item
${a}_{jk}$
is the discrimination parameter for item $j$
in category
$j$
in category $k$
.
$k$
.
We further extend the information function for the MRM and MRM-LD as follows:
 $$\begin{align}I\left(\theta \right)=\sum \limits_{x=1}^{X_j}\kern0.20em \left[{\left(\sum \limits_{o=1}^{O_j}\kern0.20em {Z}_{jxo}{a}_{jo}\right)}^2{P}_{jx\mid \theta}\right]-{\left[\sum \limits_{x=1}^{X_j}\kern0.20em P_{jx\mid \theta}\left(\sum \limits_{o=1}^{O_j}\kern0.20em {Z}_{jxo}{a}_{jo}\right)\right]}^2\end{align}$$
where ${P}_{jx\mid \theta }$
is the probability of RC
${P}_{jx\mid \theta }$
is the probability of RC $x$
given
$x$
given $\theta$
, and all other parameters remain consistent with those defined in Formula (4) and (6).
$\theta$
, and all other parameters remain consistent with those defined in Formula (4) and (6).
Finally, to provide evidence of criterion-related validity, the latent ability $\theta$
estimated by the MRM-LD, MRM, and GRM was correlated with graded data from the last midterm physics exam. Given that the graded data were ordinal and violated the normality assumption, as indicated by the Shapiro–Wilk test (
$\theta$
estimated by the MRM-LD, MRM, and GRM was correlated with graded data from the last midterm physics exam. Given that the graded data were ordinal and violated the normality assumption, as indicated by the Shapiro–Wilk test ( $W=0.906,p<0.001$
), Spearman’s rank-order correlation was employed for the analysis.
$W=0.906,p<0.001$
), Spearman’s rank-order correlation was employed for the analysis.



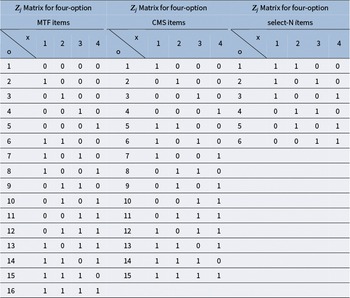


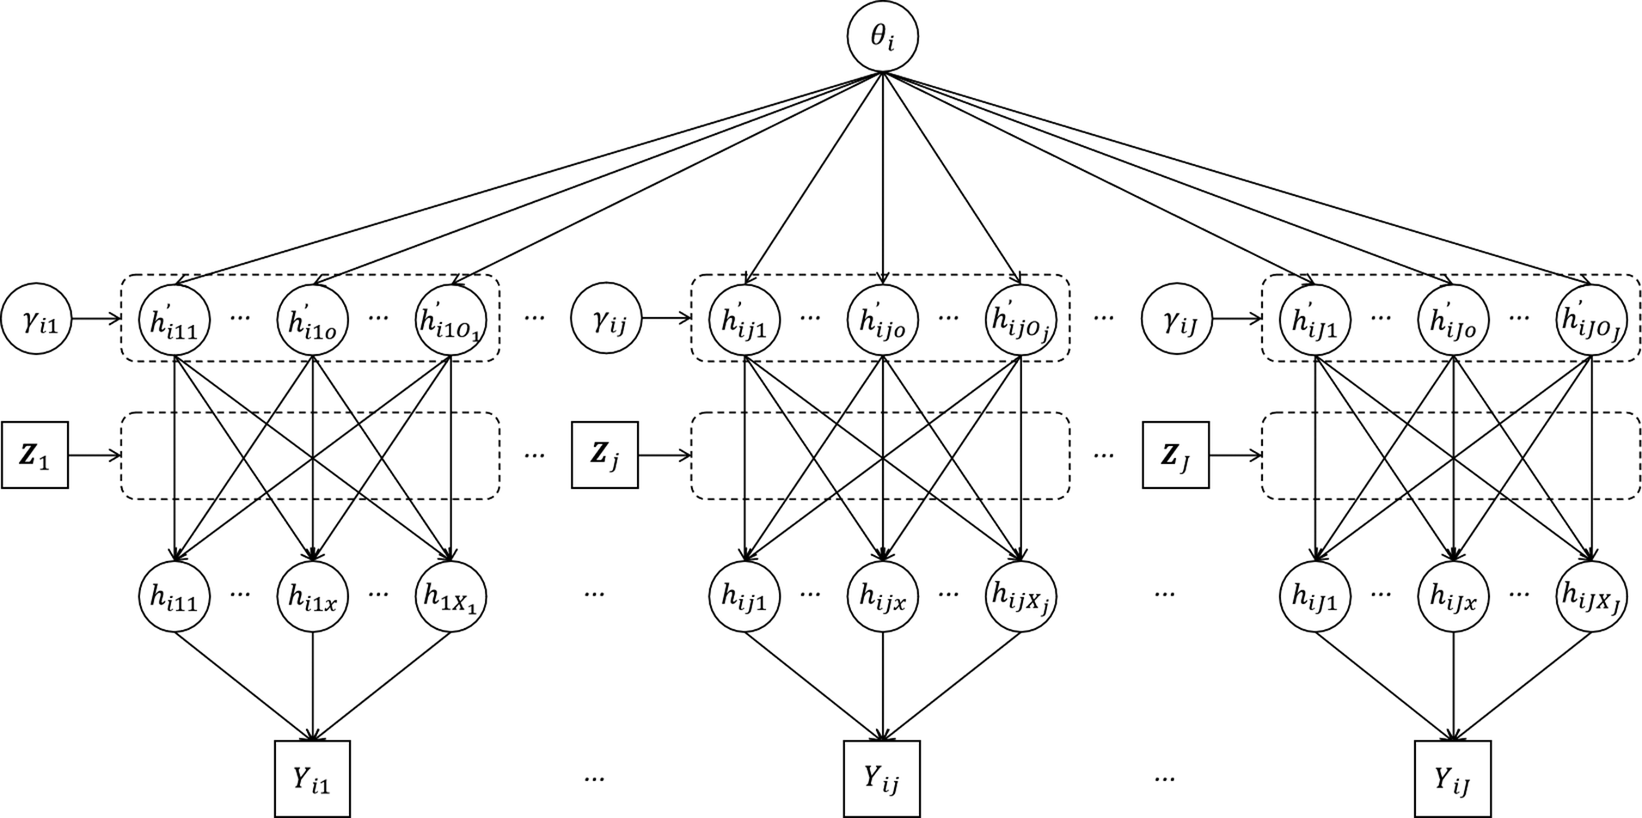
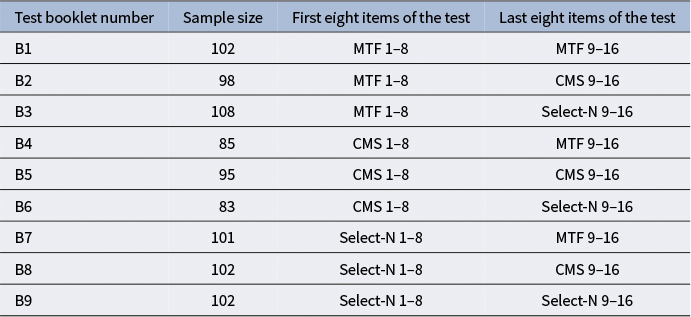


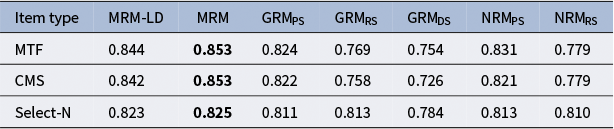
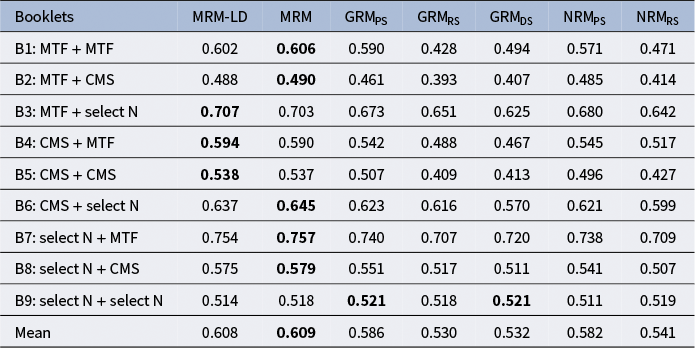

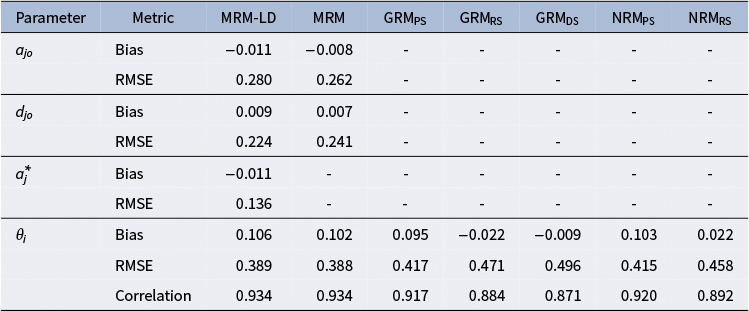
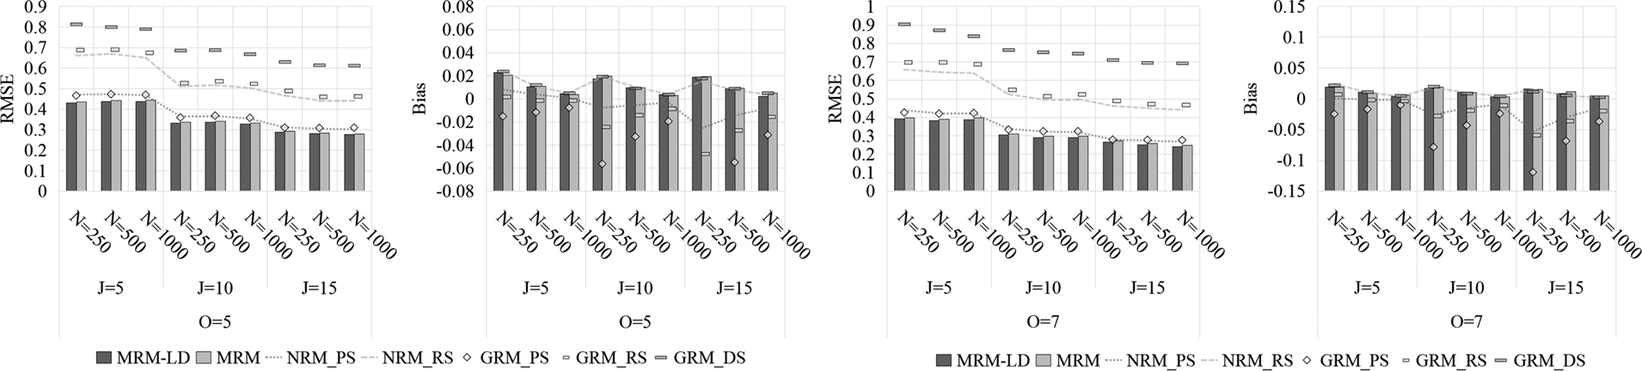

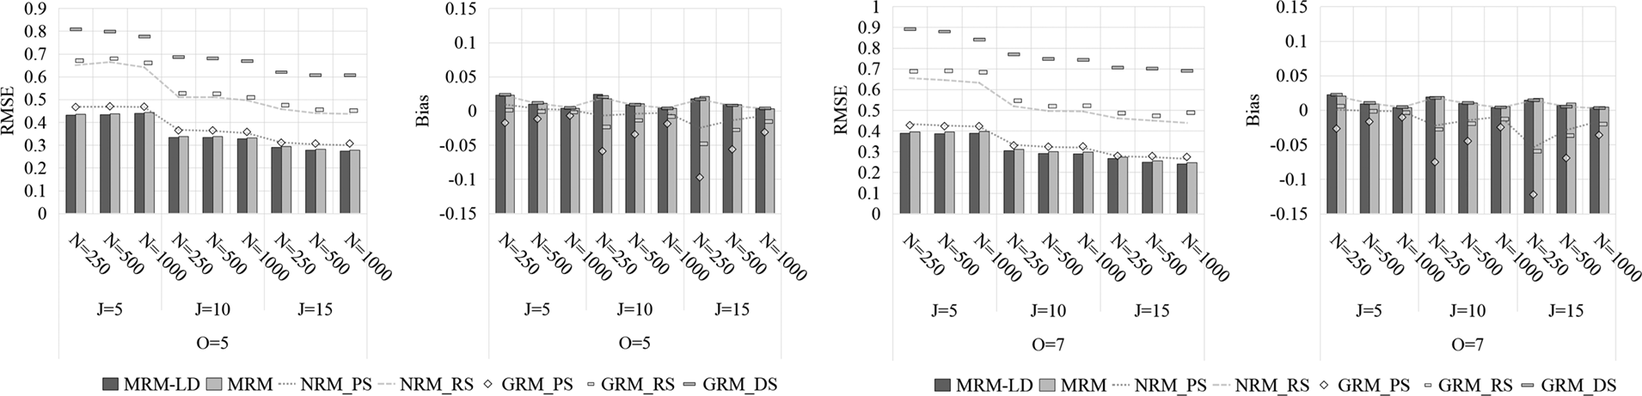

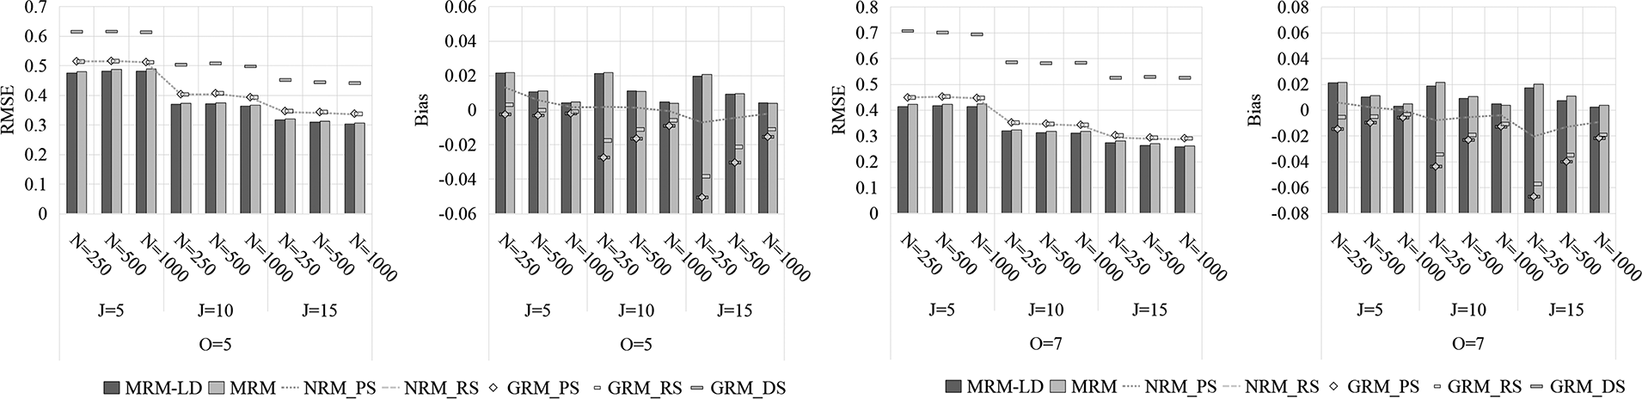


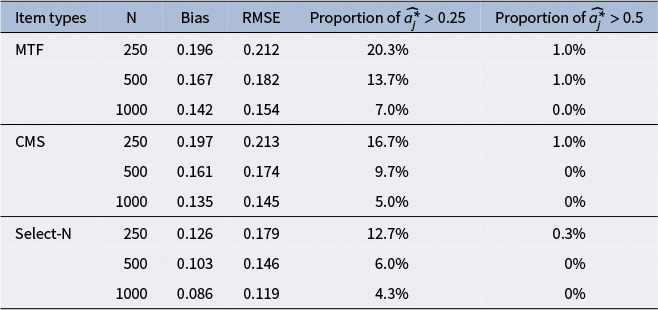

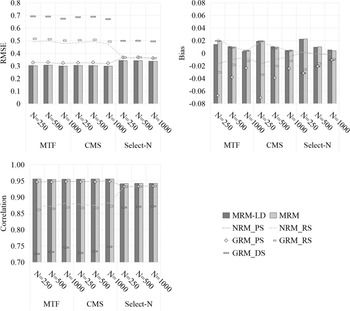


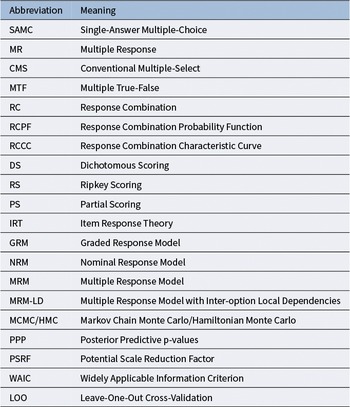


 Open access

