

How do voters react to the individual characteristics of crises following events such as pandemics, floods or global financial market crashes?Footnote 1 Understanding how voters react to such crises is especially important because the climate-related causes of events such as droughts and floods are predicted to occur more frequently over the next decades as a result of global climate change (Arnell and Gosling Reference Arnell and Gosling2016). In the aftermath of crises that follow these events, governments may find they are sanctioned by voters, because crises can provide voters with important information concerning the qualities of incumbents in handling crisis or reasons to hold them responsible for the ensuing hardships.
The existing literature provides a time-conflicting perspective on how voters behave after a crisis (Bechtel and Mannino Reference Bechtel and Mannino2022: 260f; Heersink et al. Reference Heersink, Jenkins, Olson and Peterson2022: 1226). In one account, voters are suspected of engaging in blind retrospection (Achen and Bartels Reference Achen and Bartels2016), by holding governments to account for the occurrence of severe crises beyond a government’s control (see also De Vries et al. Reference De Vries, Bakker, Hobolt and Arceneaux2021; Healy et al. Reference Healy, Malhotra and Cecilia Hyunjung2010; Leigh Reference Leigh2009; Wolfers Reference Wolfers2002).Footnote 2 However, extensive evidence indicates that voters engage in an attentive retrospection (Arceneaux and Stein Reference Arceneaux and Stein2006; Gasper and Reeves Reference Gasper and Reeves2011), by holding governments to account for their performance in dealing with crises; for example, by electorally rewarding disaster relief (Bechtel and Hainmueller Reference Bechtel and Hainmueller2011; Fukumoto and Kikuta Reference Fukumoto and Kikuta2024; Healy et al. Reference Healy and Malhotra2010; Masiero and Santarossa Reference Masiero and Santarossa2021) and disaster preparedness (Arceneaux and Stein Reference Arceneaux and Stein2006). Evidence of such attentive retrospection has recently also been shown for government performance during the COVID-19 pandemic (Duch et al. Reference Duch, Loewen, Robinson and Zakharov2025). Because governments can reduce the damage caused by crises (Neumayer et al. Reference Neumayer, Plümper and Barthel2014) – for example, by investing in disaster preparedness – these events provide voters with important information regarding the competence and qualities of the incumbent, and may also give them reasonable grounds to hold the government responsible for the occurrence of a severe crisis.
What are the individual characteristics that voters rely on to form an opinion of the government’s crisis management performance and/or responsibility for the occurrence of a severe crisis? While there is substantial evidence about the effects of disaster relief spending (Fukumoto and Kikuta Reference Fukumoto and Kikuta2024; Heersink et al. Reference Heersink, Peterson and Jenkins2017; Hilbig and Riaz Reference Hilbig and Riaz2024; Klomp Reference Klomp2020; Masiero and Santarossa Reference Masiero and Santarossa2021), less is known about which other characteristics of a crisis voters rely on to infer government responsibility for the event itself. Investigating how voters come to form an assessment of government performance and responsibility after a crisis is particularly salient, considering that recent replications of observational studies (Fowler and Montagnes Reference Fowler and Montagnes2023; Graham et al. Reference Graham, Huber, Malhotra and Cecilia Hyunjung2023) have shown that not all effects could be replicated and that some are substantially weaker.
This article therefore contributes to our understanding of electoral accountability after a crisis by focusing on the individual characteristics (i.e. the amount of disaster relief, opposition criticism, monetary severity) of the crisis and analysing the logic by which voters confirm or deviate from the expectation (Healy and Malhotra Reference Healy and Malhotra2013) advanced predominantly in observational studies that disaster relief and the actions of the executive (Gasper and Reeves Reference Gasper and Reeves2011) drive performance assessments by voters. From this perspective, even severe crises are a substantial opportunity for incumbents to shore up support. Conflicting findings on electoral reward or punishment in existing research may be caused by specific characteristics of the crisis under study: whether the opposition criticised the government for the crisis, for example. Specifying which characteristics are in play might also influence existing scholarly work, because many studies on crises investigate the effects of a single crisis (e.g. Arceneaux and Stein Reference Arceneaux and Stein2006; Bechtel and Hainmueller Reference Bechtel and Hainmueller2011; De Vries et al. Reference De Vries, Bakker, Hobolt and Arceneaux2021) or multiple occurrences of the same kind of crisis, such as multiple floods or wildfires (e.g. Barredo Reference Barredo2007; Birch Reference Birch2023; Ramos and Sanz Reference Ramos and Sanz2020).
This article contributes to the literature on retrospective voting after crises by providing a causal analysis of the individual characteristics and different types of crisis involved by conducting a conjoint experiment (Hainmueller et al. Reference Hainmueller, Hopkins and Yamamoto2014) among voters in the UK. The experiment presented voters with different crisis scenarios that varied in their origin, severity, presence of blame signals and quality of government crisis management. Importantly, the experiment captured voters’ perceptions of the key causal mechanisms: government crisis management performance and government responsibility for the crisis. Because crises are generally unexpected, it is difficult to clearly discern what crisis characteristics voters rely on to make performance and responsibility judgements about incumbents. While previous studies have relied on election results to infer these causal mechanisms, this article provides direct evidence on how the individual characteristics of a crisis affect these mechanisms. In addition, the experimental set-up facilitates comparative assessments about crises with very different root causes (e.g. a storm flood versus a stock market crash) but otherwise similar effects in terms of severity or disaster relief, which may provide a starting point for future comparative research on voter behaviour after a crisis. Lastly, this article improves our understanding of voter behaviour after a crisis by focusing on whether particular voter characteristics moderate their reaction to the event.
The results show that voters focus on the government’s crisis management performance when deciding whether to re-elect the government after such events. They rely predominantly on crisis severity and the level of disaster relief spending to form their assessment of crisis management performance. In contrast, the speed of the government’s response or expert statements have little impact. In addition, voters do hold governments responsible for the severity of a crisis, and they react to blame signals by experts. It also appears that voters react more strongly to a severe crisis based on the blame signals offered by experts and the opposition.
Crises and electoral accountability
How do voters react to the occurrence of crises (Achen and Bartels Reference Achen and Bartels2016; Ashworth and De Mesquita Reference Ashworth and Bueno de Mesquita2014; Ashworth et al. Reference Ashworth, Bueno de Mesquita and Friedenberg2018; Bagues and Esteve-Volart Reference Bagues and Esteve-Volart2016; Blankenship et al. Reference Blankenship, Kennedy, Urpelainen and Yang2021; Fowler and Hall Reference Fowler and Hall2018; Healy et al. Reference Healy, Malhotra and Cecilia Hyunjung2010)? Events such as floods, hurricanes and tornadoes (Abney and Hill Reference Abney and Hill1966; Bechtel and Hainmueller Reference Bechtel and Hainmueller2011; Birch Reference Birch2023; Cole et al. Reference Cole, Healy and Werker2012; Healy et al. Reference Healy and Malhotra2010; Hilbig and Riaz Reference Hilbig and Riaz2024); earthquakes (Masiero and Santarossa Reference Masiero and Santarossa2021); wildfires (Ramos and Sanz Reference Ramos and Sanz2020); economic events (Healy et al. Reference Healy and Malhotra2010; Leigh Reference Leigh2009; Wolfers Reference Wolfers2002); and pandemics (Duch et al. Reference Duch, Loewen, Robinson and Zakharov2025) can lead to crises and have a considerable effect on the popularity and electoral success of governments.
Electoral punishment or reward for crises has been described as problematic from the perspective of representative democracy, insofar as voters might engage in blind retrospection (Achen and Bartels Reference Achen and Bartels2016) and hold governments responsible for the occurrence of crises outside of the government’s control. Accordingly, governments are perceived to be in danger of being voted out of office for events whose occurrence is argued to be beyond their control. Similarly, governments may randomly gain a boost in support because a crisis passes them by. One such example could be observed during the recent COVID-19 pandemic, in which government support increased in countries that were initially spared from having high numbers of cases (De Vries et al. Reference De Vries, Bakker, Hobolt and Arceneaux2021). However, from the perspective of retrospective voting, even if the occurrence of some events that cause severe crises is outside a government’s control, the consequences of these events, and whether a severe crisis develops, are informative for voters (attentive retrospection), because they help differentiate good governments from bad ones and can be used to infer future performance (Ashworth et al. Reference Ashworth, Bueno de Mesquita and Friedenberg2018; Fearon Reference Fearon, Przeworski, Stokes and Manin1999; Gasper and Reeves Reference Gasper and Reeves2011).
A majority of studies on crises (Bechtel and Hainmueller Reference Bechtel and Hainmueller2011; Cole et al. Reference Cole, Healy and Werker2012; Gasper and Reeves Reference Gasper and Reeves2011; Healy et al. Reference Healy, Malhotra and Cecilia Hyunjung2010) provide evidence that voters are attentive to the performance of governments in managing these crises. The most well-documented evidence of such performance-based sanctions concerns electoral reward for disaster declarations and for the amount of disaster relief distributed after a crisis (see Fukumoto and Kikuta Reference Fukumoto and Kikuta2024; Heersink et al. Reference Heersink, Peterson and Jenkins2017; Hilbig and Riaz Reference Hilbig and Riaz2024; Klomp Reference Klomp2020; Masiero and Santarossa Reference Masiero and Santarossa2021). These findings suggest that rather than simply holding the government responsible for a severe crisis, voters react to particular characteristics of a crisis that provide cues about the incumbent’s qualities (such as the amount of disaster relief distributed).Footnote 3 From this perspective, and similar to economic conditions, crises provide an opportunity to learn about government competence in general (Alesina and Rosenthal Reference Alesina and Rosenthal1995).
In summary, the existing literature on crises provides predominant evidence for performance-based sanctions by voters (Heersink et al. Reference Heersink, Jenkins, Olson and Peterson2022, 1226). However, it is still unclear which characteristics of a crisis voters rely on to make their performance judgements. While there is substantial evidence on the effects of disaster relief spending, less is known about which other characteristics of the crisis voters rely on to infer government responsibility for it. For instance, do the blame signals of opposition parties and experts affect voters’ judgements about crisis performance? Are voters with certain characteristics, such as previous experience of a crisis, more likely to evaluate particular performance cues?
Investigating these questions is particularly salient, considering that recent replication studies (Fowler and Montagnes Reference Fowler and Montagnes2023; Graham et al. Reference Graham, Huber, Malhotra and Cecilia Hyunjung2023) of previous findings on crisis events have been able to only partially replicate the previously reported effects. Moreover, questions about the individual characteristics of a crisis used by voters to make judgements about the responsibility of the government for it, separate from re-election choices, have received far less attention. Previous experimental research on the blame mechanism by Neil Malhotra and Alexander Kuo (Reference Malhotra and Kuo2008), for example, has focused on partisan cues. It is therefore crucial to reach a better understanding of how voters come to form an assessment of government performance and responsibility after a crisis in order to assess the arguments advanced by observational studies.
This article contributes to existing research by directly measuring voter perceptions of government crisis management performance and government responsibility for individual characteristics of the crisis. Few previous studies have observed these central mechanisms in a direct manner – the work by Michael Becher et al. (Reference Becher, Longuet-Marx, Pons, Brouard, Foucault, Galasso, Kerrouche, León Alfonso and Stegmueller2024b), Raymond Duch et al. (Reference Duch, Loewen, Robinson and Zakharov2025) and Malhotra and Kuo (Reference Malhotra and Kuo2008) being rare exceptions – and have instead inferred the attentiveness of voters to government performance in managing crises based on vote shares after a crisis (see Achen and Bartels Reference Achen and Bartels2016: 137; Heersink et al. Reference Heersink, Peterson and Jenkins2017) or by estimating the beneficial electoral effects of disaster relief and other crisis management performance indicators (Masiero and Santarossa Reference Masiero and Santarossa2021). Measuring the causes of performance-based and responsibility-based sanctions directly in a comparative manner allows for a better evaluation of voter motivations. The following sections discuss how voters are expected to react to different characteristics of crises.
Crisis characteristics and voter behaviour
What individual characteristics of crises will voters rely on to make performance and responsibility judgements about the government? This section discusses a number of central crisis characteristics – the severity of the crisis; blame signals which indicate that a government might have been responsible for letting a crisis become more severe; and government actions during the crisis (i.e. the speed with which it responds) – that indicate good or bad crisis management.
Taking the severity of the crisis (i.e. the number of citizens affected) as a characteristic, the literature provides convincing evidence that voters are performance-oriented and do not blindly punish governments simply because crises are severe. While some studies provide evidence that governments are held responsible for the occurrence of severe crises (e.g. Achen and Bartels Reference Achen and Bartels2016), other findings on severity indicate that these cases arise due to the government performing badly in terms of crisis management (Gasper and Reeves Reference Gasper and Reeves2011). Electoral reward for disaster relief, even after a severe crisis, is a well-established finding (e.g. Bechtel and Hainmueller Reference Bechtel and Hainmueller2011; Masiero and Santarossa Reference Masiero and Santarossa2021).
While governments might lack control over how severely a crisis affects them, a failure of damage mitigation is generally limited to smaller-scale events (Neumayer et al. Reference Neumayer, Plümper and Barthel2014; Peduzzi et al. Reference Peduzzi, Dao, Herold and Mouton2009; Tselios and Tompkins Reference Tselios and Tompkins2020). As Eric Neumayer et al. (Reference Neumayer, Plümper and Barthel2014: 17) conclude, ‘Small-scale damage is often unavoidable and essentially random’. Therefore, voters might look towards the severity of the crisis after a major event as a rough informational cue to judge the crisis management performance and responsibility of the government. On the other hand, this should not be necessary when strong signals about the government’s crisis management capabilities (such as emergency measures, speed of response or provision of disaster relief) are available to voters. Therefore, assuming that voters will generally have access to more direct information about the government’s crisis management performance, the expectation is that:
Hypothesis 1 (H1): The severity of a crisis has no effect:
• on whether the government is held responsible;
• on voters’ propensity to re-elect the government.
Blame signals will be used by voters to assess the government’s culpability for the crisis and to decide whether the government should be sanctioned at the ballot box. Crises can become more severe because the government did not heed warnings by experts or because it failed to invest in preparedness measures (such as strengthening dams). In addition, politicisation by the opposition may also provide voters with a credible blame signal; the opposition might even be crucial in making severe crises salient (Achen and Bartels Reference Achen and Bartels2016: 138). After receiving such blame signals, voters should be more likely to reach the conclusion that the government is responsible for how severe the crisis became (Arceneaux and Stein Reference Arceneaux and Stein2006). The reliance on such blame signals by voters can furthermore have positive consequences for societal welfare: holding everything equal, governments will have greater incentives to invest in preparation measures against crises if the lack of preparation measures signals blame and causes voters to attribute responsibility to the government. Voters will use blame signals to conclude that the government could have done more to alleviate the severity of the crisis:
Hypothesis 2a (H2a): When voters receive visible blame signals, governments:
• are held more responsible for the crisis;
• are less likely to be re-elected.
In addition, the severity of a crisis should have a stronger effect on voters when they receive a blame signal, because this indicates that the government could have done more to reduce the severity of the crisis. Following Scott Ashworth et al. (Reference Ashworth, Bueno de Mesquita and Friedenberg2018), the combination of crisis severity and actions (or lack of actions) by politicians should be most informative for voters, because they indicate whether the severity of the crisis could have been smaller or greater compared to an alternative scenario in which politicians behaved differently. Thus,
Hypothesis 2b (H2b): When voters receive visible blame signals, they are more likely to hold the government more responsible for severe crises compared to less severe crises.
Performance signals encompass characteristics that will provide voters with information about the quality of a government’s crisis management. As previously discussed, existing research suggests that voters predominantly rely on these signals to make a choice on whether to re-elect the government after a crisis. Performance signals will first and foremost be the amount of monetary disaster relief provided by the government (Bechtel and Hainmueller Reference Bechtel and Hainmueller2011; Cole et al. Reference Cole, Healy and Werker2012; Fukumoto and Kikuta Reference Fukumoto and Kikuta2024; Healy et al. Reference Healy, Malhotra and Cecilia Hyunjung2010; Heersink et al. Reference Heersink, Peterson and Jenkins2017; Masiero and Santarossa Reference Masiero and Santarossa2021). Moreover, governments that provide such monetary relief quickly should be perceived as the more competent crisis managers than governments that provide relief with significant delay. In addition, the involvement of the head of government in directing or activating crisis responses will provide voters with another very visible performance signal. John Gasper and Andrew Reeves (Reference Gasper and Reeves2011) show that voters are attentive to emergency declaration requests from US state governors to US presidents after severe weather events. This leads to the expectation that:
Hypothesis 3 (H3): The more effectively the government addresses the crisis:
• the higher voters’ perception of the government’s performance in crisis management;
• the more likely voters are to re-elect the government.
Voter characteristics and sanctions
Not all voters necessarily react to crisis characteristics in the same way. The extent to which governments are held responsible for a crisis and whether their crisis efforts are recognised may therefore also depend on the composition of voters that are affected by the crisis.
Voters with more extensive political knowledge (Arceneaux and Stein Reference Arceneaux and Stein2006) should be more informed about the government’s capabilities and responsibilities, such as deploying emergency responders to a health outbreak, warning residents in flood areas to evacuate, or implementing financial market regulations to prevent financial crises. In turn, politically knowledgeable voters should be more likely to sanction governments when they receive blame signals that the government could have done more to reduce the severity of a crisis. This leads me to expect that:
Hypothesis 4 (H4): The higher voters’ political knowledge, the larger the effect of visible blame signals on voters’ attribution of responsibility to the government.
Further, not all voters will be experiencing a crisis for the first time. Some voters will have had to deal with such a crisis before: because they live in a flood-prone area, for instance, or because their profession is more susceptible to the effects of economic crisis. Such previous experiences or habituation effects have not received much attention in scholarly work on voter behaviour after a crisis. However, disaster prevention research has shown that prior personal experience of a natural disaster causes individuals and local communities to increase their preparedness (Castañeda et al. Reference Castañeda, Bronfman, Cisternas and Repetto2020; Onuma et al. Reference Onuma, Shin and Managi2017). In turn, voters with crisis experience might expect the government to likewise increase its preparedness after a crisis and should therefore react more strongly if the government fails to manage the same crisis type in the future. Therefore, depending on their previous personal experience, voters might react more strongly to similar crises:
Hypothesis 5a (H5a): Voters who have suffered a previous economic/health/natural crisis will for a similar crisis type:
• be less likely to re-elect the government;
• hold a lower perception of government performance.
On the other hand, one may argue that previous crisis experience allows voters to more easily discern whether governments manage crises well. Voters with previous crisis experience may therefore be more likely to react more strongly to the government’s crisis management performance in general:
Hypothesis 5b (H5b): Voters who have suffered a previous economic/health/natural crisis will react more strongly to governmental crisis management when judging the government’s performance in crisis management. Footnote 4
Research design
In order to study voter reactions to different crisis characteristics, I conducted a pre-registeredFootnote 5 discrete choice conjoint experiment. Conjoint experiments have become a standard approach in political science research for analysing decision-making when multiple salient dimensions have to be considered (Hainmueller et al. Reference Hainmueller, Hopkins and Yamamoto2014, Reference Hainmueller, Hangartner and Yamamoto2015). They are well-suited to analyse voter reactions to crises, because they allow the drawing of causal inferences about the key causal mechanisms for a variety of different crisis scenarios. Severe crises, by their nature, occur unexpectedly, and voter surveys therefore do not include questions on the mechanisms of interest: voters’ perceptions of government responsibility for the crisis and voters’ perceptions of government crisis management. Consequently, existing studies are often limited to observing changes in vote shares for the government in order to draw conclusions indirectly about both voters’ satisfaction with a government’s crisis management and whether a government is seen as responsible for the crisis. In order to overcome these limitations, the conjoint experiment confronts voters with a wide range of different crises and captures their perceptions of government performance in managing each crisis separately from their perceptions of responsibility for the severity of the crisis. Therefore, the conjoint experiment has the advantage of directly capturing the mechanisms of interest.
The conjoint experiment followed the set-up suggested by Jens Hainmueller et al. (Reference Hainmueller, Hopkins and Yamamoto2014): short news reports of two randomly generated crisis scenarios are displayed next to each other, and respondents have to make discrete choices pertaining to the comparison of the two crises. Each crisis is made up of multiple attributes (such as the speed of the government response), which can take different levels (‘following day’, ‘after a week’, ‘after a month’). The level of each attribute within a news report is fully randomised. In this conjoint design, the causal effects for each level can be non-parametrically identified (Bansak et al. Reference Bansak, Hainmueller, Hopkins, Yamamoto, Druckman and Green2021).
The conjoint experiment was conducted in 2023 among a non-probability sample of 812 adult UK nationals recruited through the provider Prolific.Footnote 6 Descriptive statistics of this sample are shown in Tables A1 and A2 in the Supplementary Material. While the mean age of the sample is very close to the UK population, female respondents and university degree holders are over-represented. In the conjoint experiment, respondents compared pairs of randomly generated crises five times. This results in an effective sample size of 4,060 (812 × 5), which provides sufficient power (Schuessler and Freitag Reference Schuessler and Freitag2020; see Figure A2 in the Supplementary Material).
Conjoint attributes and levels
In the conjoint experiment, respondents were presented with pairs of news reports about different hypothetical crisis scenarios. Following the theoretical discussion, the news reports differed along nine attributes with varying levels that resulted in changes to the news article (see Table 1). The scenario’s origin attribute reflects different events that each led to a crisis with three levels of impact (storm flood/Ebola outbreak/stock market crash) to reflect a variety of crisis origins (natural/health/economic) and enhance the realism of the experiment.
Conjoint Attributes and Levels Used for the Crises

Table 1 Long description
The table details attributes and levels used in crisis scenarios, focusing on scenario type, economic and population severity, blame signals, and government performance. Scenario types include storm floods, Ebola outbreaks, and stock market crashes, with economic impacts ranging from £300 million to £2.7 billion in damages. Population severity varies from 12,500 to 200,000 households affected. Blame signals cover predictability, government prevention efforts, and opposition politicisation, with scenarios ranging from expert warnings to surprise events. Government performance is assessed by the prime minister's involvement, speed of relief, and disaster relief funding, with relief efforts ranging from £20 million to £80 million. The table allows comparison of how different crisis attributes and levels interact, providing insights into potential crisis management strategies.
Storm floods were chosen because they are the most common natural event with crisis potential worldwide (Du et al. Reference Du, FitzGerald, Clark and Hou2010) and occur in the UK (Barredo Reference Barredo2007). Given the extensive financial industry in London, a stock market crash with wide implications is also plausible. In addition, because equity markets are efficient, they generally follow an unpredictable random walk (Durusu-Ciftci et al. Reference Durusu-Ciftci, Ispir and Kok2019; Fama Reference Fama1995; Greenwood et al. Reference Greenwood, Hanson, Shleifer and Sørensen2022) and therefore global stock market crashes are plausible as unforeseen economic crises. Finally, an Ebola outbreak was chosen as the health crisis, because the potential for an Ebola outbreak in developed countries was discussed in the middle of the 2010s after an Ebola epidemic in West Africa, leading the UK Department of Health, Public Health England and the National Health Service to publish an Ebola myth buster report (Department of Health, 2014).
The economic and health crises were linked to global causes (global financial market speculation and a global Ebola pandemic, respectively) to make the origin for each of them more external and hence similar to that of the storm flood scenario. Section A2 in the Supplementary Material provides more details on the wording of the three crises. Studying voter reactions to a variety of crisis origin scenarios allows for a greater generalisability of findings, compared to if only a single scenario had been investigated. As a later robustness check shows (see Figure C3 in the Supplementary Material), respondents were well able to compare different types of crisis to each other.
Varying levels of crisis severity were reflected, both in terms of economic severity on three levels (£300 million/£900 million/£2.7 billion) and population severity according to the number of households affected (12,500/50,000/200,000).Footnote 7
The crisis scenarios further differed through three blame signal attributes. Experts’ statements indicating three different levels of anticipation of the crisis (warning/prediction/surprise) were provided to indicate whether the government had a chance to react proactively to the crisis. To further differentiate blame signals, respondents were informed about prevention funding for the respective type of crisis in the previous year (increase in funding/reduction in funding). Finally, the crisis scenarios described the behaviour of the opposition leader on three levels (called for unity/criticised handling of the crisis/criticised preparedness for the crisis).Footnote 8
Signals about the performance of the government were treated via three different attributes: (1) the involvement of the prime minister (PM) in crisis management varied on two levels (chaired a taskforce meeting/considered convening a taskforce); (2) the speed with which the government provided disaster relief (following day/after a week/after a month); and (3) the amount of disaster relief provided by the government (£20 million/£40 million/£80 million). Table 1 provides an overview of the nine attributes and their levels.Footnote 9
Discrete choices and framing
At the beginning of the survey, respondents were informed that they would be presented with hypothetical crisis scenarios that could take place in the UK in the future. After comparing two news reports on different crises, respondents had to make three different choices on the different governments in the two crises: which government they would prefer to re-elect, which government was more responsible for the severity of the crisis, and which government handled the crisis better (Figure 1). These three choices allow for a direct assessment of the effect of crises on the key mechanisms of interest: voters’ perception of crisis performance, their perception of blame for the severity of the crisis, and the respective effect of each on vote choice.
Example of a Randomly Created Decision Screen

Figure 1 Long description
The image presents two crisis scenarios labeled as Crisis 1 and Crisis 2. Crisis 1 describes the Ebola pandemic reaching UK communities, affecting 12,500 households, with economic damages expected to reach 2.7 billion pounds. The UK government introduced an 80 million pound disaster relief fund and the prime minister chaired a meeting to address the crisis. Criticism arose from the opposition leader regarding lack of preparedness, noting increased funding for pandemic outbreaks last year. Crisis 2 details a storm causing flooding in UK areas, affecting 12,500 households, with economic damages expected to reach 300 million pounds. The UK government introduced a 30 million pound disaster relief fund and the prime minister chaired a meeting to address the crisis. Criticism from the opposition leader focused on lack of preparedness, despite increased funding for storm floods last year. Below the scenarios, three questions are posed: which government to re-elect, which is more responsible for the crisis severity and which handled the crisis better, with options for Crisis 1 or Crisis 2 government for each question.
External validity of the experiment
While the conjoint experiment provides high internal validity, external validity might be lower because participants receive full information and the scenarios are hypothetical. In order to increase external validity, the severity of the crises was modelled on past storms and floods in the UK using EM-DAT data (Delforge et al. Reference Delforge, Wathelet, Below, Sofia, Tonnelier, van Loenhout and Speybroeck2025), to ensure that the experimental scenarios were plausible (see Section A3 in the Supplementary Material). Moreover, the conjoint experiment provided information through short news texts, which more closely model real-world conditions (Auspurg and Hinz Reference Auspurg, Hinz, Keuschnigg and Wolbring2015), compared to a table representation. To make the experimental treatment even more similar to real-world news stories, photos for the different crisis scenario origins were also added. While these photos may elicit additional reactions (e.g. emotional responses), they should also make it easier for respondents to imagine the hypothetical scenarios.
Even with these efforts to increase external validity, the results from the experiment should be interpreted with caution and understood as reflecting voter behaviour when information is easily available. However, the experiment provides important information about voters’ motivations that are extremely difficult to study causally with observational data.
Survey of voter characteristics
In addition to comparing five sets of crises in the conjoint experiment, respondents were questioned about themselves to capture important characteristics for subgroup analysis.Footnote 10 They were asked about their political knowledge with three factual knowledge questions. They were also asked whether they identified with a political party, their sex, their education level and their age. Furthermore, the survey asked respondents about their personal experience with any of the three crisis types: whether their home had ever been flooded, whether a family member had been hospitalised with COVID-19 and whether they had lost their job during a recent economic crisis (i.e. in 2008–2009 or 2020).
The effect of crisis characteristics on performance-based accountability
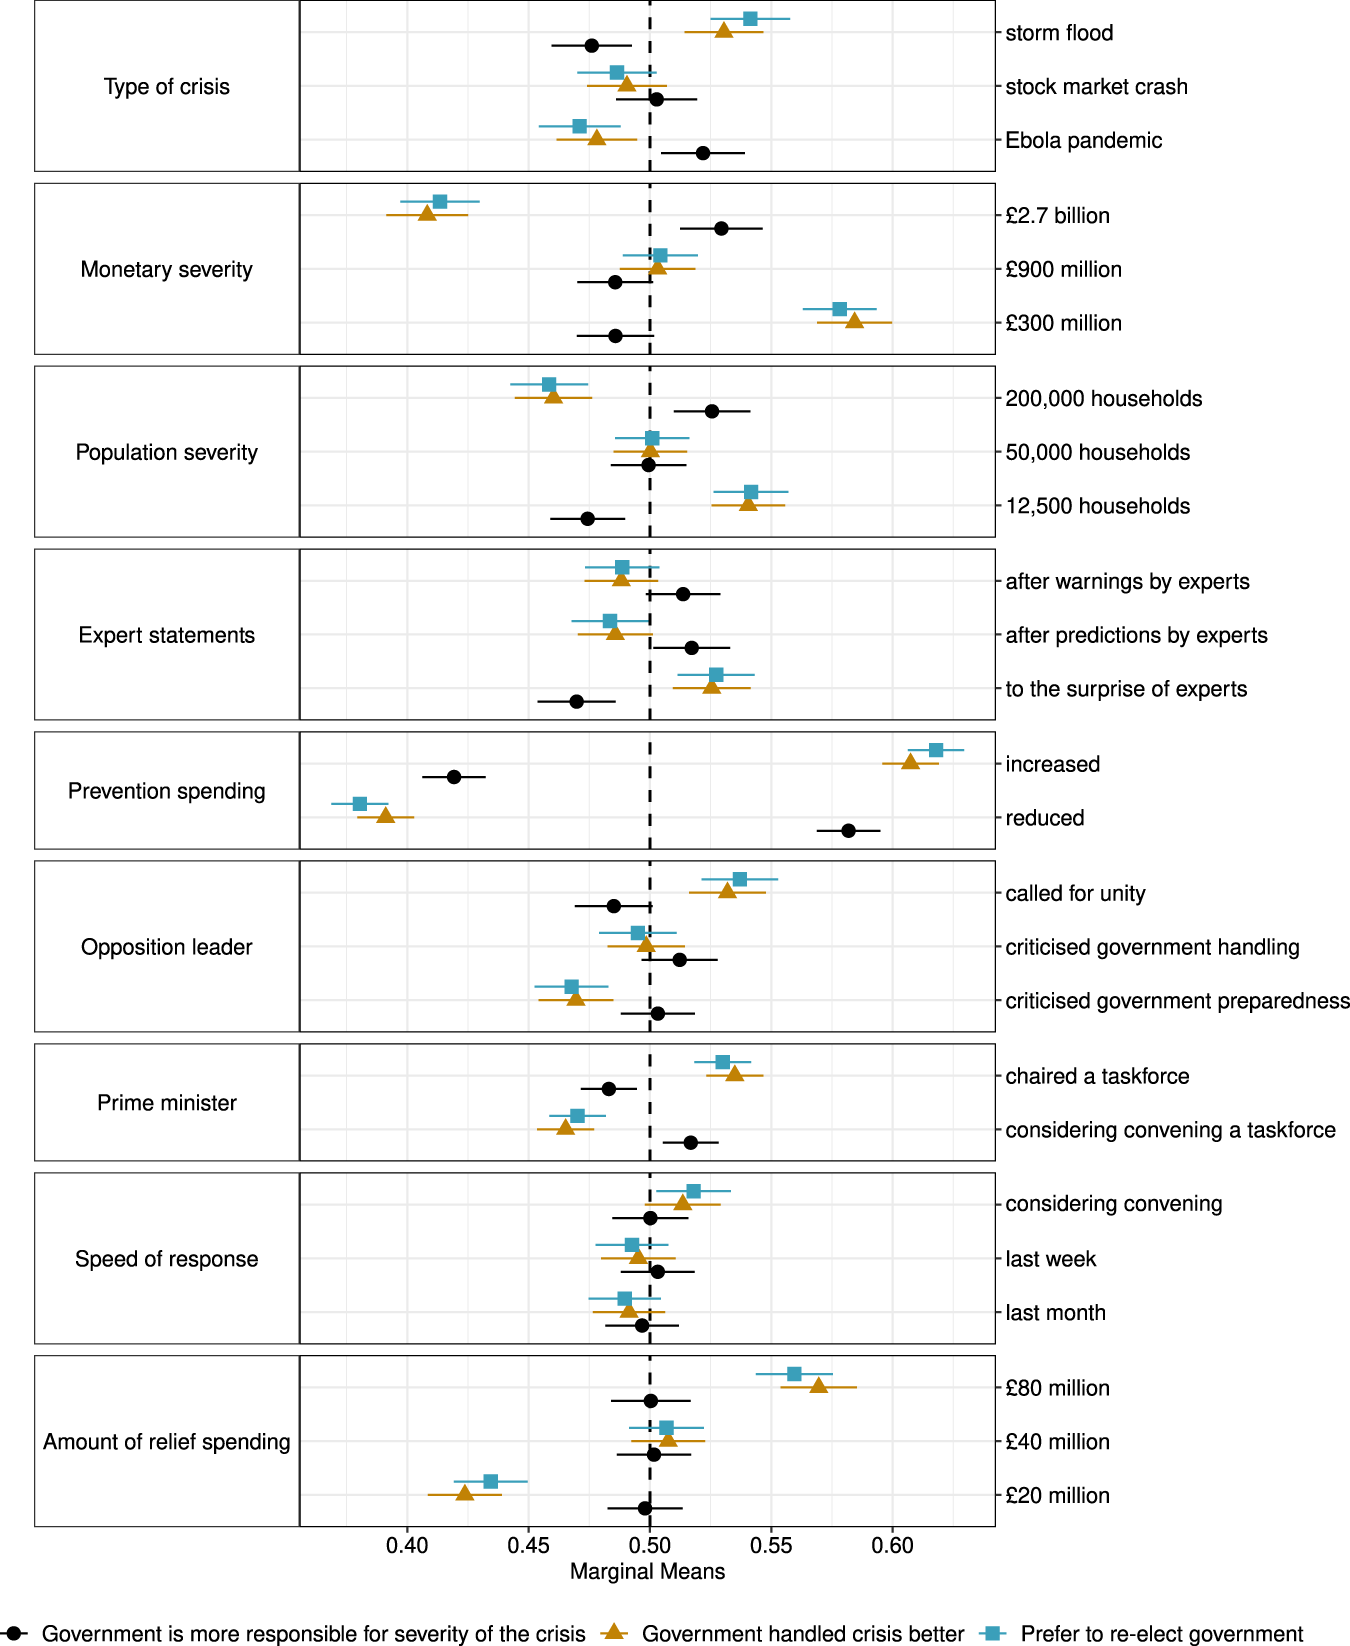
How do the multiple characteristics of a crisis affect voters’ assignment of responsibility, their perception of crisis management and their vote choice? Figure 2 shows the marginal means for all levels of the nine crisis attributes on all three outcomes of interest.Footnote 11 Pooling results from all three crisis origin scenarios make the assumption that effects are homogeneous across crises with qualitatively different origins. Given that the experiment included three crisis origin scenarios with some qualitative differences, marginal means should best be understood as average effects across these different scenarios and not as evidence for effect equivalency across scenarios.Footnote 12 Reviewing the attributes ‘Monetary severity’ and ‘Population severity’ (H1), it becomes clear that all three attributes affect voters’ attribution of blame, as well as their perceptions of crisis performance and vote choice.Footnote 13 Figure 2 provides limited support for H1.
Marginal Means of Crisis Characteristics on the Three Outcomes

Figure 2 Long description
The graph displays marginal means for various crisis characteristics across three outcomes: government responsibility for crisis severity, government handling of the crisis and preference to re-elect the government. The x-axis represents marginal means, ranging from 0.40 to 0.60. The y-axis lists crisis attributes: type of crisis, monetary severity, population severity, experts statement, prevention spending, opposition leader, prime minister, speed of response and amount of relief spending. Each attribute has specific levels, such as 'storm flood', 'stock market crash', 'ebola pandemic' for type of crisis and monetary values like '2.7 billion pounds', '900 million pounds', '300 million pounds' for monetary severity. Symbols represent different outcomes: circles for government responsibility, triangles for crisis handling and squares for re-election preference. Error bars indicate confidence intervals for each point. The graph provides a visual comparison of how different crisis attributes influence public perception and political outcomes.
The assignment of responsibility for the severity of the disaster is not affected by lower monetary damages (£300 million, £900 million), but respondents are about 2.5% more likely to assign responsibility for severity when damages reach £2.7 billion. In contrast, the number of households affected has a clearer effect on assignment of responsibility, with the likelihood of responsibility assignment increasing in a linear fashion from 47.5% when only 12,500 households are affected to 52.5% when 200,000 households are affected. Whether governments are perceived as responsible for the severity of a crisis, therefore, depends on whether the population is strongly affected or whether a crisis predominantly causes monetary damages.
The effects of both monetary severity and population severity on government re-election chances are stronger than on the attribution of responsibility. Extensive monetary damages of £2.7 billion lower the likelihood of being re-elected by 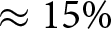 $ \approx 15{\text{\% }}$ compared to crises in which monetary damages are limited to £300 million. Population severity likewise has a linear effect on re-election chances, with re-election being about 10% less likely when 200,000 households are affected compared to crises in which only 12,500 households are affected. Figure 2 also reveals that crisis severity affects crisis management assessments in a very similar manner to re-election preferences. This indicates that respondents did use crisis severity to infer how well governments managed crises.
Somewhat surprisingly, re-election chances and crisis management evaluations are more strongly affected by monetary compared to population severity. This could be driven by the availability of a direct comparison between monetary severity against disaster relief spending to assess government actions, while no such direct reference point exists for population severity. While this comparability is fostered by the experimental design, such comparisons are also possible in real-world cases. In summary, H1 is not supported by the results of the experiment because crisis severity does affect the attribution of responsibility and re-election chances, even if the effects on attribution of responsibility are weak for monetary severity. Because crisis severity may provide informative cues to voters about the responsibility and performance of governments, the lack of support for H1 is a welcome finding, indicating that voters are consistently attentive to such cues.
Moving on to the blame signal attributes – ‘Expert statements’, ‘Prevention spending’ and politicisation by the ‘Opposition leader’ – Figure 2 shows that statements by experts about the predictability of the crisis had little effect. Neither warnings nor predictions by experts had a statistically significant effect on voter perceptions of the government’s crisis management or re-election preferences. Assignment of responsibility for the severity of the crisis was slightly increased (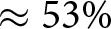 $ \approx 53{\text{\% }}$) after experts predicted the crisis. Only when experts were surprised by the crisis did this have a statistically significant effect, with respondents being less likely to hold governments responsible for the severity of the crisis (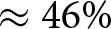 $ \approx 46{\text{\% }}$ viewed the government as responsible in these scenarios). Re-election chances increased similarly, to about 54%, when experts were surprised by the crisis. In contrast, information about the government’s past decision to increase or reduce prevention funding had a very substantial effect on re-election chances and the assignment of responsibility. Governments that had increased prevention funding were re-elected and seen as the better crisis managers in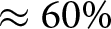 $ \approx 60{\text{\% }}$ of cases, with the reverse holding for cases in which prevention funding was decreased. The probability of being seen as responsible for the severity of the crisis was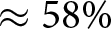 $ \approx 58{\text{\% }}$ in cases where prevention spending was reduced.
Compared to prevention spending, the behaviour of the opposition leader had no substantial effect on the assignment of responsibility for the severity of the crisis, with all governments having an almost equal chance of being seen as responsible, regardless of the opposition leader’s behaviour. In contrast, the opposition leader’s behaviour affected the government’s re-election chances and perceptions of its crisis management performance to a greater extent, with about 53% of governments being re-elected when the opposition leader called for unity and 47% of governments being re-elected when opposition leaders criticised crisis preparedness. H2a is therefore supported by the results in Figure 2, even though the results indicate that expert opinions and the behaviour of the opposition are blame signals with only a limited effect.
Reviewing the results for performance signal attributes (involvement of the PM, speed of response, disaster relief), Figure 2 shows that the results move largely in the expected directions. The involvement of the PM in a crisis taskforce increases both voters’ perception that the government has handled the crisis well (53% of governments selected) and the government’s re-election chance (52% of governments re-elected). Somewhat surprisingly, the speed of government disaster relief has no statistically significant effect on voters’ perception of crisis management performance. Only the probability of re-election is statistically significantly affected if the government releases disaster relief quickly within 1 day (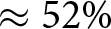 $ \approx 52{\text{\% }}$), although this effect is very close to being statistically insignificant. Turning to the amount of disaster relief spending, Figure 2 reveals a very substantial effect of more disaster relief spending on the likelihood that a government is perceived as the better crisis manager, increasing by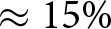 $ \approx 15{\text{\% }}$ from 42% if the government provides £20 million in disaster relief to 57% if the government provides £80 million in relief. The likelihood for re-election increases similarly, from 43% if the government provides £20 million in disaster relief to 56% if the government provides £80 million in relief. Overall, the results presented in Figure 2 support H3.
Lastly, Figure 2 indicates that respondents hold governments most responsible for crises following the Ebola origin compared to the storm flood origin. However, responsibility for the stock market crash is not statistically different from the Ebola scenario. The effect of crisis origins on attribution of responsibility is moderate, with governments in storm floods being  $ \approx 5{\text{\% }}$ less likely to receive blame for the severity compared to Ebola pandemics. Consequently, governments are also most likely to be re-elected after storm floods, with 54% of these scenarios being chosen, compared to stock market crashes (6% less likely) and the Ebola pandemic (7% less likely). However, the differences between the stock market crash and the Ebola pandemic scenario for re-election chances are once again not statistically significant.
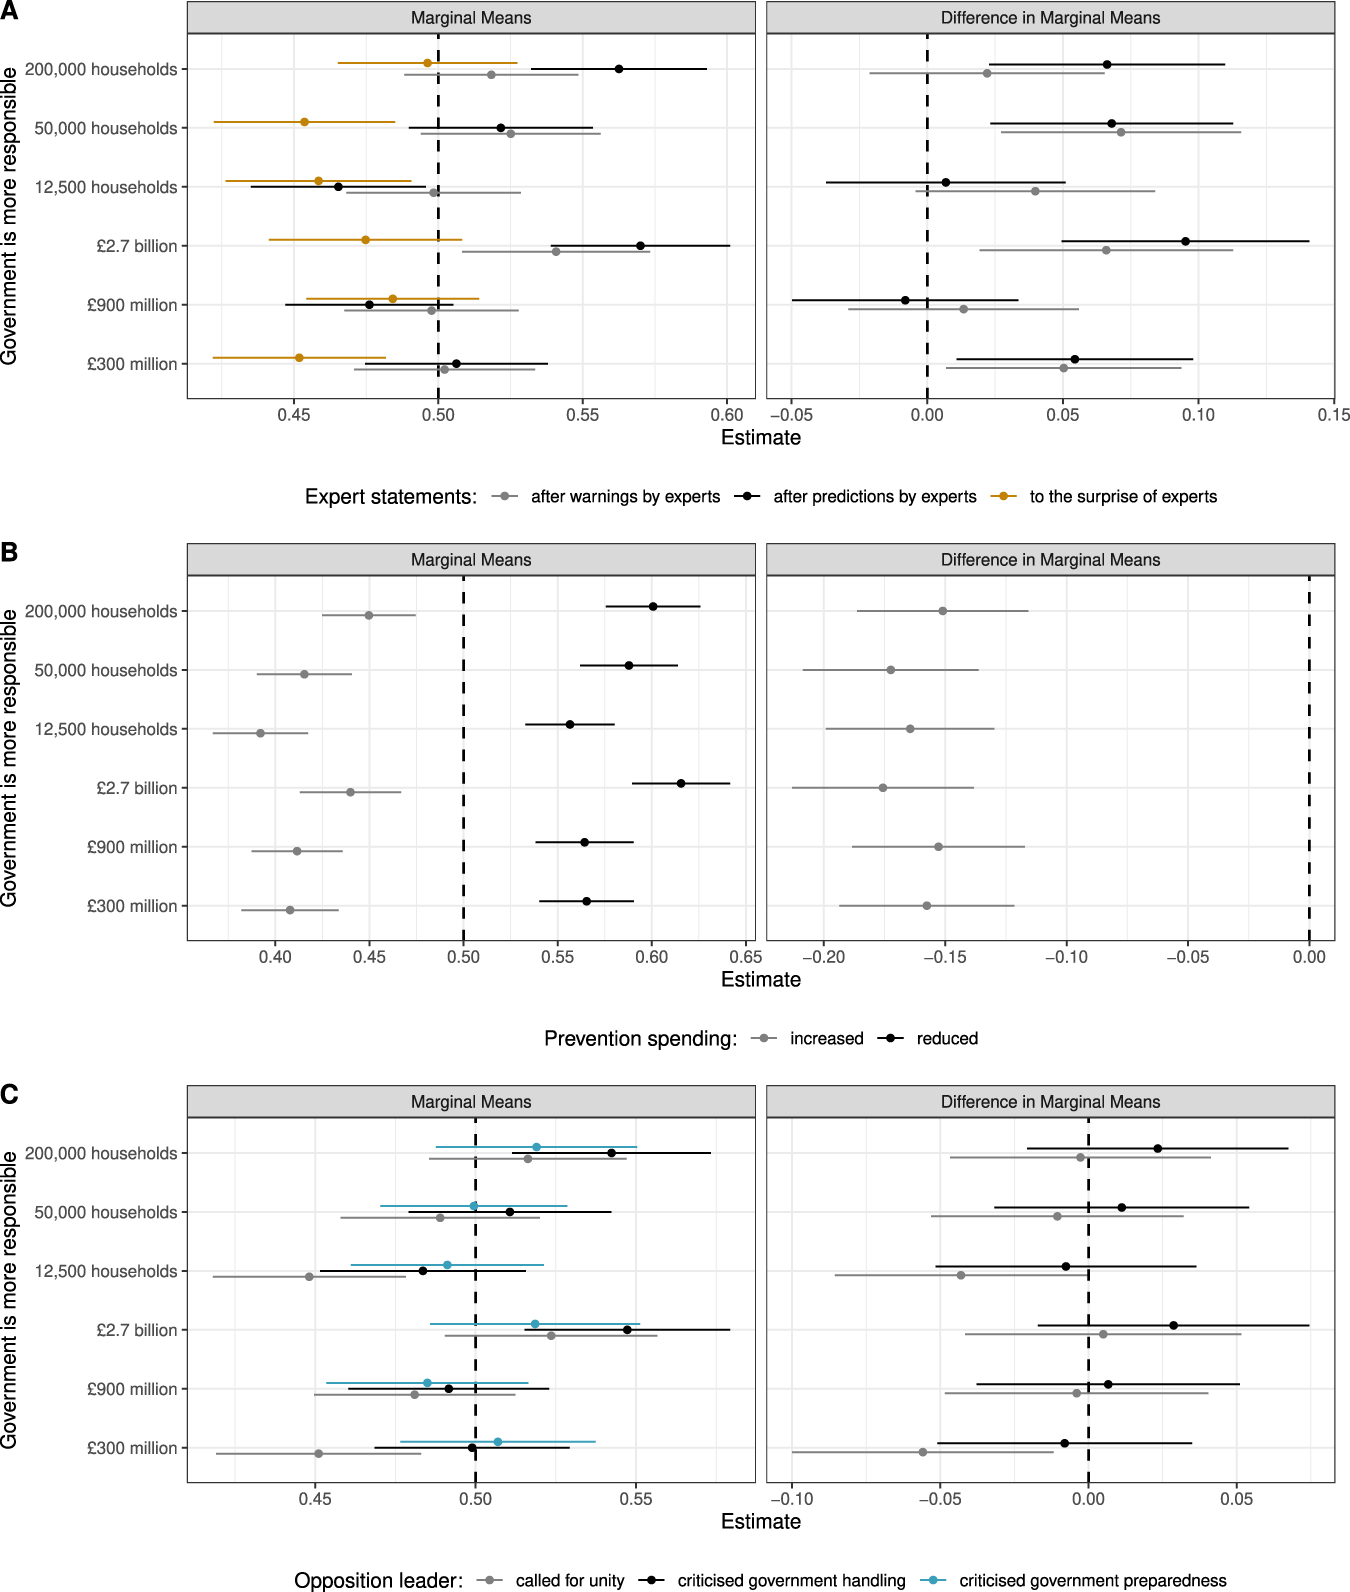
Do voters hold governments more responsible for the severity of a crisis when they have received blame signals (H2a)? Figure 3 tests this hypothesis by interacting the two severity attributes (monetary severity and population severity) with the three blame signal attributes (expert statements, prevention spending and opposition leader’s behaviour). Panel A in Figure 3 reveals that respondents were less likely to hold the government responsible for high (£2.7 billion) and low (£300 million) monetary damages when experts were surprised by the crisis, compared to crises that experts had warned about. The size of this effect ranges between a 5% and 9% reduction in the likelihood of being seen as responsible. Moreover, governments were slightly less likely to be seen as responsible (by  $ \approx 6{\text{\% }}$) for high population severity (50,000 and 200,000 households) when experts were surprised by the crisis. In contrast, Panel B in Figure 3 shows that if the government increased prevention spending prior to the crisis, respondents do not hold it accountable for even the most severe crises in the experiment. However, in both prevention increase and reduction scenarios, the pattern of severity established in Figure 2 remains the same, with respondents showing a greater probability of holding governments responsible for more severe crises. Finally, Panel C in Figure 3 reveals that governments were less likely to be seen as responsible for crisis severity when the opposition leader called for unity and monetary or population severity was low (12,500 households and £300 million). In these crises, the governments were $ \approx 5{\text{\% }}$ less likely to be seen as responsible, although confidence intervals around this point estimate indicate substantial uncertainty. Overall, these results offer moderate support for H2a and indicate that the effects of crisis severity on attribution of responsibility identified in Figure 2 are to some extent driven by cases in which respondents received blame signals that the government could have done more to alleviate the crisis.
Marginal Means and Difference in Marginal Means for the Interaction between Crisis Severity and Blame Signal Attributes on Responsibility for the Severity of the Crisis

Figure 3 Long description
The image consists of three panels labeled A, B and C. Each panel contains two plots: 'Marginal Means' and 'Difference in Marginal Means'. Panel A examines expert statements with three conditions: after warnings, after predictions and to the surprise of experts. It shows estimates for government responsibility across different crisis severities, including 200,000 households, 50,000 households, 12,500 households, 2.7 billion pounds, 900 million pounds and 300 million pounds. Panel B focuses on prevention spending, comparing increased and reduced spending, with similar crisis severity levels. Panel C analyzes the opposition leader's actions: calling for unity, criticizing government handling and criticizing government preparedness, again across the same severity levels. Each plot includes a vertical dashed line at 0.50 for marginal means and 0.00 for differences, indicating the baseline for comparison. Confidence intervals are shown for each estimate, with different line styles representing the conditions in each panel.
Do blame signals explain why crisis severity affects respondents’ perceptions of crisis management performance? Respondents may predominantly evaluate government crisis management based on crisis severity if there are clear blame signals. An exploratory analysis presented in the Supplementary Material (Figure A3) reveals that crisis severity serves as a performance signal to respondents largely independently of blame signals. However, in cases in which experts are surprised by the crisis or when the opposition calls for unity, crisis severity matters slightly less for crisis management evaluation.
What drives re-election preferences: crisis management or crisis responsibility?
To further assess voter reactions to crises, I now analyse whether government re-election preferences in the conjoint experiment are primarily driven by voters’ evaluation of government crisis management or voters’ evaluation of the government’s responsibility for the severity of the crisis. This analysis has not been pre-registered with a hypothesis and is exploratory. Based on existing research, one would expect that re-election should be predominantly driven by the quality of crisis management if voters take crises as an opportunity to learn about the qualities of incumbents.
Table 2 reveals the relative importance of crisis management and perceived responsibility for the severity of the crisis by regressing them onto the re-election preference of respondents using a linear probability model with standard errors clustered by conjoint tasks. While both crisis management and responsibility for the severity of the crisis matter for re-election preferences, crisis management was clearly a more important factor when respondents decided on which government to re-elect. Governments that are perceived to have handled their crisis better are re-elected with a probability of 86%. On the other hand, governments that are perceived as being more responsible for the severity of their crisis are only 8% less likely to be re-elected. These results indicate that voters are more concerned about a government’s ability to manage a crisis well than about whether the government may have caused a more severe crisis.
Linear Probability Model: Re-election Preference in the Conjoint Experiment
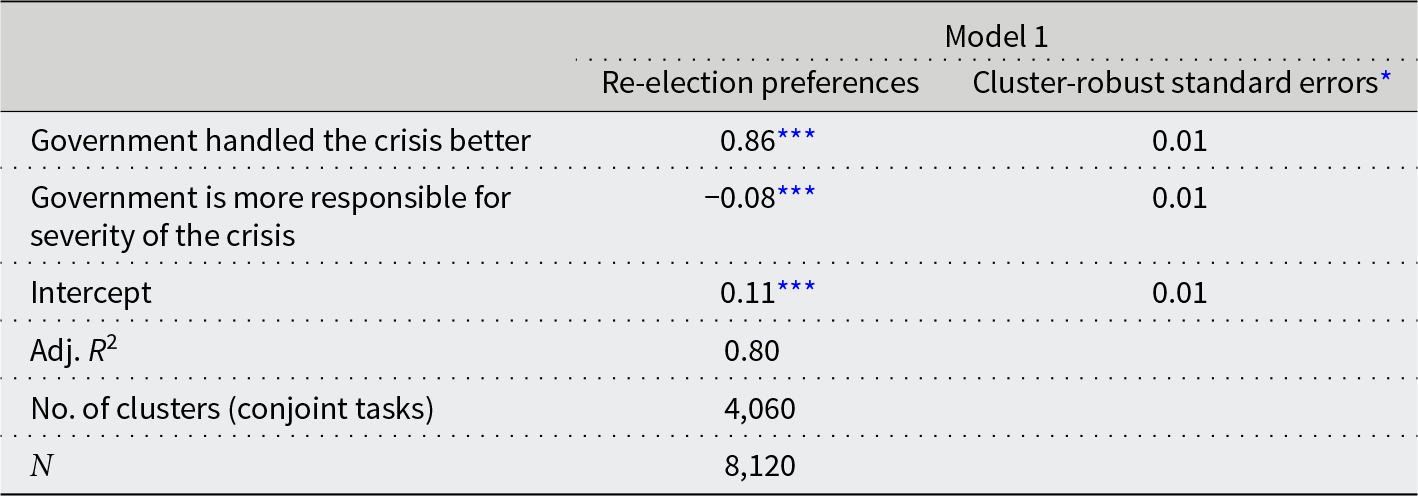
Table 2 Long description
The table presents a linear probability model analyzing factors influencing re-election preferences in a conjoint experiment. It highlights that the government's effective crisis management significantly boosts re-election preferences, indicated by a coefficient of 0.86. Conversely, when the government is perceived as more responsible for the crisis's severity, re-election preferences decrease, reflected by a coefficient of -0.08. The model's intercept is 0.11, suggesting a baseline preference level. The adjusted R-squared value of 0.80 indicates a strong model fit. The analysis is based on 4,060 conjoint tasks, with a total sample size of 8,120 observations. Cluster-robust standard errors are used to ensure reliability of the estimates.
Notes: *Cluster-robust standard errors based on conjoint comparison tasks. ***p < 0.001
Heterogeneity by voter characteristics
Do the results presented in Figure 2 vary according to the characteristics of the voters? In order to test H4 and H5a–b, Section B in the Supplementary Material provides a subgroup analysis for voters’ political knowledge and blame signals concerning attribution of responsibility, as well as a subgroup analysis concerning voters’ previous crisis experience and the effect of the crisis type on crisis management and re-election outcomes. Figure B1 reveals that more politically knowledgeable voters are about 5% more likely to attribute responsibility for crisis severity to a government when it reduced crisis prevention funding (H4). However, no statistically significant interaction effects are observable for the blame signals provided by experts or opposition leaders and voters’ political knowledge.
Turning to voters’ previous experience with a crisis (job loss during an economic crisis, hospitalisation with COVID-19, flooding of home), Figures B2 and B3 in the Supplementary Material show that regardless of previous crisis experience, respondents were equally likely to re-elect or see governments as better crisis managers for the same crisis type. For each of the three crisis types, no statistically significant differences in marginal means can be observed (H5a). Figure B4 shows results for the expectation that voters with previous crisis experience may react more strongly to performance signals (H5b). However, there are no statistically significant differences in effects based on previous crisis experience. Overall, these results indicate that voters respond very similarly to the crises depicted in the survey experiment. However, the results on previous crisis experience particularly should be interpreted with caution, because previous crisis experience ranges between 5% for floods and 11% for job loss during an economic crisis. Therefore, there might be effects in the population that were not detectable with the available sample size.
In order to provide an overview of the various empirical analyses of the conjoint experiment, Table 3 presents a summary of the findings pertaining to each individual hypothesis and shows which hypotheses received support. The empirical analysis fails to find support for the hypothesis that crisis severity has no effect (H1) or that voters’ previous crisis experience serves as a moderator (H5a–b), but other hypotheses (H2a and H3) related to blame signals and performance indicators received broad support. Finally, the hypotheses about an interaction existing between blame signals and crisis severity (H2b) and between voters’ political knowledge and blame signals (H4) each received partial support because the statistically significant interaction effects were smaller and limited to specific conjoint attributes.
Summary Results of the Hypothesis Testing

Table 3 Long description
The table evaluates the outcomes of various hypotheses related to government accountability and voter behavior during crises. Key findings include that governments are more likely to be blamed and less likely to be re-elected in severe crises, especially when prevention spending is inadequate or expert predictions are ignored. Hypothesis 2a is supported, showing that opposition blame does not directly affect responsibility but reduces re-election chances. Hypothesis 3 confirms that disaster relief spending and prime minister involvement significantly impact voter perceptions, while the speed of relief does not. Hypothesis 4 reveals that voters with high political knowledge are more likely to hold the government accountable when prevention spending is reduced. Hypotheses 5a and 5b are not supported, indicating that previous crisis experience does not significantly alter voter reactions to government performance. The low number of respondents with prior crisis experience limits the testability of some findings.
Robustness checks
Section C in the Supplementary Material provides a number of robustness checks for the results presented. For example, effects in the conjoint experiment could potentially be biased due to comparisons between different types of crisis. While voters have been shown to benchmark crisis performance across different contexts (Allen and Ahlstrom-Vij Reference Allen and Ahlstrom-Vij2025; Becher et al. 2024), a comparison of different crisis types might be cognitively demanding for voters. In order to test this, Figure C3 compares results when respondents saw the same crisis type in a conjoint task versus tasks in which respondents saw different crisis types. If respondents were cognitively challenged by comparing different types of crisis against each other, the effects would differ based on whether the crisis types displayed in the scenarios were the same or not. Figure C3 reveals that marginal means are substantially the same for almost all outcomes and crisis attributes, regardless of whether matching crisis types were shown. Differences in marginal means are either statistically insignificant or else have overlapping confidence intervals. Only where the population severity of the crisis is very low does the effect on re-election and crisis handling become substantially lower when different crisis types are shown. In summary, the findings presented here only remain unchanged when considering conjoint tasks in which the same crisis type is compared.
Even if the conjoint task made no reference as to which political party controlled the hypothetical government, respondents may have had in mind the Conservative Party that was in office when the experiment took place, and partisanship may therefore have biased respondents (Blankenship et al. Reference Blankenship, Kennedy, Urpelainen and Yang2021; Heersink et al. Reference Heersink, Jenkins, Olson and Peterson2022). Figure C5 in the Supplementary Material shows that this is not a concern, and no statistically significant differences between Conservative partisans and other respondents can be observed. It is also possible that the effects of population severity on attributing responsibility are driven by the Ebola crisis type, because voters may react more strongly to population severity in the case of a virus that can cause death. Figure C4 shows that for some population severity levels, respondents did react more strongly to the Ebola scenario. This is particularly the case when 50,000 households were affected, resulting in an almost statistically significant lower re-election probability (p = 0.08) and a greater perception that the government was responsible for the crisis (p = 0.057), compared to the other two scenarios.
Respondents frequently react more strongly to severity in the Ebola crisis scenario, compared to the storm flood. However, for the 200,000 and 12,500 population severity levels, there are no statistically significant differences between the Ebola scenario and the stock market crash scenario. These results show that while overall respondents did react slightly more strongly to population severity in the Ebola scenario, as also indicated by more extreme point estimates, these differences are not consistently different from the effects produced by the stock market scenario. While the lack of major statistically significant differences in severity effects between the crisis types indicates that the main results are not driven by any one type, it may still be the case that respondents did not interpret the severity of the different types equally. Instead, respondents may predominantly react to the scale of the crisis scenario.
What about the effects on a government’s re-election chances due to changes in the two underlying performance and responsibility mechanisms, as postulated by hypotheses H1, H2a, H3 and H5a? While the correlation in effects between the outcomes in Figures 2, B2 and B3 provides evidence in support of these hypotheses, a more stringent test can be performed by observing those cases in which respondents made a joint selection of the discrete re-election and performance/responsibility choices. Figures C1 and C2 in the Supplementary Material show effects for the joint discrete choices indicated by these hypotheses. The results closely match those in the main results and do not alter the previous conclusions.
How do the results differ if respondents with short response times, who may not have paid attention in the experiment, are taken out of the analysis? Figure C6 shows that when individuals with a response time in the lower quartile (below 4.3 minutes) are excluded from the analysis, the findings presented in Figure 2 remain unchanged. Finally, because respondents faced five comparisons in total, a test for carryover effects was conducted in Figures E2–E4, which indicated no carryover effects between tasks.
Conclusion
What are the individual characteristics of crises that elicit judgements about government performance and responsibility among voters? While existing research points towards disaster relief as the major informational cue for voters’ assessments of performance, less is known about other potential factors that influence these assessments or judgements about the government’s responsibility for the crisis. This article has analysed how voters react to the individual characteristics of a variety of crisis scenarios by conducting a conjoint experiment among UK voters. It has also explored heterogeneity in voter reactions to crisis characteristics.
The results reaffirm that when voters sanction governments for a crisis, they focus predominantly on the quality of crisis management rather than their perception of the government’s responsibility for the severity of the crisis. In order to make these assessments of performance, voters look not only towards disaster relief and/or the involvement of the head of the executive, but also to the severity of the crisis and whether the government had invested in prevention spending in the previous year. Considering the fact that government decisions affect crisis severity, this systematic attention to severity is a welcome finding. Crisis severity likewise affects the assignment of responsibility, though to a lesser extent. In addition, the assignment of responsibility for crisis severity is most strongly affected by plausible blame signals – a reduction in disaster prevention spending prior to the crisis; warnings or predictions by experts – indicating that the government could have done more to prevent it. Moreover, the results indicate that voters’ political knowledge can be a source of heterogeneity in reactions to crisis, indicating that more politically knowledgeable voters pay greater attention to disaster preparedness investments to judge government responsibility for crises.
The results of this article speak to the literature on retrospective voting and crisis events. They provide further evidence that voters are attentive when sanctioning governments after crises and help refine our understanding of the effect of individual crisis characteristics. Responsibility for a crisis is assigned quite narrowly by voters based on blame signals and, to some degree, crisis severity. Also, while governments are unable to lower perceptions of their responsibility by delivering faster disaster relief or providing greater amounts, the involvement of the chief executive does lower perceptions of responsibility to a small extent. Disaster relief efforts are in themselves of substantial importance, but the speed of this relief does not matter. The ability of the government to limit the severity of the crisis in terms of economic damages and the number of households affected also matters to a similar degree. The findings indicate that voters might react more strongly to crises that predominantly cause monetary damages, compared to increases in the scale of households affected. Interestingly, voters rely on a greater variety of crisis characteristics (such as its politicisation by the opposition) to form assessments about the quality of the government’s crisis management than existing research has shown to date. Further research should investigate these characteristics with observational data.
Future studies should also seek to improve on the findings and limitations of this article – by conducting cross-national studies and comparative studies with more origin scenarios, for example. Importantly, such studies could test the scope conditions of the results presented, which are more likely to travel to other parliamentary democracies, because the effects of head of government treatments will likely vary in semi-presidential and presidential systems. Moreover, the findings are more likely to travel to Western European countries, where there is a similar likelihood of the crisis origins presented in the experiment. In contrast, it is more likely that the findings related to disaster relief spending and expert statements about the crisis should travel to other regions.
While the results of this study suggest that voters react more strongly to certain types of crisis (e.g. weather-related), this may be due to the idiosyncrasies of the scenarios employed. Future studies should improve on the experiment conducted here by enhancing cross-scenario comparability, using more generalised crisis scenario descriptions or increased local plausibility. This would address concerns over a lack of comparability of crisis severity between the current scenarios and the motivations behind voter reactions to severity levels. Moreover, there are other voter characteristics which should be explored to assess whether a crisis has different effects depending on the characteristics of the voters affected by the crisis. Such characteristics include trust in political institutions and income levels, which may affect voter expectations and moderate the effect of crisis characteristics on perceptions of crisis performance. Lastly, further research could study more potential blame signals to deepen our understanding of the contexts within which voters are most likely to rely on crisis severity to form their opinion of the government’s responsibility for a crisis.
Supplementary material
The supplementary material for this article can be found at https://doi.org/10.1017/gov.2026.10043.
Data availability
All data and code to reproduce this article are available at the Harvard Dataverse: https://doi.org/10.7910/DVN/IXPGSG.
Acknowledgements
I am grateful to Werner Krause, Noah Buckley, Jeffrey Ziegler, Dennis Abel and participants at the ‘PSA Elections, Public Opinion and Parties Annual Meeting 2022’, the ‘European Political Science Association Annual Conference 2024’ and the ‘DVPW AK Wahlen und Politische Einstellungen Tagung 2024’ for helpful comments on this article. I am also thankful for the financial assistance of benefactors to the Faculty of Arts, Humanities and Social Sciences Benefaction Fund at Trinity College Dublin, who made this study possible.
Financial support
Funding for this study was generously provided by the Arts and Social Sciences Benefactions Fund (Award Number: 17609) at Trinity College Dublin, Ireland.
Ethics statement
The research using human subjects received ethics approval from the institutional review board (IRB) at the Faculty of Arts, Humanities and Social Sciences, Trinity College Dublin (approval number: 08182022).
Disclosure statement
The author reports that there are no competing interests to declare.




 Open access

