

Introduction
The importance of subglacial till for basal motion is now well established, but data from under the deep parts of active glaciers are still sparse, even though the bed can be reached relatively easily through boreholes drilled with hot water. Sampling in marine till poor in large clasts can be accomplished by piston coring (Reference Engelhardt, Humphrey, Kamb and FahnestockEngelhardt and others, 1990), but penetration and sampling are notoriously difficult in clast-rich material (e.g. Reference Harrison and KambHarrison and Kamb, 1973; Reference Engelhardt, Harrison and KambEngelhardt and others, 1978; Reference Truffer, Motyka, Harrison, Echelmeyer, Fisk and TulaczykTruffer and others, 1999). Direct access to the glacier bed has also been possible through temporary tunnels within the ice (where it is thin) or through permanent tunnels in bedrock (e.g. Reference IversonIverson and others, 2003).
Once a borehole has reached the till, various instruments, such as pressure transducers, tiltmeters, plough meters and slidometers, have been inserted into it (e.g. Reference Blake, Clarke and GérinBlake and others, 1992, Reference Blake, Fischer and Clarke1994; Reference Fischer and ClarkeFischer and Clarke, 1994). This has been done with the help of down-hole hammers. The mass of the hammers has typically been a few kilograms, and typical insertion depths have been from a few centimeters to 0.5 m. The attainable depth is obviously extremely sensitive to the composition of the till and, less obviously, to the extent to which it has been disturbed by hot-water drilling. Instruments have also been inserted into mechanically drilled holes. For example, we used a commercial wireline drill rig on Black Rapids Glacier, Alaska, USA, in 1997, both to provide till samples and access for instruments (Reference Truffer, Motyka, Harrison, Echelmeyer, Fisk and TulaczykTruffer and others, 1999, 2000). In that project, up to 7 m of subglacial till was penetrated with difficulty, and tiltmeters and pressure transducers were installed in the upper 2m. The data suggested relatively little sliding at the ice–till interface, and, because the inferred deformation rate in the upper 2m was insufficient to account for the total basal motion, we concluded that the till must be active at depths exceeding 2 m, and that it could possibly slide over bedrock.
These results indicated that it is important to place instruments deeply into the till. Because drill rigs are heavy and expensive, and because light hammers cannot be used to penetrate the clast-rich till common under Black Rapids and other glaciers, we were motivated to develop an alternative technique. There were two parts to our approach: first, to develop a massive down-hole hammer (about two orders of magnitude heavier than those usually used) and, second, to develop instrumented probes (to be inserted by the hammer) with wireless communication through the till. Wireless communication avoids both the problem of cable damage during the complicated process of operating a heavy down-hole hammer from the surface and the problem of damage by the basal motion itself.
The Hammer System
Configuration
There are several conflicting requirements for a down-hole hammering system, such as cost, simplicity, weight of the hammer and ancillary equipment, capability of underwater operation and, perhaps most important, the ability to hammer out as well as in. The latter is necessary because the drill rod or pipe attached to the hammer to contain the probes during placement must be removed after placement. This is necessary for the recovery of the hammer, and so the measurements are not disturbed by the presence of the drill rod. One attractive approach would be to use a hydraulically powered hammer powered by the pumps and hose usually available on site from hot-water drilling. We gave up this idea when we found there was no suitable unit commercially available, and decided that the most practical approach was to use a massive version of the hammers presently in use. These are slide hammers raised from the surface on a rope or cable, and dropped onto an anvil connected to the pipe or drill rod containing the probes. With two suitably placed anvils these hammers can hammer either up or down as required.
We faced essentially two new problems. The first, time-consuming but straightforward, was the development or purchase of a hammer and suitable equipment at the surface to handle it. The second, more fundamental, was to cope with an ice thickness of 500 m or more at Black Rapids Glacier, which is much greater than has been faced on most of the relatively steep valley glaciers that have been instrumented so far. The weight of the hammer and the depth combine to make the stretch of the rope actuating the hammer a major problem. This stretch makes it difficult to know the exact position of the moving part of the hammer with respect to the anvils, a critical factor when hammering either up or down.
Hammer and drill rod
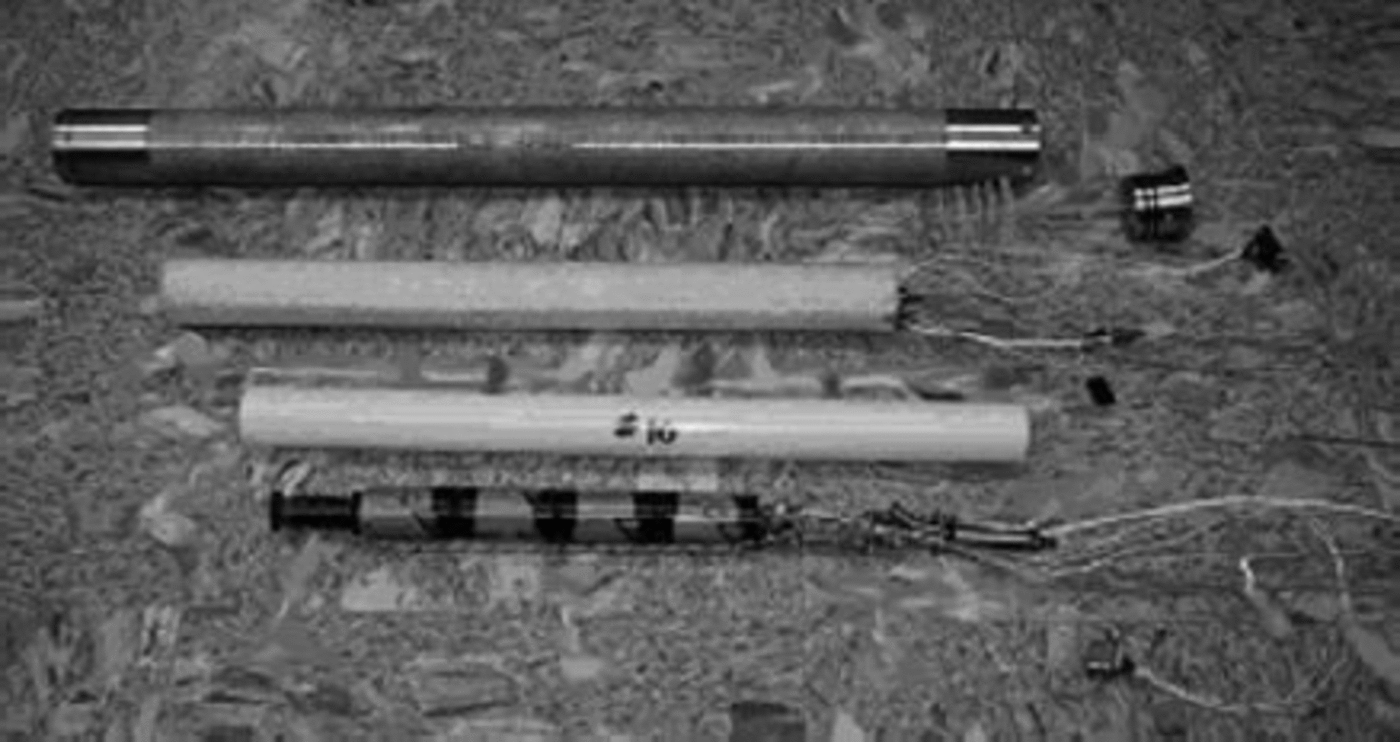
We used a commercially available, simple and effective slide hammer (Rampp Company/Star Iron Works), shown in Figure 1. Unlike some hammers, this one is suitable for underwater use because its open design prevents cushioning by the water. It has a 0.91 m (3 ft) stroke and a diameter of 121 mm. Its mass is 182 kg (400lb weight), but only the upper half is ‘active’ in the sense that it is raised during hammering. The top of the hammer terminates in a removable 45kg (100 lb) socket which connects to the rope or cable. Sections (which we call ‘weights’) of 114 kg (250lb weight) can be placed between the hammer and socket; we used one or two of these for total active masses of 250 or 364 kg (550 or 800lb weight). The lower end of the hammer connects, through a ‘sub’ (an adapter), to the rod to be hammered. We used 3.05m (10 ft) sections of flush coupled NWJ drill rod. The drill rod has an outside diameter of 67mm and a 9.5mm wall thickness. The instrumented probes, separated by spacers made of split tubing and rubber pads, slide into the drill rod and are connected to each other by nylon cord. The lowest probe also connects to a drive point, the short upper end of which fits loosely into the drill rod, to which it is fixed with a pin that shears when the hammer reaches the bottom. The maximum diameter of the drive point is 16 mm larger than that of the drill rod so that, with the pin sheared, it will remain behind as an anchor when the drill rod is hammered out. It thus pulls the probes out from inside the drill rod. Several lengths of drill rod can be attached, but only the lowest one can be fitted with instrumented probes because of the narrow inside diameter of the rod couplings. Three of our probes can be deployed at once. The geometry of the probes and the drill tip after emplacement is shown in Figure 5 below.
Hammer and tower. The active part of the hammer slides along the slot. The hammer is hanging from the tower in the extended position, the position it would have at the bottom of the hole at the moment of impact when hammering up.

Rope
The hammer is engaged via a 13 mm (0.5 in) composition (Vectran®) rope of 1.3 x10⁵ N (30 000lb) minimum break ing strength. The rope was chosen after we estimated tension and stretch under operating conditions. This required a full dynamical calculation accounting for Young’s modulus of the rope, its linear density and the mass of the hammer. We took the speed of the rope at the surface to be zero initially, but with a rapid acceleration to a constant 2m–1 when engaged by the surface equipment described below. A sample result (Fig. 2) showed that maximum tension in the rope at the hammer reaches 6500 N when the hammer impacts the upper anvil, and should not exceed 10 000 N (or about 2200 lb) for an active hammer mass of 454 kg (1000 lb weight), even if the rope continues to be stretched at the surface for a full second after impact. The maximum tension at the upper end of the rope is higher because of the weight of the rope, but the difference is negligible since the rope is almost buoyant in water. From the tension and Newton’s second law one can estimate the position of the hammer with respect to the anvils as a function of time after pulling at the surface begins, providing one knows the initial position of the hammer. This can be accomplished by lowering the hammer gently until it just touches the lower anvil, and then placing a reference mark on the rope at the surface. The procedure is best performed with a sensitive load cell that measures the accompanying change in tension in the rope. However, ours failed, and we had to determine the change in tension by timing the reflections of pulses that we induced in the rope at the surface.
Tension at the bottom of the rope as a function of time after the engagement of the cat-head to hammer up. The calculation assumes a fast acceleration of the top of the rope to a constant 2 m s–1, a rope density of 1000 kgm-3, a Young’s modulus of 7.1 × 10⁹ Pa, and a rope diameter of 13 mm. Initially, the tension is determined statically by the weight of the hammer. The pulling of the rope at the top initiates a wave that first arrives at the bottom after about 0.2 s. Successive reflections from top and bottom generate a saw-tooth-like pattern; a second saw-tooth pattern is triggered by the impact of the hammer on the upper anvil.

Surface equipment
The surface equipment consists of a tower, a tripod, and a 37 kW industrial engine with a ‘cat-head’, all mounted on an aluminum frame (Fig. 3). A cat-head is a drum that rotates at constant speed. It will pull a rope when several turns are passed around it and tension is applied. Friction at the cat-head would rapidly melt a composition rope, so the composition rope is connected to an expendable natural-fiber rope using a ‘stopper’ (essentially an intermediate braid of rope), and the fiber rope is passed around the cat-head. The position of the stopper is adjusted as hammering proceeds. The tower is used for assembly of the drill string. The tripod is necessarily much stronger than the tower, as it guides the rope into the hole during hammering and when the drill string is run in or out. When running in and out, the cat-head is exchanged for a drum around which all the rope can be wound.
Hammer-handling equipment. The vertical upright aluminum beam is the sheave on the tripod, which guides the rope when the drill string is in the borehole. The engine and drive train are at left center. The cat-head is in place near the man’s knees, and he is preparing to use it to assemble the drill string on the tower. The drum with the main rope is lying to his left, and will replace the cat head when he is ready to run the drill string into the hole.

The mass of the entire rig, including the down-hole components, is about 2.3 t, the heaviest piece of which is the engine and drive train of about 0.5t. The rig can be moved on the surface with dug-in anchors, rope and cat-head.
The Instrumented Probes
Configuration
The two new design problems were to build probes that were sufficiently shock-resistant to withstand vibrations from hammering, and to develop a wireless data-transmission system. We did not attempt to transmit to the surface, but only to a receiver placed a few meters above the ice–till interface and connected to the surface logging system by an instrument cable. The probes contain sensors for pressure and two axes of tilt (but, for the sake of simplicity and cost, no compass for orientation information) and are designed for 1 year of operation.
Probe electronics and mounting
Immediately before deployment the probes can be started and programmed to measure at any desired time interval. The water-pressure transducer (Micron Instruments, MP50) has a range of 6.9 Mpa and can withstand an acceleration of 104 m s–2 (about 1000 g). The tiltmeters (Analog Devices ADXL-202) are micro-machined, piezoresistive acceler-ometers used as tilt sensors and have a range from 0 to 908. The pressure transducers and the tiltmeters were calibrated in the laboratory at 08C. The instrument package contains a microprocessor (Parallax Basic Stamp, BS-2) with an on-chip ceramic resonator clock. It reads the tiltmeters directly (duty cycle measurement), while the pressure is read through an analog/digital converter. The processor then creates a transmission of 54 bits, which consists of a 4-bit identification, two times 11 bits for tilt, 12 bits for pressure, two spare bits and 14 parity bits for forward error control.
Transmission occurs via a low-frequency magnetic field produced with a coil wound on a sintered iron core with 20m of 0.20mm diameter copper wire using a frequency shift protocol. A digital zero is transmitted as a 1s 450 Hz chirp, and a digital one as a 1 s 510 Hz chirp. The frequency was chosen after testing transmission from a tunnel in permafrost to the surface, where there was a wet active layer. The transmission frequencies avoid the 60Hz harmonics common in North America. The first part of the transmission string is a 3 s ‘attention’ signal, which alerts the receiver that data are following. This is followed by the 54-bit sequence, each bit being separated by a 0.5 s of quiescence. The entire sequence takes about 83 s to transmit.
The instrument package together with the transmitting coil and four C-size lithium batteries (Fig. 4) is cast in epoxy, wrapped in foam and housed in a 0.61 m long stainless-steel pressure casing with an outside diameter 44 mm and a 3.2 mm wall thickness. The package and foam fit snugly into the casing and act as a piston, which is cushioned by the air trapped at either end of the probe. Springs and foam at the ends provide additional shock absorption. The pressure transducer connects to the outside through oil-filled flexible tubing and a sintered metal filter in the top of the probe. The probes can be dropped at least 5 m onto a concrete surface without damage or change in calibration.
Probe components. The unit at the bottom consists of the transmitting coil, batteries, tiltmeter, microprocessor and pressure transducer. Above it is the same type of unit after being cast in epoxy within a plastic tube. Shown above this tube is another after it has been wrapped in foam, which will enable it to fit smoothly into the stainless pressure casing (0.61 m long) at the top. Springs and more foam at the ends are not shown.
Down-hole receiver and surface logging system
The down-hole receiver consists of a coil wound around a rare-earth core of high magnetic permeability (EMI, BF-6) together with a preamplifier. They are housed in a stainless-steel pressure casing, with an outside diameter of 57mm and a 3.2 mm wall thickness, which is placed just above the ice–till interface. This makes the transmission distances a few meters, which gives a reasonable signal-to-noise ratio. The signal is transmitted through a cable from the receiver to the surface. Because basal motion could increase the transmission distance by tens of meters in a year, and because the transmitted field strength falls off as distance cubed, a second receiver is placed in a separate hole up-glacier from the main hole by an amount approximately equal to the expected annual basal motion.
The surface equipment, which receives the signal from the down-hole receiver, includes a second amplifier and a digital signal processing (DSP) board (Analog Devices, ADDS-210161). The signal passes through two narrow (30 Hz) band pass filters, and depending on the frequency, it will set the ‘one’ line high, the ‘zero’ line high or will keep both low. The filters create some ringing that lengthens the signal; this is the reason for a 0.5s quiescence between consecutive bits. When the attention line goes high, a data logger and storage module sample both lines at approxi mately 0.15s intervals. The storage module is downloaded at intervals of 3–12 months. Because the DSP has relatively high power consumption (about 6W), it is turned on by the data logger only when needed. This is done by a rather complex program that allows for clock drift in the probes, and searches several times a day for signals whose timing was never known or has been lost because of intermittent reception or clock drift.
Operation
Testing the hammer
The initial test of the hammer, rope and handling equipment was carried out in a commercially drilled well in alluvium near our institution, and led to some configuration changes. The resulting modified system was tested on Black Rapids Glacier in April and May 2002 within a few meters of site N1 of Reference Truffer, Motyka, Harrison, Echelmeyer, Fisk and TulaczykTruffer and others (1999), where, as noted above, the ice is 500 m thick. In 1997 the till here was 7m thick, and half of the annual surface motion of about 60 m was due to basal motion, much of which seemed to occur relatively deep within the till rather than near the ice–till interface. Hot water was used to drill a 0.25m hole to the ice–till interface; smaller diameters caused problems with the passage of the hammer.
Before placing the probes, we tested the performance of the hammering system in ice, using a shallow (30m) hole. Little progress was made with one weight (total active hammering mass 250kg or 550 lb), but with two (total 364 kg or 800 lb) 0.3m progress was made. Beyond this, progress was extremely slow, probably because there was no passage around the drive point for the ice chips. Evidently driving in ice is difficult; these results could help to identify the presence of ice as compared to till.
A second preliminary test was conducted in till in hole 1, hot-water drilled to the interface. We used two weights. No probes were put into the drill rod, and the drive point was welded in place so it could be recovered and not complicate subsequent tests. After about 1.5m of hammering in, we began to hammer out, but we were almost immediately foiled by the disintegration of the engine clutch. Four days later a new clutch was obtained, and hammering out was successful, perhaps surprisingly. However, the rod was bent by about 48. We were unable to establish whether the bending was from basal motion during the time the rod was in the till (see Reference Humphrey, Kamb, Fahnestock and EngelhardtHumphrey and others, 1993), or from the hammering itself. This proved to be a serious problem because we did not dare to use more than two weights in subsequent tests for fear of bending the drill rod again. This could have been overly cautious.
Placing the probes
Hole 1 was employed again for the placement of the first set of two probes. The nominal depth from the ice surface to the top of the till was measured with a depth-logging cable to be 497.0m from the snow surface; the snow was 1.5m deep. Two hammer weights were used again. When starting to hammer we were careful to use a maximum of two-thirds of the possible 0.9 m for the hammer stroke, fearing that with a longer stroke the hammer might accidentally hit the upper anvil, raise the drill rod and thereby release the removable drive point and probes prematurely. Initial progress was rapid, but progress ceased with the drive point about 1.2 m below the nominal position of the interface. Depth as a function of uncorrected hammer blows (not all hammer blows were of the same strength) was determined by marks on the rope at the surface, and is shown in Figure 5a together with the final positions of the drive point and lower probe. The upper of the two probes barely penetrated the till.
Depth below nominal position of ice–till interface of probes 1(a) and 3(b) as functions of the number of hammer blows. Not all blows were of the same strength, the initial ones tending to be weaker. The final positions of the probes and drive points are shown.

A set of three probes was placed in hole 2, 4.1m to the south (toward the center of the glacier) of hole 1. Here the depth from the snow surface to the ice–till interface, measured after hot-water drilling, was 498.9m, about 2m deeper than in hole 1. The inferred transverse interface slope of about 2 in 4m agrees with that inferred from seismic (Reference Nolan and EchelmeyerNolan and Echelmeyer, 1999) and radio-echo sounding (Reference GadesGades, 1998 and personal communication, 1998). Two hammer weights were used again. In this case progress ceased when the drive point was about 2.5m below the interface. The final positions of the drive point and the deepest probe are shown in Figure 5b. The upper two probes did not release. Instead, the cord connecting them to the lower probe broke. This failure was due to rapid release of the drill rod when hammering out. The probes acted as a piston within the drill rod, sucking sand into the 1.6 mm annulus between the rod and the second probe, causing it to jam securely. This problem could have been prevented by more gentle hammering out, more clearance inside the drill rod, or better venting at the top of the drill rod where (fearing a weakening of the rod) we had only a 4.8mm hole to allow water to enter the drill rod and equalize the pressure.
Locating the interface
The zero line schematically representing the ice–till inter face in Figures 5a and b is broken to emphasize that it is uncertain, and therefore that the depths of the probes within the till is uncertain. In our case, the earlier wireline drilling favors a rather well-defined interface at a well-known depth, essentially identical to the depth we measured after hot-water drilling. Nevertheless, locating the position of the interface, and determining how well defined it is, are fundamental difficulties in studies of active subglacial processes, although they have had little acknowledgment in the literature. In our collective experience on several glaciers, a hot-water drill rarely experiences an abrupt stop. The tension in the hose often experiences a well-defined drop, but the drill may continue slowly over a distance which is difficult to measure because of the loss in tension and the stretch of the hose. This may indicate, among other things, that the interface is diffuse, that the hot-water jet is drilling into the till, or possibly that till is creeping up into the hole. We have seen the last process during commercial cable tool drilling of water wells; instruments placed in injected material in glacier boreholes would usually lead to highly erroneous conclusions about basal motion. It would be useful to have a physical understanding of what controls the injection of material into a borehole, given variables such as rheology, overburden, water pressure in the hole and in the material, and how well the hole connects to the subglacial drainage.
In an attempt to shed light on the interface problem, we put fresh paint and a longitudinal strip of masking tape on the drill rod before use, reasoning that scratches on the paint or damage to the tape would help locate the interface. The results were ambiguous, the scratches often extending far above the place at which all the paint was scraped off, and the tape sometimes surviving below this point. In the first hammering test, heavy scratching extended to about 1.2 m on one side of the drill rod and 1.8m on the other. These data were not useful for determining penetration depth, but did indicate that clasts in the borehole wall might exist some meters above the interface.
It is quite possible that the penetration depths were greater than indicated in Figure 5a and Figure 5b. The depth of penetration, as monitored by a mark on the rope at the surface, was measured after hammering began, but we expect that some penetration occurred as soon as the hammer and the rest of the drill string reached the bottom and were allowed to rest there while the mark on the rope was made. This is because hot-water drilling may penetrate and sort the till. Upon termination of drilling, the sus pended material activated by the water jet settles differen tially, with the finer, easily penetrated material at the top (Reference Kamb, Alley and BindschadlerKamb, 2001).
Depth of penetration
The remaining issue regarding hammering is how our penetration depth compares with the 7m thickness of the till layer in 1997 (Reference Truffer, Motyka, Harrison, Echelmeyer, Fisk and TulaczykTruffer and others, 1999). The till is active and it is possible that its thickness changed in the intervening 5 years. However, this seems unlikely because the ice–till interface was at the same elevation in both years to within about 1m.
Penetration seems difficult to predict. In hole 1, the initial hammering test with the welded point achieved roughly 0.4 m greater penetration than did the later probe placement in the same hole. Moreover, progress was still being made during the hammering test when we changed direction to test the hammering-out capability. The reason for the difference is uncertain. One possibility is the increasing tilt of the hole between these runs. The tiltmeters recorded an initial tilt of about 78, which may have been enough to impede the action of the hammer. There are other possibilities, but it is noteworthy that better penetration was achieved in hole 2, which was instrumented < 2days after drilling. This experience suggests the obvious: to maximize penetration one should use a fresh, straight hole, and probably more weight on the hammer. The latter seems particularly important when the combined mass of the inactive half of the hammer and the drill string are significant.
Wireless communication
The probes were programmed to read every 4 hours for the first 5days, and once a day thereafter. Many transmissions were lost. The main problem was that the 510Hz chirp (digital one) was weak relative to the 450 Hz (digital zero). This would not have been serious except that we had chosen the former as an ‘attention’ signal because it had transmitted better during testing. One of the clearest transmissions is shown in Figure 6. The ‘zero’ line is drawn solid, and the ‘one’ line dotted. The latter is almost unusable, but parity checks showed that for a true zero the former was always strong, and that for a one it was weak (narrow peaks in Fig. 6). In fact virtually all the transmissions received were readable. The inclusion of the parity bits was essential to give us confidence about signal interpretation. On the other hand, if we had switched the ‘attention’ line, we might have received all of the data. A final problem, one which may have had some effect upon reception, was that there was but a single threshold adjustment on the receiver. Since the receiver received data from several probes, it was difficult to optimize the signal-to-noise ratio for all probes simultaneously.
One of the best transmissions received. The ‘zero’ line is drawn solid and the ‘one’ line dotted. The transmission of a zero is always marked by a clear square wave, but the transmission of a one is seldom clear and typically missing. The resulting string of bits was arranged in a 6x9 table with row and column parity bits to check for consistency. The parity bits increased the transmission time, but proved essential.

From probe 1 (Fig. 5a) we received 61 transmissions, from probe 2 (just above probe 1, not shown but almost entirely above the nominal interface) only one transmission, and from probe 3 (Fig. 5b), 23 transmissions. Probe 1’s last recorded transmission was approximately 5 months after installation, while data from probe 3 were still being received after a full year. To illustrate the data-loss problem, the tilt data from probe 1 are shown in Figure 7. The largest gap occurred between days 184 and 249. On day 260, 123 days after installation, the second receiver (placed in a borehole 32 m up-glacier from the first and having its own independent surface electronics and data logging) began to receive data from probe 1 and about 10 days later from probe 3. This reception might have occurred earlier except for a dead surface electronics battery, which was replaced during a field visit between days 256 and 259.
Total tilt (crosses, solid line) and rotation around axis (diamonds, dashed line) of probe 1 as a function of time.

Figure 7 illustrates that the behavior of the tilt is complex in both time and direction. The episodic nature of the tilting is seen both in the total tilt and in the rotation around the probe axis (Fig. 7). This rotation implies a more complex deformation than simple shear. The full dataset (including pressure) and its interpretation will be presented separately.
Discussion
Our single field season afforded no opportunity to improve our systems, but two points are clear. First, with due attention to its dynamical behavior, a heavy off-the-shelf down-hole hammer can be successfully operated from the surface on a long, light composition rope. Second, wireless communication with subglacial probes works, and reveals a wealth of complex behavior.
Nevertheless, there are still some basic problems facing till study by hot-water drilling and probing. The first is to determine the nature of the ice-till interface (diffuse or otherwise) and the related issues of determining the exact depths of the probes with respect to the interface and possible effects of the borehole on till dynamics and measurement. The second problem is to determine the local thickness of the till, and to get probes to its bottom. In our case, we penetrated a maximum of only 2.5 m of the thickness (that was probably 7 m), although deeper pene tration is likely to be possible with more weight on the hammer. The penetration of active clast-rich till by any means will probably remain a challenge for some time, and we conclude that without a drill rig, a heavy hammer is at present the best approach. It is notable that deep pene tration into clast-rich till, and the precise location and characterization of the interface, are fundamentally more difficult problems than the more glamorous one of wireless communication.
The motivation for some of our decisions remains to be discussed. We chose to have wireless communication after considering the trade-offs. We concluded that if the hole is deep and if the hammer is both heavy and ‘open’ (in the sense that it is designed to be effective in underwater operation), wireless communication is highly desirable or even essential for a reasonable probability of success. We believe that this decision was correct. However, the question of the best method of wireless communication remains open. We chose the low-frequency magnetic (and therefore short-range) system because we were doubtful that high-frequency electromagnetic (EM) waves could be transmitted successfully through the heavy metal probe enclosures which we used. An EM system might obviate the need for down-hole receivers, but transmitting a high-frequency EM signal through waterlogged till and temperate ice is a non-trivial problem, as shown by the recent experience of Reference Martinez, Hart and OngMartinez and others (2004). Besides its relatively high probablity of successful installation, a wireless communication system has the advantage of making the probes more autonomous, thus reducing the chance of mechanical cable–probe interaction. This is usually dealt with by leaving plenty of spare cable at the bottom of the borehole, but a cable that would run across possible shear planes could still pull on the probes.
The most fundamental issue is the type of instruments a probe should contain, and its optimum size and shape relative to the grain-size distribution and the scale (if any) which characterizes inhomogeneity in the deformation mechanisms. An example of the latter would be the distance between fault planes if any are active. It is likely that an iterative process will be needed: as the mechanisms become better understood, the instrumentation can be optimized to study them.
Acknowledgements
The project was supported by grant OPP-0085085 of the US National Science Foundation, and carried out with the help of A. Arendt, A. Behar, J. Brown, A. Bucki, S. Campbell, T. Clarke, L. Cox, D. Elsberg, U. Korotkova, A. Mahoney, D.Moudry, M. Parrish, B. Valentine, R. Woodard and S. Zirnheld. Logistics support was by Veco Polar Resources, Tundra Helicopters and Ultima Thule Air Service. J. Walder E.Blake and N. Iverson reviewed and helped improve the manuscript. We are grateful to B. Kamb and A. for their early recognition of the importance of direct observation of subglacial conditions.


