





Introduction
Flow behaviour in terrestrial ice sheets is intimately linked to the mechanical properties of the ice mass, which in part are governed by crystallographic preferred orientations (CPOs; also described in the literature as ‘fabric’, ‘lattice preferred orientation’ or ‘texture’) in the polycrystalline framework. In addition to CPO development, the flow rates of ice sheets are enhanced by changes in grain size, the magnitude of strain and temperature (Budd and Jacka, Reference Budd and Jacka1989). Many studies of ice-sheet mechanics assume that differential changes in viscosity are primarily due to CPO development (Azuma, Reference Azuma1994; van der Veen and Whillans, Reference van der Veen and Whillans1994; Morland and Staroszczyk, Reference Morland and Staroszczyk2009; Hruby and others, Reference Hruby2020). Indeed recent deformation experiments by Fan and others (Reference Fan2021a) suggest that CPO development predominantly governs strain weakening in ice samples. Modelling works from Rathmann and Lilien (Reference Rathmann and Lilien2021) show enhancement (which they attribute solely to CPO) must be accounted for in order to accurately infer basal friction of ice masses. In order to understand the constitutive flow laws in a viscously anisotropic material such as natural water ice (Duval and others, Reference Duval, Ashby and Anderman1983) and its deuterium (D2O) analogue (Wilson and others, Reference Wilson, Peternell, Hunter and Luzin2020) there are synergies if we compare CPOs identified in drill cores (Gow and others, Reference Gow1997; Thorsteinsson and others, Reference Thorsteinsson, Kipfstuhl and Miller1997) with observations from laboratory experiments.
It is well accepted that precipitation of snow on ice-sheet surfaces induces a vertical flattening at upper regions of the sheet, with the ice deforming mainly by compression along the vertical direction (Alley, Reference Alley1988). At greater depth, the deformation changes toward bedrock-parallel flow (Budd and Jacka, Reference Budd and Jacka1989; Hudleston, Reference Hudleston2015). In the majority of ice cores drilled from the surface to intermediate depths there are corresponding changes in the CPO of the (0001) or ‘c-axis’ in ice, from a randomly oriented distribution at the surface to a non-random or ‘preferred’ orientation at depth (Fig. 1) (Gow and others, Reference Gow, Ueda and Garfield1968; Gow and Williamson, Reference Gow and Williamson1976; Gow and Weeks, Reference Gow and Weeks1977; Gow and Kohnen, Reference Gow and Kohnen1978, Reference Gow and Kohnen1979; Kohnen and Gow, Reference Kohnen and Gow1979; Hudleston, Reference Hudleston1980; Weeks and Gow, Reference Weeks and Gow1980; Faria and others, Reference Faria, Weikusat and Azuma2014). The spatial variation in CPO patterns in ice cores are generally in good agreement with our wider understanding of ice-sheet mechanics at depth, and are therefore considered to be a promising macroscopic flow indicator (Alley, Reference Alley1992). When combined with the ice microstructure and independent temperature measurements, these CPO patterns may be used to estimate the rheological changes in the flow of ice sheets (Gow and others, Reference Gow1997; Thorsteinsson and others, Reference Thorsteinsson, Kipfstuhl and Miller1997; Azuma and others, Reference Azuma1999), or to decipher historical flow events (Dansgaard and others, Reference Dansgaard, Johnsen, Møller and Langway1969; Thwaites and others, Reference Thwaites, Wilson and McCray1984; Budd and Jacka, Reference Budd and Jacka1989; Thorsteinsson and others, Reference Thorsteinsson, Waddington and Fletcher2003; Donoghue and Jacka, Reference Donoghue and Jacka2009; Wilson and Peternell, Reference Wilson and Peternell2011; Lilien and others, Reference Lilien, Rathmann, Hvidberg and Dahl-Jensen2021). The Schmid factors can also be incorporated into a CPO-based flow law (Azuma, Reference Azuma1994).
Common CPO patterns in ice. (a) Empirical CPO observations from ice cores (001 axis only). Modified from Faria and others (Reference Faria, Weikusat and Azuma2014). (b) Synthesis of common CPO patterns from both natural and experimental studies (refer text for references).

There are, however, some variations in the c-axis CPO patterns that form. In many cases, the c-axis poles may orient parallel with the loading axis to form a cluster (Herron and others, Reference Herron, Langway and Brugger1985; Gow and Meese, Reference Gow and Meese2007; Faria and others, Reference Faria, Weikusat and Azuma2014). In other cases, a small circle of poles about the axis of ice loading, typically referred to as an ‘open cone’ or ‘cone’, will develop at greater depths (Gow and Williamson, Reference Gow and Williamson1976; Thorsteinsson and others, Reference Thorsteinsson, Kipfstuhl and Miller1997; Azuma and others, Reference Azuma1999; Faria and others, Reference Faria, Weikusat and Azuma2014). Other workers have observed a great circle oriented normal to shortening or ‘vertical girdle’ (Lipenkov and others, Reference Lipenkov, Barkov, Duval and Pimienta1989; Wang and others, Reference Wang2002). The variations in the c-axis CPO patterns, and the depth at which they occur, are by no means systematic across the range of ice cores studied (Fig. 1; Faria and others, Reference Faria, Weikusat and Azuma2014). Moreover, the empirical evidence from the natural ice record offers only the end-product and cannot inform us of the physical conditions that controlled the observed pattern, let alone an explanation for the differences in CPO patterns across various ice cores. This means that, in general, more work is required to fully understand the array of CPOs in terrestrial ice, and the physical conditions that influence the commonly observed patterns (Fan and others, Reference Fan2021a).
Controlled experimental deformations in the laboratory have provided important insights into the physical determinants for these patterns (Kamb, Reference Kamb1972; Bouchez and Duval, Reference Bouchez and Duval1982; Wilson, Reference Wilson1982; Jacka and Maccagnan, Reference Jacka and Maccagnan1984; Montagnat and others, Reference Montagnat2015; Qi and others, Reference Qi, Goldsby and Prior2017; Wilson and others, Reference Wilson, Peternell, Hunter and Luzin2020). Historically, the majority of studies have employed uniaxial compression experiments, where the compression direction is parallel to the sample shortening axis (Fig. 2b). Most of these studies have found that, when deformed, the initially random c-axes of ice samples will preferentially align in a cone centred around the compression axis (Wilson, Reference Wilson1982; Piazolo and others, Reference Piazolo, Wilson, Luzin, Brouzet and Peternell2013; Qi and others, Reference Qi, Goldsby and Prior2017). Additional insights into c-axis CPO development with a cone-like distribution, in a pure shear environment, are also provided by the power law models of Azuma (Reference Azuma1994), which considers the Schmid factor for basal slip in ice crystals as part of its calculations.
(a) Experimental set-up for combined axial compression deformation and in situ CPO acquisition using neutron diffraction. (b) Orientation of D2O samples during deformation experiments. Red arrows signify the shortening axis.

When ice samples are uniaxially compressed at temperatures below −20°C and at strains between 8 and 20%, characteristic of many terrestrial ice environments, the c-axis cones become tighter and may often take the form of a cluster (Fan and others, Reference Fan2020, Reference Fan2021b). A similar cluster pattern may emerge with increased stress (Qi and others, Reference Qi, Goldsby and Prior2017). The transition from cone- to cluster-shaped c-axis distributions suggests many ice basal-planes rotate from easy (basal) to hard-glide slip orientations (Wilson and others, Reference Wilson, Peternell, Piazolo and Luzin2014).
Combining experimental and natural CPO observations, there is some general consistency in the c-axis patterns but uncertainty elsewhere (Fig. 1b). Firstly, ice that is experimentally deformed under simple shear conditions typically develop a cluster of c-axes aligned parallel with shortening axis at high shear strains (γ > 2); as they do in low-temperature uniaxial deformations (Bouchez and Duval, Reference Bouchez and Duval1982; Journaux and others, Reference Journaux2019). At lower strains, a second maximum is commonly observed at a low angle to the shear plane, together forming a ‘double-cluster’ c-axis pattern (dashed lines in Fig. 1b) (Bouchez and Duval, Reference Bouchez and Duval1982; Journaux and others, Reference Journaux2019; Qi and others, Reference Qi2019). The angle between these two clusters has been shown to decrease with higher strains (Qi and others, Reference Qi2019). In the former of these cases, there is an ambiguity when interpreting the cluster-bearing c-axis patterns observed in ice core records, given that experiments suggest they form under low-temperature pure shear or high strain simple shear (Fig. 1a).
A second uncertainty is that it is unclear whether the c-axis CPO patterns previously interpreted as cones in ice cores are in fact collections of clusters oriented about the shortening axis or ‘multi-maxima’ (Gow and Williamson, Reference Gow and Williamson1976; Tison and Hubbard, Reference Tison, Hubbard, Maltman, Hubbard and Hambrey2000; Monz and others, Reference Monz2021). Both these circumstances mean that it may be difficult to interpret the deformation histories from the c-axis CPO patterns observed in ice cores and, moreover, to draw meaningful insights about ice mechanics.
Our incomplete understanding here is due in part to the limitations of methods in previous studies. Many historical studies in ice cores employed a universal stage to obtain measurements of c-axis orientations. As this procedure is time- and labour-intensive, and often performed on coarse-grained samples, only a small sample of orientations were collected per study (Gow and Williamson, Reference Gow and Williamson1976; Gow and others, Reference Gow1997; Thorsteinsson and others, Reference Thorsteinsson, Kipfstuhl and Miller1997). As a result, the maximum tends to be over-estimated and hard to quantify. Furthermore, there is no information on other important crystal axes, such as the prismatic (a and m) axes, which may also be important kinematic indicators (Schmid and Casey, Reference Schmid and Casey1986). Contemporary methods, such as electron backscatter diffraction or ‘cryo-EBSD’ (Prior and others, Reference Prior2015), are capable of producing much larger datasets, while also measuring the complete crystal orientation and the grain microstructure. However, there remains some limitation when studying coarse-grained ice samples, which is a common characteristic of high-temperature (>−10°C) deformations where grain boundary migration is a dominant recrystallisation mechanism (Monz and others, Reference Monz2021).
Experiments involving in situ neutron diffraction offer a solution. This bulk technique allows non-destructive measurement of textures as a function of applied load while acquiring 3-D data in samples up to 250 cm3 in volume. The technique can therefore return CPO data of high-statistical quality, even from very coarse-grained samples (Wenk, Reference Wenk2006; Hunter and others, Reference Hunter, Luzin and Wilson2017b). Unfortunately, combining deformation experiments with in situ neutron diffraction is time-intensive and only a small number of individual samples can typically be measured within the project timeframe. However, by combining data from multiple studies, provided that the experimental set-up is consistent, we can leverage the strong sampling power of the neutron diffraction technique, while gaining insights about the sensitivity of ice, in terms of its CPO pattern, to a wider array of strains, temperatures and strain rates.
D2O ice is used as a proxy for ice because of its transparency for neutrons, which is not the case for H2O. Single-crystal studies have found no significant structural difference between D2O and H2O (Peterson and Levy, Reference Peterson and Levy1957) and both materials have similar mechanical properties and deformation behaviour (McDaniel and others, Reference McDaniel, Bennett, Durham and Waddington2006; Middleton and others, Reference Middleton, Grindrod and Sammonds2017).
In this contribution, we combine and synthesise nearly a decade of existing experimental data by performing detailed quantitative analyses of the CPO patterns. The data presented here is a secondary analysis of data from coupled in situ deformation and texture diffraction experiments performed at the Australian Nuclear Science and Technology Organisation (ANSTO) in Sydney, Australia between 2010 and 2019. Our primary aim is to investigate the physical conditions that lead to cluster and cone pattern development in the c-axis during uniaxial compression of ice. At a high level, we aim to strengthen the gap between experimental and natural insights of these common c-axis topologies, and the physical conditions that influence their development. In particular, we will emphasise how the findings inform the interpretation of ice CPO patterns in terrestrial ice.
Methods
Experimental deformations
Most data presented in this contribution have been published elsewhere (Piazolo and others, Reference Piazolo, Wilson, Luzin, Brouzet and Peternell2013; Wilson and others, Reference Wilson, Hunter, Luzin, Peternell and Piazolo2019, Reference Wilson, Peternell, Hunter and Luzin2020), but are briefly described here for context. Cylindrical samples of D2O were deformed in an Instron 100 kN load frame while in situ neutron diffraction measurements were being performed on the residual stress diffractometer KOWARI at ANSTO (Fig. 2a) (Kirstein and others, Reference Kirstein, Luzin and Garbe2009). All experiments were unconfined and conducted under uniaxial compression loading conditions. In all cases, neutron diffraction data were collected after the deformation experiment using a two-circle Eulerian goniometer. All data used in this study represent the final microstructure of the deformed sample.
The samples investigated in this study are composed of polycrystalline D2O ice prepared using the technique described by Wilson and others (Reference Wilson, Hunter, Luzin, Peternell and Piazolo2019). The average length and diameter of D2O samples were ~3.2–4 cm × 2.5 cm for a length to diameter ratio of ~1.5 to 1 (Fig. 2b). The testing took place in a chamber that controls the temperature to within ±0.2°C.
The initial dataset comprised of 54 samples (Table 1). Three constant displacement rates and starting strain rates were used across the experimental data: 1 × 10⁻⁵ s−1 (‘fast’), 2.5 × 10⁻⁶ s−1 (‘medium’) and 6.0 × 10⁻⁷ s−1 (‘slow’). The temperatures ranged from −3°C to −20°C, and strains ranged from 0 to 40% shortening. The melting temperature (T m) of D2O ice is +3.8°C. This means that experimentally deforming D2O in a temperature range of −10°C to −1°C (0.92–0.99T m) corresponds to a H2O ice temperature range of −13.8°C to −4.8°C (0.95–0.986T m). The temperature and strain rates used across these experiments were chosen due to their approximation with natural ice conditions (10−5–10−10 s−1) (Paterson, Reference Paterson1977 and references therein; Vaughan, Reference Vaughan1993).
Quantitative summary of deformed ice sample characteristics
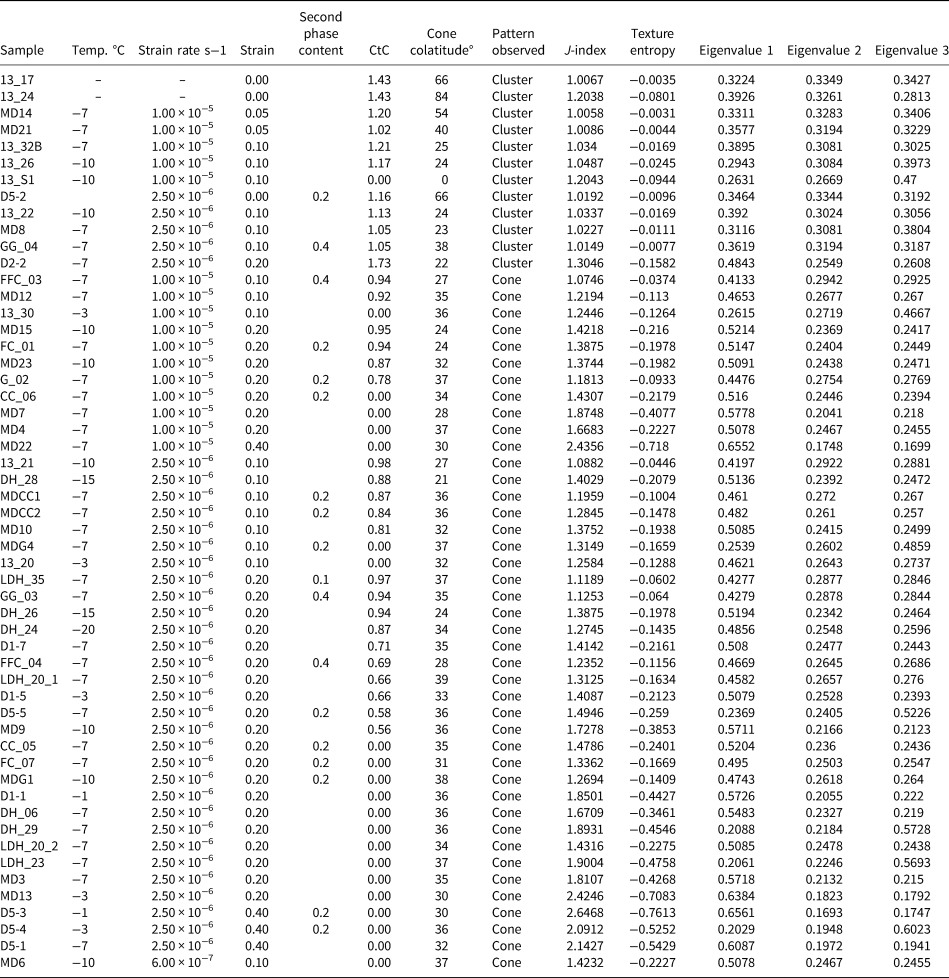
Descriptions for the ‘cluster-to-cone ratio’ (CtC) ratio and ‘cone colatitude’ are provided in the Supplementary material. The J-indices of sample CPOs were calculated using the method of Bunge (Reference Bunge1982). Texture entropy calculations follow the method of Schaeben (Reference Schaeben1988). The eigenvalues of the c-axis orientation data were derived using the method of Scheidegger (Reference Scheidegger1965).
Neutron diffraction measurements were performed in situ with the deformation experiments. The method has been described in detail elsewhere (Wilson and others, Reference Wilson, Peternell, Hunter and Luzin2020). Pole figure data used in this contribution are from diffraction measurements taken at the completion of the deformation experiment. In all experiments, three ice diffraction peaks were measured: (002), (100) and (101). The raw diffraction data patterns were fit with Gaussian peaks to remove background intensity and converted to regular 3° × 3° pole figure mesh grids.
Secondary data analysis
Quantitative analysis of CPO topologies was undertaken using the MTEX toolbox for MATLAB (http://mtex-toolbox.github.io/). MTEX provides a versatile platform for detailed orientation distribution function (ODF) and pole figure analysis, which allows pole figures to be quantitatively analysed with high precision. The three experimental pole figures were used to reconstruct the ODF, using a ‘de Vallee Poussin’ kernel and 5° half width. In this contribution, all pole figures reconstructed from the ODF are equal-area, lower hemisphere projections.
For this study, we used a collection of novel parametric routines to analyse the characteristic topologies of the deformed specimens. These routines are briefly summarised here, and further detail is provided in the Supplementary material. There exist a number of measurements that quantify the degree of preferred orientation in a given sample (hereafter described as the CPO ‘strength’). In this study, we used the J-index (Bunge, Reference Bunge1982), texture entropy (Schaeben, Reference Schaeben1988) and orientation tensor (Scheidegger, Reference Scheidegger1965) (Table 1). Both the J-index and texture entropy functions calculate strength from the ODF, whereas the orientation tensor is calculated from the eigenvalues of individual axes in their spherical form (i.e. azimuth and plunge). Where feasible, we conducted same-temperature and same-strain analyses to understand the effects of either parameter on the texture strength.
We measured the variation in multiples of uniform distribution around the pole figure, using a modification of the ‘intensity spectrum’ routines described by Hunter and others (Reference Hunter, Weinberg, Wilson and Law2018). Here, a line transect is made across the entire pole figure (e.g. E–W) at azimuthal angles between 1 and 180°. This provides a 2-D cross section of the multiples of uniform distribution, which can then be visualised on a Cartesian plot. All transects (n = 180) were subsequently averaged to define the mean intensity distribution across the pole figure hemispheres. For the analysis of prismatic axes, where a great circle parallel to the pole figure margin is the common pattern (Fig. 2b), we also measured the mean intensity spectrum along a transect oriented parallel with the great circle (i.e. about the Z-axis; Fig. 2b).
We computed two topological parameters for features commonly observed in the c-axes of ice CPO patterns. The cone colatitude describes the mean plunge angle of cone girdle maxima within the c-axis pole figure. The cluster-to-cone (CtC) ratio defines the proportional difference in maxima intensity between cluster and cone maxima in the c-axis pole figure. This is calculated by detecting two peaks from the mean intensity spectrum: the cluster from peaks at >80° plunge (P cluster); and the cone from peaks at <80° plunge (P cone). The ratio is subsequently calculated as P cluster/P cone, which thus produces a means of distinguishing cluster-dominant (CtC > 1) and cone-dominant (CtC < 1) CPOs. For cone-dominant samples, we quantified the ‘cone diameter’, the mean angle between the two cone girdle centres; and the ‘girdle width’, the mean angle between the start and end of the girdle peaks.
Results
Changes in c-axis patterns
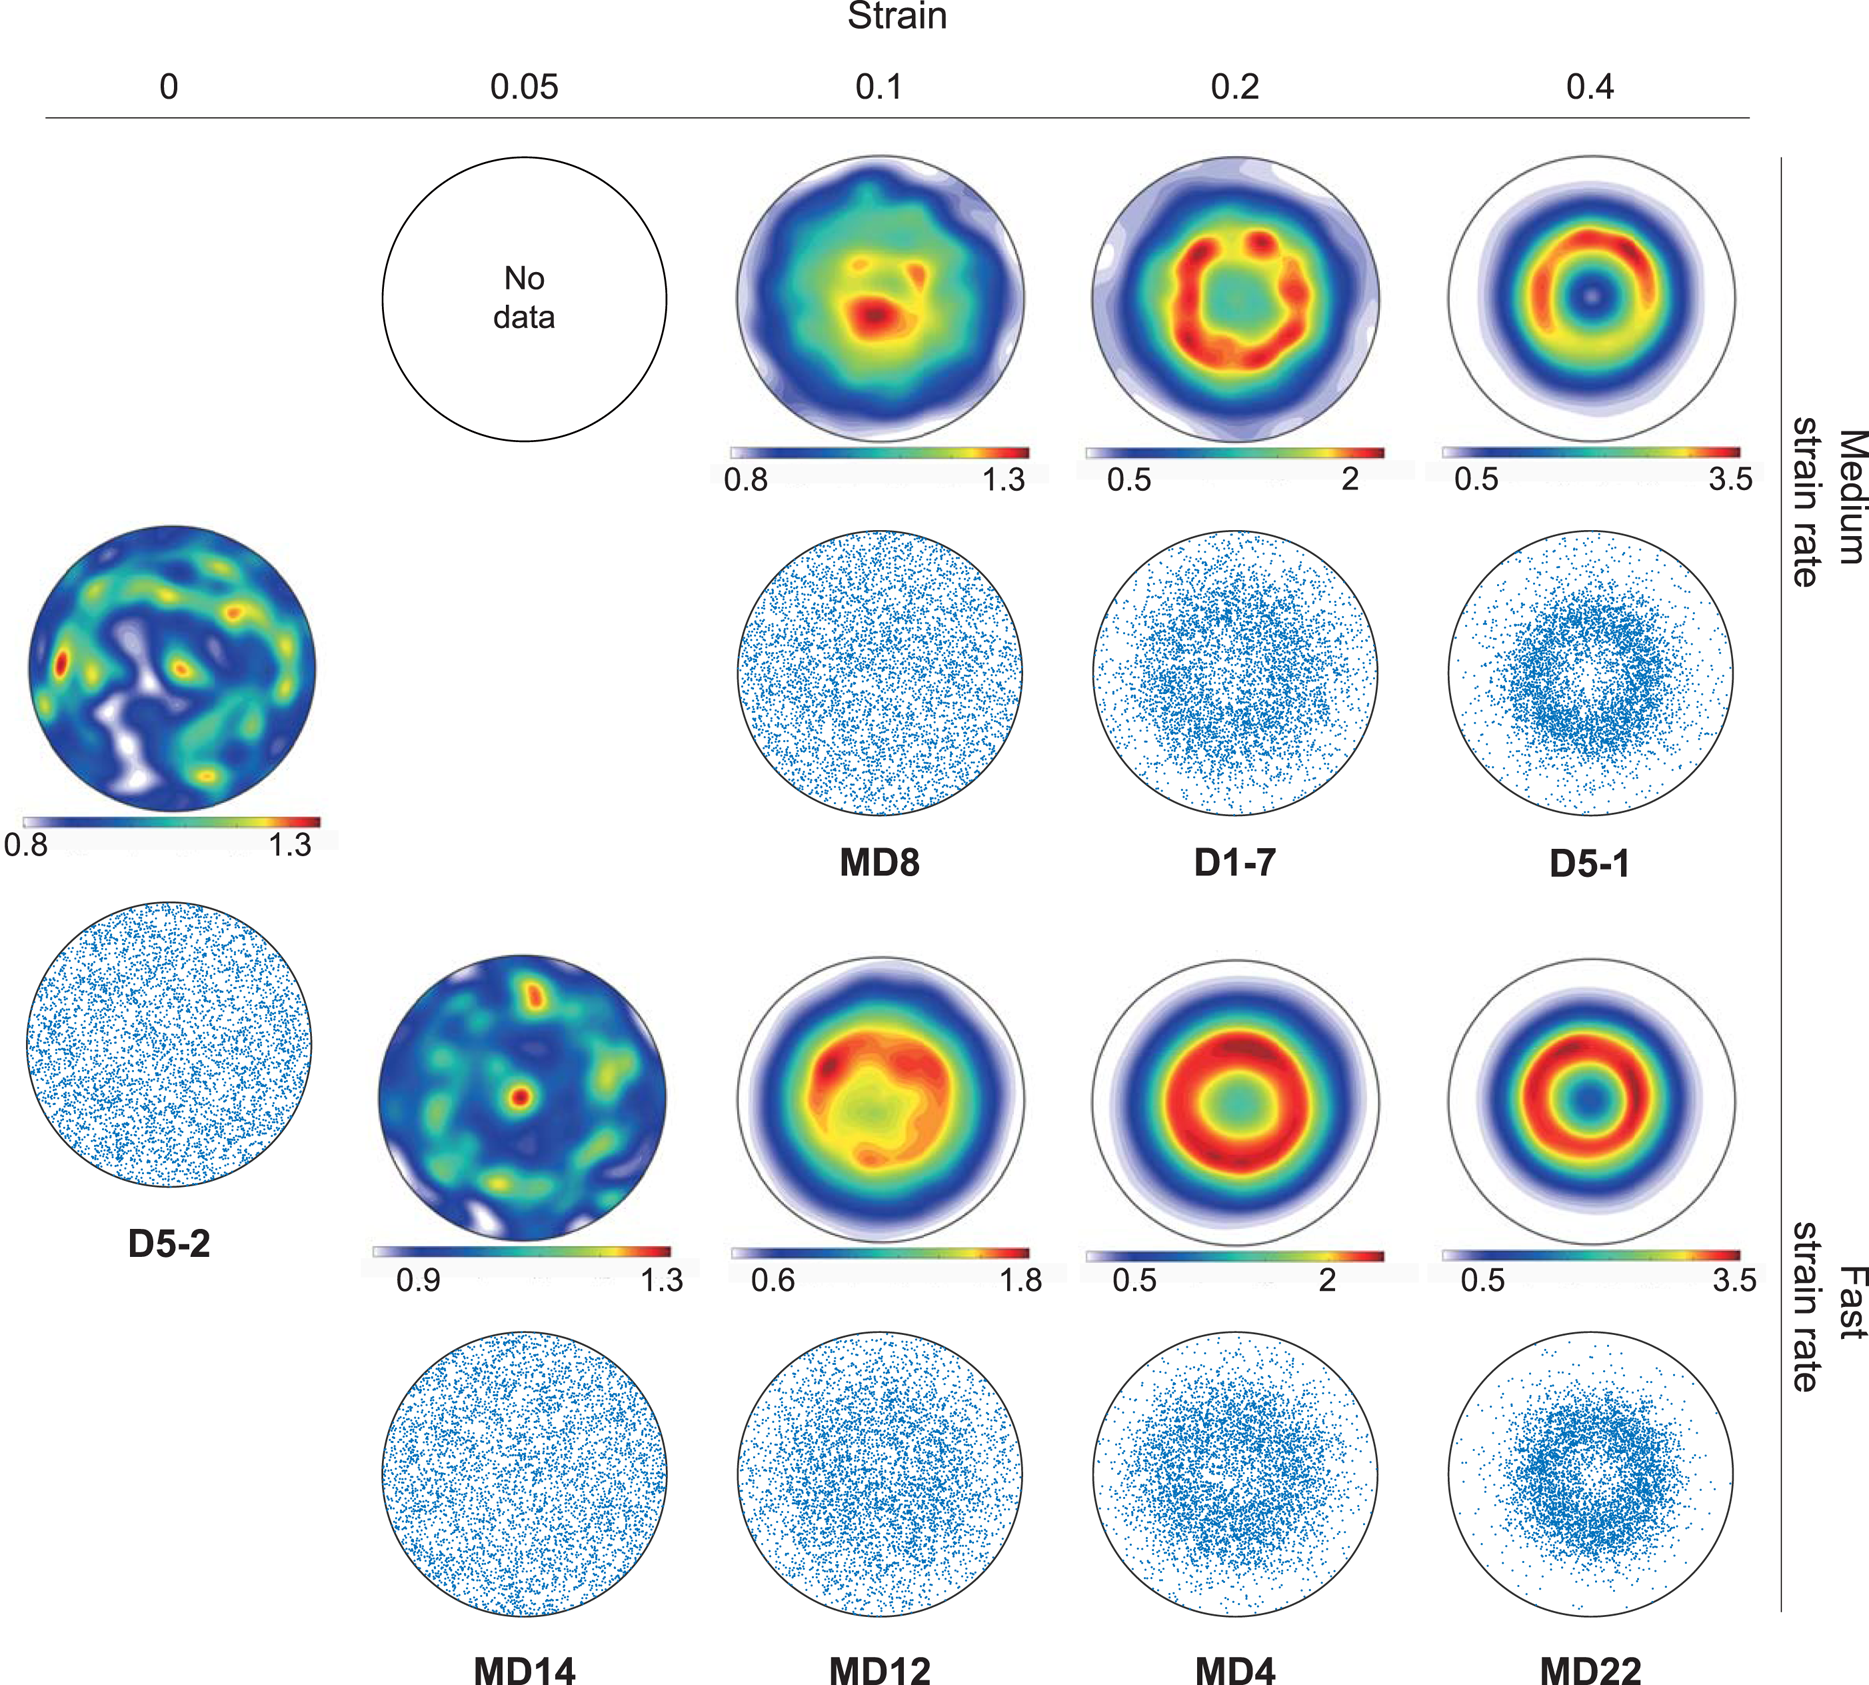
At strains >10%, or temperatures <−10°C, there is a switch in the c-axis pole figure from a shortening-parallel point maximum (cluster) topology to a shortening-parallel small circle (cone) topology (Fig. 3). The transition from cluster to cone in the c-axes is a function of both increasing temperature and strain. As shown in the mean intensity spectra (Fig. 4), with increasing strains and temperatures, the samples transit from a weak but dominant single peak at 90°, or the centre of the pole figure, towards two well-defined peaks at 60° and 120°. These data signify the development of clusters and cones in the c-axis pole figures, respectively. The characteristic patterns are also captured by the CtC ratio (Fig. 4c). The transition from clusters (CtC > 1) to cones (CtC < 1) has a negative relationship with the CPO strength (Fig. 4c). In other words, cluster patterns are weak whereas cones are well-defined.
Characteristic c-axis CPO patterns for various strains and strain rates. The shortening axis is parallel to the pole figure centre. At zero and low strains, a random distribution characterises the sample. With increased strain, the pattern changes from a weak cluster to a well-defined small circle parallel with the shortening axis, or ‘cone’. Point plots were constructed using random orientations (n = 10 000) from the ODF.
(a) Mean intensity spectra of samples along the or E–W (X) plane of the pole figure (refer blue arrow in the inset), categorised as a function of strain. With increasing strain, the samples transition from a weak but dominant single peak at 90° (cluster), towards two well-defined peaks at 60° and 120° (cone). (b) Mean intensity spectra of samples, following the same rationale as in (a) but categorised as a function of temperature. (c) CtC ratio compared with the CPO intensity (J-index).

Based on the CtC ratio, a total of 12 samples were identified as exhibiting a cluster-dominant c-axis pattern. Common physical characteristics of these samples include (1) very low strains (0–10%); and (2) low-to-medium temperatures. No cluster-dominant textures were found in samples deformed at temperatures higher than −10°C. A cluster-dominant texture was found in one sample deformed at 20% strain (D2-2). Only one of the cluster-bearing samples contained second phases (GG_04: 40% graphite). In samples without second phases, there is an increase in the CPO strength with the transition to cone-bearing c-axis CPOs (CtC < 1; Fig. 4c).
Great circles are present in the prismatic (110) and (100) pole figures of all samples, regardless of whether the corresponding c-axis pattern exhibits a cluster or cone. However, the great circles are substantially more defined in cone-bearing samples (Fig. 5a). The lack of variation in intensity around the great circles (i.e. about the sample's Z-axis; inset in Fig. 5b) demonstrates that there are no characteristic anisotropies within the pattern (Fig. 5b).
Characteristic prismatic (110) and (100), or ‘a’ and ‘m’, patterns in ice samples, plotted using mean intensity spectra. The blue arrows in pole figure insets represent the directions from which intensity data were taken. (a) Mean intensity spectra for (110) and (100) collected E–W of the pole figure. In both pole figures, the mean intensity spectra for cone samples (blue lines) exhibit two peaks close 0° and 180°, characteristic of a great circle at the pole figure margin. Mean intensity spectra for cluster sample are flat, due to their weakness of the overall CPO. (b) Mean intensity spectra for (110) and (100) collected around the maximum in each pole figure (about the sample's Z-axis, as defined in Fig. 2b). In most cases, the mean intensity spectrum is flat, indicating no distinct anisotropies.

Changes in CPO strength
To test the effects of different physical parameters on the CPO strength, we filtered the dataset to exclude samples with second phases, as it has been established that these can affect the resulting texture strength and, given the purposes of the current study, may produce ambiguous results (Song and Ree, Reference Song and Ree2007; Herwegh and others, Reference Herwegh, Linckens, Ebert, Berger and Brodhag2011; Hunter and others, Reference Hunter, Hasalová, Weinberg and Wilson2016; Wilson and others, Reference Wilson, Hunter, Luzin, Peternell and Piazolo2019). We also restricted our analyses to samples deformed at fast and medium strain rate experiments, due to the limited number of samples deformed at slow strain rates.
Our results suggest that CPOs may become stronger with increases in either strain, strain rate or temperature (Fig. 6), with strain having the strongest influence on the CPO strength. The slope of the data in Figure 6a suggests that, for every 10% increase in strain the J-index value will increase by 0.3 for medium strain rates, and 0.4 for fast strain rates (Fig. 6c). This demonstrates how faster strain rates also play a role in increasing the CPO strength.
Relationships between CPO intensity (measured by J-index) and changes in (a) strain (temperature: −7°C), and (b) temperature (strain: 20%). (c) Sensitivity of J-index to strain, based on slopes in (a). Two strain rates (fast: blue line; medium: red line) are presented for comparison.

Changes in c-axis cone patterns
Using pure ice samples that qualified as cone-dominant (CtC < 1), we investigated changes in the cone topologies as a function of the various deformation conditions. Specifically, we quantified the ‘cone width’, taken as the mean angle across cone girdle; and the ‘girdle width’, the mean angle between the start and end of the girdle peaks (refer insets in Fig. 7).
Influence of increased strain, strain rate and temperature on (a) girdle width and (b) cone width. Strain data are from experiments at −7°C. Temperature data are from experiments at 20% strain. Refer insets for visual definitions of girdle and cone widths.

In general, both the cone and girdle widths undergo minor decreases as strains increase, but it is less clear how these aspects of the cone are affected by temperature (Fig. 7). A slight decrease in cone width was detected for faster strain rates, from an average angle of 70.8° in medium strain rates to 61.6° in faster strain rates. There is a difference of 4.6° per girdle for a magnitude change in strain rate, as thus the effect is negligible.
Discussion
From cluster to cone
Combining our data, we have found that, under uniaxial compression and with increasing strain, the c-axis CPO typically shifts from a weak cluster to an increasingly sharper cone with narrower width and thinner girdles. This c-axis pattern transition is in reasonable agreement with previous experiments (Qi and others, Reference Qi, Goldsby and Prior2017; Fan and others, Reference Fan2020, Reference Fan2021a) and the decrease in cone width with increasing strain (Fig. 7) is also in agreement with Fan and others (Reference Fan2020).
It is currently accepted that cluster patterns in the c-axes of deformed ice are the result of recrystallisation dominated by lattice rotation, whereas cone patterns are developed when recrystallisation is dominated by grain boundary migration (Alley, Reference Alley1992). The recrystallisation mechanism, in turn, is controlled by the physical conditions. The switch in deformation mechanism from lattice rotation to grain boundary migration recrystallisation, or from cluster to cone in the c-axes of ice, typically occurs due to decreased stress (Qi and others, Reference Qi, Goldsby and Prior2017) or increased temperature (Montagnat and others, Reference Montagnat2015).
The development of a c-axis cluster parallel to the shortening axis at low strains was observed in partial pole figure data in Piazolo and others (Reference Piazolo, Wilson, Luzin, Brouzet and Peternell2013) and Wilson and others (Reference Wilson, Peternell, Hunter and Luzin2020). Recent uniaxial deformation studies have also found that a c-axis cluster may form at low temperatures. For example, Craw and others (Reference Craw, Qi, Prior, Goldsby and Kim2018) observed clusters in several ice samples deformed under uniaxial compression at −30°C, strain rates between 10−5 and 10−6 s−1 and at 20% strain. Fan and others (Reference Fan2020) also observed c-axis clusters in ice deformed at the same temperature and strain rate, but across a wider range of strains (8–20%). Data from our study suggest that this cluster development is also possible at warmer temperatures (>−10°C). However, it should be noted that the strength of these patterns is very weak (Fig. 4c).
The question then arises as to why a cluster pattern typically observed in low-temperature deformations was found in several of our high-temperature uniaxial compression experiments, which has been seldom recognised elsewhere (Kamb, Reference Kamb1972; Budd and Jacka, Reference Budd and Jacka1989; Wilson and others, Reference Wilson, Peternell, Piazolo and Luzin2014). It is possible that lattice rotation played a complementary role in some samples, resulting in the formation of a cluster component. Due to its high-statistical power, neutron diffraction is capable of detecting pole figure components that may not be identified using other methods, such as EBSD (Hunter and others, Reference Hunter, Wilson and Luzin2017a). Given the very low CPO strength of cluster-bearing samples (J-indices: 1–1.3) it is possible that these components have not been previously recognised by other methods. Moreover, the low CPO strength of these cluster-bearing samples implies that they are not as well-developed as they are at lower temperatures (Craw and others, Reference Craw, Qi, Prior, Goldsby and Kim2018; Fan and others, Reference Fan2020). A more detailed investigation into our subset of cluster-bearing c-axis CPOs will form the basis of a future study.
From experiments to nature
We will now place these results in the context of terrestrial ice bodies. A well-developed understanding of changes in ice CPO patterns is important for: (1) interpreting the palaeoconditions from CPO patterns in terrestrial ice; and (2) understanding the rheology of natural ice masses. Furthermore, it is essential to understand the sensitivity of CPO patterns to changes in physical conditions, which provide a window into the critical strains and temperatures involved in terrestrial ice flow.
In this section, we intend to provide an overview of the implications our results have for interpreting CPO patterns, and the deformation implications, in terrestrial ice. Before embarking on this discussion, it is helpful to separate two elements of the CPO: (1) the pattern itself (cluster or cone in the c-axis); and (2) the strength and definition of the pattern. If we are to group these phenomena with respect to their determinants, the pattern observed in the CPO is a function of the deformation regime (e.g. pure or simple shear) and the physical conditions; whereas its strength and definition is only controlled by the physical conditions.
We first discuss the two patterns observed and their implications for interpreting ice flow in nature. We then focus on the definition of the patterns, and the sensitivity of CPOs to changes in physical conditions, with the aim of critically appraising their use as indicators of the natural deformation conditions.
Resolving the ‘cone problem’
The transition from cluster to cone can occur due to both strain and temperature (Figs 4a, b, respectively). This represents a shift in the dominant deformation mechanism from the rotation of basal slip planes to an orientation perpendicular to shortening (dislocation glide), to pervasive consumption of grains with low Schmid factors (migration recrystallisation; grain boundary migration) (Hudleston, Reference Hudleston2015; Qi and others, Reference Qi, Goldsby and Prior2017).
The development of cones under uniaxial compression is consistent with decades of deformation experiments (Jacka and Li, Reference Jacka, Li and Hondoh2000; Wilson and Sim, Reference Wilson and Sim2002; Piazolo and others, Reference Piazolo, Wilson, Luzin, Brouzet and Peternell2013). Despite this, relatively few cones are observed in terrestrial ice cores (Faria and others, Reference Faria, Weikusat and Azuma2014). Moreover, the poor data quality for the low number of cone observations raises the question of whether these c-axis CPOs are in fact groups of clusters (‘multi-maxima’) depicting several flow events (Monz and others, Reference Monz2021). These issues raise questions about the existence of cones in nature.
If we assume that the cones previously observed in ice cores are, in fact, groups of clusters then this introduces further uncertainties when trying to understand flow behaviour. Clusters are the commonly observed pattern in ice samples deformed experimentally under simple shear (Qi and others, Reference Qi2019), so a tempting interpretation is that cluster-bearing ice cores may reflect widespread simple shear conditions. However, our data show that a cluster-based c-axis CPO may also form under pure shear settings, as observed in other uniaxial compression experiments (Craw and others, Reference Craw, Qi, Prior, Goldsby and Kim2018; Fan and others, Reference Fan2020). Moreover, the data here adds further ambiguity by demonstrating that cluster-bearing c-axis patterns in ice deformed under pure shear are not restricted to cold temperatures (<−20°C) as previously shown (Fan and others, Reference Fan2020); this pattern may also form, albeit weakly, in under warmer temperatures (>−10°C). There is, thus, an even wider range of deformation conditions under which this pattern may emerge, and it is possible that we are still far from understanding the full spectrum.
In many cases, the CPO of ice cores is determined through seismic reflection methods (Vélez and others, Reference Vélez, Tsoflias, Black, Van der Veen and Anandakrishnan2016; Vaughan and others, Reference Vaughan2017; Lutz and others, Reference Lutz2020) and only the c-axis can be quantified. If we are to properly understand the flow behaviour of natural ice masses, namely the deformation regime, an additional pole figure should be inspected.
Our experimental data suggest that, when viewed in two dimensions parallel to the pole figure margin, there is a common great circle topology in the prismatic a- and m-axes (Fig. 5). Prismatic axes in simple sheared ice, by contrast, exhibit strongly anisotropic patterns, developing strong maxima that bear a relationship with the shear direction (Fig. 1b) (Journaux and others, Reference Journaux2019; Qi and others, Reference Qi2019; Monz and others, Reference Monz2021). These differences in the prismatic pole figures highlight a potential for better distinguishing the deformation regime when a cluster-based pattern is observed in the c-axis pole figure of natural ice specimens.
Another possibility for differentiating between pure and simple shear conditions is to apply the ‘crystal vorticity axis’ (CVA) method of (Michels and others, Reference Michels, Kruckenberg, Davis and Tikoff2015). Under this method, vorticity is determined by isolating the crystallographic orientations inside individual grains and measuring their rotational distribution to calculate a dispersion axis. When measured across multiple grains in the sample the average dispersion axis, or vorticity axis, can then be used to determine pure and simple shear components. The CVA method has recently been applied to grains in an ice core from Priestley Glacier and, combined with CPO data, were used to resolve the deformation geometry (Thomas and others, Reference Thomas2021).
It is also notable that, under simple shear conditions, the cluster pattern developed in the c-axis pole figure takes a more elliptical form compared to the more circular patterns developed under pure shear (Fig. 1). Where shear strains are lower a second maximum at a low angle to the shear plane may also be present (Journaux and others, Reference Journaux2019; Qi and others, Reference Qi2019). While these subtle differences may not be distinguishable in the c-axis CPO of ice cores, it is nonetheless an observation that may aid the interpretation of data.
Effectiveness of CPO strength as a strain indicator
As with other plastically deforming minerals, such as olivine and quartz, our ability to diagnose deformation events from their naturally developed CPOs is still limited. CPO development is controlled by a combination of physical or ‘extrinsic’ factors (strain, strain rate, temperature) and ‘intrinsic’ factors (e.g. pinning from second phases) (Hunter and others, Reference Hunter, Weinberg, Wilson, Luzin and Misra2019). A common belief, though not confirmed unequivocally, is that there is a relationship between strain and CPO strength. Indeed, this relationship has been observed in previous ice experiments (Kamb, Reference Kamb1972; Wilson, Reference Wilson1982; Journaux and others, Reference Journaux2019). In the high-temperature and stress ice experiments presented by Fan and others (Reference Fan2021a), CPO evolution is able to account for all the observed weakening and not grain size evolution.
It is therefore tempting to perceive CPOs as a reliable indication of strain, which could potentially be applied to ice and other geological materials. Recent studies on crustal rocks (Larson and others, Reference Larson, Cottle, Lederer and Rai2017; Larson, Reference Larson2018; Starnes and others, Reference Starnes, Long, Gordon, Zhang and Soignard2020) have suggested that the strength of CPO patterns could be used as a strain proxy for resolving shear zone discontinuities in mountain belts. Experimental studies, where physical parameters can be controlled, are useful for corroborating these claims.
In the analysis of the experiments presented here, it is demonstrated that the increasing CPO strength, smaller cone diameters and narrower girdles are mostly due to the strain conditions across the experiments, which conforms with previous studies (Hudleston, Reference Hudleston, Saxena and Bhattacharji1977; Montagnat and others, Reference Montagnat2012). However, our data suggest that temperature and strain rate also influence the strength of the CPO pattern. In Figure 6c, for example, it is shown that J-index values, a measurement of CPO strength, are higher for samples deformed at faster strain rates. The influence of strain rate on CPO strength in deuterated ice was also observed in previous studies (Piazolo and others, Reference Piazolo, Wilson, Luzin, Brouzet and Peternell2013; Wilson and others, Reference Wilson, Hunter, Luzin, Peternell and Piazolo2019). Across our analyses, we are unable to find a topological change in the CPO that is exclusively sensitive to strain variations. Another parameter not considered in this study is the role of stress on the CPO strength. There is evidence that stress governs the activity of strain-induced grain boundary migration, which in turn strongly affects CPO development (Fan and others, Reference Fan2021a). The role of stress in CPO development is relevant to all geological materials and should be the basis of future studies.
While strain clearly has the strongest influence on the CPO strength, we cannot rule out the influences of temperature, strain rate and possibly stress. This underlines the ambiguities when attempting to use CPOs for deciphering deformation conditions. As a result, certain caution must be taken when using the strength of CPOs as a strain approximation in naturally deformed ice and other geological materials.
Conclusions
We analysed data from coupled in situ D2O ice deformation and texture diffraction experiments collected between 2010 and 2019 to investigate the physical conditions that lead to changes in CPO patterns. Cluster patterns in the c-axis are typically observed at warmer temperatures (⩾−10°C) and lower strains (⩽20%). These CPOs, albeit low in strength, suggest that a small component of lattice rotation may be active, but this should be confirmed with further microstructural analyses (e.g. EBSD).
Our data complement previous ice studies, which together implies that cluster patterns can be observed in the c-axes of ice deformed under both pure and simple shear settings. That the same pattern can be developed in either deformation setting suggests that there may be ambiguities when interpreting flow behaviour from c-axis CPO patterns in ice cores. However, we observed that prismatic axis (a and m) pole figures share a common pattern under pure shear, characterised by a girdle parallel to the pole figure margin with no clear anisotropies. This contrasts with the highly anisotropic a- and m-axis patterns in ice deformed under simple shear conditions, and thus the prismatic axes may be more useful for deciphering between the two deformation regimes.
With increasing strain (⩾20%) and temperature (>−10°C) the c-axis patterns change from a cluster to cone pattern. At higher strains (40%) and faster strain rates (1 × 10⁻⁵) the c-axis cone diameters are smaller and the cone girdles are narrower. While strain clearly has the strongest influence on a given sample's degree of preferred orientation, or ‘strength’, we cannot rule out the influences of temperature, strain rate and possibly stress. This suggests that the CPO strength is governed by a complex array of determinants, and limits the extent to which CPO strength can be used to estimate the deformation conditions in ice and possibly other geological materials.
Supplementary material
The supplementary material for this article can be found at https://doi.org/10.1017/jog.2022.95.
Acknowledgements
This research was undertaken at the Centre for Neutron Scattering at the Australian Nuclear Science and Technology Organisation (ANSTO), Sydney, Australia. Sandra Piazolo and Mark Peternell are thanked for their contributions during our initial set of experiments and interpretation of results. We thank Dr Chris Voisey for stimulating discussion on the results. We also thank Sheng Fan and Nicholas Rathmann for their constructive reviews of the original manuscript, which allowed us to considerably strengthen the contribution. Data for this paper come from projects 1702, 2178, 2910 and 6396 with technical support from ANSTO staff gratefully acknowledged. Chris Wilson was also supported by Australian Antarctic Science Grant 4581.


 Open access

